Preprint
Article

Assessing the Vulnerability and Adaptation Needs of Mozambique’s Health Sector to Climate Change: A Comprehensive Study

Altmetrics

Downloads

267

Views

188

Comments

0

A peer-reviewed article of this preprint also exists.

Submitted:

30 May 2023

Posted:

02 June 2023

You are already at the latest version

Alerts
Abstract
Climate change (CC) poses severe consequences, particularly in sub-Saharan Africa, where poverty rates may escalate by 2050 without significant climate and development action. The health impacts are diverse, encompassing communicable and non-communicable diseases. Mozambique, a climate-vulnerable nation, has experienced significant natural disasters in the past 42 years, impacting its health system. This study aims to assess Mozambique’s health sector vulnerability and adaptation needs to climate change. Following a methodology proposed by the World Health Organization and Intergovernmental Panel for Climate Change, a six-step vulnerability and adaptation assessment was conducted. The Health Vulnerability Index (HVI), integrating historical climate, epidemiological, and socio-economic data at the district level (n=162), was computed using exposure, sensitivity, and adaptive capacity dimensions. The Results revealed spatial patterns in exposure to climate variables, extreme weather events, and variations in sensitivity and adaptive capacity across the country. The HVI mirrored the exposure findings. Notably, high vulnerability was observed in several districts, while major urban centers displayed lower vulnerability. These findings highlight the country’s vulnerability to climate change and underscore the potential for adverse impacts on livelihoods, the economy, and human health. The study provides a foundation for developing strategies and adaptation actions.
Keywords: 
Subject: Public Health and Healthcare  -   Public Health and Health Services

1. Introduction

There is a growing body of evidence that Earth is warming at an unprecedented rate as a result of anthropogenic activities, such as deforestation, urbanization, population growth, industrialization and the release of greenhouse gases [1]. The Intergovernmental Panel on Climate Change (IPCC) predicts an increase of 1.5–5.8 C in global average temperature by 2100 as a result of greenhouse emissions [2]. Despite the fact that the wealthiest countries are disproportionately responsible for more emissions than developing countries, the consequences of climate change are more severe in the poorest countries, particularly in sub-Saharan Africa. In fact, developing countries have the least adaptive capacity justified by limited access to climate information, financial, human, natural resources, and armed conflicts [3]. As a consequence of climate change, it is estimated that more than 30 million people in sub-Saharan Africa will fall into poverty if no substantial climate and development action is taken by 2050 [4]. Furthermore, it is expected that the gross domestic product to decrease by 3%, a scenario that poses a significant challenge to climate adaptation and resilience efforts, as it will lead to an increase in the number of people affected [5].
The effects of CC on disease prevalence and human health are multifaceted. Studies show that CC is behind the unprecedented increase in a myriad of non-communicable and communicable diseases, such as vector and waterborne diseases, respiratory, and cardiovascular diseases [6,7]. For instance, rainfall affects water-borne diseases, and a large number of diarrhea pathogens are water-borne and will therefore be affected by CC through water availability and temperature. Moreover, CC can potentially trigger heat waves, floods, droughts, and storms, leading to high fatalities and injuries and altering disease scenarios [8]. Additionally, these events have other negative health consequences, such as depriving the health facilities of water, sanitation systems and electricity (thus interrupting the cold chain of vaccines, reagents and some drugs), blocking access routes to health facilities, destroying warehouses and stores of sanitary consumables, causing delays and absences in health personnel, etc.
Mozambique is considered to be at a high risk of being influenced by climate change due to its geographical position, along the coastline and downstream of main rivers in southern Africa. As a matter of fact, among the most vulnerable countries to natural disasters, the country ranks third [9]. In the last 42 years, the country has registered 15 droughts, 20 floods and 26 tropical cyclones [10]. In March 2019, the country was hit by the deadliest tropical cyclone to ever hit Africa (cyclone Idai), ranked as the second-deadliest on record [11,12]. The tropical cyclone caused significant flooding in Madagascar, Mozambique, Malawi, and Zimbabwe, killing more than 1500 people. In Mozambique, the cyclone affected mainly the provinces of Inhambane, Manica, Sofala and Zambézia, leading to 1.85 million people in need of humanitarian assistance and protection [13]. In The province of Sofala, which was the most affected, the cyclone prompted a cholera outbreak, with more than two thousand cholera cases [13]. Subsequently, in less than two months, the country was again struck by another intense tropical cyclone, named Cyclone Kenneth. Tropical cyclone Kenneth affected the northern provinces of the country, Cabo Delgado and Nampula, displacing more than 18 thousand people and causing 45 deaths [14,15].
Amid increased vulnerability, it is worth stressing that the impact of CC can be mitigated through preparedness, adaptation and strengthening of the health system. Therefore, this calls for the creation of policies that will strengthen the health system and other social sectors. Nevertheless, the creation of conducive policies is somehow dependent on the vulnerability and adaptation assessment of the health sector. With these grounds, the present study aims at assessing the vulnerability and adaptation needs of the health sector to climate change in Mozambique. To the best of our knowledge, this is the first study in Mozambique, as for the first time an assessment of the vulnerability of the health sector to climate change on a national scale is carried out in the country.

2. Materials and Methods

2.1. Study area and climate

Mozambique is situated on the southeastern coast of the African continent between the latitudes 10 27 S and 26 57 S and longitudes 30 12 E and 40 51 E (see Figure 1), along the inter-tropic convergence zone, is responsible for Southern Africa’s rainfall patterns. To the north, the country is bordered by Tanzania, and to the west are Malawi, Zambia, Zimbabwe, South Africa and Eswatini. The country covers an area of 801 , 590 km 2 of which 13,000 km 2 is water. The country is comprised of ten agroecological zones distributed throughout the 11 provinces of the countries [16]. Furthermore, the country has about 2 , 470 kilometers of coastline along the Mozambique Channel and the Indian Ocean, spanning 10 of its provinces. The geographic location of Mozambique along the coast in the Indian Ocean makes the country vulnerable to tropical cyclones, floods and droughts [17,18].
The climatic conditions in Mozambique vary from tropical to subtropical. The country has two seasons, a cool and dry season — which starts from May to September—, and a hot-humid season, between October and April. Precipitation is more abundant in the Center and Northern regions of the country, with values ranging from 800 to 1200 mm per year. The southern region of the country is generally drier inland than on the coast, where annual rainfall reaches around 800 mm and decreases to about 300 mm. The average air temperatures, in general, vary between 25 C and 27 C in the summer and 20 C and 23 C in the winter [19]. Furthermore, following the climatic classification of Köppen Geiger, it is possible to find four predominant climatic regimes: tropical rain savannah, dry savannah, dry desert climate and humid temperate climate. The tropical rain savanna climate occurs mainly in the northern and coastal regions of the country. In contrast, the dry savannah climate occurs in the inland parts of the central and southern sedimentary terrains. The dry desert climate is not so abundant, occurring in a small area around the Limpopo River in the province of Gaza. The humid temperate climate can be found in the upland areas of Gurué, Manica, Angónia and Lichinga [19,20].

2.2. Study design

The vulnerability and adaptation assessment (VAA) study was conducted following a methodology proposed by the World Health Organization [21], which is in line with the IPCC’s fourth assessment report. As recommended by the IPCC and the vulnerability sourcebook, in this VAA, we considered an integrated approach, that is, this VA took into account the climate-sensitive health aspects, social, economic and environmental aspects of vulnerability [22]. In accordance with WHO [21], Fritzsche et al. [22] recommendations, the VAA was carried out following six steps: 1) define the scope of the VAA — at this stage, we specified the objectives of the VAA, the geographic area (for this assessment, we decided to work at district level for the whole country ), review of relevant policies, stakeholder engagement for disease/health priorities (this involved a form of workshops, drawing experts from different organizations, including public health disease surveillance, epidemiologist, climatologist, etc.); 2) Identification and selection of indicators — this included defining the necessary data to be collected as well as mapping the existing data sources; 3) Obtaining data —this phase consisted in gathering all relevant data for the VAA (climatological, socio-demographic, health and economic data ), data cleaning and formatting; 4) vulnerability analysis— at this stage we defined and quantified the HVI, which was first preceded by normalization of all the indicators; 5) results validation — the results validation process was done by discussing the computed HVI with Ministry of Health, different stakeholders and experts; and the sixth step involved the dissemination of the results. Additionally, we compared the HVI computed using the approach defined herein to that computed using principal component analysis. The VAA terminated with a final report that included recommendations for health sector adaptation and climate change monitoring and technical presentation to stakeholders. It is essential to mention that the VAA report also included a case study on the situation of two emerging climate-sensitive diseases (dengue and chikungunya) in Mozambique and an assessment of the impact of climate change on Malaria, watery diarrhea, and cholera. Nevertheless, for the current paper, we focused on the analysis of the HVI.

2.3. Data source

2.3.1. Climate data

To evaluate the contribution of climate variables in the HVI, historical monthly data on temperature, rainfall and relative humidity from 1970 to 2016 were used. Historical monthly data was used to compute the average annual variation. The data were obtained from the National Institute of Meteorology (INAM), which provides data collected from weather stations. Additionally, due to the poor geographic coverage of national weather stations, the data from INAM was complemented by data obtained from satellites. Data on temperature were extracted from publicly available National Oceanic and Atmospheric Administration (NOAA) at a spatial resolution of 0.5, available at https://www.esrl.noaa.gov/psd/. Monthly rainfall data was obtained from Multi-Source Weighted-Ensemble Precipitation (MSWEP) version 2.1 ( http://www.gloh2o.org/), which is based on ground interpolation data obtained from ERA5. Similarly, data on relative humidity, with a spatial resolution of 0.25, was obtained from ERA5, available at European Centre for Medium-Range Weather Forecasts. To compute the annual changes, the monthly climate data were averaged over a year.
Data on extreme event data, such as floods, cyclones, and droughts were extracted from DesInventar, available at http://www.desinventar.net. DesInventar is a methodological tool for generating National Disaster Inventories and constructing databases of damage, losses and in general the causes and impacts of disasters. The tool provides data on losses caused by disasters associated with natural hazards. Further details on the DesInventar can be found elsewhere [23]. From this tool, we were able to extract data on disasters from 1979 to 2012. The current study considered data from 1980 to 2019. To fill the gap between data from 2012 and 2019, data from administrative sources were also considered.

2.3.2. Epidemiological data

To compute HVI, we also collected epidemiological data on annual cases of malaria, diarrhea, tuberculosis, HIV, and chronic and acute malnutrition. The data comprised a period of 2017 and 2018. These data were obtained from the National Department of Public Health in the Ministry of Health.

2.3.3. Socio-economic data

For the current study, we also considered socio-economic data, which were collected from various sources, National Institute of Statistics (INE), the Ministry of Health (MISAU) and the Technical Secretariat for Food Security and Nutrition (SETSAN). From INE we extracted demography data, literacy rate, per capita expenditure and the rate of accessibility to water, sanitation and hygiene (WASH). The MISAU provided data on the number of health workers and public health sector per capita expenditure, whereas the SETSAN provided data on food security. The list of all indicators used to conduct the vulnerability and adaptation assessment is provided in Table 1.

2.4. Data analysis

Prior to the computation of the HVI, all the indicators were normalized. Normalization was applied to allow comparability of the HVI across the districts and to remove the effect of scale on the computation of the HVI. The normalization was done using the following mathematical equation:
Y i = X i X max X max X min ,
where X i represents the value for a given indicator for the i t h district, and X min and X max represent the minimum and maximum values of the indicator, respectively. Note that the normalization through equation (1) ensures that the values are bounded between 0 and 1.

2.4.1. Vulnerability assessment model

Vulnerability is a cross-cutting multidisciplinary research theme. As a result, it can be perceived differently depending on the field to which it is applied. For instance, Adger et al. [24] define vulnerability to climate change as the propensity of human and ecological systems to suffer harm and their ability to respond to stresses imposed by climate change effects. Schröter et al. [25] refer to vulnerability to climate change as the likelihood that a specific coupled human-environment system will suffer harm as a result of exposure to stresses associated with societal and environmental changes, taking into account the adaptation process. Rao et al. [26], who look into vulnerability in the context of agriculture, define vulnerability as the propensity of an organism to experience climate shocks and suffer loss in production and/or income from agriculture. In this paper, we rely on the definition of the Intergovernmental Panel on Climate Change, which is defined as “the extent to which a system is susceptible to or unable of dealing with the effects of climate change, including extreme weather events" [27]. Thus, following this definition, vulnerability can be seen as a function of three dimensions, namely, exposure, sensitivity and adaptive capacity. Exposure refers to the extent of climate stress on a particular unit of analysis, while sensitivity can be understood as the extent to which climate-related stimuli have an effect on a system, either favorably or unfavorably [28]. The sensitivity is determined by both socio-economic and ecological factors and measures the extent to which a particular group will be affected by environmental stress [29]. The adaptive capacity, as defined by the IPCC, can be understood as the ability of a system to respond to the effects of climate change.
To assess the vulnerability, we considered the framework recommended by the IPCC and WHO, whereby the indicators collected for the assessment can be classified into three dimensions, namely, exposure, sensitivity, and adaptive capacity, allowing each dimension to contribute to the computation of the HVI [21]. The indicator method is well documented in the literature [30,31,32]. This approach is highly recommended among scholars as it allows one to compute the vulnerability index for the following reasons: the vulnerability index can be computed at any scale — household, district, province and national level; allows one to monitor the trend over time; the approach is multi-dimensional, which means it can capture multiple dimensions of vulnerability; and the approach is appropriate for identifying most vulnerable places [33,34]. Following Shah et al. [35] and Luh et al. [34], the HVI, at the district level, was defined as follows:
HVI = ( E A C ) × S ,
where E represents the exposure index, S the sensitivity index and A C the adaptive capacity index. The exposure index was defined using the weighted sum method, also known as additive or direct summation approach [36,37]. This approach builds as follows:
E j = i = 1 N w i Y i , j ,
where Y i , j denotes the normalized indicator at district j and w j is the weight assigned to Y i , such that i = 1 N w i = 1 , and N represents the total number of indicators. For the exposure component, N is taken to be four. For the purpose of this study, we consider equal weights for all the normalized indicators, which corresponds to the arithmetic mean. Similarly, the sensitivity index was computed as an average score from a set of 12 indicators (the indicators used for deriving the sensitivity index are listed in Table 1). The derivation of the adaptive capacity index considered a set of 16 indicators, which are also presented in Table 1. Likewise the exposure index and sensitivity index, the adaptive capacity was computed as an average score, where all the indicators were assigned the same weight. After deriving all three sub-indices (exposure index, sensitivity index, and adaptive capacity index), the HVI was calculated for a total of 162 districts using the equation (1). The HVI, including the sub-indices, were then classified into quintiles, creating five categories of classification.
It is important to mention that some indicators, such as per capita expenditure, lacked information at the district level. Thus, to derive the HVI for such districts, information at the provincial level was used by assigning the same information to the districts in the same province. In cases where the district lacked information for a particular indicator, a value corresponding to the arithmetic mean of the observed values for the other districts of the same province was imputed. All the analyses herein, we performed using the R software for statistical computing and graphics, version 4.0.3 [38].
Table 1. List of indicators used to compute the exposure, sensitivity, and adaptive capacity index.
Vulnerability determinant Components Indicators Data source
Average temperature variation (1970-2016) NOAA
Exposure Changes on precipitation, temperature and relative humidity Average rainfall variation (1970-2016) Multi-Source Weighted-Ensemble Precipitation (MSWEP) version 2.1
Average variation in the relative humidity (1970-2016) ECMWF (European Center for Medium Weather Forecast) - Climate Data Store
Extreme events Historical data on the frequency of floods, droughts and cyclones (1979-2019) DesInventar data [23] .
Sensitivity Natural capital (Ecosystem / Geography - Risks) Frequency of cholera outbreaks
Frequency of food insecurity episodes Ministry of health
Natural capital (Demography and vulnerable population) Population density
Percent of children under five in the district
Percent of children aged 5-15 years in the district Census data [39]
Percent of women in the district
percent of elderly people (over 60 years old) in the total population in the district
Vulnerable population due to health conditions HIV positivity rate
Rate of reported cases of tuberculosis
Average number of cases of acute and chronic malnutrition reported between 2017 and 2018 per 100 000 inhabitants Ministry of Health (National Division of public health)
Average number of cases of malaria reported between 2017 and 2018 per 100 inhabitants
Average number of reported cases of diarrheal diseases between 2017 and 2018 per 100 000 inhabitants
Adaptive capacity Financial resources Per capita public sector health expenditure Ministry of Health (division of administration and finance)
Health services Ratio of the total number of inhabitants to the total number of health units in the district
Percentage of population living within the coverage radius of a health facility
Census data[39] and SARA report [40]
Human resources Ratio of medical workers per 100,000 inhabitants
Ratio of nursing workers per 100,000 inhabitants
Ratio of workers in the midwifery area per 100,000 inhabitants
Number of inhabitants per health elementary multipurpose agents (APE)
Ministry of Health (division of human resource)
Ministry of Health (a division of public health) and census data [39]
Water and sanitation percentage of population with access to safe water sources
Percentage of population with access to safe latrines
Census data [39]
Social capital (Social determinants of health) Percentage of literate population, men
Percentage of population with primary education, men
Percentage of population with secondary education, men
Percentage of literate population, women
Percentage of population with primary education, women
Percentage of population with secondary education, women
Per capita expenditure
Census data [39]


National household budget survey report [41]

3. Results

3.1. Exposure

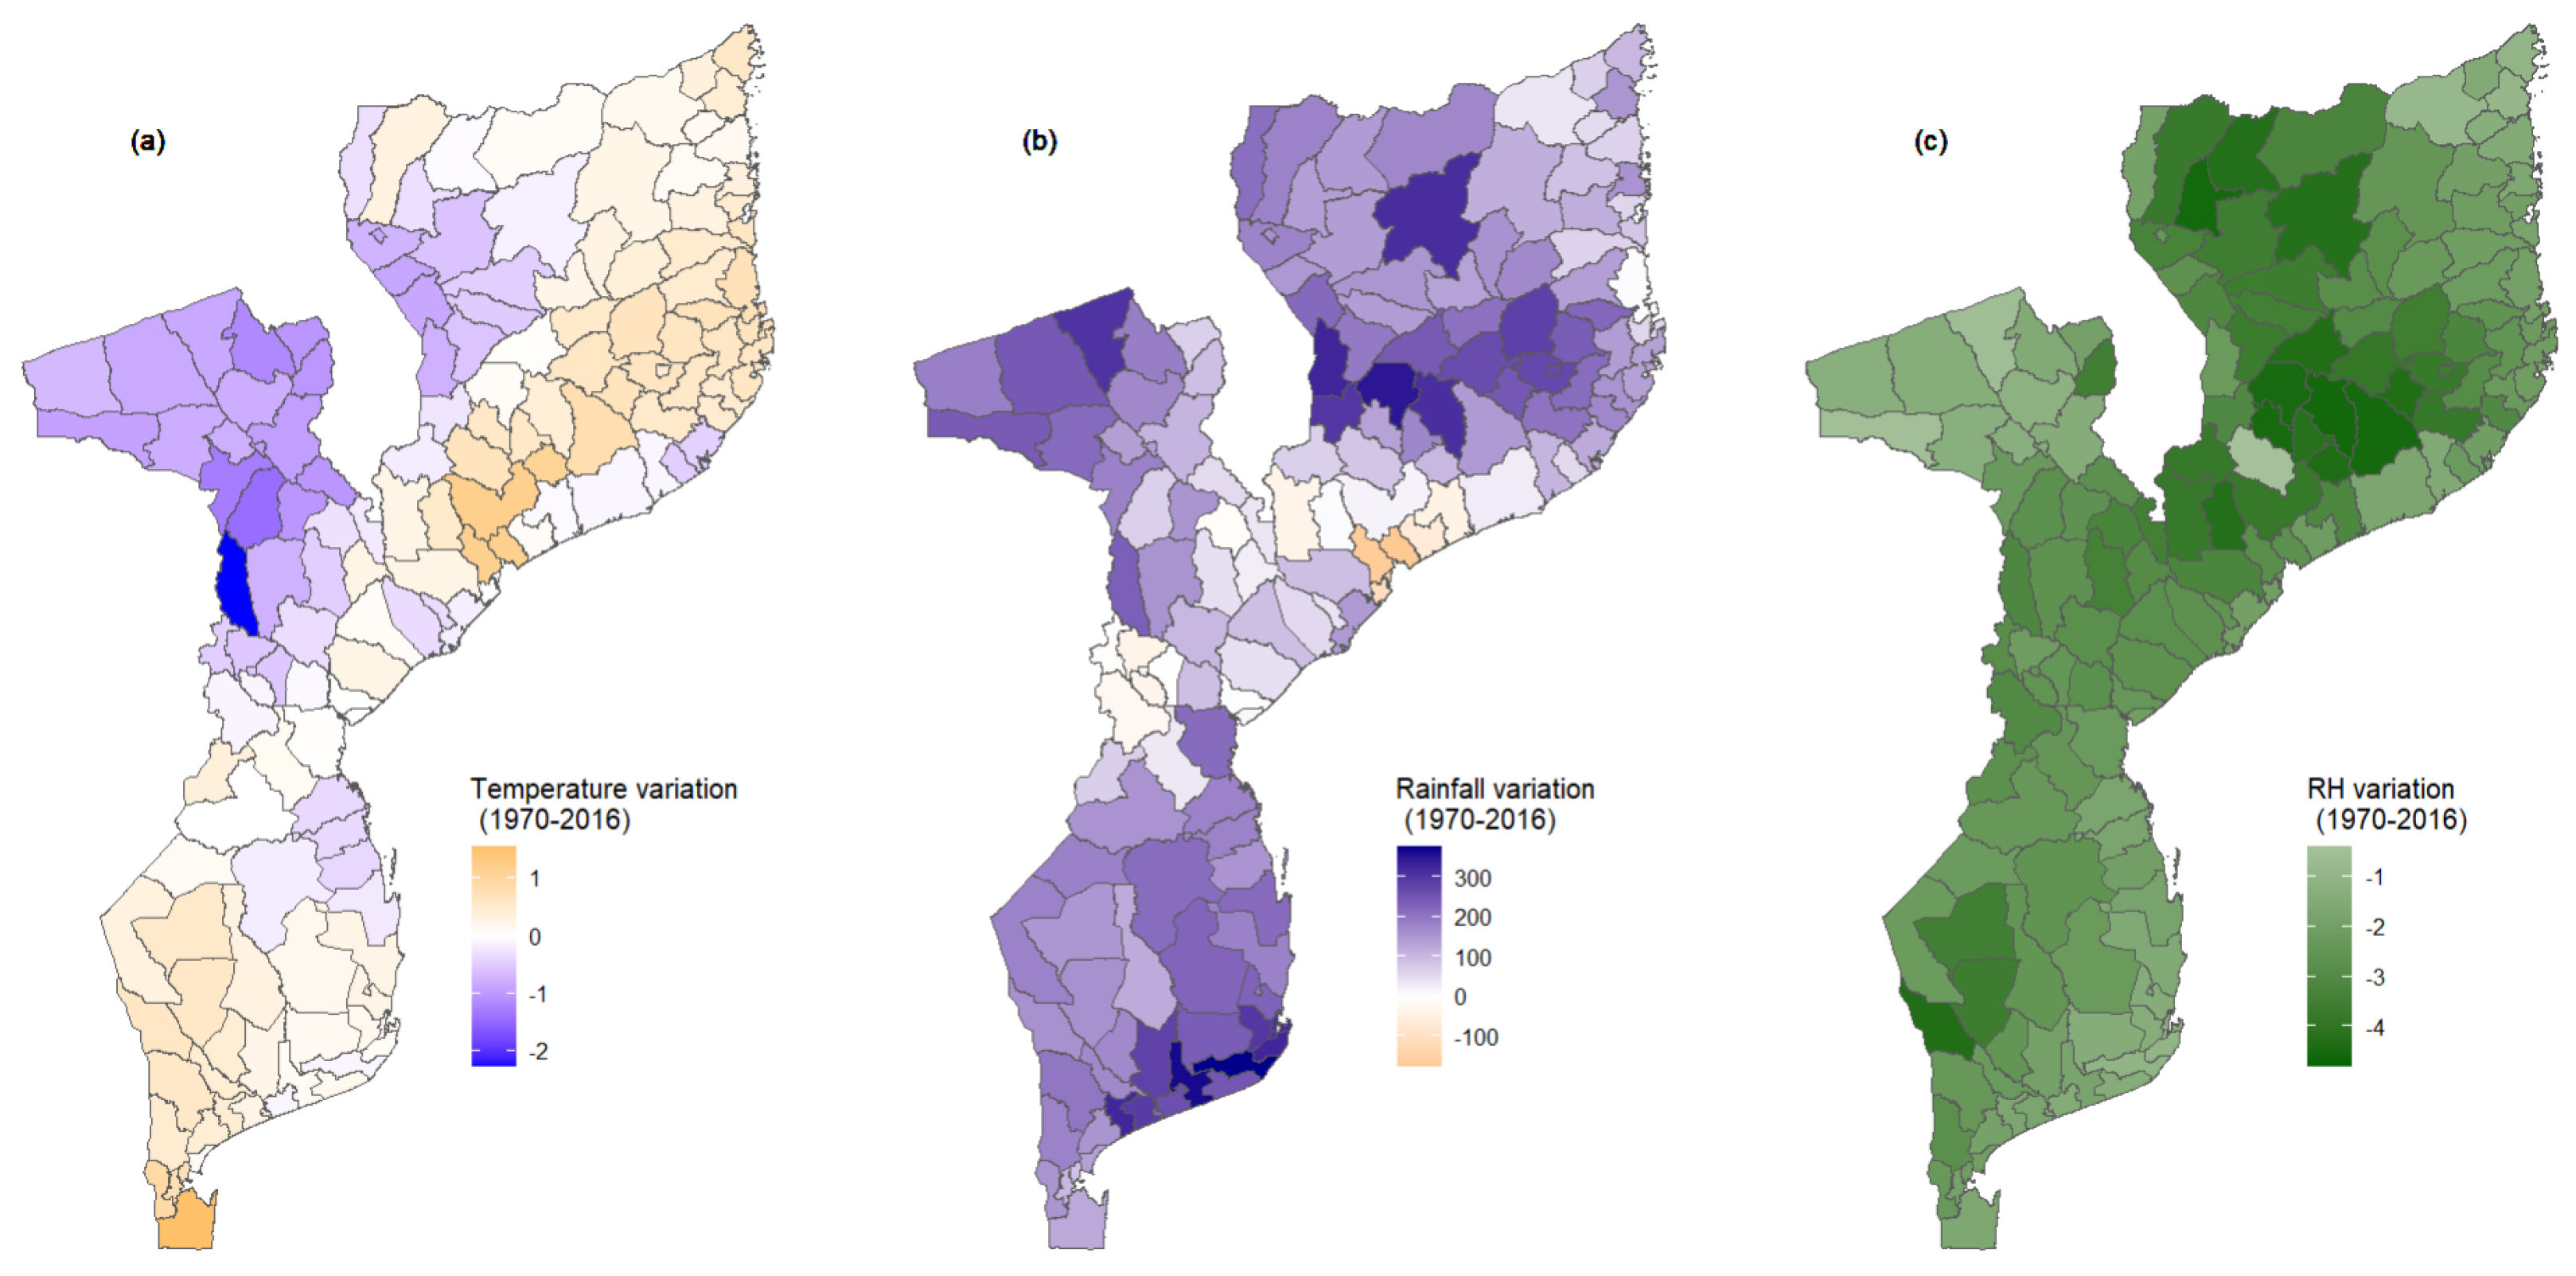
Exposure scores were calculated considering information on climate variation (temperature, rainfall, and relative humidity) and extreme events. Figure 2 shows the geographic distribution of average temperature variation, rainfall variation, and relative humidity variation. The map on average temperature variation highlights two differentiated regions, one with negative variation (suggesting a decrease in the temperature) and another with a positive variation (indicating an increase in the temperature). From the map, it is possible to observe that the heating is more evident in the southern part of the country (Maputo and Gaza province) and in the coastal provinces of the country (Inhambane, Sofala, Zambézia and Cabo Delgado). Additionally, we observe that more inland districts present a reduction in the temperature, as is the case of all the districts of Tete province and the majority of districts of Niassa and Manica province. It is worth noting that districts in the coastal area of Inhambane, Sofala and Zambézia also experience a reduction in the temperature.
With regard to the average rainfall variation, as illustrated in Figure 2 (b), it can be observed that the vast majority of the districts, from 1979 to 2016, experienced an increase in the amount of rainfall. Furthermore, it is observed that the increase in the amount of rainfall is substantial in some districts located on the coast of Inhambane and Gaza province (Inhambane, Maxixe, Jangamo, Inharrime, Mandlakazi e Bilene) and some inland districts of Zambézia province (Mulombo, Gurué and Alto-Molocue). Other districts with a sharp increase in the rainfall amount are the districts of Chifunde in the northern part of Tete province, and Macanhelas and Marrupa in Niassa. Amongst all the 162 districts, only 11 districts are located in Zambézia, in the centre of Manica province, and in Sofala province.
Concerning the relative humidity (Figure 2 (c)), the country registered a decrease in the relative humidity (RH), which varied between 0.42 % and 4.59 %. From Figure 2 (c), it can be noted that the reduction in the RH is not substantial across the country. Nevertheless, it is apparent that it tends to decrease sharply as we move away from the coast. This trend is more evident in the northern and central parts of the country, mainly in the provinces of Nampula, Niassa and Zambézia. It is also observed that in Tete province the changes in RH are negligible.
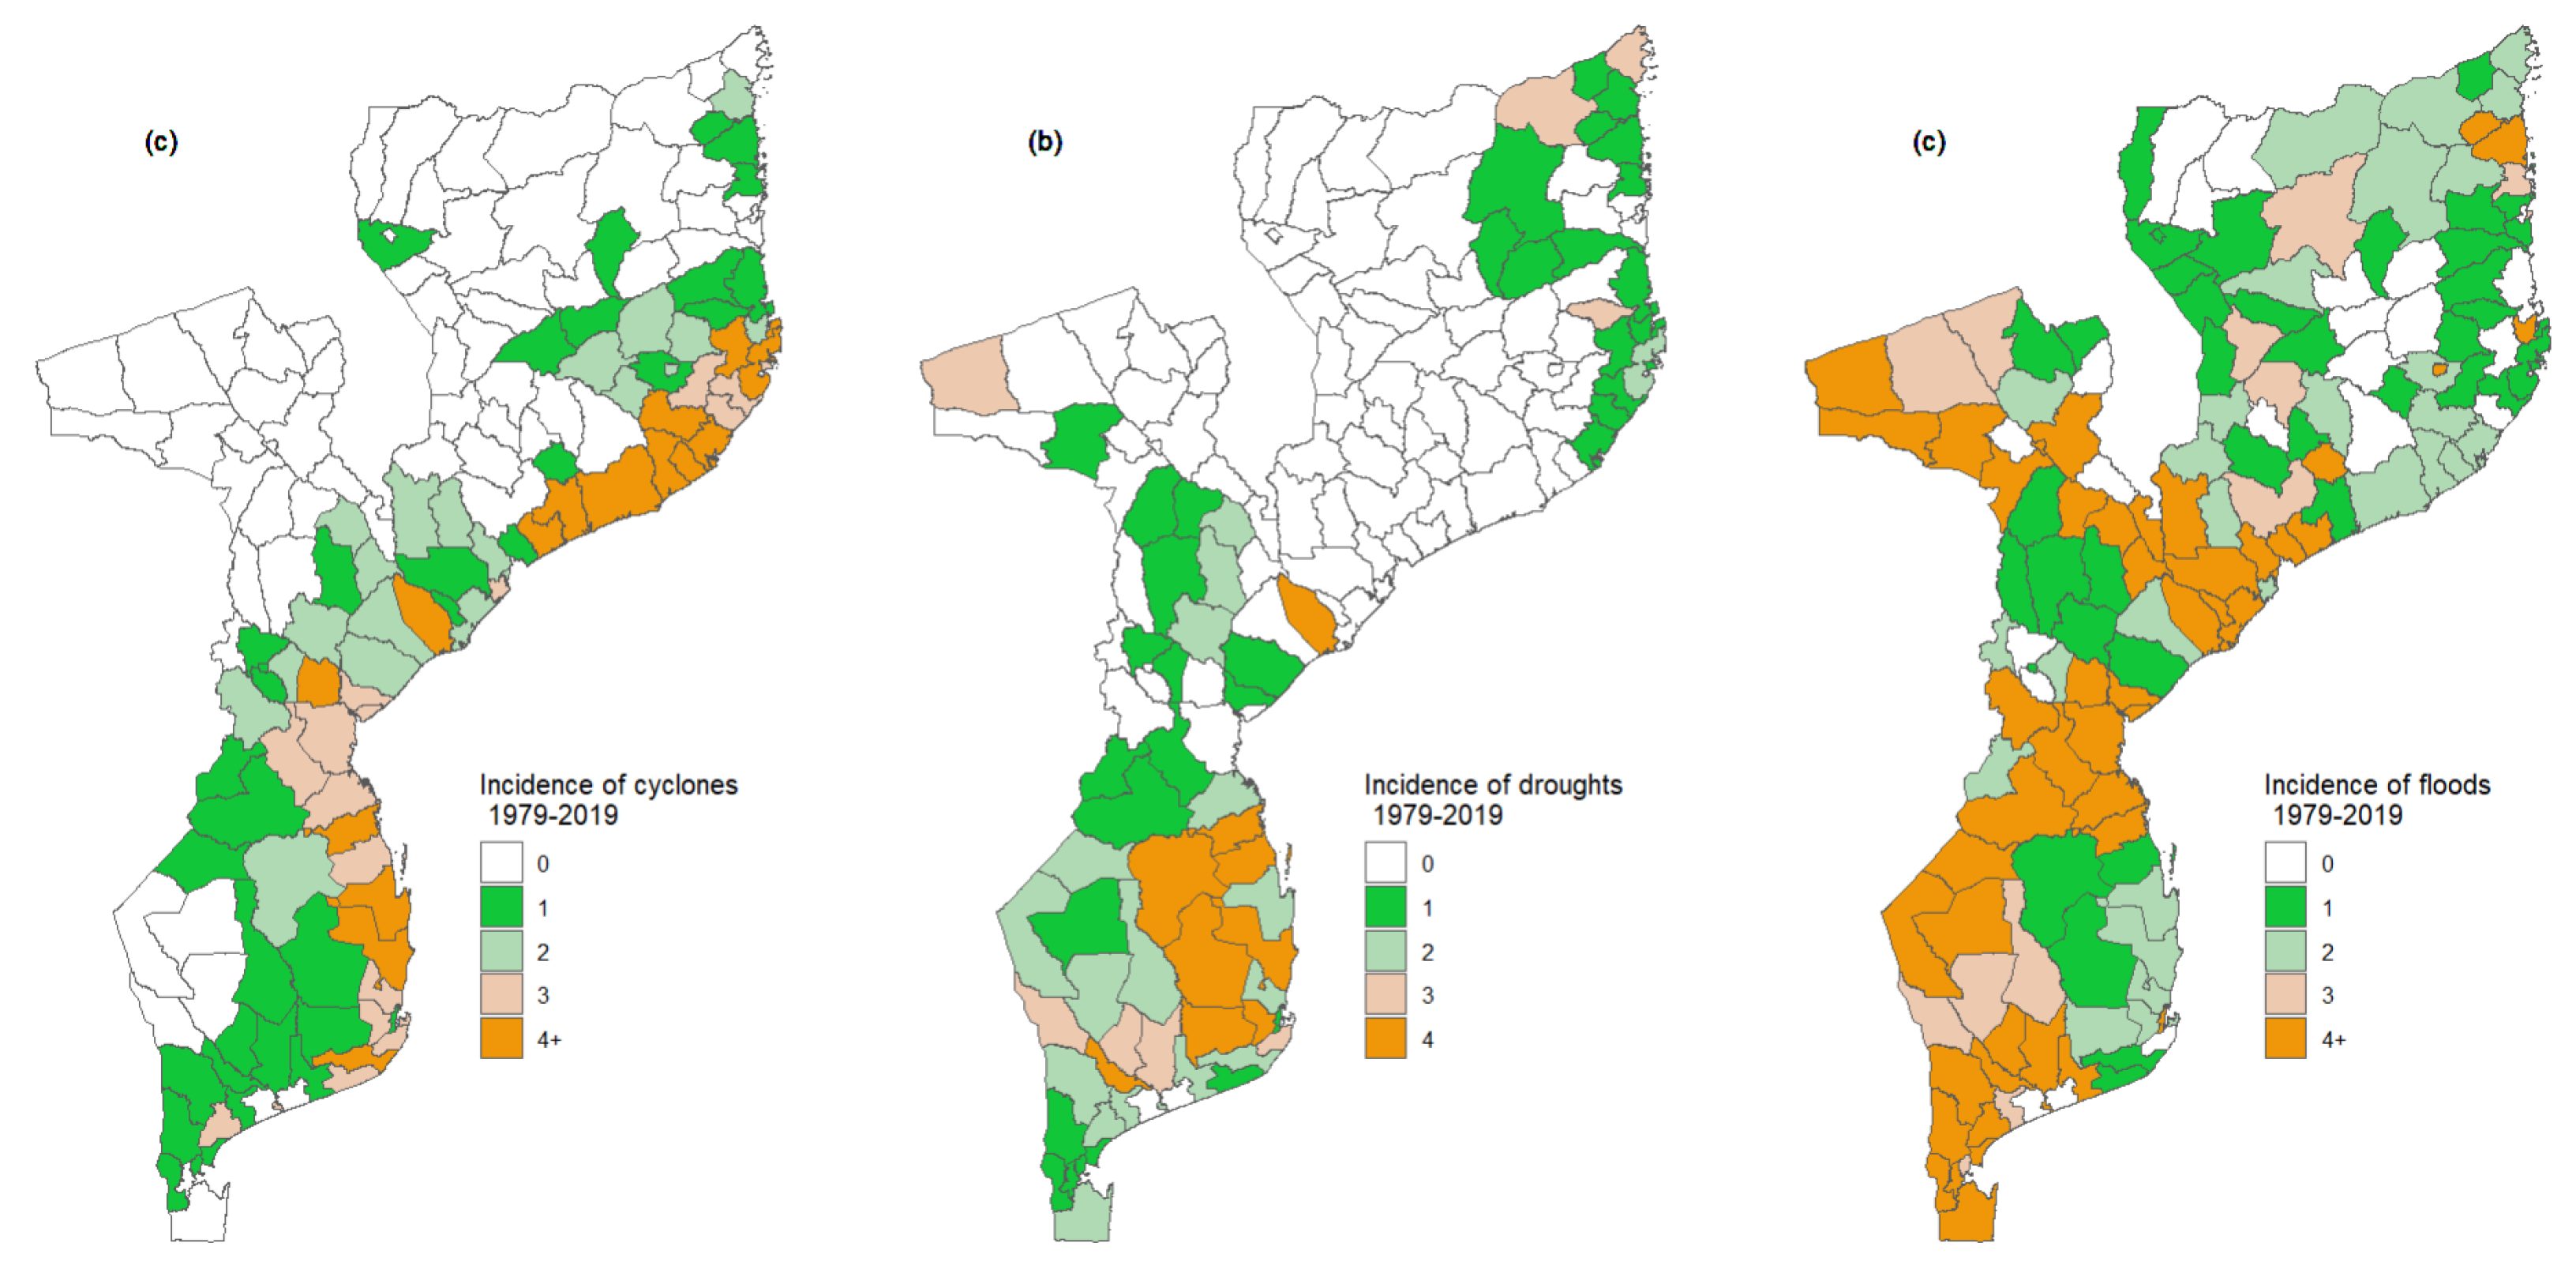
Figure 3 shows the incidence of extreme events—cyclones, droughts, and floods—in Mozambique by districts in the last 40 years. From this figure, it can be observed that tropical cyclones (Figure 3 (a)) are not evenly distributed across the country, affecting most districts along the coast. The map also suggests that Mozambique has high exposure to tropical cyclones. Additionally, it is possible to observe that tropical cyclones are more frequent Nampula province (in the districts of Moma, Larde and Angoche), Inhambane province (Massinga), Sofala province, Zambézia province and Maputo province. Figure 3 (b) shows the spatial distribution of the occurrence of droughts in Mozambique. From the map, it can be noted that in the last 40 years, 72 districts have been affected by droughts. Furthermore, it is apparent that most often, the droughts affect provinces from the southern region of the country, with particular emphasis on districts from Inhambane and Gaza provinces. The phenomenon also affects, with less frequency, some districts from Maputo, Manica, Sofala, Tete, Nampula (districts located along the coast) and Cabo Delgado province.
With regard to floods, the map in Figure 3 (c) shows that, although the frequency of occurrence of floods is not evenly distributed across the country, almost all the districts were once affected by floods in the last 40 years. From the map, one can observe that floods are more frequent in the main river basins in the centre (Zambezi, Púngue and Buzi basins) and in the south of the country (Save, Limpopo, Incomáti, Umbelúzi and Maputo basins), affecting districts across Zambézia, Tete, Sofala, Manica, Gaza and Maputo provinces. In the country’s northern region, despite the low frequency in general, it can be observed that the Messalo River basin in Cabo Delgado province is also affected with some frequency by floods.

3.2. Exposure, sensitivity and adaptive capacity index

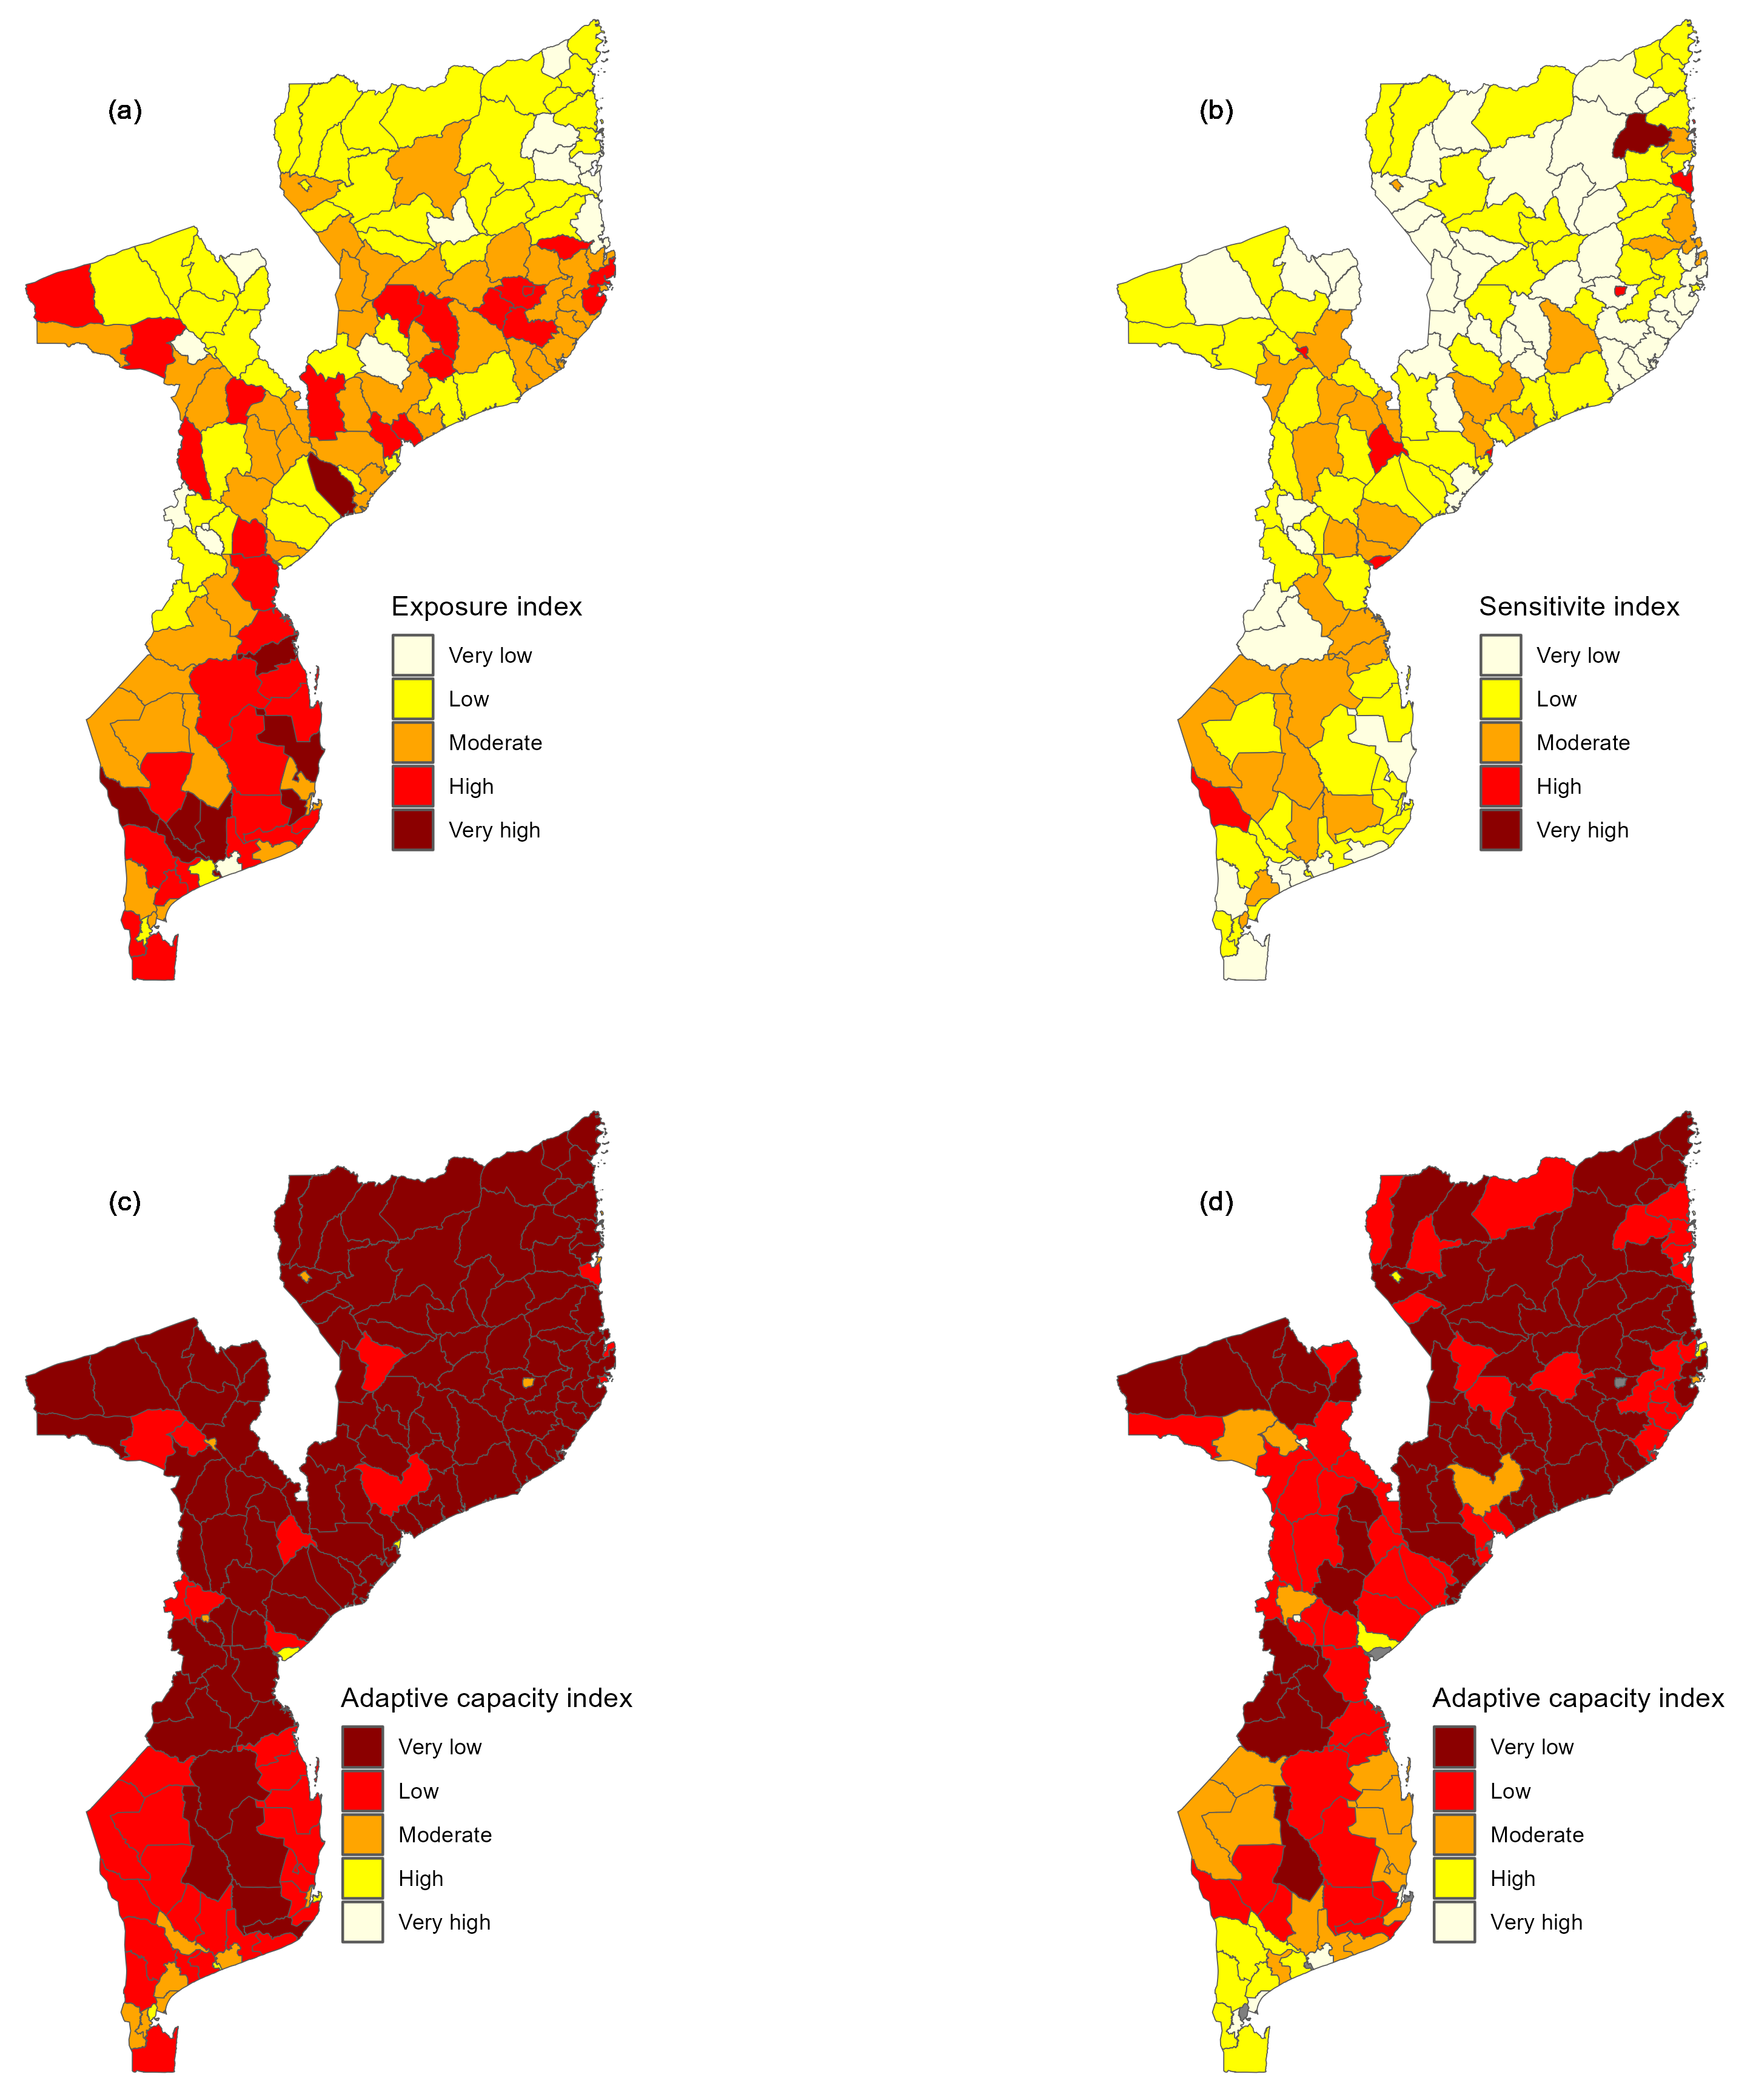
Figure 4 shows the exposure, sensitivity and adaptive capacity index calculated for 162 districts. The exposure and sensitivity maps are displayed in five intervals obtained using the quintiles, where the yellow and the dark red correspond to the lowest and highest exposure (sensitivity), respectively. In contrast, for the adaptive capacity map, the yellow and the dark red represent otherwise (as the lowest adaptive capacity represents a critical situation). From Figure 4 (a), it is noted that exposure to climatic hazards is considerably higher in the southern region of Mozambique, especially in districts located on the coastline of Inhambane province. The map also shows that exposure is higher in some districts of Sofala, Zambézia and Nampula province, alongside the Zambeze watershed. Cabo Delgado and Niassa province, in the northern region of Mozambique, appear to have lower exposure to climate change.
With regard to sensitivity to climate change, Figure 4 (b) exhibits a spatial pattern, where low sensitivity to climatic hazard is vastly observed in the northern region of Mozambique, whereas moderate sensitivity is observed in the central and southern region, mainly in Gaza, Inhambane and Sofala province. Adaptive capacity, which reflects the district’s ability to cope with climatic hazards, is presented in Figure 4 (c). Overall, the adaptive capacity (AC) across the country is very. Despite the apparent homogeneity of AC, it is evident that the southern region of Mozambique has a greater AC index when compared to the central and northern regions of Mozambique. Moreover, the map shows that the AC is higher in urban areas, which coincides with the capital provinces than in rural areas. The AC index was also visualized on a map excluding the extreme values corresponding to the main capital cities (Figure 4 (d)). It can be noted that after excluding the urban districts a clear pattern emerges, where the southern region appears to have high AC and the northern region low AC. Furthermore, it is observed that Maputo province, which is located in the southern part of Mozambique, has all of its districts with high AC.

3.3. Adaptive capacity determinants

For a better understanding of the adaptive capacity index and to investigate which of the determinants contributes the most in the resilience of a particular district, we analyzed the sub-indices of each of the determinants for the adaptive capacity components, namely, access to health services, human resources for the medical sector, wash and sanitation and financial resources for the medical sector. Likewise, the exposure, sensitivity, and adaptive capacity index, the sub-indices for each of the adaptive capacity components’ determinants, was computed following the approach described in Section 2.4.1.

3.3.1. Access to health services

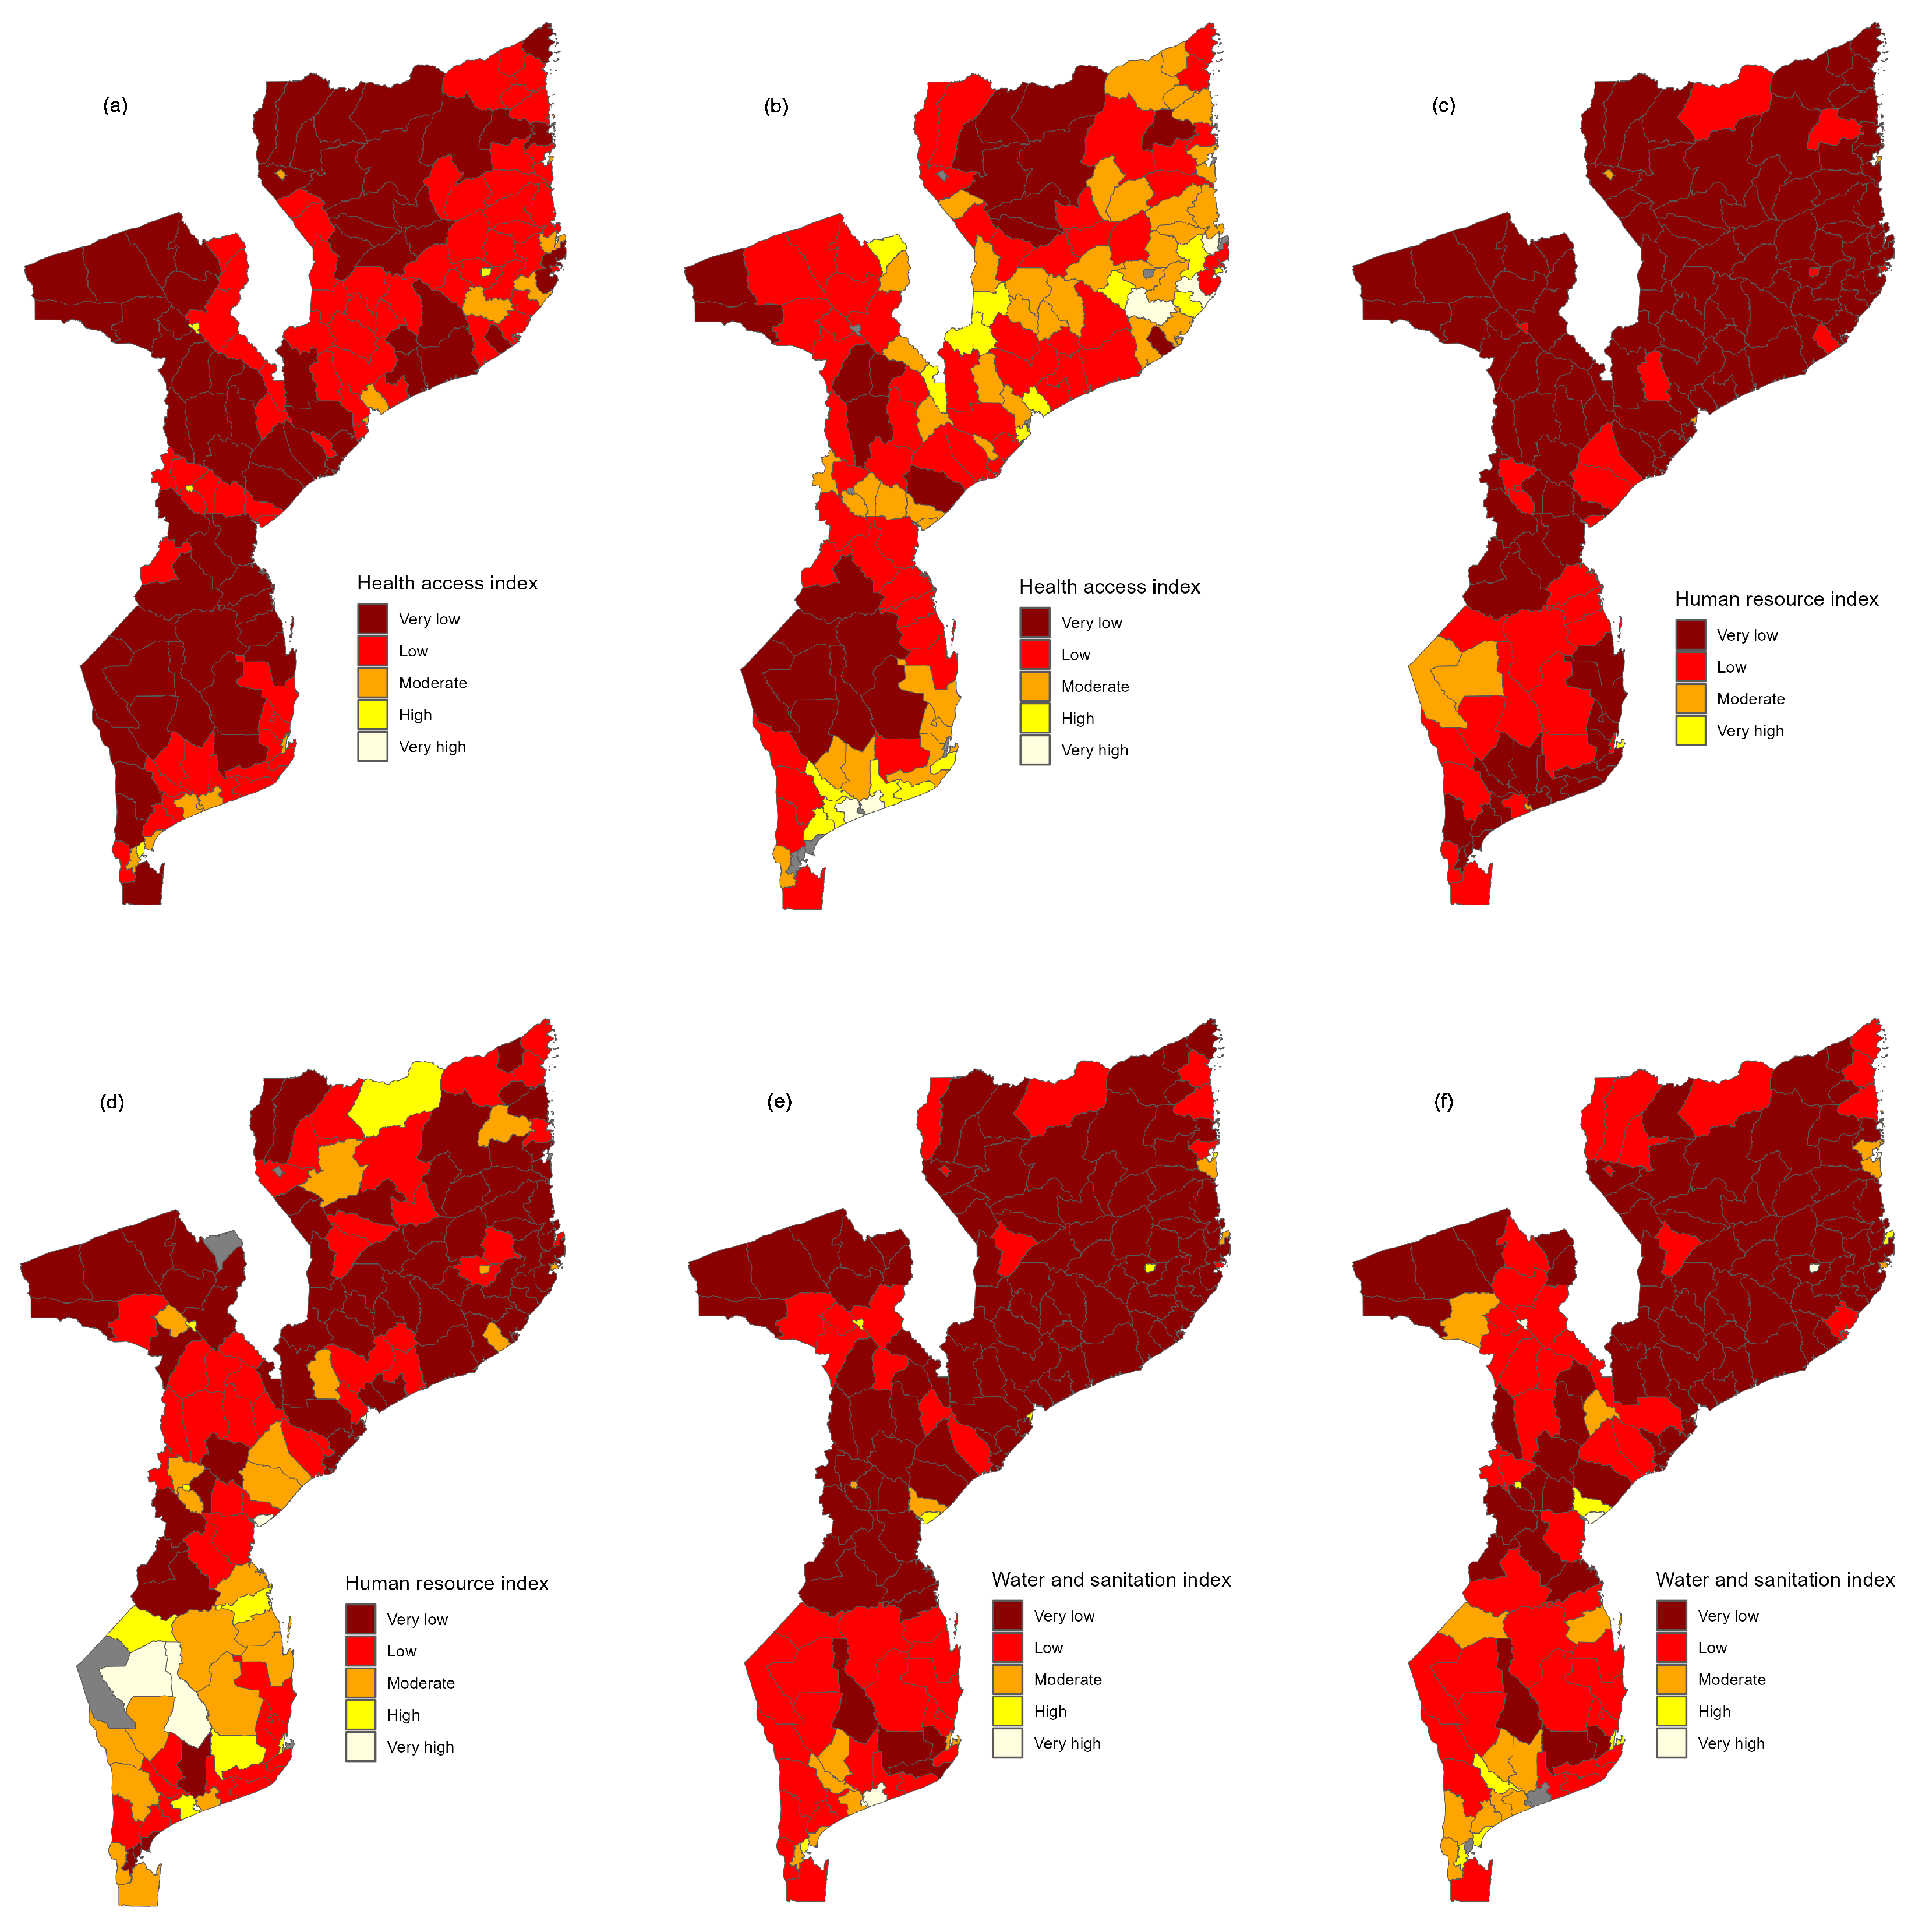
Figure A1 maps the index measuring access. In this figure, we present the mapped values considering all the districts (Figure A1 (a)) and excluding districts with extreme values (Figure A1 (b)). It can be observed that when we considered all the districts, only urban districts in Maputo, Matola, Chimoio, Tete and Nampula appear to have high access to health services. We also observe that the vast majority of the country is characterized by districts with very low access to health services. Looking at Figure A1 (b), the scenario that excludes districts with extreme values, we observe that, contrary to the previous scenario, the health access index shows some degree of heterogeneity. Furthermore, it can be observed some clustering of districts with very low access to health, some of them located in the southern region of the country (in the provinces of Gaza and Inhambane) and others in the northern region of the country (in the province of Niassa). Moreover, in the southern region, it is possible to see that almost all districts of Gaza province have a very low access to health services. The map (Figure A1) also reveals that most districts from Nampula province have either moderate or high access to health services.

3.3.2. Human resources for health services

We further assessed the distribution of the human resources in the health sector. For this purpose, we considered a human resource index, which considers all the human resource indicators listed in Table 1. The human resource index is mapped in Figure A1. Likewise other indices, we present two scenarios, one showing the human resource index (HRI) for all districts (Figure A1 (c)) and another showing the HRI discarding districts with outliers (Figure A1 (d)). From Figure A1 (c), one can see that the HRI is homogeneous across the country, with most of the districts exhibiting a very low HRI, except Inhamabane, Pemba, Lichinga, and Chicualacuala districts, which lie into the moderate category. Nevertheless, when we discard districts with extreme values, we note that the HRI appears to be heterogeneous across the country. Furthermore, it can be noted that districts with high HRI are concentrated in the southern region of the country, whereas districts with low HRI are focused on the central and northern regions of the country.

3.3.3. Water and sanitation

Figure A1 show the country’s water and sanitation index (WSI). Similarly, as with other components, we analyze the water and sanitation component by considering all the districts, as shown in Figure A1 (e), and discarding districts with extreme values for WSI (Figure A1 (f)). One can see that when all the districts are considered, the vast majority of the districts exhibit either low or very low WSI. However, we note that, even discarding districts with the highest WSI, the distribution of WSI across the country continues to be critical, where we note that a total of 125 districts, which corresponds to 92% of the country’s territory and 71.5% of the total population, has a low WSI. Additionally, it can be noted that almost the entire region in the north has poor access to safe water and sanitation. For instance, we note that in Zambézia province, every district has a very low WSI, except Quelimane. Contrary to what is observed in the country’s northern region, a substantial part of the southern region, mainly in Maputo province, appears to have a high WSI.

3.4. Global health vulnerability index

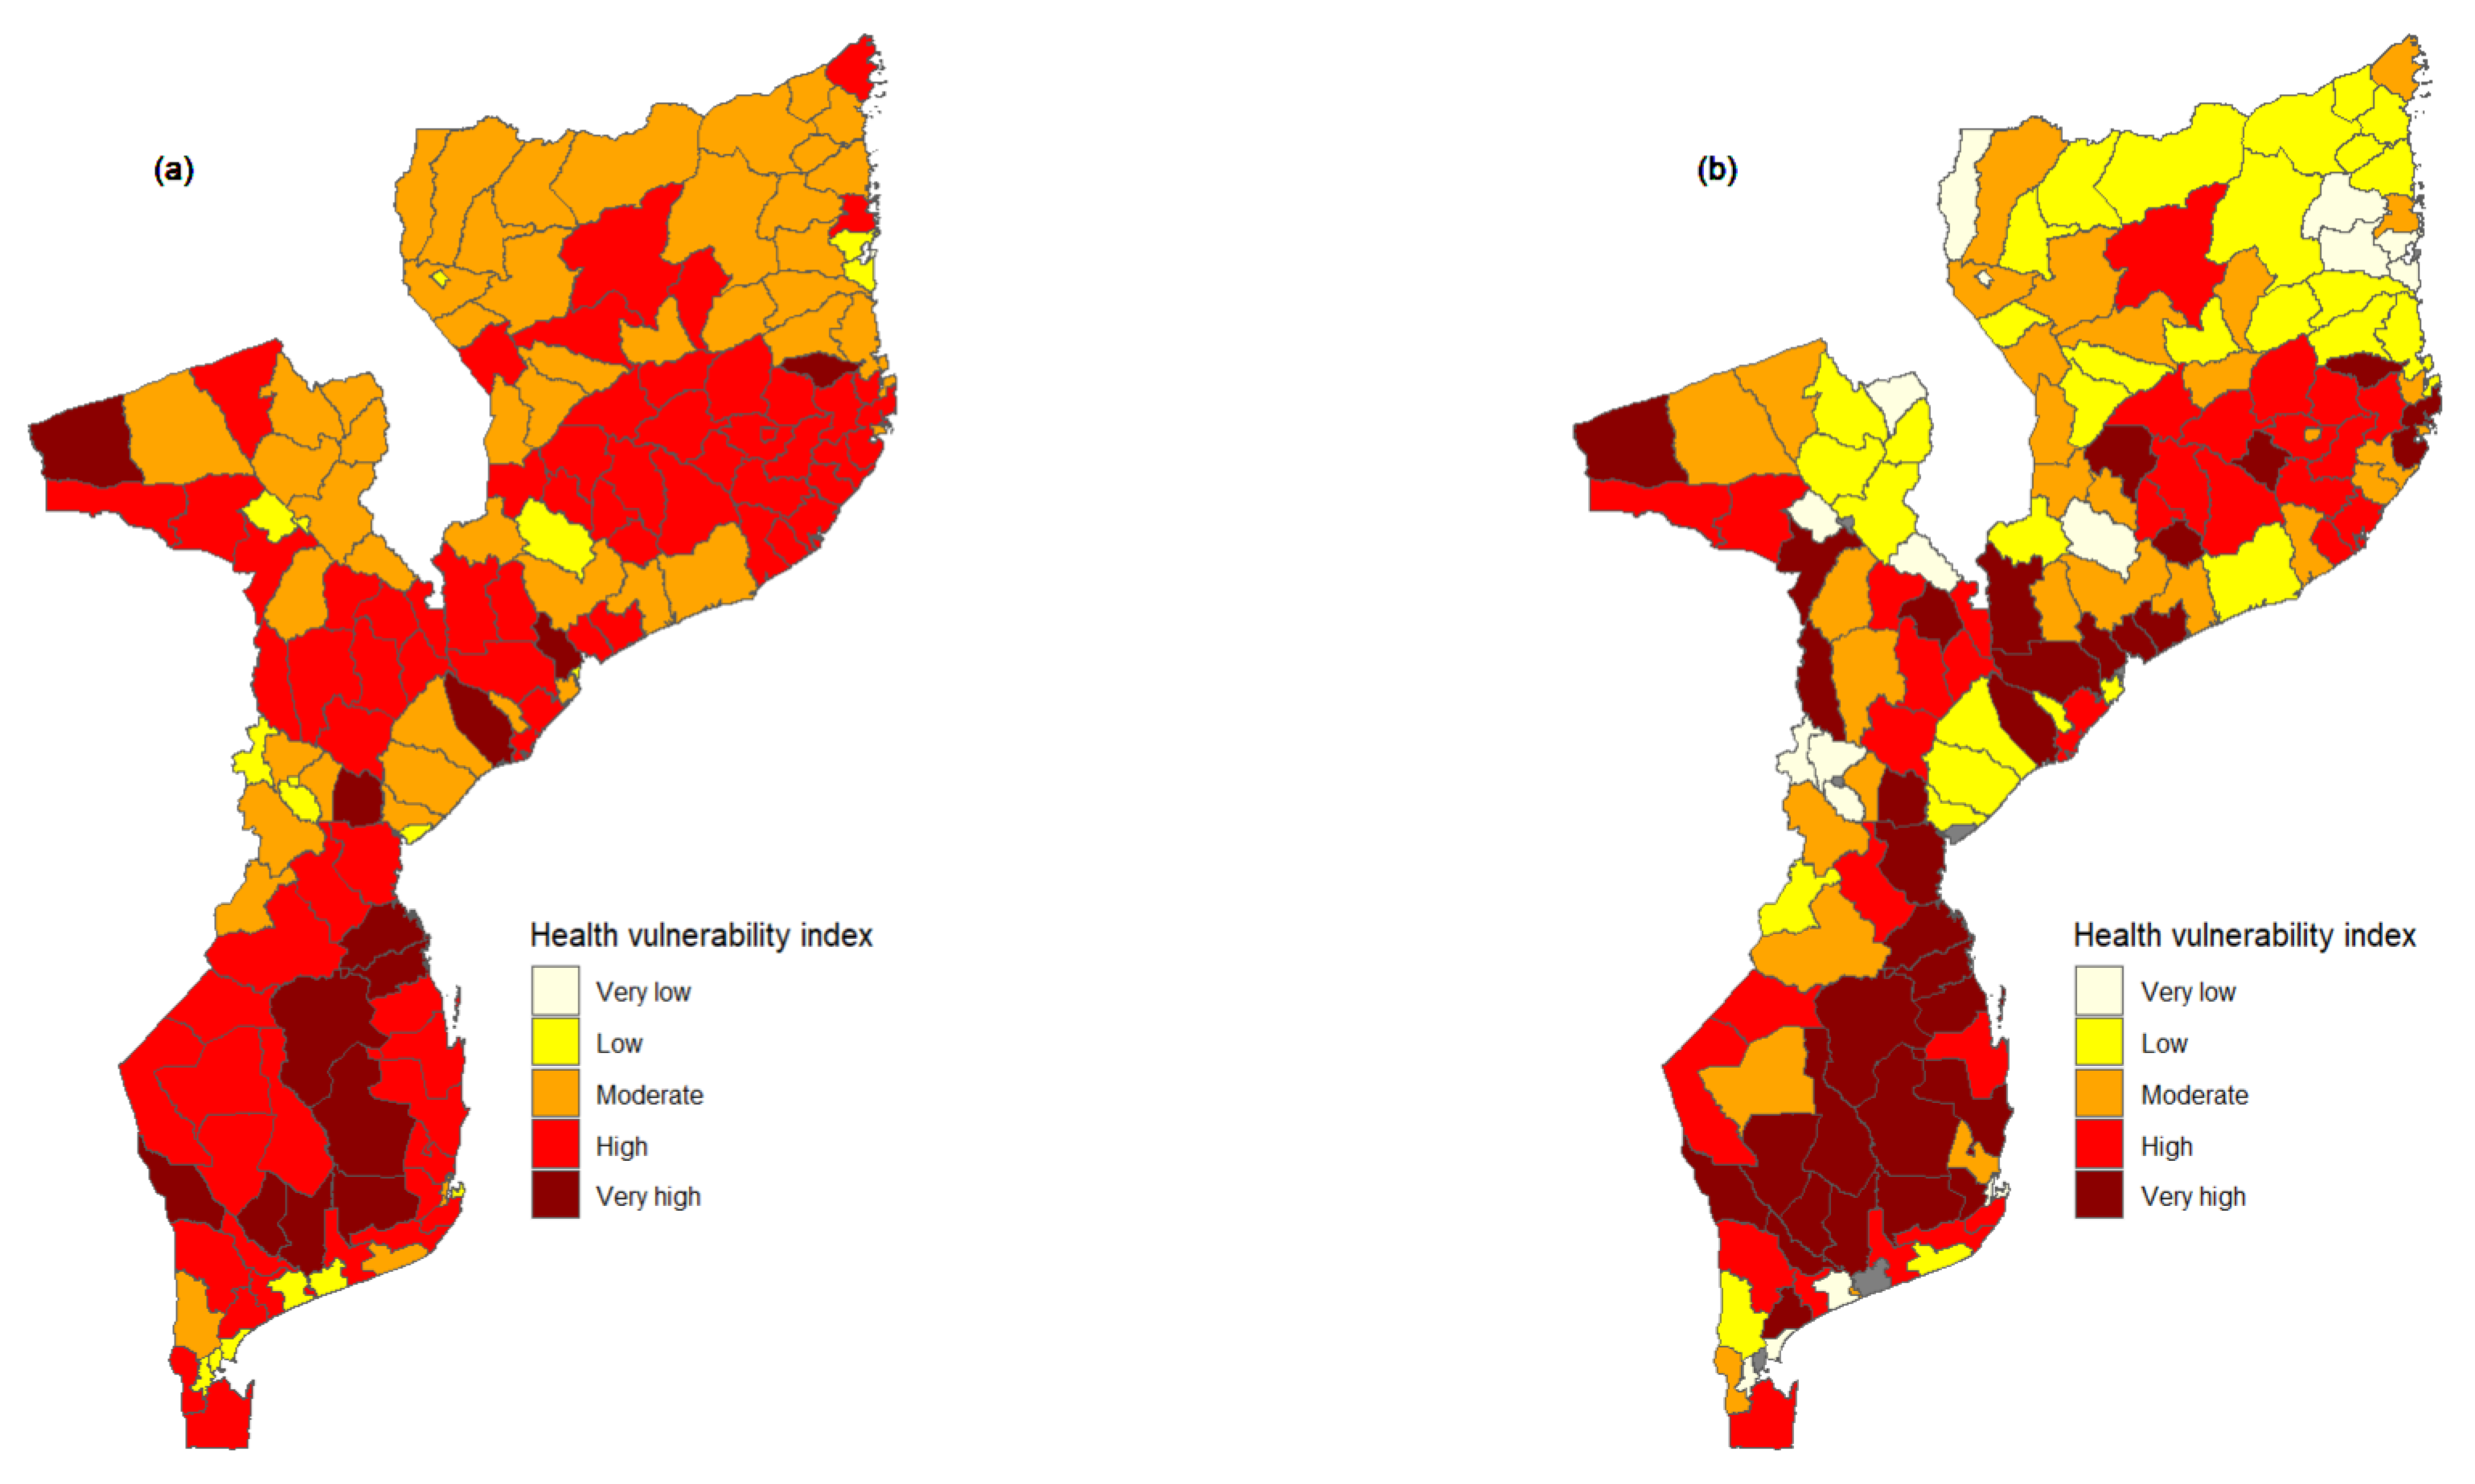
Figure 5 shows districts’ overall health vulnerability index maps. The maps show that, in general, the HVI is high all over the country, indicating that the health sector is highly vulnerable to climate change. Furthermore, an apparent inequality between urban and rural districts can be observed, whereby urban districts appear to have a lower HVI. The map (Figure 5 (a)) also suggests that districts from the northern region in Niassa and Cabo Delgado province are less vulnerable than the majority of the districts in the southern region of Mozambique. The HIV was also visualized discarding urban districts that coincide with provincial capitals, allowing one to have a clear picture of districts that are, in fact, vulnerable to climate change. The map that shows the HVI discarding urban districts with extreme values is shown in Figure 5 (b). From this map, it can be noted that only eight districts have a very high HVI and, contrary to the scenario in Figure 5 (a) — where the majority of the country was characterized by districts with high vulnerability index—, majority of the districts fall into moderate HVI. Moreover, we observe that Cabo Delgado province, despite having a vast coastal area and a lower adaptive capacity, has lower HVI than many districts in Mozambique’s southern and central regions.

3.5. Vulnerability index to droughts, floods and cyclones

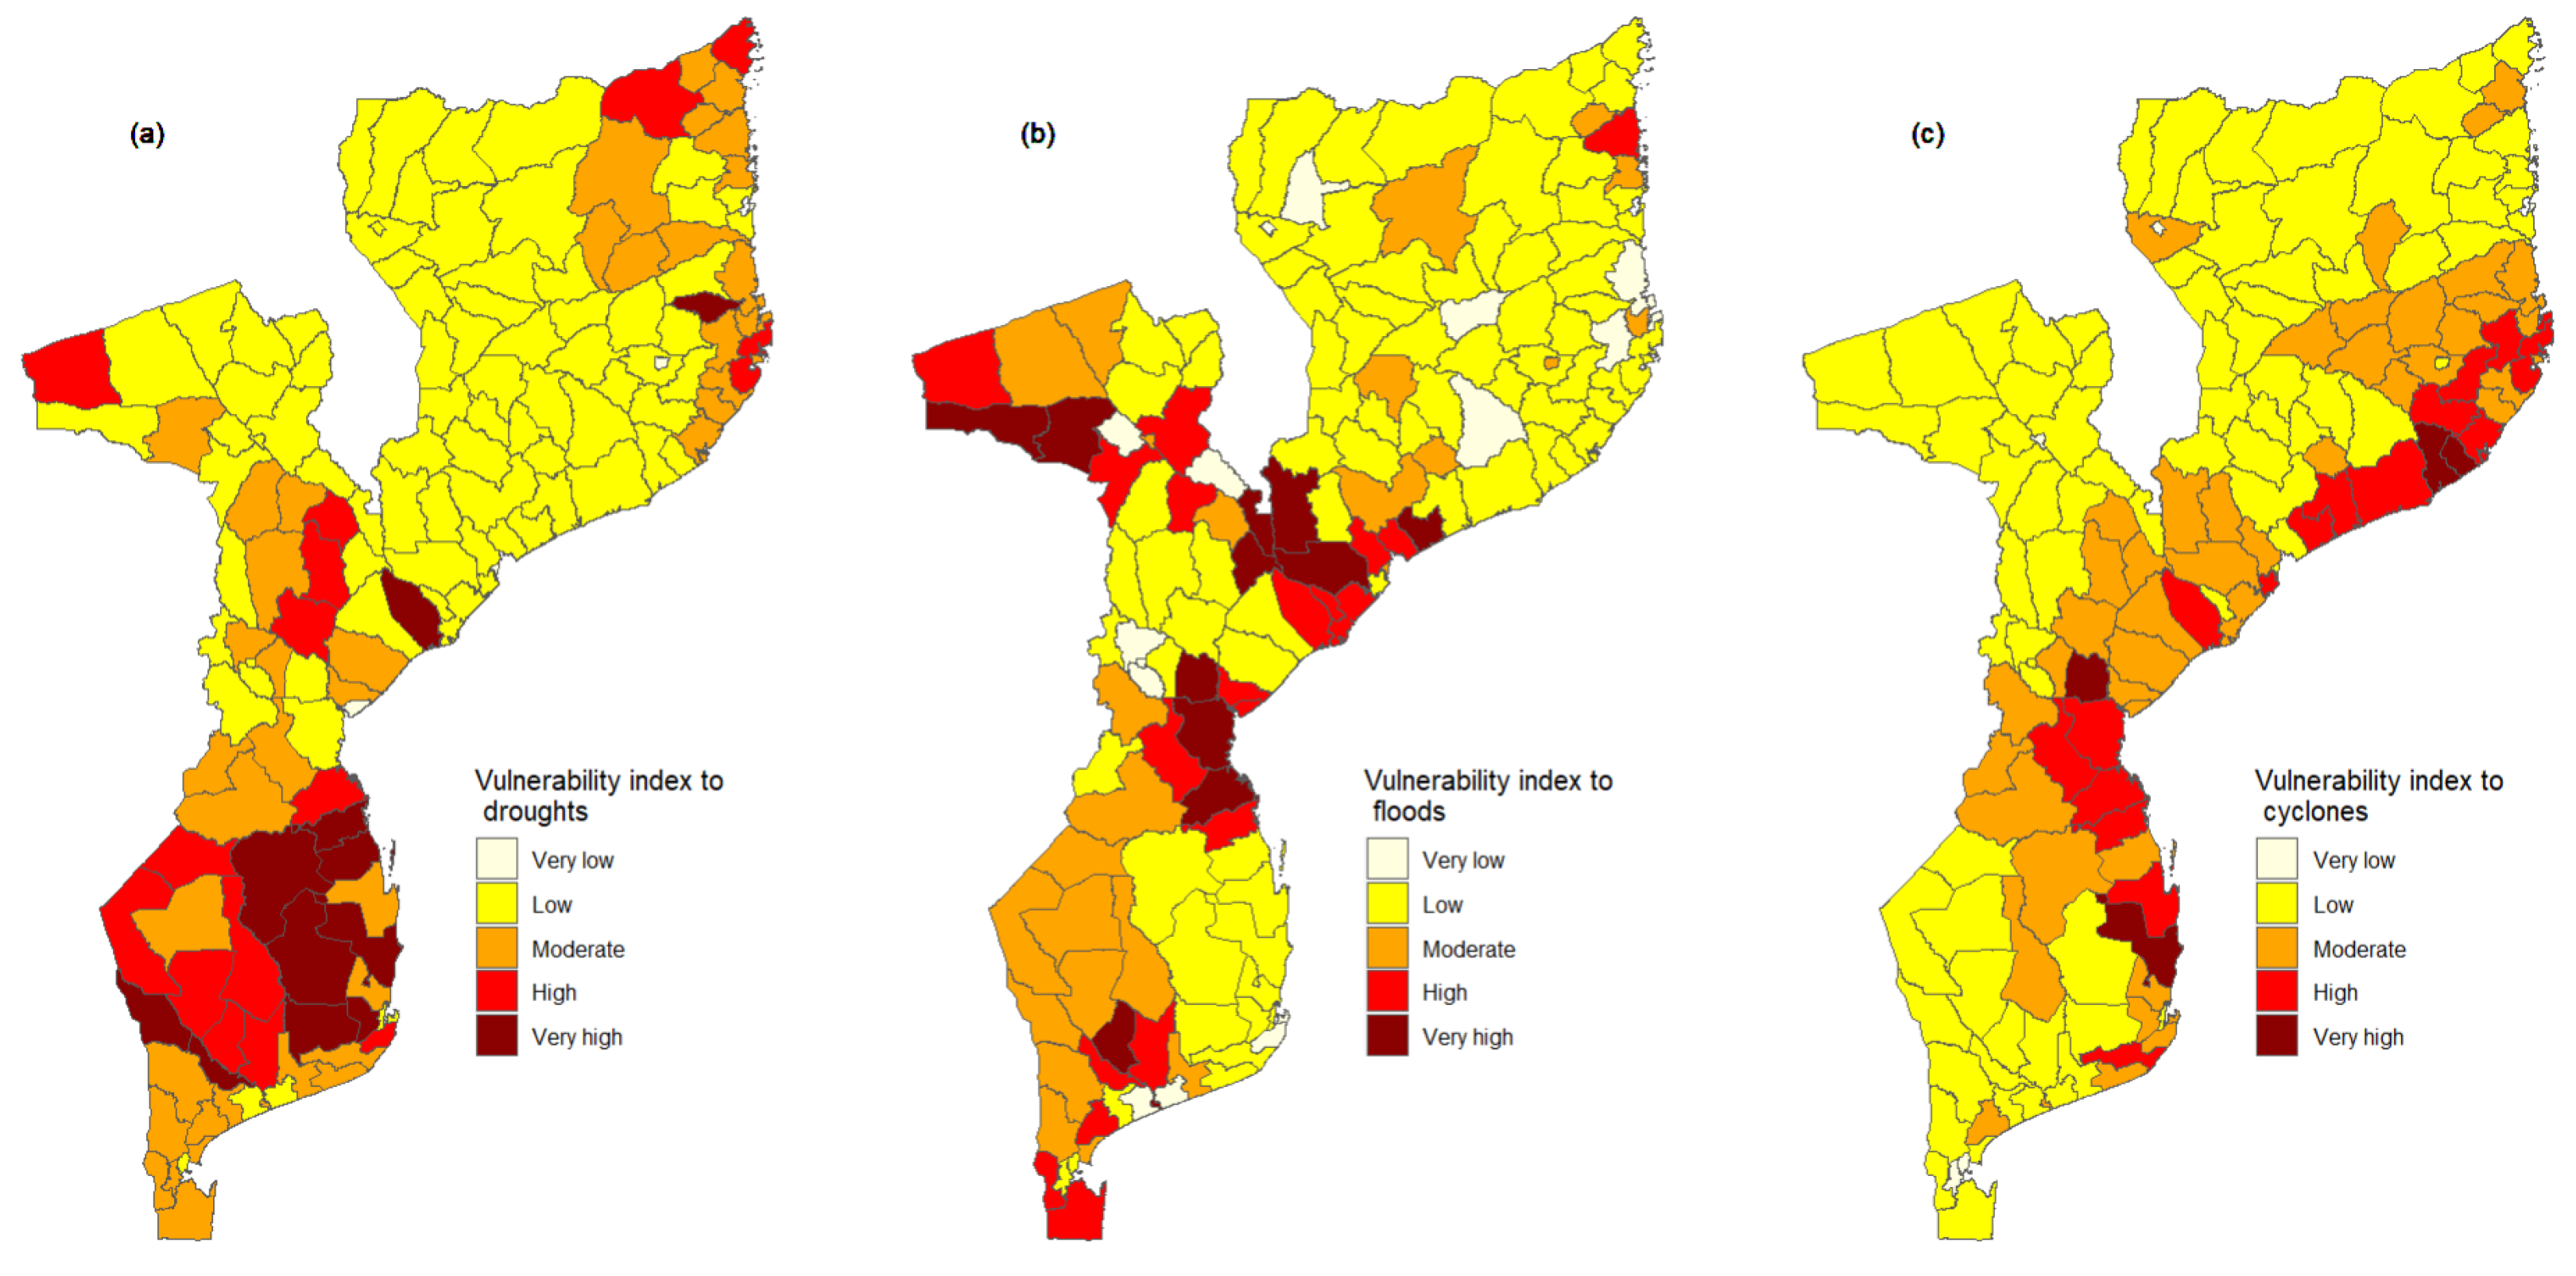
In the current study, we also computed the HVI for each extreme event, drought, flood, and cyclone. This index allows one to identify more vulnerable districts to a particular, extreme event. The HVI to particular, extreme events is presented in Figure 6. This figure shows that the southern region of Mozambique, emphasising the provinces of Inhambane and Gaza, is highly vulnerable to droughts. The map in Figure 6 (a) also shows that Cabo Delgado province in the northern region of Mozambique is more vulnerable to droughts among provinces located in this region, particularly districts of Mueda and Mossuril.
The geographic distribution of the HVI to floods is presented in Figure 6 (b). From this figure, we can observe that the geographic distribution of incidence of floods in Figure 3 (c), the geographic distribution of districts highly vulnerable to floods, follows the main watersheds in the country. Furthermore, we observe that among districts with a high vulnerability index, four are located in Zambézia province, three in Tete and Sofala province, and two in Gaza province. Overall, the Sofala province appears to be much more vulnerable to floods than other provinces. With regard to vulnerability to cyclones, Figure 6 (c) suggests that districts that are much more vulnerable to cyclones are those located in the coastal area of the country. Additionally, we observe that in Nampula and Sofala province, not only districts situated on the coast appear to be vulnerable to cyclones but also inland districts.

4. Discussion

The present study, which is the first of its kind in the country, sought to derive a health vulnerability index for assessing the vulnerability and adaptation needs of the health sector to climate change in Mozambique at the district level. The health vulnerability index was operationalized following the IPCC definition of vulnerability, generating measures for exposure, sensitivity and adaptive capacity at the district level. This allowed us to assess how the vulnerability and its dimensions vary within the country. Our results pointed out that exposure to climate change is substantially high in the southern region of Mozambique. Additionally, the results showed that coastal districts located in other regions of the country are also highly exposed to climate hazards, emphasizing Nhamatanda, Buzi, Beira and Marromeu districts in Sofala province. The elevated exposure index among districts located in the coastal area can be justified because this region of the country is exposed to several coastal hazards, including tropical cyclones, storm surges, and sea level rise [42]. In fact, Mozambique has a vast coastline of about 2,500 km in an area highly prone to tropical depressions and typhoons. In the last 40 years, Mozambique has been hit by about 21 cyclones, most of them affecting coastal districts. These results are consistent with the study by Cabral et al. [43] on Mozambique’s exposure to coastal climate hazards and erosion. The authors found that districts on the central coast had more than 10% of their coastal areas with higher exposure to climate hazards.
The results also revealed that the southern region of Mozambique is highly exposed to climatic hazards. In fact, it is worth noting that this part of the country locates in one of the largest river basins of the Southern African development community (SADC). This Limpopo River basin has been subject to several floods of great magnitude. In the last 70 years, in 1955, 1967, 1972, 1975, 1977, 1981, 2000, and 2013, severe floods have affected the Limpopo river basin, caused mainly by heavy localized rainfall, tropical cyclones and inadequate management of upstream dams and wetlands [44,45]. The analysis also showed that contrary to other regions that only experience one time of climatic hazard, the southern region experiences all the climatic hazards, which could be behind the elevated exposure index in this part of the country. The results also indicated that the districts along the Zambezi River basins (the second largest river basin in the African continent) in Zambézia and Nampula province are also susceptible to extreme weather events, mainly to floods.
With regard to the sensitivity of the country’s population to climate change, the results suggested that despite the country being highly exposed to extreme weather events, the country is vastly characterized by districts with either low or moderate sensitivity. The reasons behind the generalized low sensitivity index nationwide are not evident. Nevertheless, a more in-depth analysis (not shown herein) suggested that although the country is prone to extreme weather events, the country experiences few cholera outbreaks. Districts located in Mozambique’s central and northern regions, such as Beira, Caia, Tete, Nampula Melucu, and Mecufi, which have frequent cholera outbreaks, are the ones that stood out with high sensitivity. In fact, Mozambique’s central and northern regions are more prone to floods than the southern region, which often cause people to move and settle into overcrowded places with poor sanitation conditions, increasing the risk of cholera outbreaks. For instance, in 2019, an intense tropical cyclone hit the central region of Mozambique, leaving the region entirely devastated, causing a cholera outbreak with more than six thousand cases [46,47]. Additionally, it is worth emphasizing that districts with high sensitivity also had a high risk of food insecurity between 2016 and 2019. With the northern region being prone to floods as a result of climate change, it is expected that there is a destruction of food crops, storehouses and livestock, and as a result, a decline in food availability and an increase in the risk of food insecurity, which in turn would increase nutritional problems among children under five [48,49]. According to the Mozambique Technical Secretariat for Food Security and Nutrition (SETSAN), chronic food insecurity is most prominent in the central and northern regions of the country [50].
The results further revealed that Mozambique generally has a low adaptive capacity, being more pronounced in the central and northern regions of the country. Poverty, limited investments in advanced technology, and the fragility of infrastructure and social services, particularly health and sanitation, may explain the country’s poor adaptive capacity to climate change [51]. As a matter of fact, it is expected that regions or districts with well-developed institutions coupled with higher levels of capital and stores of human knowledge are considered to have higher adaptive capacity [52]. For instance, data on the fourth national evaluation on poverty and wellness in Mozambique indicate that the northern region has the highest poverty rates, with the province of Niassa standing out with rates around 60%. Hence, the expected low adaptive capacity among districts from this province. Additionally, a critical examination of the results revealed that the central and northern regions have poor sanitation conditions, which is more evident in rural districts. Add to that, the prevalence of water-borne diseases among children under five is more pronounced in the central and northern regions of Mozambique, varying between 4.1% and 14.5% [53].
Among the determinants contributing to high adaptive capacity, we also found that access to health services is still deficient in Mozambique, mainly in Niassa (northern region) and the provinces of Gaza and Inhambane (southern region). Nevertheless, it is worth emphasizing that the identified provinces have the least population density with sparse households, which at some point hinders the provision of health services and access to them. These findings align with a study by dos Anjos Luis and Cabral [54]. The authors analyzed the geographic accessibility to primary healthcare centres in Mozambique. They found that the provinces of Nampula (northern region), Zambézia and Tete (central region), and Inhambane (southern region) have the highest number of villages outside 60 min of a health facility. The results also indicated that access to healthcare is urban-biased. The inequalities in the distribution of health facilities can be justified by the fact that many infrastructures in the rural area were destroyed during the civil war, which makes many of the rural districts much more vulnerable to the impact of climate change [55]. The lack of access to healthcare not only puts the districts into an increased vulnerability but also affects the abilities of districts to cope with the effects of climate change, such as the rise of cases of cholera, diarrhea, malaria and food insecurity, after the country has experienced an extreme weather event.
Although the study clarifies the spatial trend of the HVI in Mozambique, there are some limitations. Due to a lack of data on some indicators for some of the districts, proxy indicators were used to assess the exposure, sensitivity and adaptive capacity. Therefore, one should consider the limitations associated with using proxies: under-representation or over-representation. Another major limitation was the lack of weather stations for all the country districts, which made it impossible to obtain in-situ data. Additionally, for several reasons, the historical series of climatic data collected by the operational weather stations present numerous gaps, making it even more difficult to obtain complete and consistent databases to conduct an analysis of this nature. To overcome this situation, the study used reanalysis data. Nevertheless, climate data from reanalysis can be over- or under-estimated in specific periods and zones of the country [56]. For some indicators, it was not possible to obtain recent data. For instance, for health determinants and water and sanitation data, we had to rely on 2007 census data, despite the 2017 census having been carried out, as by the time of VAA the 2017 census data was not publicly available. Therefore, it is possible that the adaptive capacity index is somehow underestimated, as indicators for these components might have improved over the last 12 years.

5. Conclusion

Overall, the results suggested that the country is highly vulnerable to climate change, except for the main capital cities, which can be explained by the fact that the country is situated in the zone of inter-tropical convergence and downstream of shared watersheds, and frequently endure severe weather-related natural disasters [57]. The country’s high exposure to tropical cyclones, floods and droughts is particularly significant. It is worth emphasizing that most people in Mozambique fully depend on subsistence farming. Thus, climate variations have to potential to influence the livelihood and the economy of such areas, which in most cases lead to the destruction of crops, livestock and wildlife, loss of human lives, damage to social and economic infrastructure, harm to human health and the environment, etc. For instance, more recently, the cyclones Idai and Kenneth have caused tens of thousands of families, leaving many needing basic supplies such as water and food. The storms also destroyed about 780,000 hectares of agricultural crops, which triggered a nutritional crisis that affected about one million people, including 160,000 children under five [58]. The natural disasters not only destroyed crops but also schools, hospitals and other infrastructures were destroyed, leaving the country more fragile. Knowing that it is not possible to modify the country’s exposure to climate change or its sensitivity in the short term, it is important to develop policies, strategies, plans and activities that reinforce the ability of the system, communities and individuals to better adapt to climate changes and deal with the changes they bring.
The results provided in this study within the vulnerability analysis framework give a baseline for developing strategies and adaptation actions. Nevertheless, it is essential to consider the multi-sectoral nature of the country’s vulnerability. As we have seen in previous chapters, the HVI on which this analysis is based includes indicators relating to water and sanitation, nutritional status and food security, education, development, etc., which are outside the direct control of the health sector. While each sector must develop its own analyses, strategies and plans, a coordinated multisectoral approach is essential to be able to mitigate the effects of climate changes, implement effective measures to improve adaptive capacity and optimize the limited existing resources. Furthermore, the current study will allow competent authorities to design targeted district-specific policies to mitigate the effect of climate change in the communities. The results showed that coastal districts are highly vulnerable to tropical cyclones. Therefore, the health authorities must ensure the construction of resilient infrastructure to minimize the impacts of climate change. Another point that is worth being emphasized is women’s empowerment. Worldwide, women dominate poverty; in urban areas, about 40% of poor households are headed by women. Additionally, women represent the largest share that is dependent on natural resources (which are often affected by climate change) for livelihood [59]. Therefore, it is essential to build strategies and policies that promote women’s empowerment in the communities, assuring gender equality in many sectors of the country, mainly among adolescents and youth.

Author Contributions

Conceptualization, R.M, G.M, and W.K; methodology, R.M., G.M., T.M., and L.K.; software, R.M.; validation, R.M., A.J., S.T and G.M.; formal analysis, R.M. G.M., A.J., P.M., I.A., M.K., S.T., W.K., O.I., T.M. and L.K.; investigation, R.M. and G.M; data curation, R.M. I.A., M.K. and G.M; writing—original draft preparation, R.M.; writing—review and editing, T.M., G.M, I.A., M.K., A.J., P.M., O.I., S.T, W.K. and L.K. .; visualization, R.M.; supervision, G.M., T.M., W.K. and L.K. All authors have read and agreed to the published version of the manuscript.

Funding

This research received no external funding.

Data Availability Statement

Data used in this paper can be obtained from the author upon reasonable request.

Acknowledgments

The author would like to acknowledge the Ministry of Health for providing all the necessary data to carry out this research.

Conflicts of Interest

The authors declare no conflict of interest.

Appendix A

Figure A1. Herein, we present the maps of the adaptive capacity determinants. Map A and B show the distribution of the health access index with and without outliers, respectively. Map C and D show the distribution of the human resource index with and without outliers, respectively. In Map E and F, we display the water and sanitation index with outliers and discarding outliers, respectively.
Preprints 75222 g0a1

References

  1. Monday, I.F. Investigating Effects of Climate Change on Health Risks in Nigeria. In Environmental Factors Affecting Human Health; Uher, I., Ed.; IntechOpen: Rijeka, 2019; chapter 2. [Google Scholar] [CrossRef]
  2. IPCC. Climate change 2001: the scientific basis. Contribution of Working Group 1 to the Third Assessment Report of the Intergovernmental Panel on Climate Change, 2001.
  3. Ojomo, E.; Elliott, M.; Amjad, U.; Bartram, J. Climate Change Preparedness: A Knowledge and Attitudes Study in Southern Nigeria. Environments 2015, 2, 435–448. [Google Scholar] [CrossRef]
  4. Jafino, B.A.; Walsh, B.; Rozenberg, J.; Hallegatte, S. Revised estimates of the impact of climate change on extreme poverty by 2030, 2020.
  5. WMO. Climate change triggers food insecurity, poverty and displacement in Africa. 2021. Available online: https://www.un.org/africarenewal/magazine/climate-change-triggers-food-insecurity-poverty-and-displacement-africa (accessed on 14 February 2022).
  6. Campbell-Lendrum, D.; Manga, L.; Bagayoko, M.; Sommerfeld, J. Climate change and vector-borne diseases: what are the implications for public health research and policy? Philos Trans R Soc B: Biol Sci 2015, 370, 20130552. [Google Scholar] [CrossRef] [PubMed]
  7. Semenza, J.C.; Rocklöv, J.; Ebi, K.L. Climate Change and Cascading Risks from Infectious Disease. Infect Dis Ther 2022, pp. 1–20. [CrossRef]
  8. Young, H.; Cornforth, R.; Petty, C. Climate and health in Africa: research and policy needs, 2019.
  9. McGlade, J.; Bankoff, G.; Abrahams, J.; Cooper-Knock, S.; Cotecchia, F.; Desanker, P.; Erian, W.; Gencer, E.; Gibson, L.; Girgin, S.; et al. Global assessment report on disaster risk reduction 2019, 2019.
  10. Unicef. Cyclone Gombe: Impacto das mudanças climáticas nas mulheres e raparigas em Moçambique. 2019. Available online: https://www.unicef.org/mozambique/historias/cyclone-gombe-impacto-das-mudan%C3%A7as-clim%C3%A1ticas-nas-mulheres-e-raparigas-em-mo%C3%A7ambique (accessed on 14 February 2022).
  11. Masters, J. CAfrica’s Hurricane Katrina: Tropical Cyclone Idai Causes an Extreme Catastrophe. 2019. Available online: https://www.wunderground.com/cat6/Africas-Hurricane-Katrina-Tropical-Cyclone-Idai-Causes-Extreme-Catastrophe (accessed on 15 February 2022).
  12. ACSS. Cyclones and More Frequent Storms Threaten Africa. Available online: https://africacenter.org/spotlight/cyclones-more-frequent-storms-threaten-africa/ (accessed on 15 February 2022).
  13. WHO. Tropical cyclone Idai Mozambique - Situation Report 01 April 06 2019. Available online: https://www.afro.who.int/sites/default/files/2019-05/WHOSitRep1Mozambique06-07-2019.pdf (accessed on 10 May 2022).
  14. WHO. Tropical Cyclones Idai and Kenneth Mozambique - National situation report 2nd August 2019. Available online: https://www.afro.who.int/sites/default/files/2019-08/SitRep%208_MOZ_15%20%20t%2028%20Jul%202019_ENG.pdf, 2019 (accessed on 10 May 2022).
  15. Unicef. Cyclone Idai and Kenneth cause devastation and suffering in Mozambique. 2019. Available online: https://www.unicef.org/mozambique/en/cyclone-idai-and-kenneth (accessed on 10 May 2022).
  16. Suit, K.C.; Choudhary, V. Mozambique agricultural sector risk assessment, 2015.
  17. Parkinson, V. Climate learning for African agriculture: the case of Mozambique. University of Greenwich: London, UK, 2013, pp. 1–62.
  18. Coetzee, K. Climate Change and Trade: The Challenges for Southern Africa, 2011.
  19. Ministério do Mar, Águas Interiores e Pesca. Elaboração do plano de ordenamento do espaço marítimo [Preparation of the maritime spatial planning plan], 2020.
  20. Uele, D.I.; Lyra, G.B.; Oliveira, J.F.d. Variabilidade espacial e intranual das chuvas na região sul de moçambique, África Austral. Rev Bras de Meteorol 2017, 32, 473–484. [Google Scholar] [CrossRef]
  21. WHO. Protecting health from climate change: vulnerability and adaptation assessment, World Health Organization. 2013.
  22. Fritzsche, K.; Schneiderbauer, S.; Bubeck, P.; Kienberger, S.; Buth, M.; Zebisch, M.; Kahlenborn, W. The Vulnerability Sourcebook: Concept and guidelines for standardised vulnerability assessments, 2014.
  23. United Nations Office for Disaster Risk Reduction. Desinventar Sendai 10.1.2-User Manual Administration and Data Management, 2019.
  24. Adger, W.; Agrawala, S.; Mirza, M.; Conde, C.; O’Brien, K.; Pulhin, J.; Pulwarty, R.; Smit, B.; Takahashi, K. Assessment of adaptation practices, options, constraints and capacity. Climate change 2007: impacts, adaptation and vulnerability. In Contribution of working group II to the fourth assessment report of the intergovernmental panel on climate change; Cambridge University Press: United Kingdom, 2007; pp. 717–743. [Google Scholar]
  25. Schröter, D.; Polsky, C.; Patt, A.G. Assessing vulnerabilities to the effects of global change: an eight step approach. Mitig Adapt Strateg Glob Chang 2005, 10, 573–595. [Google Scholar]
  26. Rao, C.A.R.; Raju, B.M.K.; Rao, A.V.M.S.; Rao, K.V.; Rao, V.U.M.; Ramachandran, K.; Venkateswarlu, B.; Sikka, A.K.; Rao, M.S.; Maheswari, M.; et al. A district level assessment of vulnerability of Indian agriculture to climate change. Curr Sci 2016, 110, 1939–1946. [Google Scholar]
  27. Field, C.B.; Barros, V.; Stocker, T.F.; Dahe, Q. Managing the risks of extreme events and disasters to advance climate change adaptation: special report of the intergovernmental panel on climate change; Cambridge University Press, 2012.
  28. O’Brien, K.; Leichenko, R.; Kelkar, U.; Venema, H.; Aandahl, G.; Tompkins, H.; Javed, A.; Bhadwal, S.; Barg, S.; Nygaard, L.; et al. Mapping vulnerability to multiple stressors: climate change and globalization in India. Glob Environ Change 2004, 14, 303–313. [Google Scholar] [CrossRef]
  29. Downing, T.E. Choosing Methods in Assessments of Vulnerable Food Systems, 2008.
  30. Krellenberg, K.; Welz, J. Assessing Urban Vulnerability in the Context of Flood and Heat Hazard: Pathways and Challenges for Indicator-Based Analysis. Soc Indic Res 2017, 132, 709–731. [Google Scholar] [CrossRef]
  31. Truong, D.D.; Dat, T.T.; Hang, N.D.; Huan, L.H. Vulnerability Assessment of Climate Change in Vietnam: A Case Study of Binh Chanh District, Ho Chi Minh City. Front Environ Sci 2022, 10. [Google Scholar] [CrossRef]
  32. Nguyen, T.T.; Bonetti, J.; Rogers, K.; Woodroffe, C.D. Indicator-based assessment of climate-change impacts on coasts: A review of concepts, methodological approaches and vulnerability indices. Ocean Coast Manag 2016, 123, 18–43. [Google Scholar]
  33. Gbetibouo, G.A.; Ringler, C.; Hassan, R. Vulnerability of the South African farming sector to climate change and variability: An indicator approach. Nat Resour Forum 2010, 34, 175–187. [Google Scholar] [CrossRef]
  34. Luh, J.; Christenson, E.C.; Toregozhina, A.; Holcomb, D.A.; Witsil, T.; Hamrick, L.R.; Ojomo, E.; Bartram, J. Vulnerability assessment for loss of access to drinking water due to extreme weather events. Climatic change 2015, 133, 665–679. [Google Scholar]
  35. Shah, K.U.; Dulal, H.B.; Johnson, C.; Baptiste, A. Understanding livelihood vulnerability to climate change: Applying the livelihood vulnerability index in Trinidad and Tobago. Geoforum 2013, 47, 125–137. [Google Scholar]
  36. Su, J.G.; Morello-Frosch, R.; Jesdale, B.M.; Kyle, A.D.; Shamasunder, B.; Jerrett, M. An Index for Assessing Demographic Inequalities in Cumulative Environmental Hazards with Application to Los Angeles, California. Environ Sci Technol 2009, 43, 7626–7634. [Google Scholar] [CrossRef] [PubMed]
  37. Hahn, M.B.; Riederer, A.M.; Foster, S.O. The Livelihood Vulnerability Index: A pragmatic approach to assessing risks from climate variability and change—A case study in Mozambique. Glob Environ Change 2009, 19, 74–88. [Google Scholar] [CrossRef]
  38. R Core Team. R: A Language and Environment for Statistical Computing, R Foundation for Statistical Computing, Vienna, Austria. 2022.
  39. Instituto Nacional de Estatística. IV Recenseamento geral da população e habitação 2017-Resultados definitivos [IV General Census of Population and Housing 2017-Definitive Results], 2019.
  40. Ministério da Saúde. Service Availability and Rediness Assessment (SARA) 2018: Inventário Nacional, 2018.
  41. Instituto Nacional de Estatística. Relatório Final do Inquérito ao Orçamento Familiar- IOF 2014/15, 2015.
  42. Mavume, A.F.; Banze, B.E.; Macie, O.A.; Queface, A.J. Analysis of Climate Change Projections for Mozambique under the Representative Concentration Pathways. Atmosphere 2021, 12. [Google Scholar] [CrossRef]
  43. Cabral, P.; Augusto, G.; Akande, A.; Costa, A.; Amade, N.; Niquisse, S.; Atumane, A.; Cuna, A.; Kazemi, K.; Mlucasse, R.; et al. Assessing Mozambique’s exposure to coastal climate hazards and erosion. International journal of disaster risk reduction 2017, 23, 45–52. [Google Scholar] [CrossRef]
  44. Mondlane, A. Floods and droughts in Mozambique–the paradoxical need of strategies for mitigation and coping with uncertainty. WIT Transactions on Ecology and the Environment 2004, 77. [Google Scholar]
  45. Silva, J.A.; Eriksen, S.; Ombe, Z.A. Double Exposure in Mozambique’s Limpopo River Basin. The Geographical Journal 2010, 176, 6–24. [Google Scholar] [CrossRef]
  46. Mongo, E.; Cambaza, E.; Nhambire, R. Outbreak of cholera due to cyclone Idai in central Mozambique (2019). In Evaluation of Health Services; IntechOpen, 2019.
  47. Mugabe, V.A.; Gudo, E.S.; Inlamea, O.F.; Kitron, U.; Ribeiro, G.S. Natural disasters, population displacement and health emergencies: multiple public health threats in Mozambique. BMJ Glob Health 2021, 6, e006778. [Google Scholar] [CrossRef]
  48. Secretariado de Técnico de Segurança Alimentar e Nutricional. Relatório da Avaliação da Situação de Insegurança Alimentar e Nutricional Aguda Póschoque de Abril - Maio de 2019, 2019. Accessed: 22022-02-26.
  49. Atanga, R.A.; Tankpa, V. Climate Change, Flood Disaster Risk and Food Security Nexus in Northern Ghana. Front Sustain Food Syst, 2021, p. 273. [CrossRef]
  50. Secretariado de Técnico de Segurança Alimentar e Nutricional. Relatório da Monitoria da Segurança Alimentar e Nutricional em Moçambique (versão final)”, 2007.
  51. Smit, B.; Pilifosova, O.; Burton, I.; Challenger, B.; Huq, S.; Klein, R.; Yohe, G.; Adger, W.; Downing, T.; Harvey, E. Adaptation to climate change in the context of sustainable development and equity. In Climate Change 2001: Impacts, Adaptation and Vulnerability; Cambridge University Press: United Kingdom, 2001; pp. 877–912. [Google Scholar]
  52. Smith, J.B.; Lenhart, S.S. Climate change adaptation policy options. Clim Res 1996, 6, 193–201. [Google Scholar] [CrossRef]
  53. INS, INE, and ICFI. Moçambique Inquérito Demográfico e de Saúde 2011, 2013. Available online: https://dhsprogram.com/pubs/pdf/fr266/fr266.pdf.
  54. dos Anjos Luis, A.; Cabral, P. Geographic accessibility to primary healthcare centers in Mozambique. Int J Equity Health 2016, 15, 1–13. [Google Scholar] [CrossRef] [PubMed]
  55. Chao, S.; Kostermans, K. Improving health for the poor in Mozambique: the fight continues, 2002.
  56. Bao, X.; Zhang, F. How Accurate Are Modern Atmospheric Reanalyses for the Data-Sparse Tibetan Plateau Region? J Clim 2019, 32, 7153–7172. [Google Scholar] [CrossRef]
  57. Ministério para a Coordenação Ambiental. Estratégia Nacional de Adaptação e Mitigação de Mudanças Climáticas [National Strategy for Adaptation and Mitigation of Climate Change], 2012.
  58. UNICEF. Massive flooding in Mozambique, Malawi and Zimbabwe, 2019. Acessed: 2022-09-09.
  59. International Labour Organization. Green Jobs: Improving the Climate for Gender Equality Too! International Institute for Labour Studies. 2008.
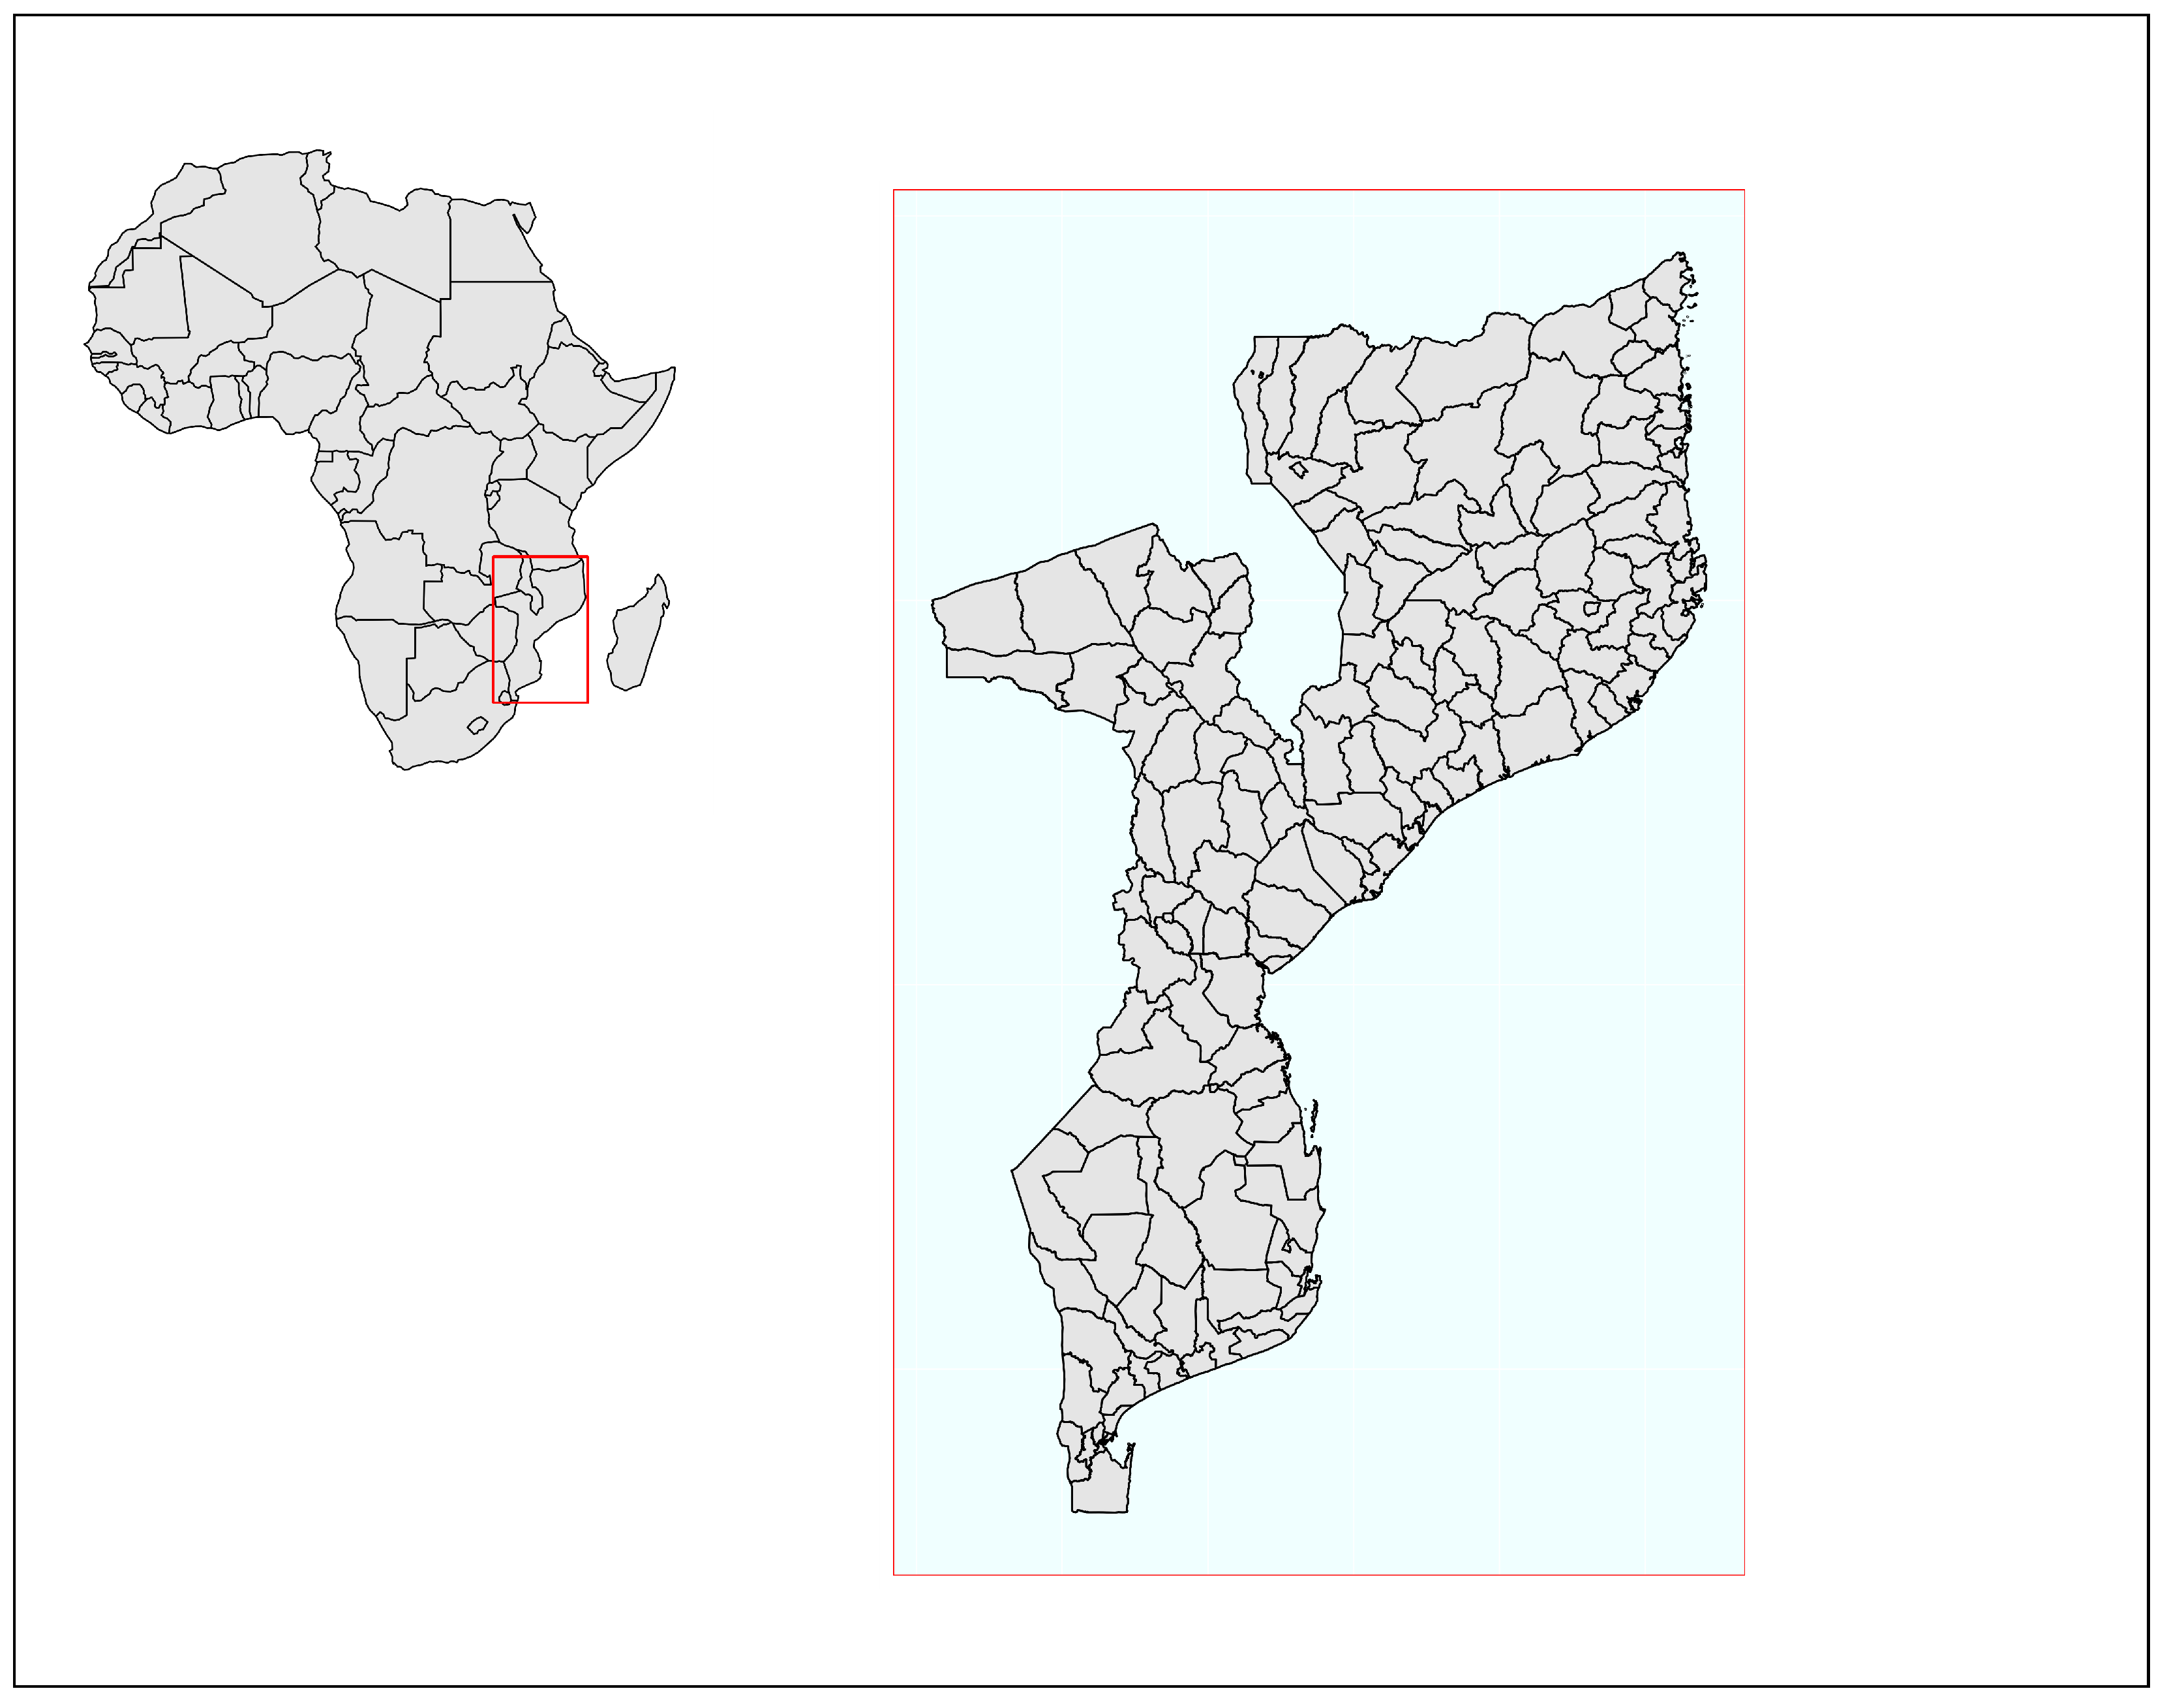
Figure 1. Study area map. On the left we have the African continent marked with a red square in the study area. On the right, we have the map of Mozambique corresponding to the study area.
Preprints 75222 g001
Figure 2. Spatial distribution on climate variable variation. Figure (a) shows the spatial distribution of temperature variation. (b) shows the spatial distribution of rainfall variation and (c) shows the spatial distribution of relative humidity variation for a period between 1979 and 2016.
Preprints 75222 g002
Figure 3. Spatial distribution of extreme events. Maps (a), (b) and (c) show the incidence of cyclones, droughts and floods for each district across the country, respectively. Extreme events are reported between 1979 and 2019.
Preprints 75222 g003
Figure 4. Spatial distribution of exposure (a), sensitivity (b), and adaptive capacity index (c) at the district level across the country. Map (d) shows the spatial distribution of adaptive capacity excluding extreme values, which coincide with the main capital cities.
Preprints 75222 g004
Figure 5. Maps of health vulnerability index by districts. Map (a) presents the global health vulnerability index (GHVI) without discarding extreme values, and Map (b) shows the GHVI discarding extreme values.
Preprints 75222 g005
Figure 6. Spatial distribution of health vulnerability index (HVI) to specific hazards. Maps (a), (b) and (c) show the HVI to droughts, floods, and cyclones, respectively. The HVI to specific hazards was computed for each of the 161 districts.
Preprints 75222 g006
Disclaimer/Publisher’s Note: The statements, opinions and data contained in all publications are solely those of the individual author(s) and contributor(s) and not of MDPI and/or the editor(s). MDPI and/or the editor(s) disclaim responsibility for any injury to people or property resulting from any ideas, methods, instructions or products referred to in the content.
Copyright: This open access article is published under a Creative Commons CC BY 4.0 license, which permit the free download, distribution, and reuse, provided that the author and preprint are cited in any reuse.
Prerpints.org logo

Preprints.org is a free preprint server supported by MDPI in Basel, Switzerland.

Subscribe

© 2024 MDPI (Basel, Switzerland) unless otherwise stated