1. Introduction
The release of Green House Effect Gases (GHG), which contributes to the acceleration of global warming, and atmospheric pollution, which is to blame for the degradation of air quality in a great many urban places, are two of the most important environmental challenges in the world today. These concerns, along with others about energy usage and the long-term viability of current energy sources, are inextricably connected [
1]. The climate and energy policy of the European Union (EU) strives to reach particular targets relating to the issue of climate change in order for it to be effective. These targets include an increase in energy efficiency by 20%, a reduction in emissions of greenhouse gases by 20%, and an increase in the share of renewable energy sources in overall EU consumption by 20%. In its policy framework for climate and energy for the year 2030, which was presented by the European Commission at the beginning of 2014 [
2,
3], more ambitious goals were proposed by the European Commission to reduce greenhouse gas emissions, to facilitate the integration of renewable energy sources, and, in a nutshell, to make the economy and energy system of the European Union more competitive, secure, and sustainable.
Transmission network reconfiguration, often known as TNR, is an important optimization measure that is also used as a means for automating processes in electrical transmission networks. The transmission dispatcher considers the operational status whenever it decides whether a switch should be in the ON or OFF position during normal operations. As a result, it results in smoother loads, prevents overloads, improves voltage quality, lowers network losses, and increases efficiency [
4]. Isolating the area that is most likely to experience a power outage and restoring service as soon as the problem has been resolved are both good ways to reduce the impact of a power outage. TNR is the most essential method that can be used to improve the efficiency and security of the transmission system. TNR improves both the efficiency and security of the transmission system. The transmission network is comprised of a number of different switching devices. [
5]. A significant amount of research is being done right now on how to develop and improve the methodologies and algorithms used for transmission network optimization.
1.1. Context, Background and Motivation
In addition, the effective incorporation of EVs would call for adjustments to be made in the management and operation of today’s electrical power systems. Because the charging of electric vehicles can cause technical issues, mostly at the distribution level, such as voltage limitations being violated or line congestion, widespread adoption of EVs will provide system operators with new obstacles. These new hurdles will arise as a result of the widespread adoption of EVs. For this reason, it is interesting to build tools and techniques that allow dealing with these or anticipating the repercussions of their occurrence. In addition, forthcoming companies that are going to be accountable for adhering to the mobility needs of EVs will make their way through the current legislative framework and business models. GA is an algorithm for global optimization that relies on a random search process. According to transmission network optimization, this program has had a positive impact. This is a linear-based random search technique. It surpasses several other algorithms in global search, but its performance in local search is highly sensitive to disparity [
6].
While simulated annealing’s local search is effective in global search, it falls short in local search and progresses slowly. In order to identify the best possible solution, GA uses the randomness and jumping properties of simulated annealing (SA). When newcomers to Georgia arrive at home, they often forget to ask their parents for vital information. PSO is superior to GA in terms of adaptability, memory efficiency, and speed of convergence [
7]. However, when it comes to global convergence, GA far outperforms PSO. This research demonstrates that HGAPSO can be used to address the problem of multi-objective transmission network optimization. The strengths of GA and PSO are combined in HGAPSO. A reliable and effective transmission network testing system, double-checked with four distinct transmission network testing methods The power transmission system makes use of both section switches and intercom-section switches. TNR’s key role is to determine if switches are on or off [
8] so that network loss can be minimized. We use the following objective function to find the network topology that causes the least amount of loss: Vi is the voltage at the end of n lines, where n is the number of lines in the network, and Qi is the reactive power flow of those lines [
8].
1.2. Problem Statement
For the purpose of minimizing power loss, the use of optimization techniques to the redesign of electrical transmission networks has yielded significant results. This study report employs the HGAPSO, a Bioinspired intelligent-based optimization method, for the alteration of electrical transmission networks. Therefore, the use of a hybrid method, i.e., the combination of GA and PSO, is applied in this study to reconfigure the power system, to minimize the overall power losses. The HGAPSO method inherit the positive characteristics of the GA and PSO algorithms while avoiding their negative characteristics.
The employment of optimization methodologies for the Reconfiguration of electrical transmission networks has produced impressive results in terms of minimizing power loss and improving voltage profile. HGAPSO, a bio-inspired, intelligent-based strategy that selectively opens and closes switches in the Transmission system, is the optimization method utilized in this research study for the alteration of the electrical transmission network The challenges associated with this research include determining which switches ought to be closed and which ought to be opened in order to adjust the system in order to achieve reactive power control and low power loss. There is a wealth of information regarding the GA and PSO algorithms within the available literature. There are two distinct kinds of switches: sectionalizing switches and tie switches. In addition to that, the problem statement will include;
The process of determining which switch or isolator in a power system should be actuated, based on the load flow, the reactive power control limit, and the power loss sensitivities of the system.
A hybrid strategy that combines GA and PSO is used to address the load flow problem for operated isolators. This approach takes into account the constraints that must be satisfied.
In order to evaluate the effectiveness of the proposed algorithm, a representative electrical transmission network, known as the IEEE-30-bus test system, is utilized.
1.3. Research aims and objectives
This research study aims to produce a better optimization strategy that can be used to apply to the Reconfiguration of electrical power networks as its intended application. The iterative process of the algorithm takes into account restrictions such as the minimization of the real power loss, the setting of a limit on the reactive power, and the preservation of steady voltage amplitude. These are just some of the limitations that the algorithm must take into account. In addition to these primary aims, the study has a variety of supplementary objectives. An enhanced optimization technique is proposed in this piece of research; it has the potential to be utilized in a variety of different scenarios involving changes to electrical power networks. The iterative process of the algorithm takes into account limitations, such as the minimization of the real power loss, the setting of a limit on the reactive power, and the preservation of steady voltage amplitude, among other things. The following is a list of additional objectives for the study:
The development of the HGAPSO algorithm, which is a hybrid of the GA and PSO algorithms, is intended to be the end result of this research. This algorithm is intended to be used for the improvement of electrical transmission networks.
There will be certain changes made to the system in order to lessen the amount of power that is lost and to improve the voltage profiles for the incorporation of electric vehicles.
1.4. Contributions of the study
The proposed algorithm’s formulation is based on optimization problems with the ultimate goal of increasing the total profit for all the involved parties. Load shifting has the potential to reduce energy costs and improve the reliability of the power grid by flattening the demand curve. Integration of electric vehicles with renewable sources is also simplified by consideration of the distribution of electricity supplied by generators. The Transmission companies will immediately benefit from this study effort for the reasons that are listed below:
Independent Power Producers (IPP) will be able to integrate low-scale renewable energy sources into their networks in a manner that is both simpler and more reliable as a direct result of the efforts that have been put forward here. This is extremely important in light of the fact that the power generation industry is transitioning to green energy; and
The findings of this research will also have a substantial impact on a number of other individuals. Customers will benefit from this since they will be able to use their gadgets with confidence thanks to stable voltage profiles.
1.5. Research Questions
The following question will be answered once an investigation of the sample electrical power network, including the functioning of isolators for system change, has been carried out:
1.6. Paper Structure
The first part of this paper is called the introduction, and it discusses the fundamentals of the electrical Transmission network. This section also discusses ways to reduce the amount of electricity that is lost throughout the system. In the second part of our study of the relevant literature, we will cover various optimization algorithms used for power system analysis. The rationale behind selecting the proposed optimization algorithm is broken down and examined in
Section 3, which is the methodology section and contains an in-depth analysis of each of the various optimization strategies. The suggested algorithm and its flowchart are examined in excruciating depth throughout the entirety of
Section 3. Tables and graphs are used in
Section 4 to display the results of the data collection that was performed. In addition to that, the data that were obtained are analyzed and broken down in a great deal of depth in this section. A conclusion is given in the fifth section of the document.
2. Literature Review
2.1. Electric Vehicles
EVs are another form of storing electric energy, but they have the potential to alter their location within the electric system. This means that they can be present at different nodes of the grid for varying amounts of time, which is important to keep in mind when thinking about how EVs fit into the overall picture of the network. Even if EVs can be a component of agents that contain multiple assets in line with the stated framework, the concept of an electric vehicle manager, also known as an electric vehicle aggregator, is something that the research community is contemplating [
9,
10]. The relationship that electric vehicles can have with the power grid is another significant aspect of this technology. On the one hand, EVs are said to charge in an unregulated manner, which is also frequently referred to as “dumb charging,” when they operate freely without any form of centralized control action. Consequently, owners of electric vehicles are free to charge their vehicles whenever and wherever they see fit. Despite the fact that numerous charging patterns are feasible, numerous research conducted in Europe and the United States reveal common behaviors for electric vehicle charging. As a result, electric vehicles (EVs) can only be charged at the end of the day; whenever it is possible and convenient; or whenever the battery is near to run out, as stated in [
11].
Depending on the time frame that is being addressed, electric vehicles (EVs) can also be charged at home, in public business places, or even at work. On the other hand, electric vehicles are considered to charge in a controlled way if they are operated under the management of an external company or an aggregator of EVs. In this scenario, the EV aggregator is looking into new business lines that will be to its advantage as well as the owners of the EVs [
12,
13]. EV aggregators have the ability to locate more advantageous charging time periods, which is to say, times when the cost of the energy is lower, or, at the same time, they have the ability to take advantage of the capabilities that EVs could give through vehicle to grid (V2G). With regard to the latter component, there are a few ancillary services that have been deemed appropriate for the provision of EV services [
14].
2.2. Radial Transmission Network
The power transmission system was designed so that consumer loads could be supplied with low-voltage electric current. This was accomplished through the development of the electrical power transmission system. Radial and ring transmission networks are the two categories that can be used to classify transmission networks [
15,
16]. A ring transmission system is depicted in
Figure 1 as having its final destination as the supply substation. As can be seen in the diagram, the feeders for this system are organized in a ring configuration.
Figure 1 depicts the radial transmission system, which includes separate feeders that all come from a single substation. This configuration can be found in the system. This network modification is done at the radial transmission network [
17] in order to fulfill one of the requirements.
2.3. Genetic Algorithm
Jalilzadeh, Galvani, Hos-einian, and Razavi created a method in which they found the optimal values for fixed and switched capacitors in Transmission networks. This method was based on RCGA, which stands for real coded genetic algorithm. It was published in [
18]. In order to represent the loads at a variety of load levels, several different kinds of capacitors that are commercially accessible were used. The RCGA approach was employed in this investigation so that the optimal capacitor rate could be determined. Boyerahmadi and Poor looked at voltage profiles in transmission networks for their research that was published in [
19], which was based on genetic algorithms. In order to enable the improvement of voltage profiles in end busses that are located a significant distance from slack buses, reactive power injection was used. The evolutionary algorithm was utilized in order to arrive at the most effective reactive power injection parameters. Because of this strategy, both the voltage profile and the amount of loss were significantly reduced.
Genetic algorithms were responsible for establishing both the size of the DG units as well as their positions, as stated by Auglt, Hooshmand, and Ataei in their study [
20]. (GA). The approaches that are based on cost functions yield the optimal solution; nevertheless, these approaches are computationally expensive and have a slow convergence rate. They have discovered a solution to the problem in terms of costs; however, the calculations that are involved in the cost function may lead to confusion regarding the actual size of DG units at locations that are suited for them. Real-Coded Genetic Algorithm (RCGA) was utilized by Rah-Mat-Allah Hooshmand in the study [
21] to tackle the problem of where to organize capacitor banks in unbalanced distributed systems with mesh/radial designs. In order to get the best possible results in terms of minimizing losses and keeping voltage under control, transmission systems made full use of both fixed and switching capacitors to the extent of their respective potentials.
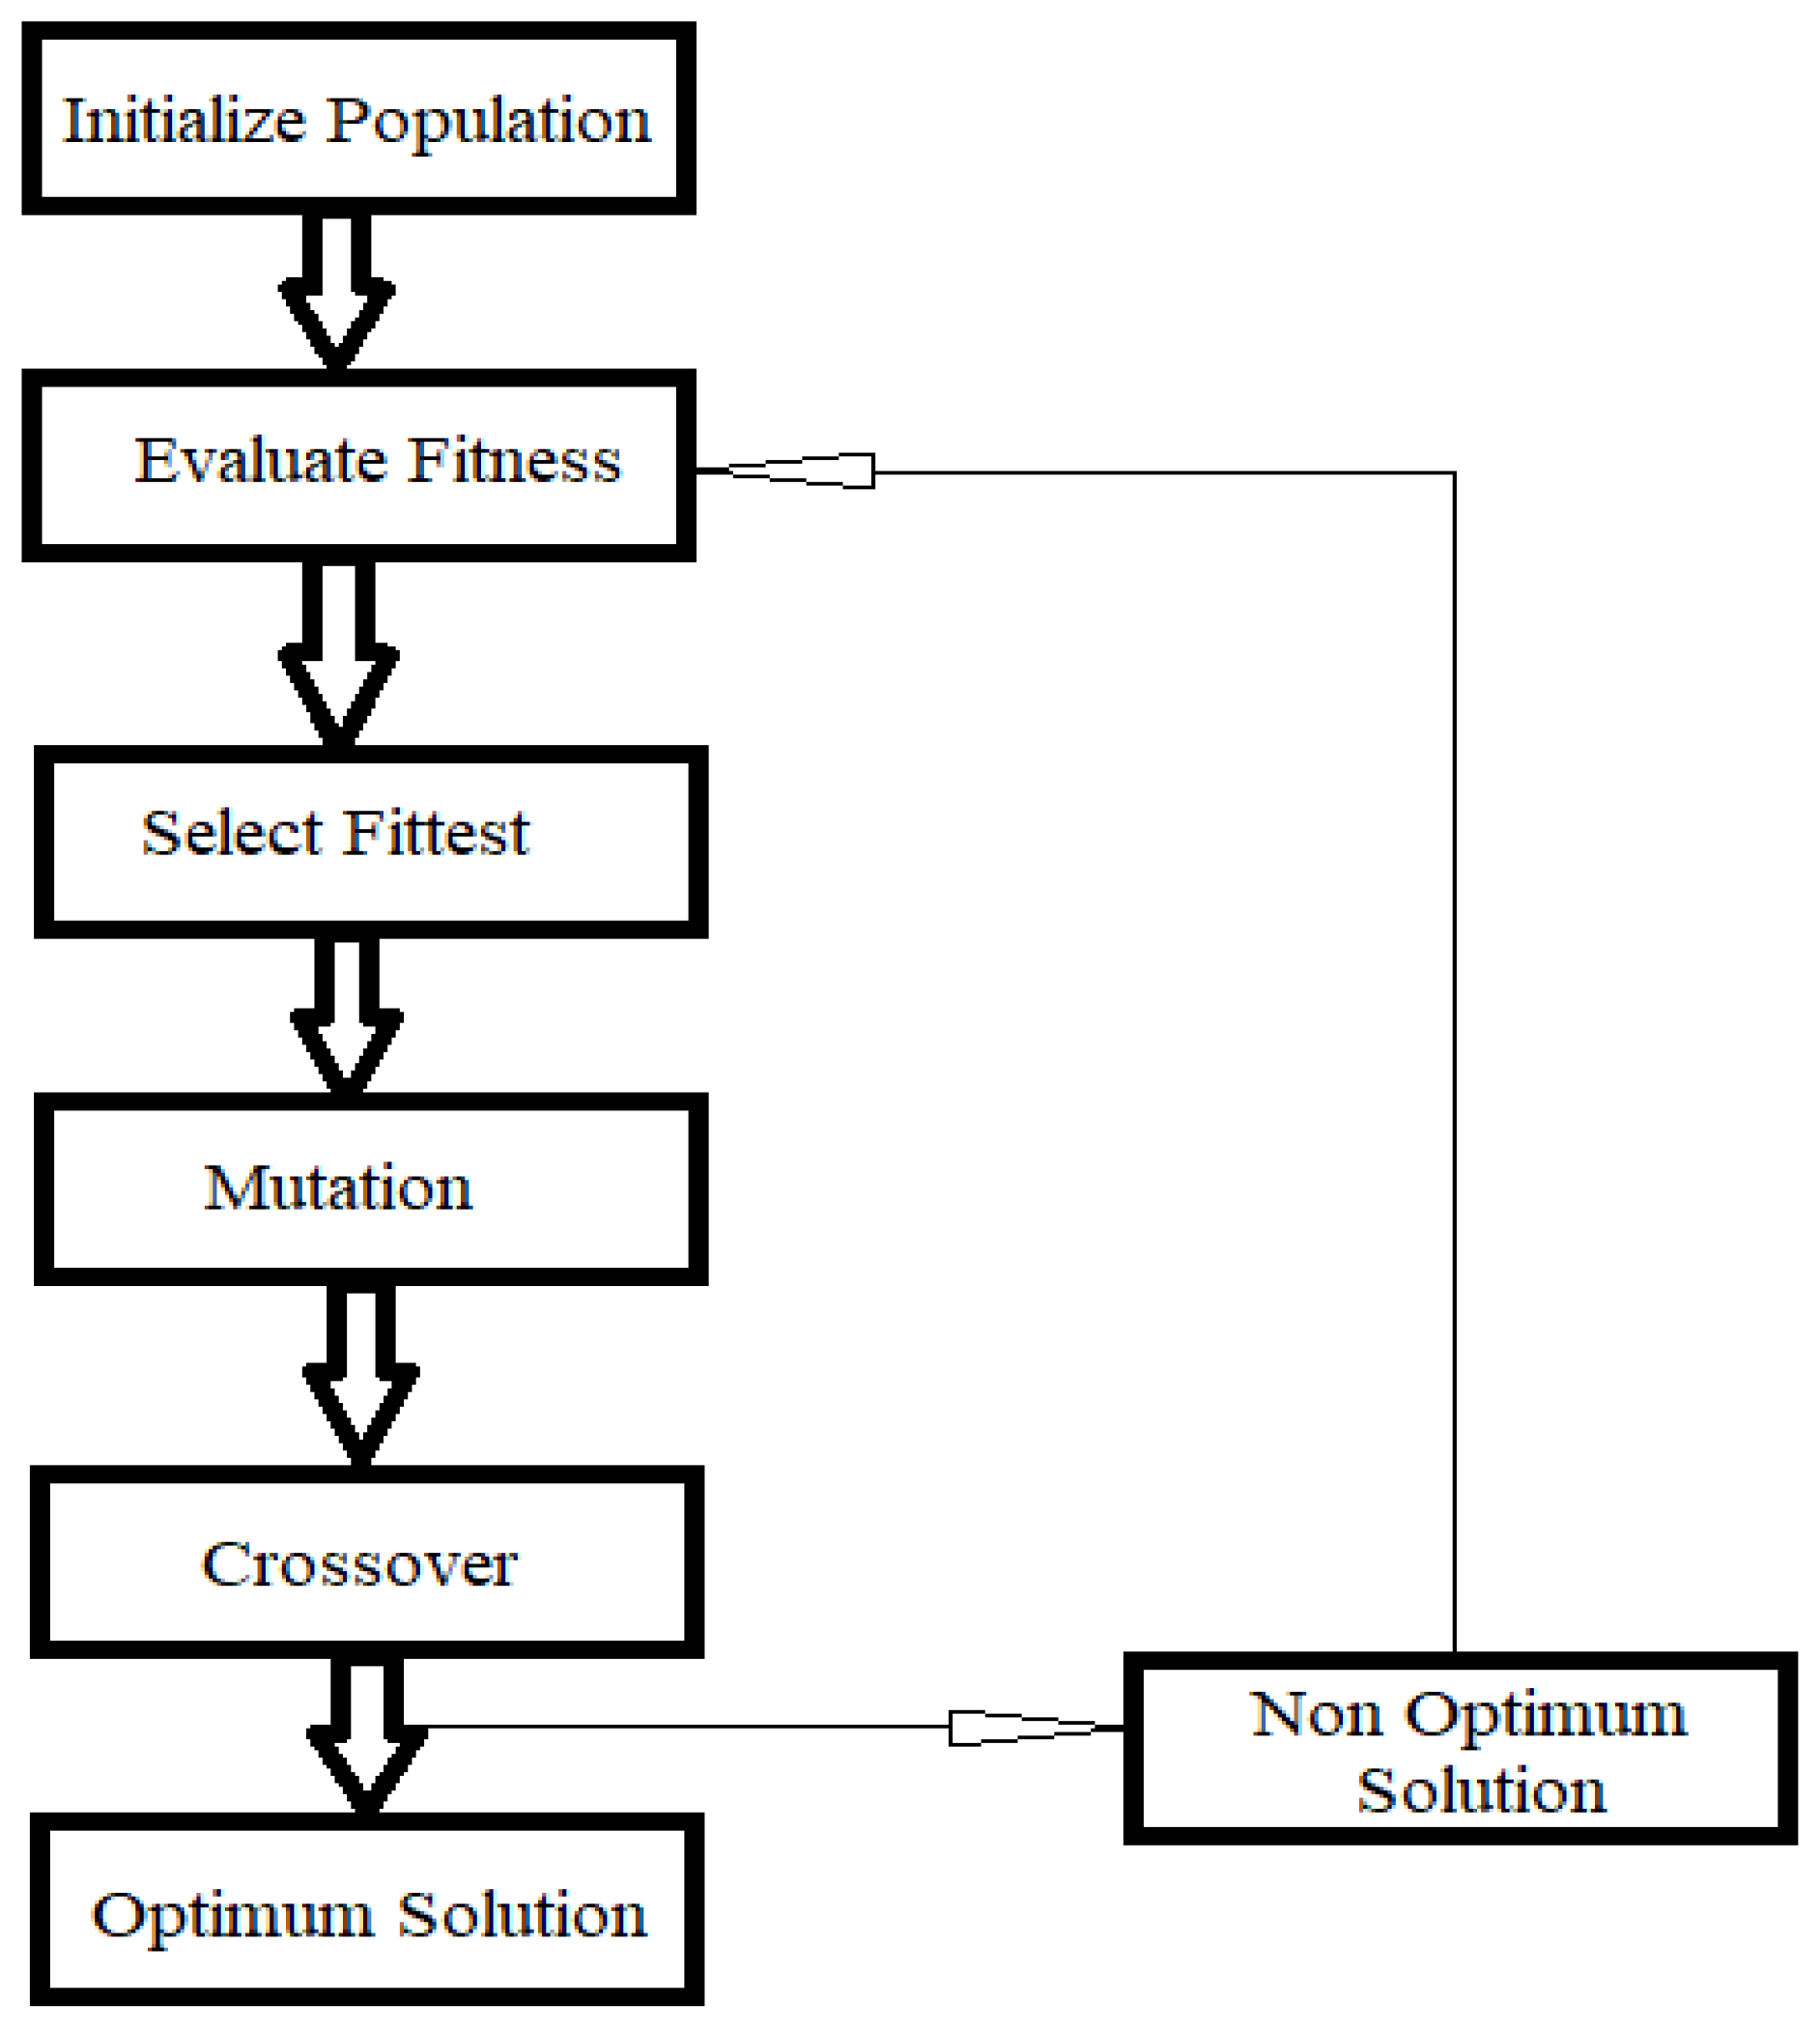
In GA, the population adjusts to its surroundings by imitating the biological processes that take place inside an ecosystem as it moves through subsequent generations. Genetic algorithms, which are methods of unconstrained optimization, were used to mimic the fundamental idea of evolutionary adaptation. Because the GA standard optimization parameters are stored as a string of binary code [
22], the GA gene itself is a representation of a binary code. Chromosomes are formed when genes are arranged in specific patterns and then joined. The following are some ways that GA is different from traditional optimization and search techniques. The flowchart for a genetic algorithm is shown in
Figure 2, which can be accessed here.
Rather than being parameterized in GA, parameters are typically coded;
This technique searches over a population of points as opposed to a single point, and it does so by relying just on objective functions rather than other information, such as derivatives.; and
By eliminating the use of derivatives, only objective functions are used instead.
GA offers several advantages, namely:
The gradient of the response surface does not understand;
They may be applied to a wide range of optimization issues since they are not subject to local optimum trapping;
A vast set of solutions are scanned quickly
The end solution is not affected by bad proposals since they are simply discarded; and
Since it chooses its own behavior based on internal principles, the algorithm does not need to be familiar with the rules controlling the problem.
2.3.1. GA Parameters choice
For GA to converge rapidly, it is essential to select appropriate parameters. In the absence of any guidelines, there is a mechanism developed to determine these parameters in the method. The following are GA parameters [
23,
24,
25].
Initial population
Normally, the GA operates on an N-chromosome population. A random number is assigned to the first number in this population. This means that each vector represents one possible search solution. There are typically 2 to 2.5 times as many genes as there are in N populations.
Scaling
Sometimes, an objective function needs to be scaled into a fitness function by means of a scaling operator (a pre-processor). In the early phases of evolution, it tries to prevent premature convergence by preventing premature convergence, while in the later stages, it works to prevent premature convergence by speeding up convergence.
Criteria for termination
Following the calculation of fitness, the termination criterion needs to be determined. Several methods are used to determine this. Amongst them are the following:
After a certain amount of accuracy is achieved; and
There has been a pre-defined finite number of generations reached. A winner is declared and the problem solved based on the best match amongst the population.
Selection
Using this operator, chromosome fitness values are used to select good chromosomes and the resulting mating pool produced. There are a number of ways to accomplish this, but Roulette Wheel Selection is the most common. Roulette wheels are biased according to the fitness of each candidate solution. There are M strings in the population, so the wheel is spun M times. By performing this operation, the measure that is calculated reflects the fitness of candidates from the previous generation [
27].
Mutation and Crossover
Most crossovers and mutations on based on user preferences. Amongst them is the crossover operator. Chromosomes are mated in pairs and the mated pairs crossed over with a probability Pcross to generate candidate offspring. In general, there is a probability between 0.6 and 1.0 of parental chromosome crossover. The candidate offspring have some of their genes inverted with a probability of Pmut. In the GA, this operation is called mutation. As a result, a new population is generated. The mutation operator ensures that there is diversity within the population to prevent premature convergence. Usually, 0.01 or 0.1 is used to calculate the probability of mutation [
27].
Elitism
When a population is created, the chromosome with the worst number in the newly generated population is replaced by the chromosome with the best number in the population that came before it whenever the best number in the newly generated population is lower than that of the population that came before it. This guarantees that the algorithm will eventually converge on the correct solution. Elitism is the practice of maintaining one’s social standing through one’s parental lineage.
2.4. Algorithm for particle swarm optimization
Authors Mancer, Mahdad, and Srairi described in [
28] a better total voltage profile in power transmission systems by employing a method known as New Binnary Particle Swarm Optimization (NBPSO). This was made possible by ensuring that the ideal positioning of shunt capacitors was maintained within the framework of the system’s limitations. The NBPSO approach was able to locate the appropriate capacitor sizing and placements by utilizing a near global optimization strategy. This was made possible by the usage of the NBPSO method. Shunt capacitors were taken into account for both the sizing of the capacitors and their positioning in the circuit. A new study conducted by Mehdi Nafar [
29] made use of discrete particle swarm optimization (DPSO) to optimize the voltage profile of the transmission system and to reduce the amount of total harmonic distortion (THD) in a distributed generating and capacitor system. Their primary purpose was to develop a component that would put an end to the harmonic resonance that occurred between the reactance of the system and the reactance of the capacitor. The capacity of the generator, the maximum amount of voltage that could be applied, the number of capacitors that could be utilized, as well as their size, were all subject to constraints. For the purpose of determining whether or not the proposed method is useful, an altered version of the IEEE 33-bus test system was utilized.
Transmission planning ought to be carried out on a PSO-based foundation, as Hajizadeh and Hajizadeh propose in [
30]. They devised a multi-objective framework in order to achieve the most optimal sizing and positioning of dispersed generation assets inside transmission lines, hence cutting down on the costs associated with power loss. With the utilization of a PSO and a weighted approach, the technique that was adopted was able to successfully reach the optimal level of compromise between these two expenses. In the research carried out by Zou and Agalgaonkar [
31], shunt capacitors were utilized in order to set up voltage support zones in transmission networks. By numerically and analytically determining the target voltage zones, this strategy narrows the search space and makes it easier to find what you’re looking for. It is recommended that the investment cost for these components can be reduced by deploying DG units and shunt capacitors utilizing PSO in a strategic manner in order to provide overall voltage support and to reduce power loss.
2.4.1. Parameter choices of PSO
Particle Velocity
The limit places constraints on the speed that is currently being achieved. This parameter defines which regions between the current position and the target position will be explored in order to determine the resolution, also known as fitness, that may be obtained. As a direct consequence of this, particles travel in more substantial steps and, if the concentration is particularly high, may fail to take advantage of advantageous opportunities. When the concentration is too low, on the other hand, particles travel great distances before arriving at the required solutions. There is a possibility that their investigation is insufficient, and as a result, they get ensnared in the local minimal solution [
32].
Weighting Coefficients
At large values in the stochastic acceleration formula, the target region either crossed over it or came very close to it before disappearing. In the meantime, low values allow particles to stray further away from the target zone before they are brought back. It is feasible to adopt parameters inside the range as the number of iterations increases; however, in many applications, there are often constants. The project aims to control the rate at which other particles are influenced by their memories and to determine the typical values of their memories [
33].
Inertia Weight
By choosing an inertia weight that is appropriate for each exploration, a balance is achieved between global and local explorations. Exploration and exploitation balanced by the choice of the inertia weight. Typically, the optimization process starts with a large inertia weight and gradually reduces it throughout [
34].
Termination Criterion
In the following iterations of the initial phase, there are several updates and evaluations until a stopping condition is reached. There are generally two types of stopping condition: a predefined maximum number of iterations or a maximum level of precision
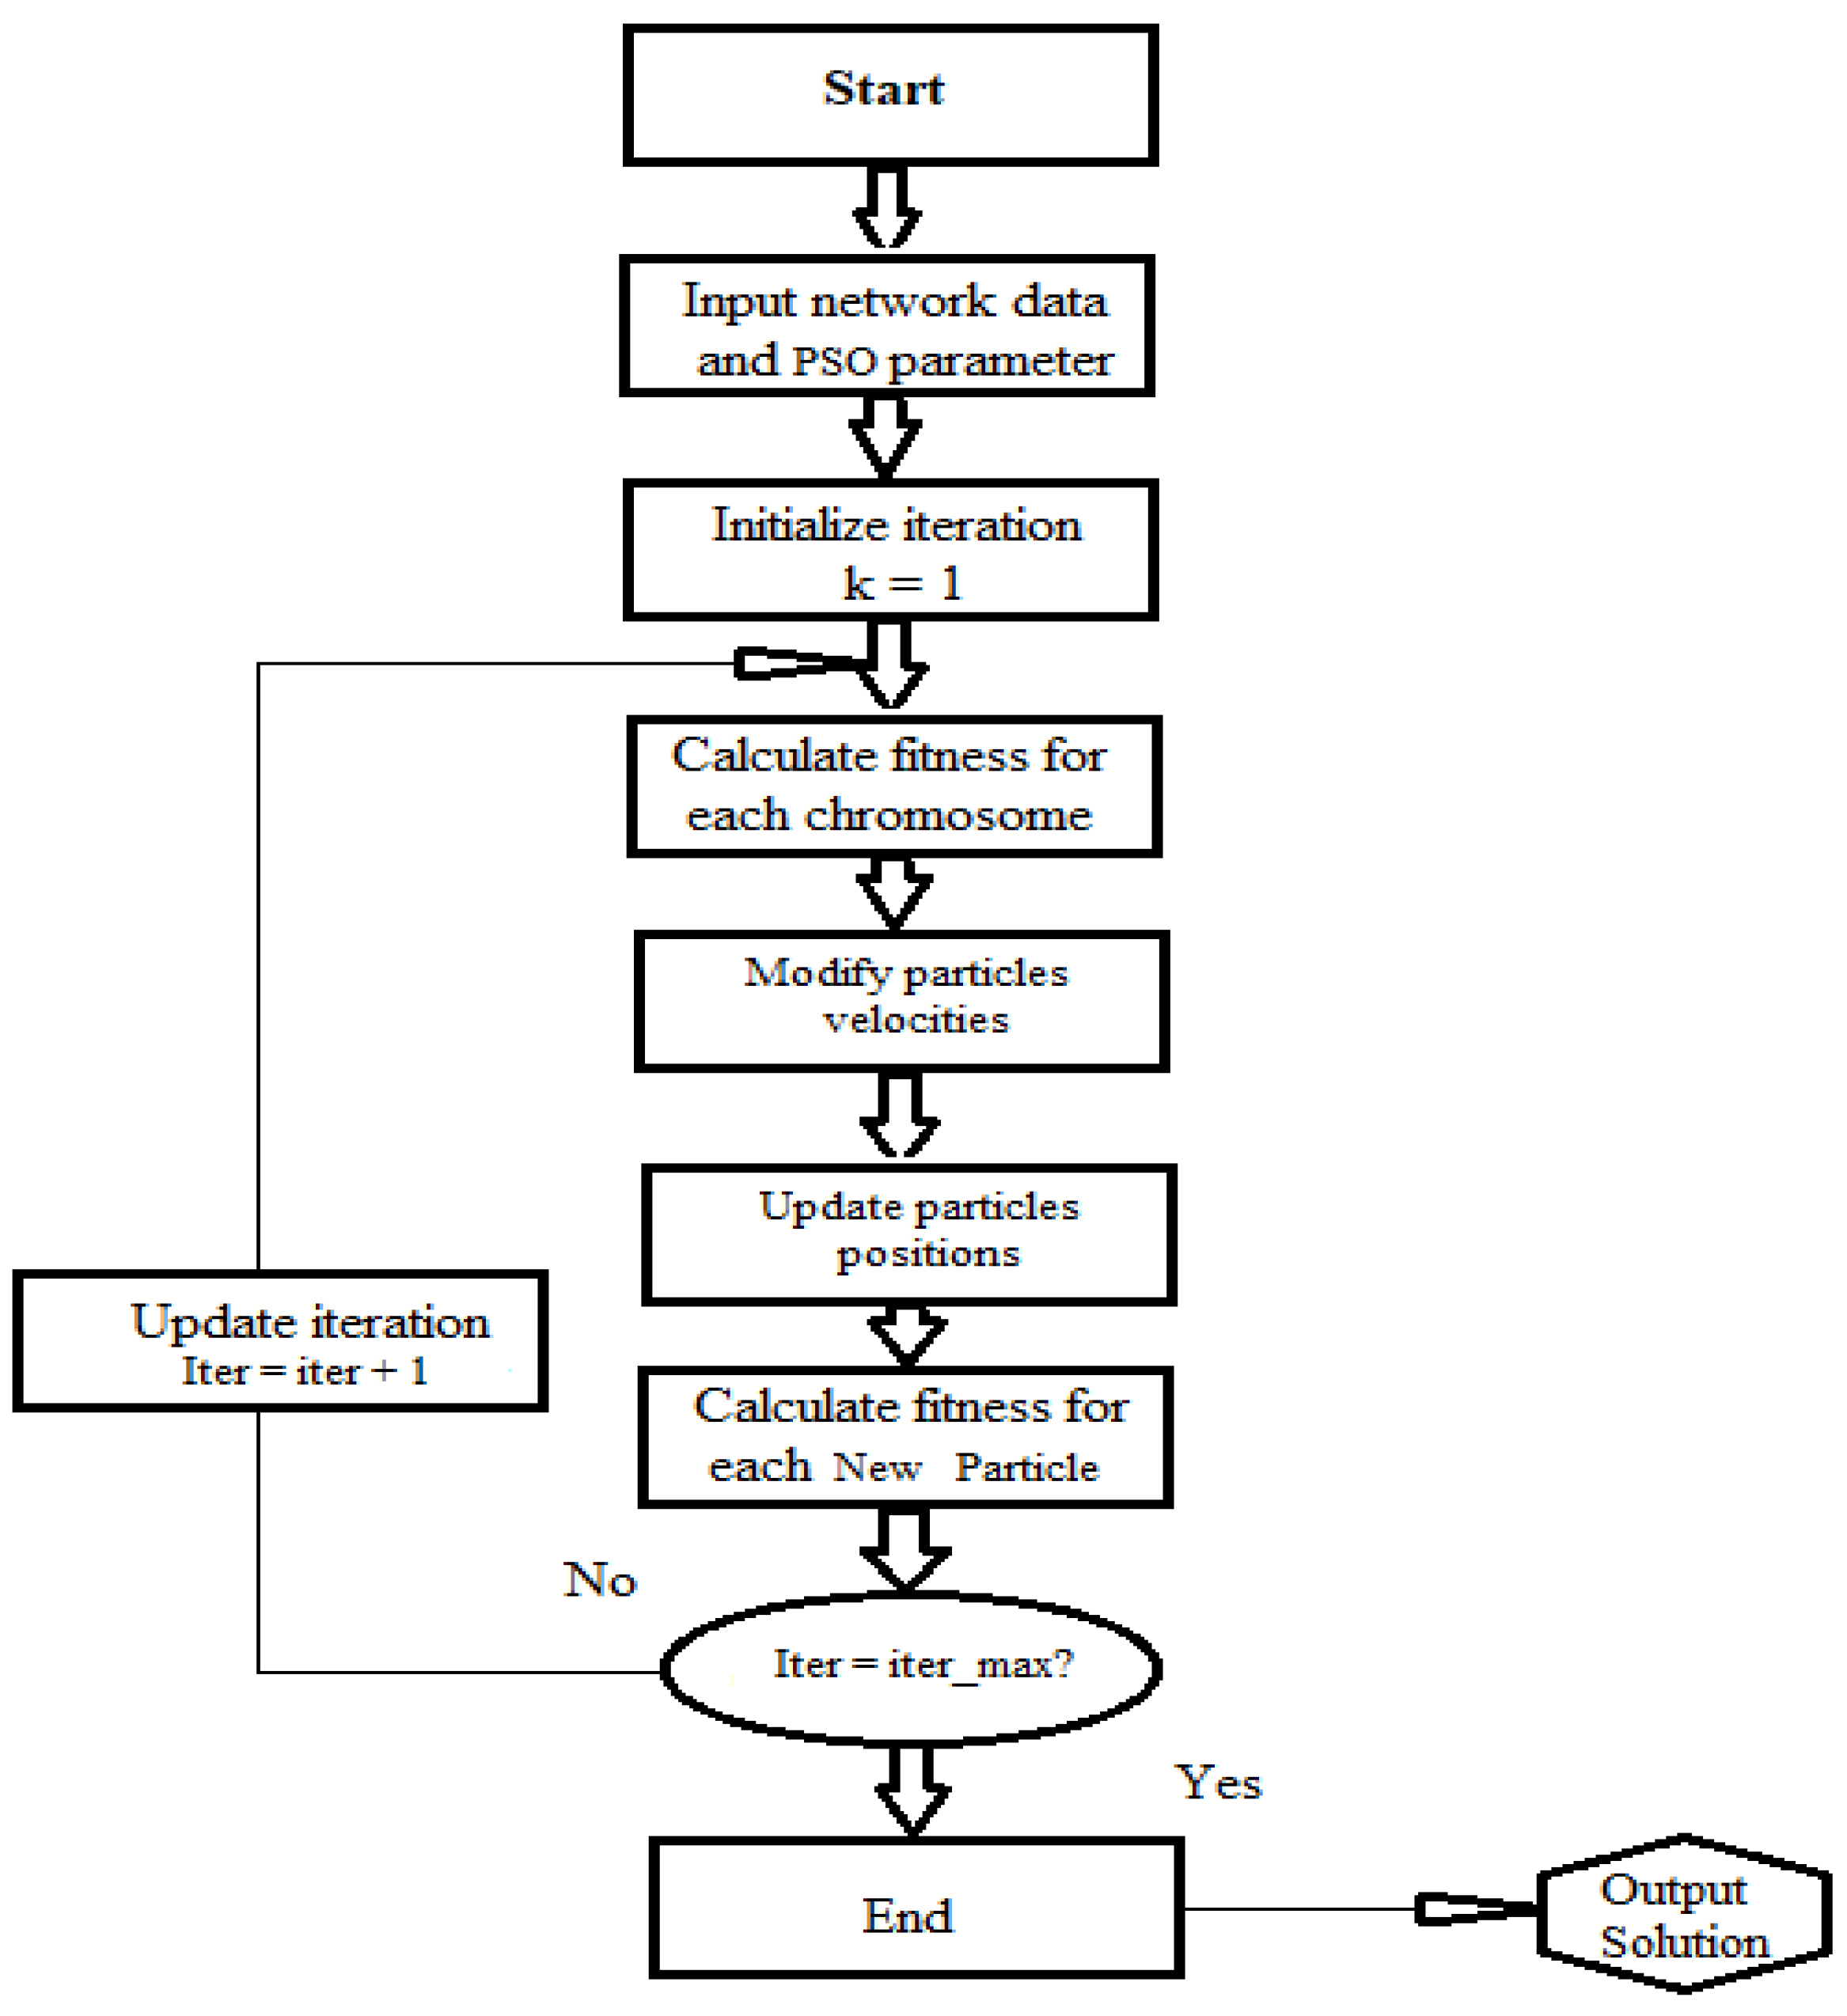
The population of the IPSO algorithm is made up of n particles, each of which represents a different possible solution to the problem at hand. Each individual particle is a real value vector with m dimensions, and the number of parameters that can be optimized for that particular particle is denoted by the letter m. These parameters serve as representations of the many dimensions that are included in the problem space. IPSO is a process that is broken down into a few different parts. In addition, the IPSO algorithm needs to be customized for every different kind of optimization problem that it is tasked with solving.
Figure 3 illustrates how a properly tailored IPSO method can be used to handle engineering optimization issues [
35].
3. Proposed Methodology
3.1. Test System Description
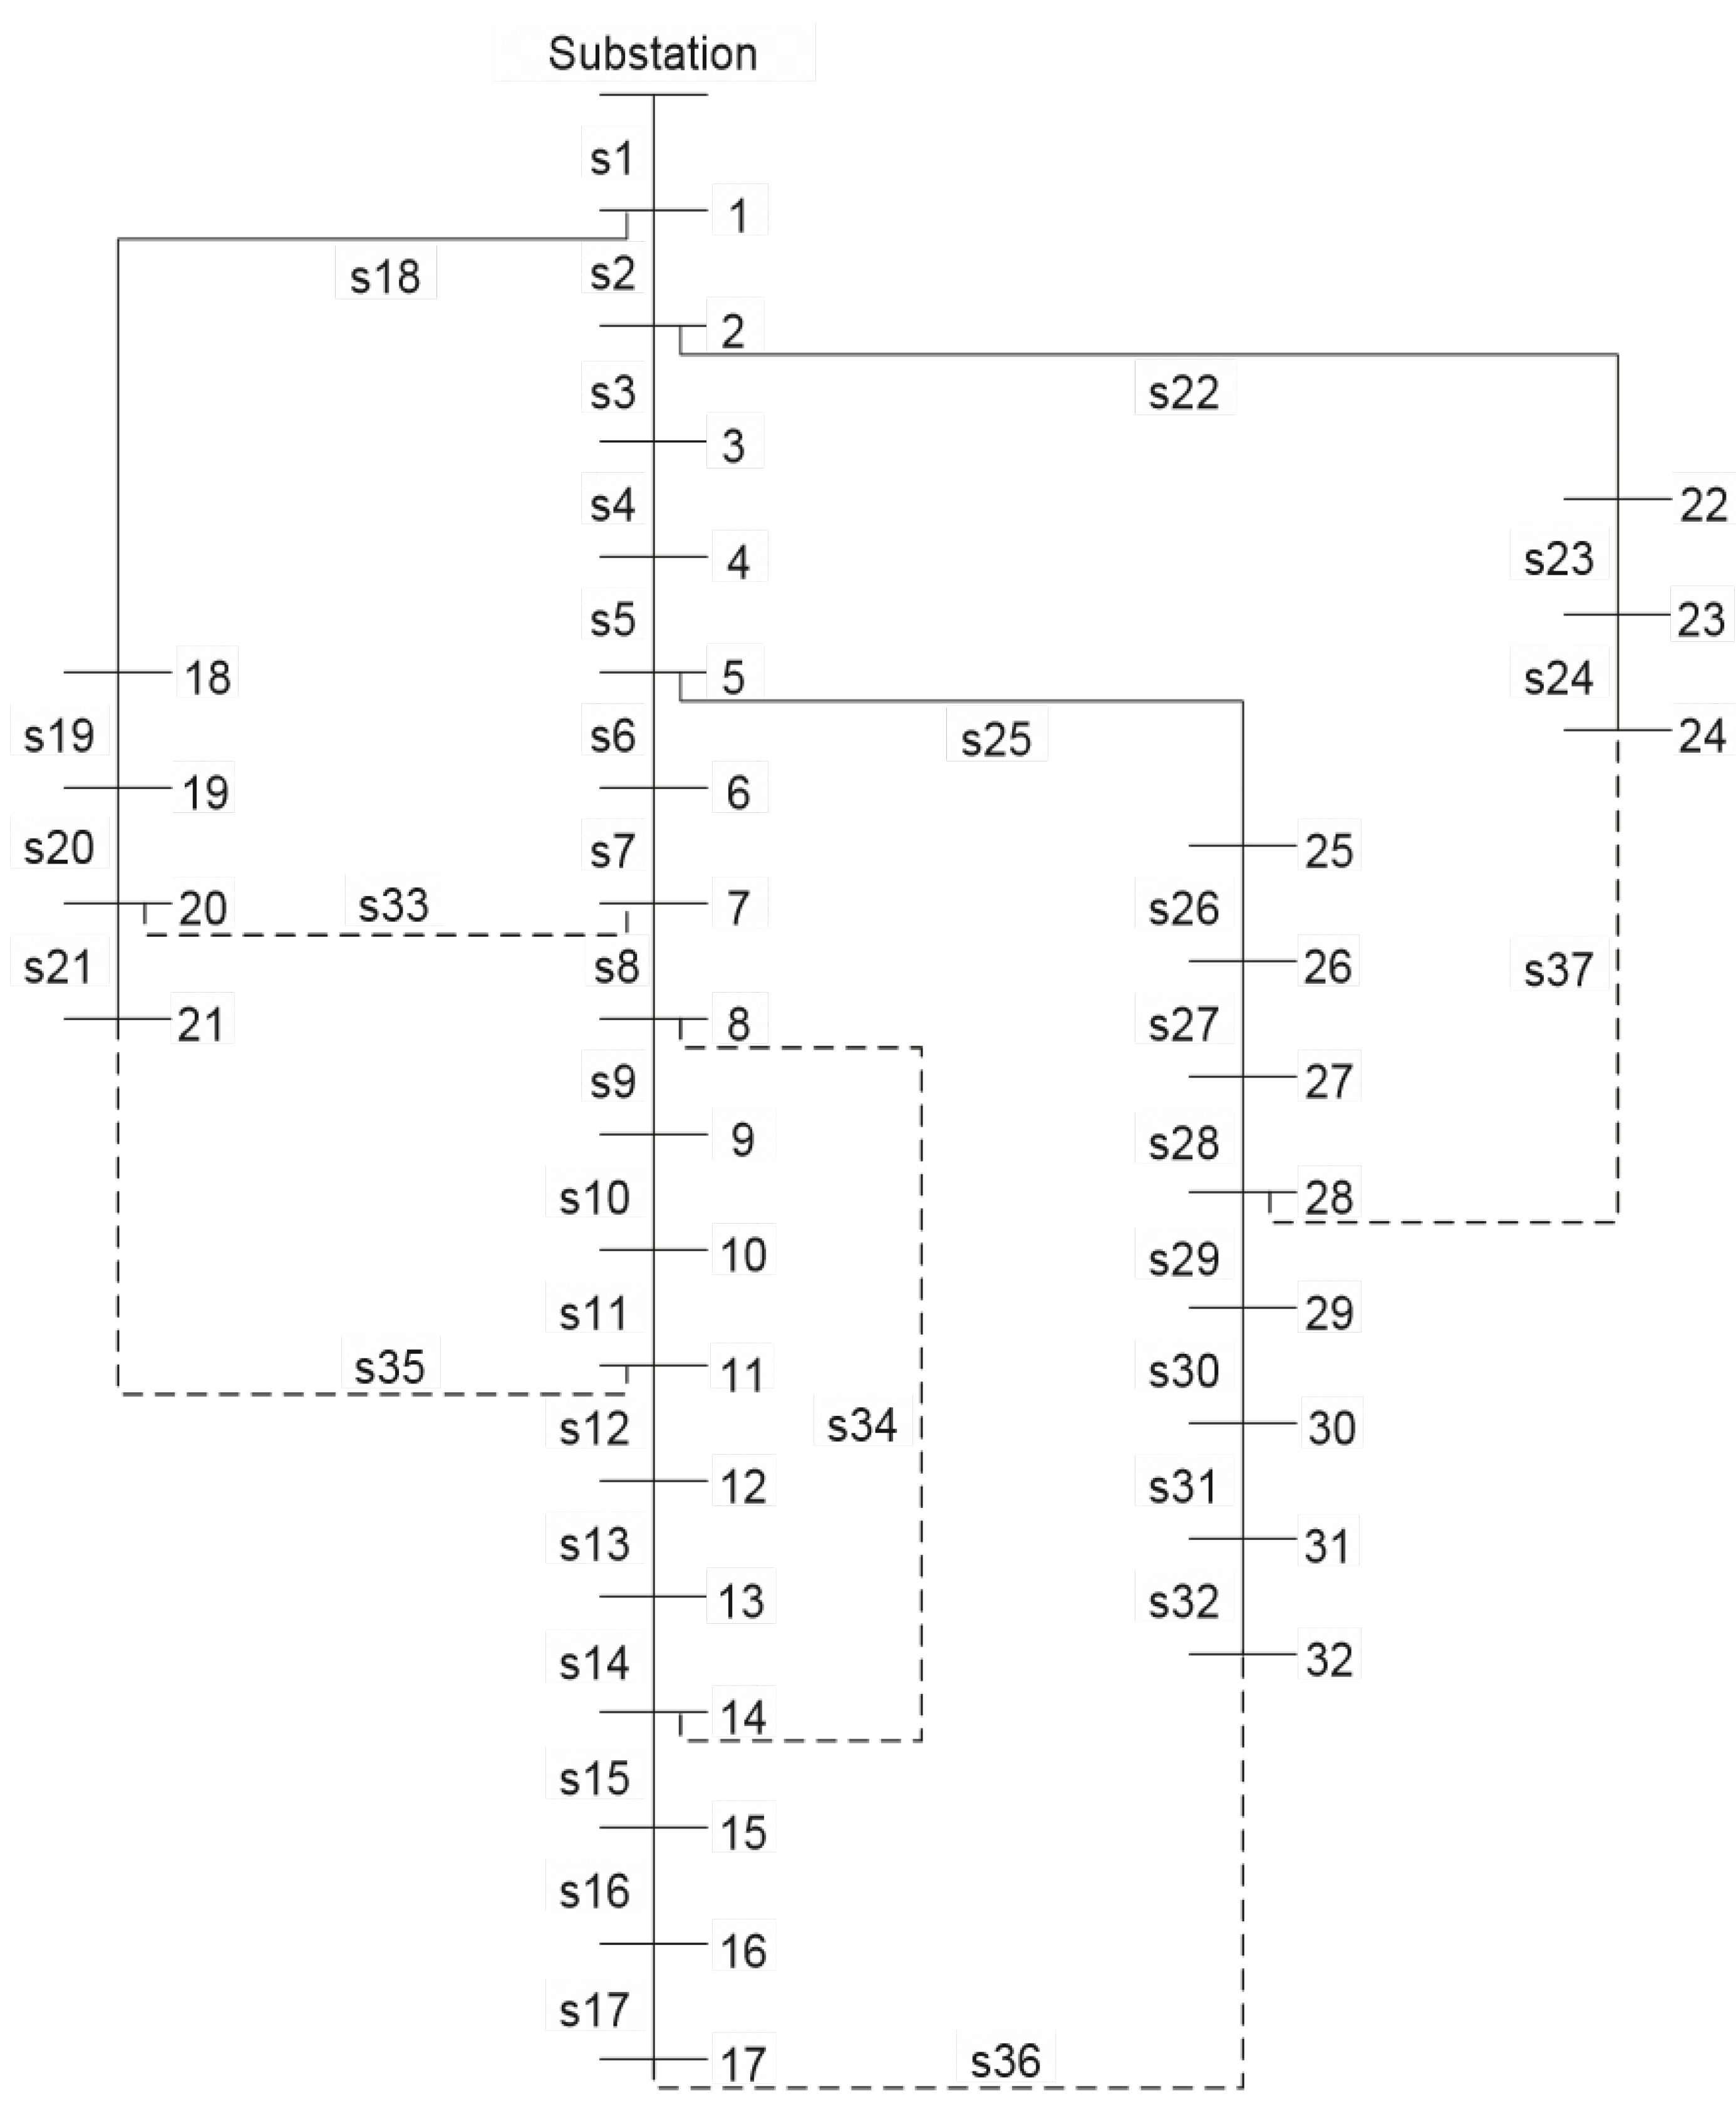
The
Figure 4 depiction of the IEEE-33 bus radial system was the focus of this investigation. There are 33 nodes, 37 lines, 32 loads, 32 PQ buses, 1 feeder, and 1 slack bus in this network. Commonly, a set-up with 32 closed switches and 5 open switches is used. Substation Bus 1, operating at 12.66 kilovolts (kV), is the network’s principal power supply. This is the source for the line and load data for the 33-bus test system. A continuous load is considered, with active power at 3715 kW and reactive power at 2300 kVAr. The injection of a load into the bus, the reactive power limit, and the line in the IEEE-30 bus test system are all described in detail in
Table 1 [
36].
3.2. Problem Formulation
3.2.1. Function for multi-objective optimization
In an optimization problem involving multiple objectives, it is generally more advantageous to convert the multi-objective into a single-objective, then solve, and optimize the single-objective function. Utility function approach, compromised utility function approach, compromised utility function approach, compromised utility function approach, the method used in this study is the weighted-sum technique and lexicographic ordering approach [
37]. Since the overloads of the main transformer and feeder line play different roles with respect to the load balancing weight, the objective function is the load balancing weight. The objective function constructed as follows, using the fundamental model as a starting point. A multi objective function is a multi-objective function that combines all objective functions using a weighted-sum algorithm [
38].
3.2.2. System Power Flow Sensitivity Factors
The system flow sensitivity is the factor that determines the change in the amount of power flowing in a transmission or Transmission line between two buses when a predetermined amount of power is injected into any one of the system’s buses, for example bus I and bus j. This is because the system flow sensitivity is proportional to the amount of power that is injected into the system. The transfer of complicated power from a source to a system bus, say a power system bus
. In order to get an approximation of the change, the Taylor series approximation was utilized, and higher order terms were ignored:
The following are the coefficients that are produced by using the partial derivatives of the real power flow with respect to and V. The equation that was presented earlier may be rewritten as follows:
Where:
nL stands for the number of lines in the network;
g_ig is the conductance of line g and I,
V_i is the nodal voltage of bus I
V_ j is the nodal voltage of bus j; and
δ_ij is the difference in phase angle between buses I and j.
Change in Reactive Power Flow Analysis
If second and higher order terms are ignored, and Taylor series approximation is used, the change in real line flow is expressed as:
The following are the coefficients that are produced by using the partial derivatives of the real power flow with respect to and V. The equation that was presented earlier may be rewritten as follows:
where:
b_ij = nodal voltage of bus I
v_i is the nodal voltage of bus j
is the conductance of the line g and I
δ_ij is the difference between buses I and j in the phase angle.
nL stands for the number of lines in the network.
3.3. Load balancing model
In this approach, the goal is to meet the required limitations of load balancing the Transmission system after Reconfiguration. To represent load levels on transformers and feeder lines, we use the ratio of mean loads. When the switch turned ON, the bus bar voltage swings within the permitted range, while the current via the main transformer and feeder line fluctuates within the rated range [
39].
where Vmin is the bus bar voltage’s minimum limit, Vmax is the bus bar voltage’s maximum limit, and Imax is the load capacity of the main transformer and feeder line. The Transmission network’s power flow limitation [
42].
3.4. Bioinspired Intelligent hybrid algorithm
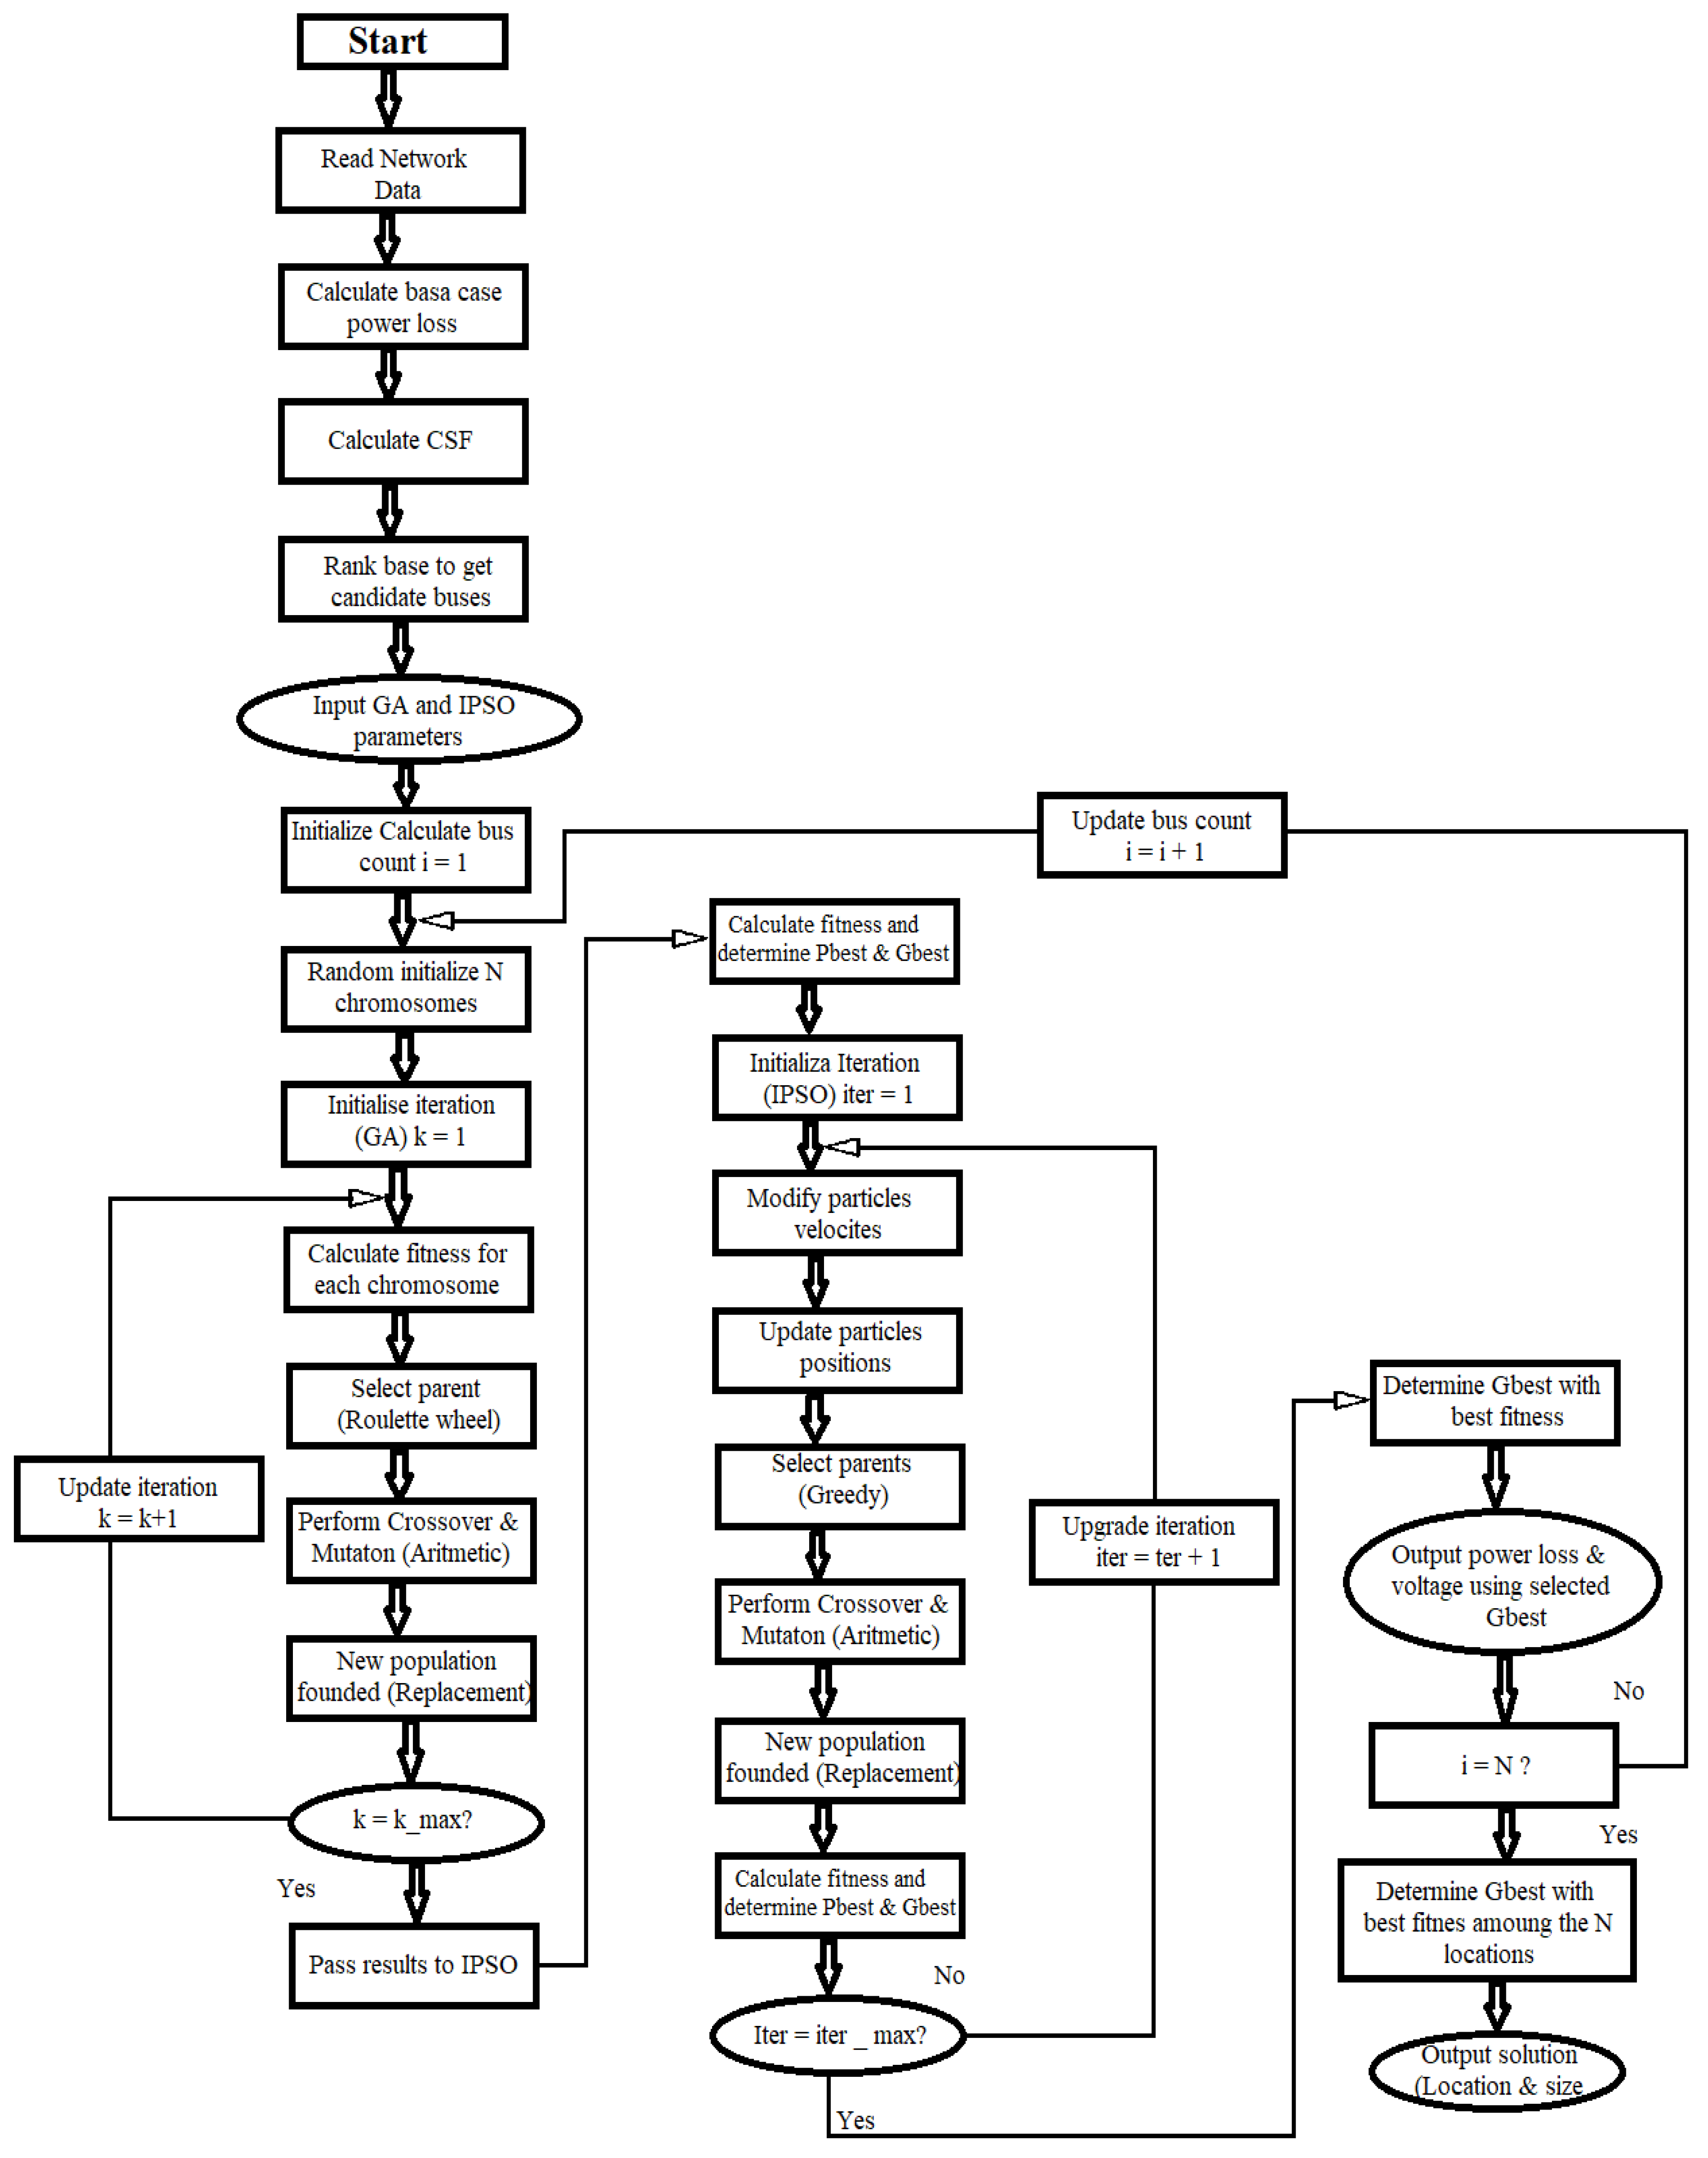
GA and PSO have complementing abilities. When offspring arrive in GA, much essential information from the parents overlooked. When compared to GA, PSO offers the advantages of ease, flexibility, and memorability. However, it falls short of GA in terms of global convergence. The research provides a hybrid algorithm as shown in the flowchart on
Figure 5 that combines each benefit. During the hybrid algorithm search, some people use the PSO search strategy while others use the GA search strategy to get the best solution [
41,
42].
4. Results and Discussion
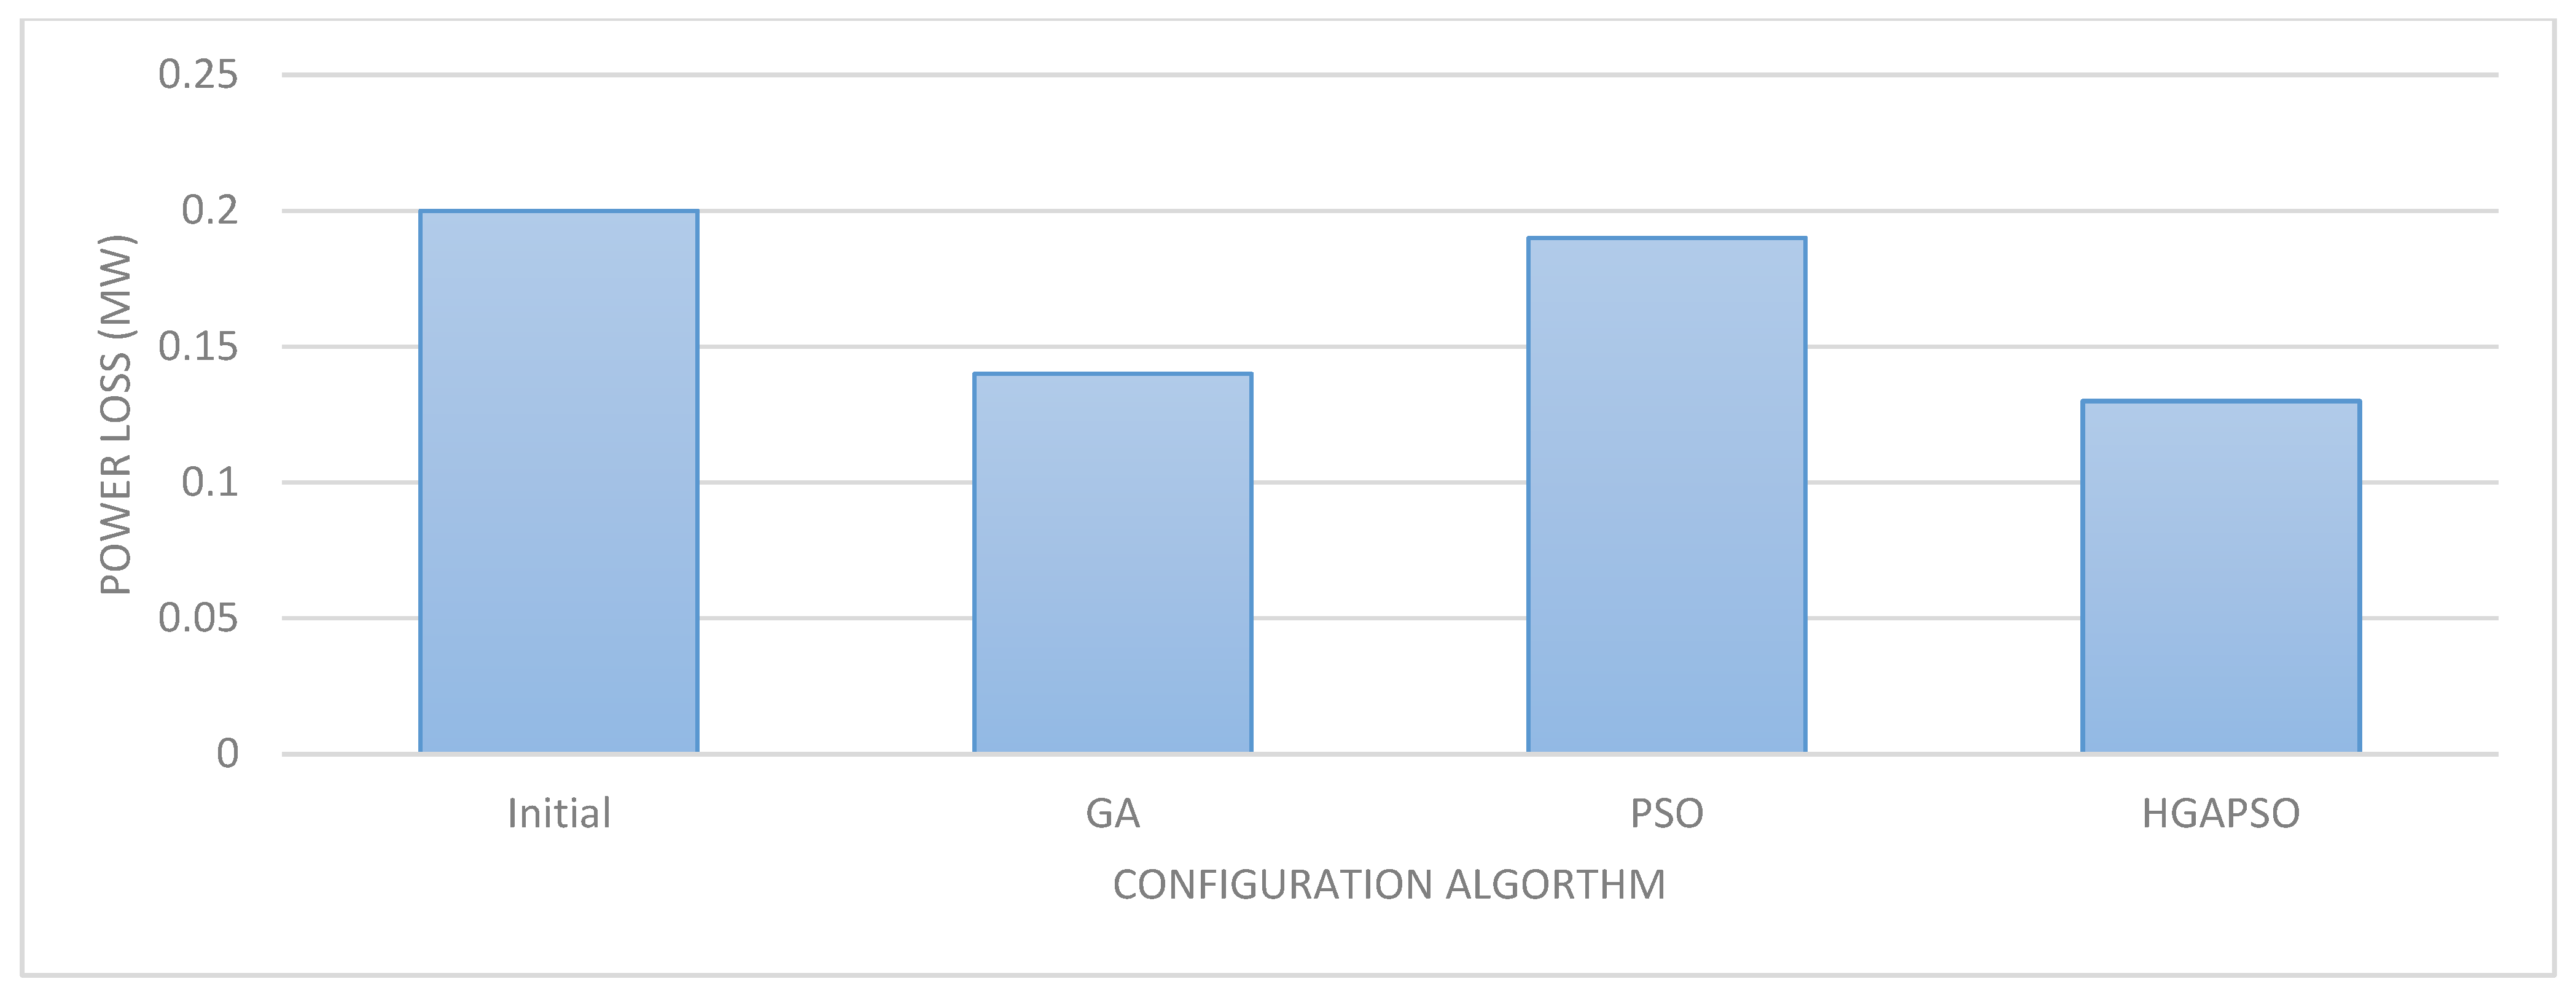
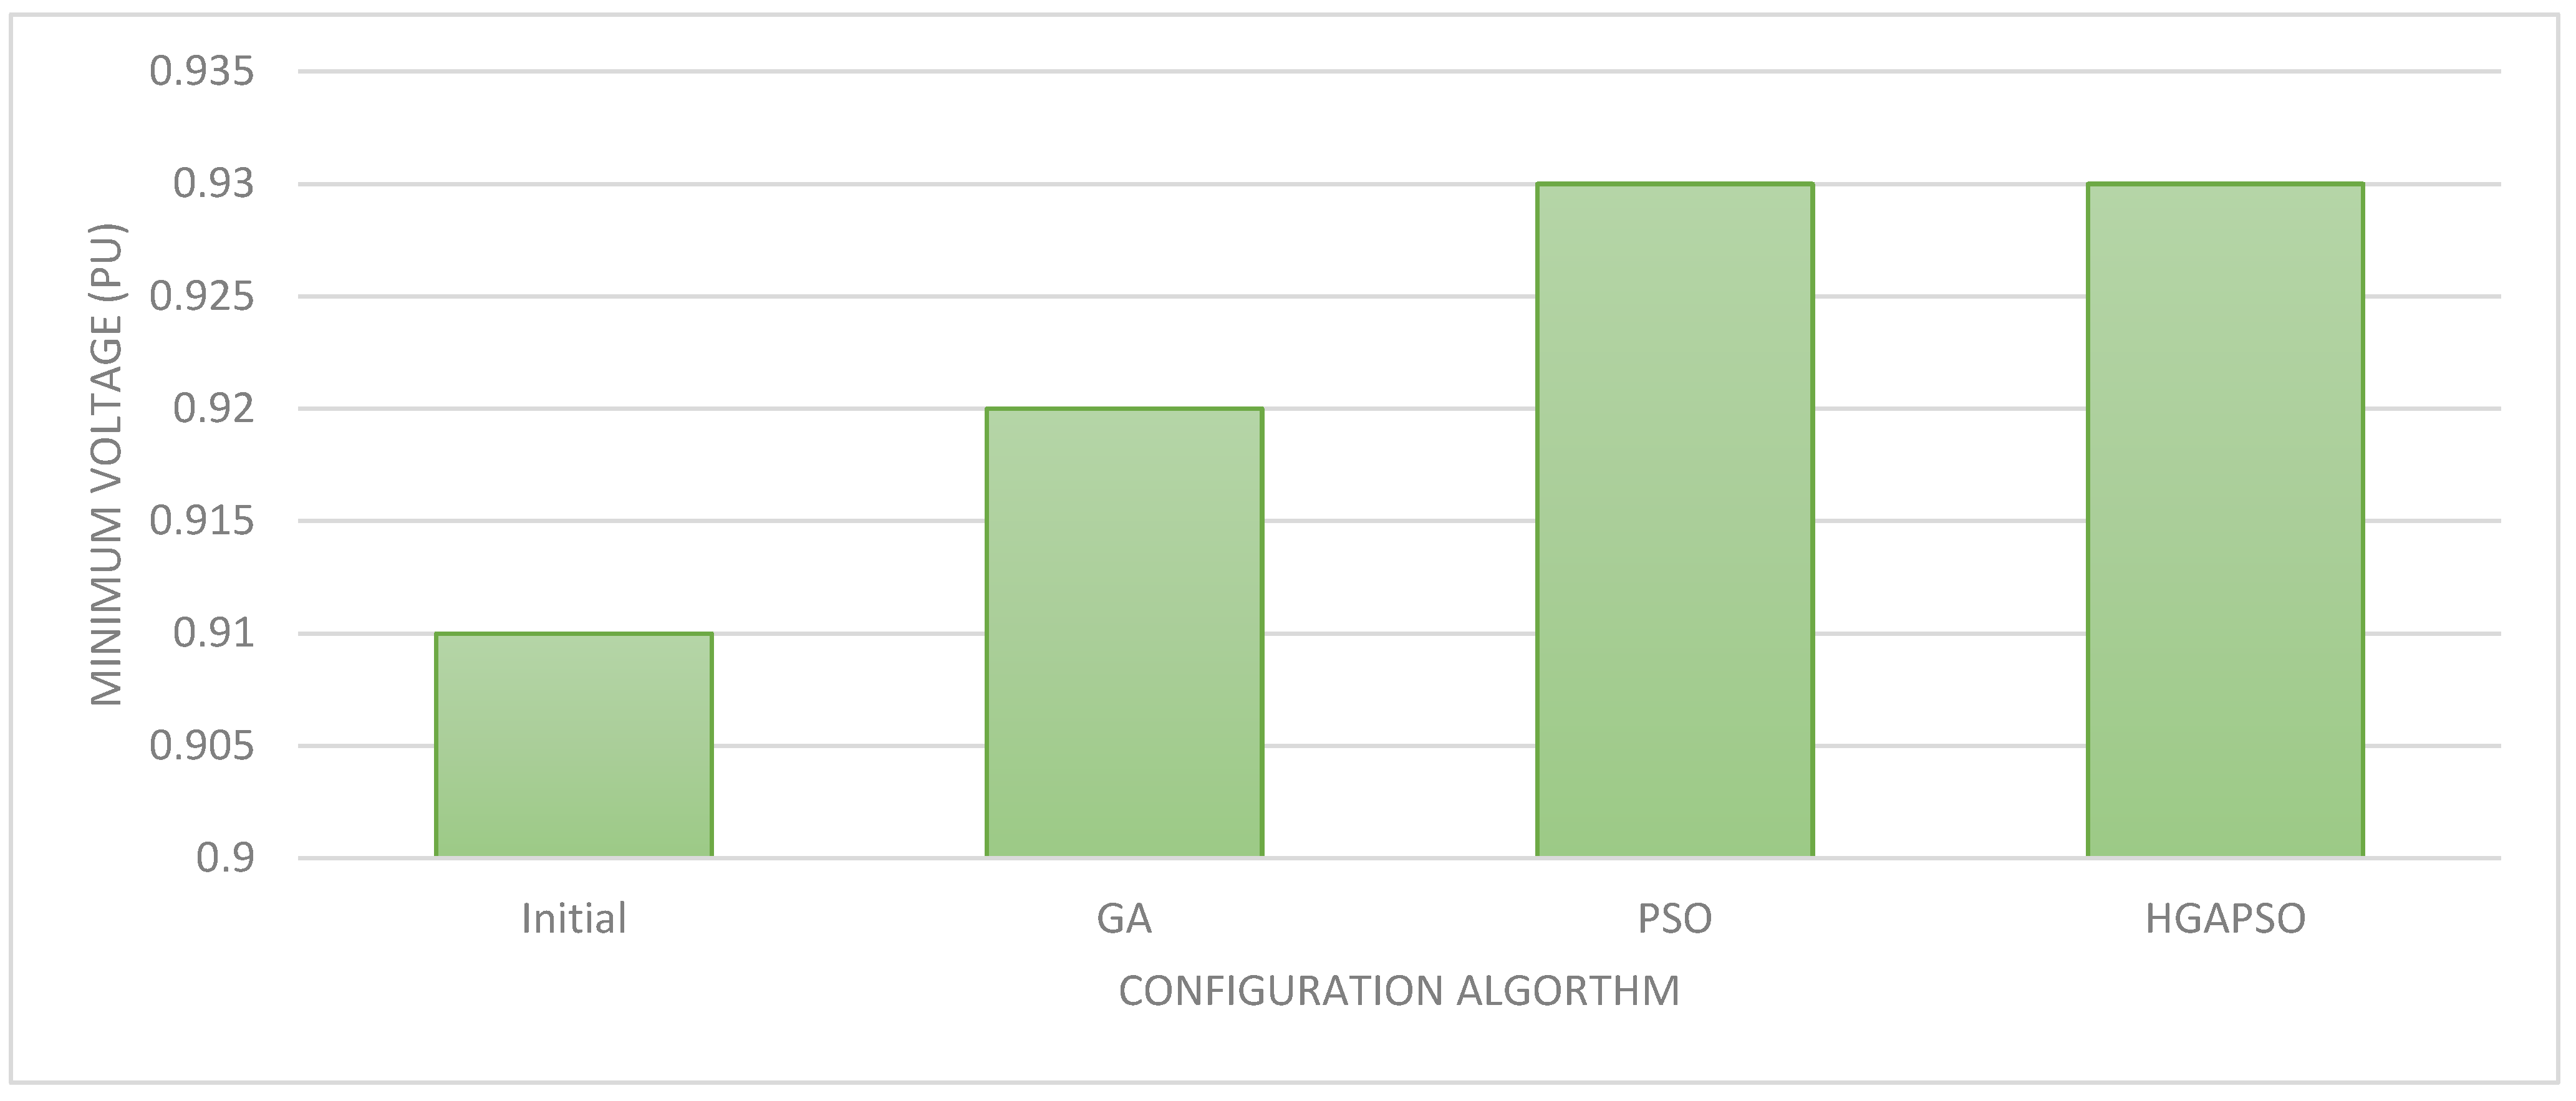
Lines from s1 to s32. The data for the system may found in. Using modified PSO, five of the thirty-three switches considered as closed when in fact each considered as closed in the test system. Thus, five out of thirty-seven switches considered as opened for the smallest loss configuration, each particle deals with five decision factors. Each variable (switch) in modified GA represented by six bits, resulting in a chromosome with a length of sixty-four bits. PSO performed for a predetermined number of iterations in the proposed technique, and the best solutions identified so far encoded into chromosomes and supplied as an initial population to GA. Then, for the rest of the iterations, GA is set to run. By comparison, the resulting average loss reduction obtained using the recommended technique is higher than that achieved using GA and PSO as shown in
Table 1.
Table 1.
Loss reduction and tie switch configuration.
Table 1.
Loss reduction and tie switch configuration.
Configuration
Algorithm |
Power Loss (MW)
Best, Worst, Average
STD |
Loss
Reduction (%) |
Min Voltage (p.u)
(Best value) |
CPU Time (s) |
| Initial |
0.20 |
- |
0.91 |
- |
| GA |
0.14 |
|
0.92 |
|
| 0.20 |
|
|
19.1 |
| 0.16 |
| 0.01 |
| PSO |
0.13 |
18.65 |
0.93 |
13.8 |
| 0.19 |
| 0.16 |
| 0.01 |
| (HGAPSO) |
0.13 |
30.63 |
0.93 |
5.7 |
| 0.14 |
| 0.14 |
| 0.01 |
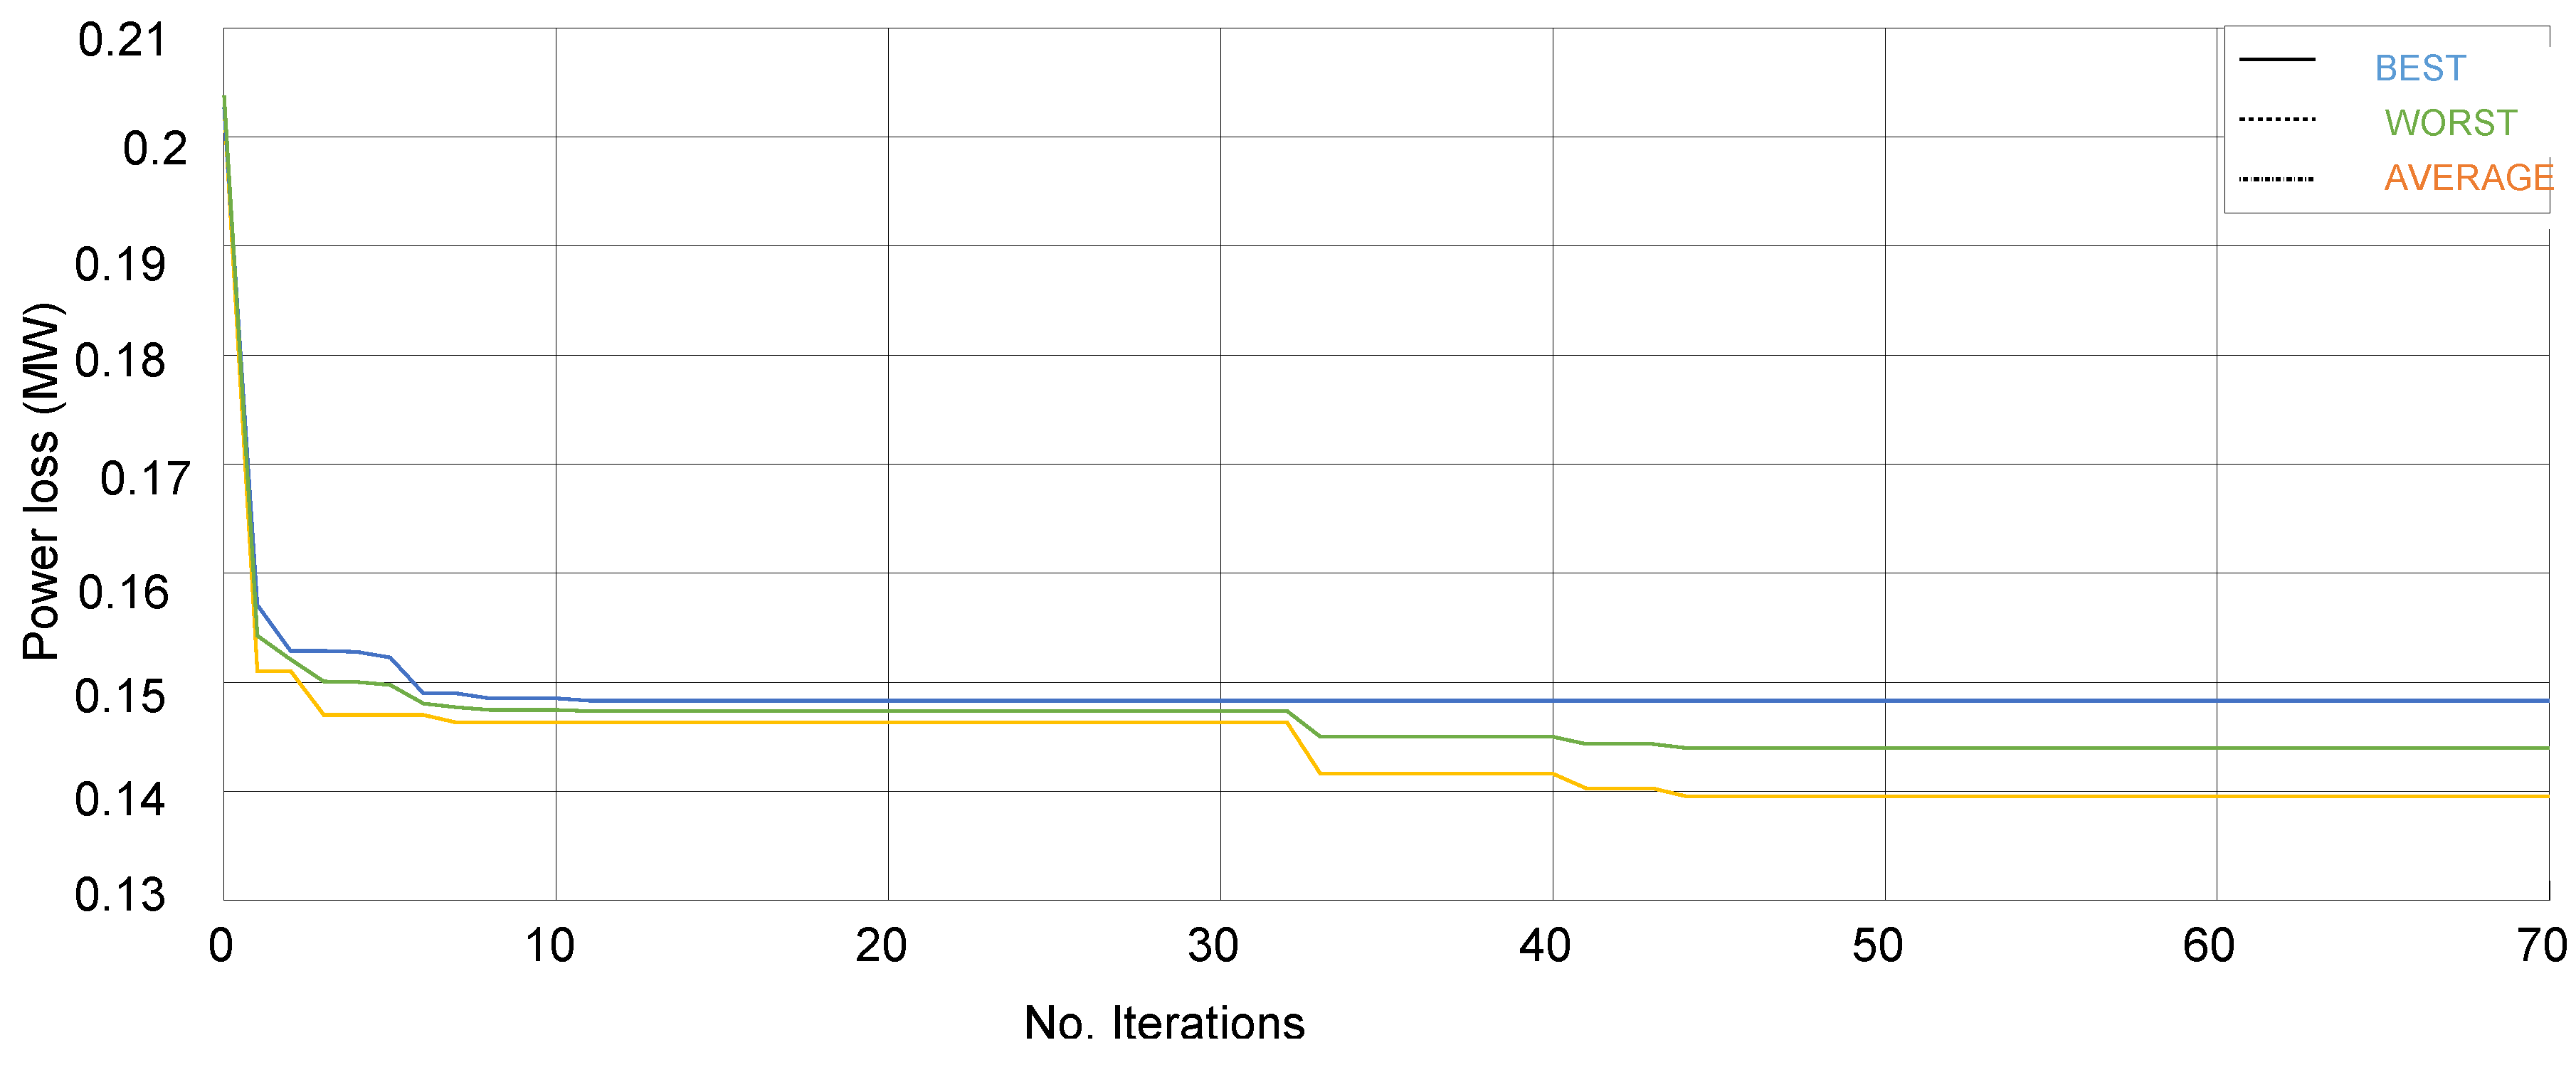
While anticipated that increasing the number of iterations would result in a better solution as shown in
Figure 6, the cost of computational resources well thought out. In order to optimize optimization performance, it is necessary to fine tune the number of particles and population size, the number of iterations and the inertia weight that are used in the method. The system solved for 200 times in a row to illustrate the resilience of the suggested method.
As shown in the
Figure 6 and
Figure 8 this hybrid technique exhibits convergence properties for both the best and worst cases of 200 independent runs as well as an average of these two scenarios. Result of updating the PSO the power loss decreased from 0.202 MW (starting value) to 0.114 MW after 25 iterations as shown in
Figure 7. On the 44th iteration GA achieves its global optimum (0.139 MW) by even further minimizing the loss. Using the suggested technique 200 simulations performed using various methods
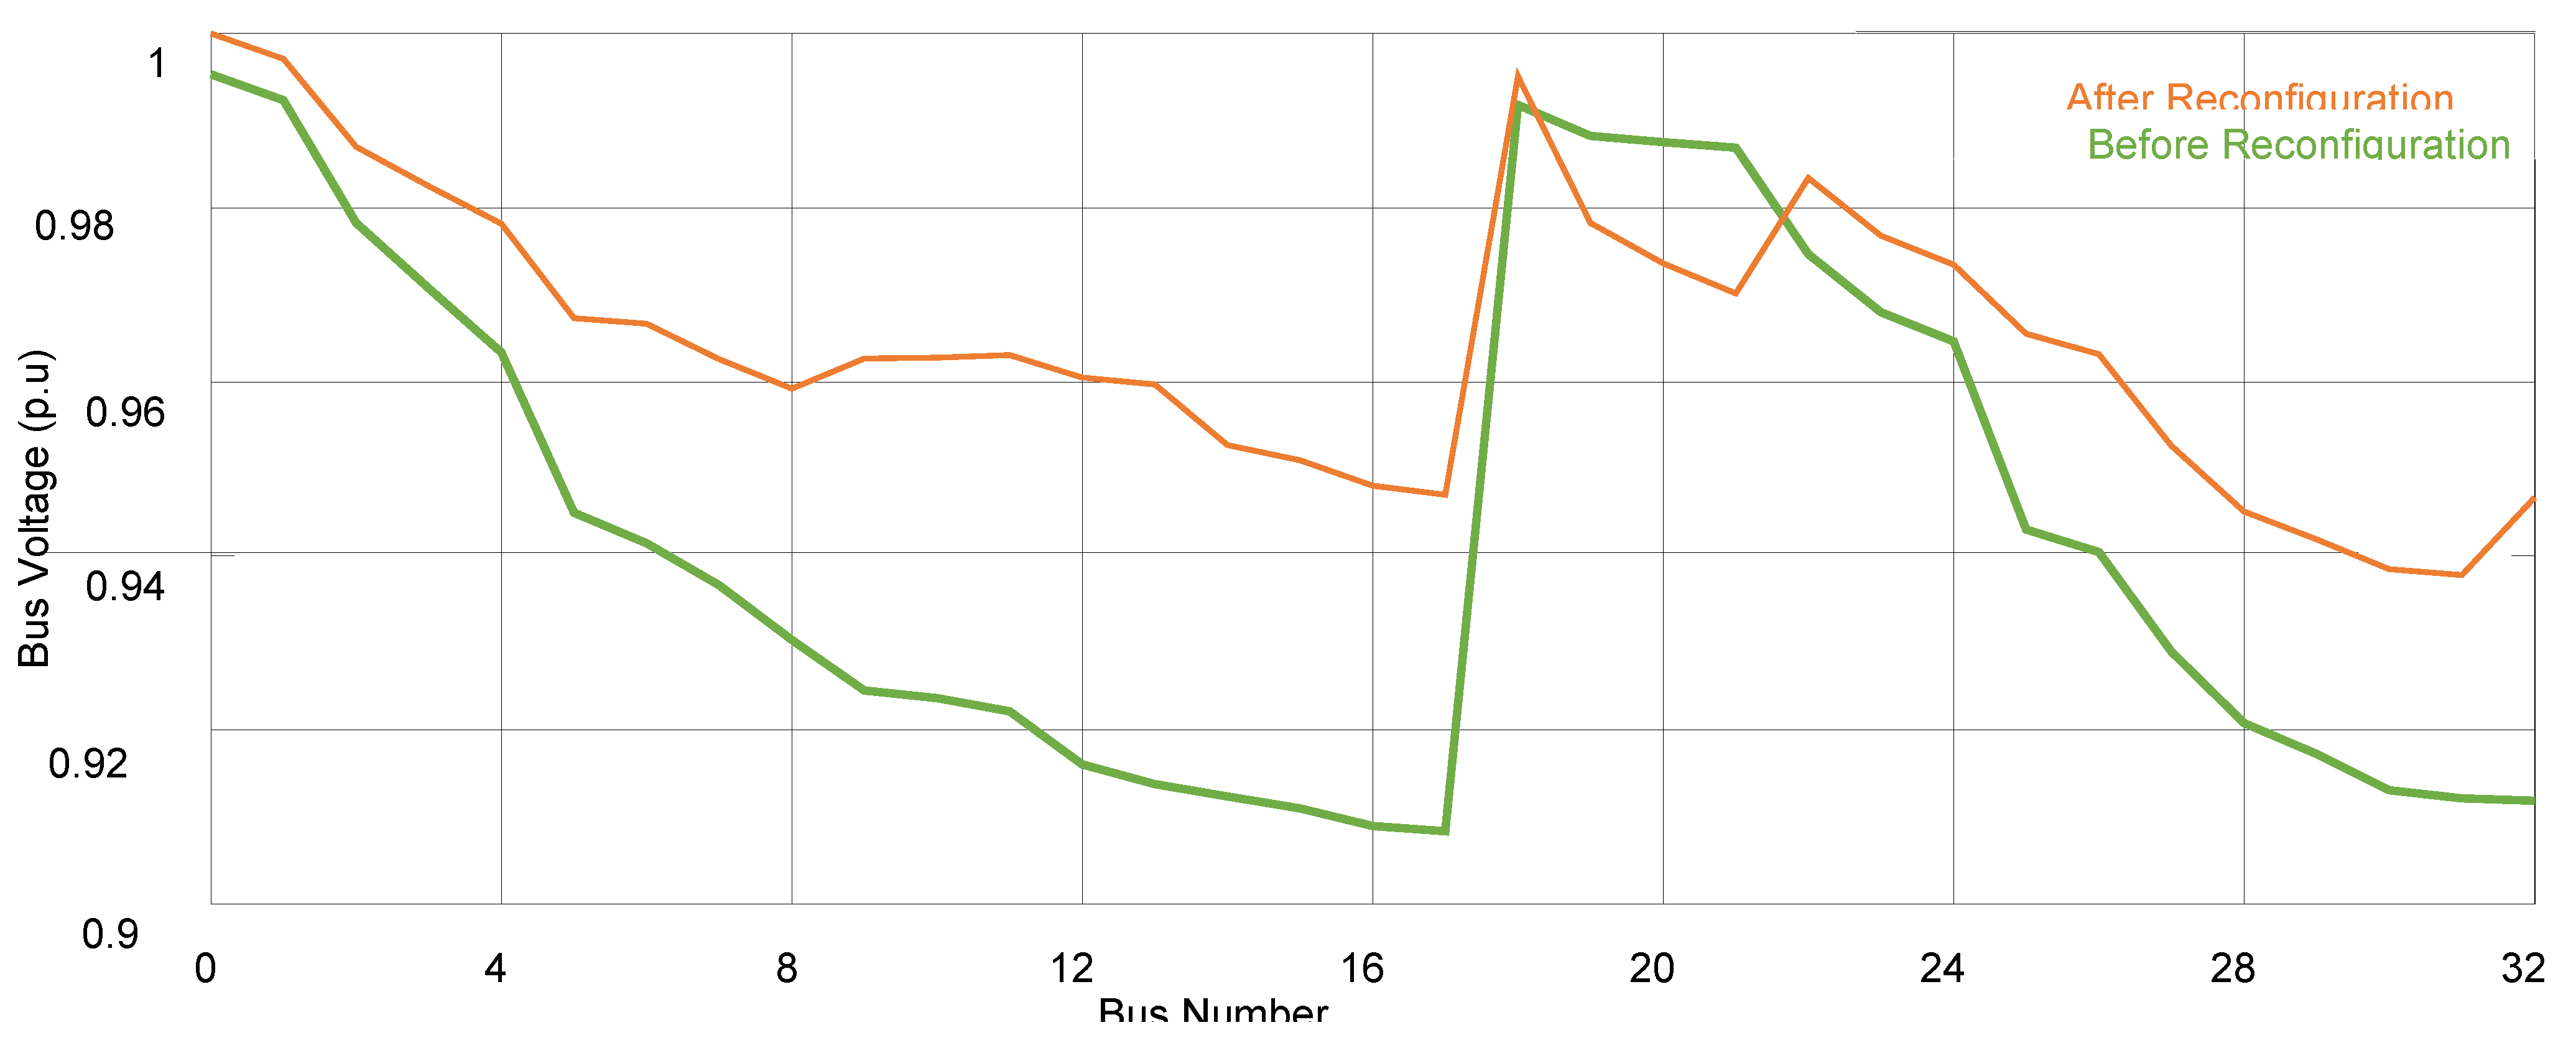
Figure 9 shows the difference in voltage profile for different algorithms.
5. Conclusion
This research used a hybrid GA-PSO method to tackle transmission network reconfiguration more efficiently and precisely. This method preserves population diversity using multiple methods. The system uses “mending” to fulfill the radial criteria for each PSO particle or GA chromosome, which reduces solution space. The proposed method can quickly find the global optimal solution without premature convergence. The hybrid technique suggested reduces average loss, standard deviation, and computing time when searching for optimal solutions for multiple independent runs. PSO determines isolators rapidly and accurately. However, local minima and early convergence make this ordinary PSO unsuitable for real-world power system optimization. HGAPSO optimizes over a wider search space by avoiding local minima and diversifying variable values via the mutation operator. HGAPSO optimizes actual and reactive power losses, improving the voltage profile.
It has been demonstrated that the line congestion can be addressed by altering the line switches and retaining control over the variables that are contributing to the issue. This may be done in order to relieve the pressure that is being placed on the lines. On the other hand, for feeders that currently have some of their lines overcrowded and that also do not have generators, this strategy is not going to be able to give a solution to the problem in the near future. This is due to the fact that this approach combines both of those issues into one. Because there are no other viable options, load shedding is something that has to be done in order to solve the problem. On the other hand, an algorithm has been devised in order to alleviate the problem of technical congestion. This was done in order to reduce the amount of time spent waiting for information. This algorithm takes advantage of the fact that an electric vehicle (EV) is able to alter the initial expected charging pattern that it has by using that information. Using this strategy, electric vehicles (EVs) are able to make a contribution to the system by either charging a larger quantity than was previously required, slowing down or halting the charging process, or even supplying energy, which is done by leveraging V2G for the purpose. This can be done in a number of different ways. Due to the fact that this method makes use of leveraging V2G, any of these choices can be implemented. In this manner, electric vehicles are able to relieve line congestion regardless of whether or not there are generators present in the feeder. This is because electric vehicles do not require the use of gasoline or diesel. This remains the case regardless of the presence or absence of generators.
Abbreviations
| HGPSO—Hybrid Genetic Algorithm Particle Swarm Optimization |
| PSO—Particle Swarm OptimizationCSF—Combined Sensitivity Factors |
| LLRI—Line Loss Reduction Index |
| GA—Genetic Algorithm |
| T&D—Transmission and Transmission |
| RDN—Radial Transmission Network |
| NBPSO—Novel Binary Particle Swarm Optimization |
| G2G—Vehicle – to – Grid |
References
- T. G. S. Rom’an, I. Momber, M. R. Abbad, A. S. Miralles. Regulatory framework and business models for charging plug-in electric vehicles: Infrastructure, agents, and commercial relationships. Energy Policy 2011, 39, 6360–6375. [CrossRef]
- R. J. Bessa, M. A. Matos, Economic and technical management of an aggregation agent for electric vehicles: a literature survey. Eur. Trans. Electr. Power 2012, 22, 334–350. [CrossRef]
- Garcia-Valle, R. ; Pe¸cas Lopes, J. Electric Vehicle Integration into Modern Power.
-
Networks, 1st edition; Springer, 2012.
- Rahmat-Allah Hooshmand — Mohammad Ataei. “Optimal capacitor placement in actual configuration and operational conditions of Transmission systems using RCGA”. Journal of Electrical Engineering 2019, 58, 189–199. [Google Scholar]
- Yustra, Mochamad Ashari and Adi Soeprijanto, “Optimal Distributed Generation (DG) Allocation for Losses Reduction Using Improved Particle Swarm Optimization (IPSO) Method”, J. Basic. Appl. Sci. Res., 2012, 2, 7016–7023.
- M. Vatankhah and S.M. Hosseini. “PSO based voltage profile improvement by optimizing the size and location of DGs”, IJTPE, 2012, 4, 135–139, February.
- M. M. Aman, G. B. Jasmon, K. H. Solangi, A. H. A. Bakar, and H. Mokhlis. Optimum Simultaneous DG and Capacitor Placement on the Basis of Minimization of Power Losses. International Journal of Computer and Electrical Engineering 2013, 5. [CrossRef]
- Nasim Ali Khan, S. Ghosh, S. P. Ghoshal, “Optimal siting and sizing of shunt capacitors in radial Transmission systems using Novel BPSO algorithm”. International Journal of Emerging Technology and Advanced Engineering 2013, 3.
- Arash Afraz, Farzad Malekinezhad, Seyed Jalal Seyed Shenava and Aref Jlili. “Optimal Sizing and Sitting in Radial Standard System using PSO”, American Journal of Scientific Research 2012, 67, 50–58.
- M. Heydari, S.M. Hosseini, S.A. Gholamian. “Optimal Placement and Sizing of Capacitor and Distributed Generation with Harmonic and Resonance Considerations Using Discrete Particle Swarm Optimization”, I.J. Intelligent Systems and Applications, 2013, 7, 42–49.
- M. Padma, N. Sinarami and V.C Veera, “ “Optimal Dg Placement for Maximum Loss Reduction in Radial Transmission System Using ABC Algorithm. International Journal of Reviews in Computing 2012, 2076–3328.
- M. A. Taghikhani, “DG Allocation and Sizing in Transmission Network using Modified Fuzzy Logic Algorithm”. International Journal of Automation and Power Engineering, 2019, 1, 10–19.
- Auglt and R. Hooshmand and M. Ataei, “Real-Coded Genetic Algorithm Applied to Optimal Placement of Capacitor Banks for Unbalanced Transmission Systems with Meshed/Radial Configurations”, International Energy Journal, 2014, 8, 51–62.
- W. Sierzchula, S. Bakker, K. Maat, B. van Wee, The competitive environment of electric vehicles: An analysis of prototype and production models. Environmental Innovation and Societal Transitions 2012, 2, 49–65. [CrossRef]
- C. Sulzberger, An early road warrior: electric vehicles in the early years of the automobile. Power and Energy Magazine, IEEE 2004, 2, 66–71. [CrossRef]
- Sulzberger, C. Early road warrior, part 2 - competing electric and gasoline vehicles, Power and Energy Magazine, IEEE 2004, 2, 83–88. [Google Scholar] [CrossRef]
- M. Catenacci, E. Verdolini, V. Bosetti, G. Fiorese, Going electric: Expert survey on the future of battery technologies for electric vehicles, Energy Policy 2013, 61, 403–413. [CrossRef]
- Chan, C. The state of the art of electric, hybrid, and fuel cell vehicles, Proceedings of the IEEE 2007, 95, 704–718. [Google Scholar] [CrossRef]
- G. Offer, D. Howey, M. Contestabile, R. Clague, N. Brandon, Comparative analysis of battery electric, hydrogen fuel cell and hybrid vehicles in a future sustainable road transport system, Energy Policy 2010, 38, 24–29. [CrossRef]
- Andrija Volkanovski, Marko Cepin, Borut M, “Optimization of reactive power compensation in Transmission network”, Elektrotehniški vestnik 76(1-2): 57-62, Electrotechnical Review: Ljubljana, Slovenija, Vol.13, pp.48-98, 2016.
- S. Jalilzadeh, S. Galvani, H. Hosseinian, F. Razavi. “Voltage Profile Reconfiguration using Genetic Algorithm in Transmission Systems”, Proceedings of the World Congress on Engineering and Computer Science WCECS, 2016, 20, 24–26.
- Saeed Boyerahmadi, Mehrdad Movahed Poor, “Evaluation of Power Loss Reduction with the place of Shunt Capacitors and Distributed Generation Power Plant in the Radial Transmission Systems using Genetic Algorithms”. American Journal of Advanced Scientific Research 2013, 1, 278–283.
- Carpinelli, G., Celli, G., Pilo, F and A. Russo. “Distributed generation siting and sizing under uncertainty”. in Proc. 2014 IEEE Porto Power Tech Conf 2014, 2, 456–564.
- Amin Hajizadeh and Ehsan Hajizadeh, “PSO-Based Planning of Transmission Systems with Distributed Generations”. International Journal of Electrical and Electronics Engineerin 2011, 2, 33–38.
- Mohammad Karimi, Hossein Shayeghi, Tohid Banki, Payam Farhadi and Noradin Ghadimi, “Solving Optimal Capacitor Allocation Problem using DE Algorithm in Practical Transmission Networks”. Przegląd Elektrotechniczny (Electrical Review), 2012, 90–93.
- Mohammad Falahi Sohi and Morteza Shirdel, “Applying BCO Algorithm to Solve the Optimal DG Placement and Sizing Problem. Electrical and Electronic Engineering 2012, 2, 31–37. [CrossRef]
- Amin Hajizadeh and Ehsan Hajizadeh, “PSO-Based Planning of Transmission Systems with Distributed Generations”, World Academy of Science, Engineering and Technology, 2017, 45, 598–603.
- Kai Zou, A. P. Agalgaonkar, K. M. Muttaqi and S. Perera. “Voltage Support by Distributed Generation Units and Shunt Capacitors in Transmission Systems”. IEEE 2016, 6, 3781–4241.
- K. Varesi, “Optimal Allocation of DG Units for Power Loss Reduction and Voltage Profile Improvement of Transmission Networks using PSO Algorithm”. World Academy of Science, Engineering and Technology 2011, 60, 14–35.
- Mohammad M. and M. A. Nasab “PSO Based Multiobjective Approach for Optimal Sizing and Placement of Distributed Generation”. Research Journal of Applied Sciences, Engineering and Technology, 2011, 2, 832–837.
- N. Mancer, B. Mahdad and K. Srairi, “Multi Objective Optimal Reactive Power Flow Based STATCOM Using Three Variant of PSO”. International Journal of Energy Engineering, 2012, 2, 1–7.
- Mehdi Nafar, “PSO-Based optimal placement of DGs in Transmission systems considering Voltage Stability and Short Circuit Level Improvement”, J. Basic. Appl. Sci. Res., 2012, 2, 703709.
- Somayeh Hajforoosh, Seyed M. H Nabavi, and Mohammad A. S. Masoum, “Optimal Particle Swarm Based Placement and Sizing of Static Synchronous Series Compensator to Maximize Social Welfare”, Journal of Electrical Engineering & Technology 2012, 7, 501–512.
- Reza Khorram-Nia, Aliasghar Baziar, Abdollah Kavousi-Fard, “A Novel Stochastic Framework for the Optimal Placement and Sizing of Transmission Static Compensator. Journal of Intelligent Learning Systems and Applications 2013, 5, 90–98. [CrossRef]
- K. Valipour, E. Dehghan and M.H. Shariatkhah, “Optimal placement of Capacitor Banks and Distributed Generation for Losses Reduction and Voltage THD Improvement in Transmission Networks Based on BBO Algorithm”. International Research Journal of Applied and Basic Sciences © ISSN 2251-838X /, 2015, 4, 1663–1670.
- Kai Zou, A. P. Kai Zou, A. P. Agalgaonkar, K. M. Muttaqi and S. Perera, “Voltage Support by Distributed Generation Units and Shunt Capacitors in Transmission Systems”. IEEE 2016, 6, 3781–4241. [Google Scholar]
- G. Platt, “A New Method for Improving Reliability and Line Loss in Transmission Networks”, (AUPEC 2010). 2019, 10, 5–8.
- M. Arabi, M. M. Arabi, M. Sedighizadeh and A. Rezazadeh, “Distributed Generation Allocation to Improve Steady State Voltage Stability of Transmission Networks Using Particle. 2018, 4,, 213–245. [Google Scholar]
- Varesi, K. “Optimal Allocation of DG Units for Power Loss Reduction and Voltage Profile Improvement of Transmission Networks using PSO Algorithm”, World Academy of Science, Engineering and Technology, 2011, 60, 14–35. [Google Scholar]
- Mohammad, M.; Nasab, M. A. “PSO Based Multiobjective Approach for Optimal Sizing and Placement of Distributed Generation”, Research Journal of Applied Sciences, Engineering and Technology, 2011, 2, 832–837. [Google Scholar]
- Mancer, N.; Mahdad, B.; Srairi, K. “Multi Objective Optimal Reactive Power Flow Based STATCOM Using Three Variant of PSO”, International Journal of Energy Engineering, 2012, 2, 1–7.
|
Disclaimer/Publisher’s Note: The statements, opinions and data contained in all publications are solely those of the individual author(s) and contributor(s) and not of MDPI and/or the editor(s). MDPI and/or the editor(s) disclaim responsibility for any injury to people or property resulting from any ideas, methods, instructions or products referred to in the content. |
© 2023 by the authors. Licensee MDPI, Basel, Switzerland. This article is an open access article distributed under the terms and conditions of the Creative Commons Attribution (CC BY) license (http://creativecommons.org/licenses/by/4.0/).

