Preprint
Article

Methamphetamine Induces RIPK3 over Expression and Triggers of Akt-1/GSK3 Signaling Pathway in Amygdala in Postmortem User

Altmetrics

Downloads

295

Views

157

Comments

0

A peer-reviewed article of this preprint also exists.

Submitted:

25 May 2023

Posted:

29 May 2023

Read the latest preprint version here

Alerts
Abstract
Methamphetamine (METH) has the potential to disrupt the activities of neurotransmitters in the Central Nervous System (CNS) and cause neurotoxicity through various pathways. These pathways include increased production of reactive nitrogen and oxygen species, hypothermia, and induction of mitochondrial apoptosis. In this study, we investigated the long-term effects of METH addiction on the structural changes in the amygdala of postmortem human brains, as well as the involvement of the CREB/BDNF and Akt-1/GSK3 signaling pathways. We examined ten male postmortem brains, comparing control subjects with chronic METH users, using immunohistochemistry, Real-time PCR (to measure levels of CREB, BDNF, Akt-1, GSK3, and TNF-α), Tunnel assay, stereology, and assays for ROS, GSSG, and GPX. The findings revealed that METH significantly reduced the expression of BDNF, CREB, Akt-1, and GPX, while increasing the levels of GSSG, ROS, RIPK3, GSK3, and TNF-α. Furthermore, METH was found to induce inflammation and neurodegeneration in the amygdala, with ROS production mediated by the CREB/BDNF and Akt-1/GSK3 signaling pathways.
Keywords: 
Subject: Biology and Life Sciences  -   Toxicology

1. Introduction

The Central Nervous System (CNS) comprises nerve cells and neuroglia that are susceptible to damage caused by various destructive factors [1,2,3,4,5,6,7,8]. Methamphetamine (METH) was first manufactured during World War II [9]. However, its illicit use and recreational consumption have become significant concerns in many countries, despite its therapeutic applications in conditions like memory disorders, hyperactivity, narcolepsy, and obesity, today; it is used illegally and for recreation [10,11,12]. Research has indicated that this substance can have side effects on the respiratory, cardiovascular, and nervous systems [13,14]. Individuals who use METH are susceptible to experiencing a range of emotional and cognitive effects. These include feelings of euphoria, increased energy and alertness, feelings of increased physical and mental performance, hallucinations, paranoia, anxiety, and increased productivity [9,11]. Unfortunately, despite the documented reports of irreversible side effects associated with the misuse of this substance, its prevalence continues to rise, particularly among the younger population worldwide [15]. Research studies have demonstrated that METH can disrupt the activities of neurotransmitters in the CNS, including dopamine, serotonin, and norepinephrine [16,17,18]. Animal model studies have revealed that METH has the ability to release dopamine-containing vesicles stored within neurons and inhibit the enzyme monoamine oxidase [19]. Abnormal activity has been reported in specific CNS areas affected by dopamine and serotonin regulation, such as the striatum, prefrontal cortex, caudate nucleus, anterior cingulate, and amygdala, which may contribute to the increased risk of depression and aggressive behaviors in METH users [20,21,22]. Furthermore, the degradation of dopaminergic neurons has also been observed following METH usage [23]. METH’s ability to induce neurotoxicity is well documented and occurs through multiple pathways, including increased production of reactive nitrogen and oxygen species, hypothermia, and induction of mitochondrial apoptosis [24,25,26]. However, the precise mechanism underlying these actions is not fully understood [8]. Neuroimaging studies investigating METH users have revealed alterations in both white and gray matter volume compared to healthy individuals in various regions of the CNS, including the cingulate, striatum, nucleus accumbens, hippocampus, parietal and occipital lobes, basal nuclei [22,27,28,29,30,31]. In addition to structural changes observed in the nervous system of individuals using METH, numerous studies have provided clear evidence of increased expression of oxidative stress, inflammatory, autophagy, and apoptosis markers in specific regions of the nervous system [13,32,33,34,35,36,37]. Previous investigations have confirmed that METH can elevate apoptotic markers such as BAX, caspase 3, 8, and 9 in the amygdala and hippocampus [38,39]. Neurotrophic factors play a crucial role in the development and functioning of the nervous system, particularly brain-derived neurotrophic factor (BDNF), which is associated with neuronal plasticity, survival, and neuroprotection [40]. BDNF has a critical role in some parts of the CNS, which regulate cognition, emotions, and reward activities [41]. Numerous studies have indicated alterations in BDNF levels under neuropathological conditions. Specifically, METH use has been shown to significantly decrease BDNF levels through the reduction of CREB activities. Furthermore, disruption of normal AKT/GSk3 signaling pathways has been linked to METH use, which may contribute to the exacerbation of neurological and neurobehavioral symptoms [40,42,43,44]. Thus, in this investigation, we analyzed the overexpression of TNF-α and examined alterations in the CREB/BDNF and Akt-1/GSK3 signaling pathways in postmortem amygdala samples obtained from individuals with a history of METH addiction.

2. Results

Evaluation of the sample

Ten normal brains (control or non-METH group) were obtained from adult males with no history of drug use. The average age of the individuals was 38 ± 2 years. The individuals in the control group had a male gender, BMI of 24.4, and a brain volume of 1450±34 grams (mean ± SD). The ultimate cause of death for these individuals was attributed to factors such as myocardial infarcts or accidents.
In contrast, the ten brains in the chronic METH user group belonged to individuals who were male, with a BMI of 18.8, and an average age of 38 ± 2 years. The brain volume of this group was measured to be 1310±52 grams (mean ± SD). The cause of death for these individuals was METH overdose, and they had a history of using METH for more than five years. The common methods of METH use among this group were smoking and intravenous (IV) injection. It is worth noting that none of the individuals had any neurodegenerative illnesses or a diagnosis of AIDS.

Real-time PCR

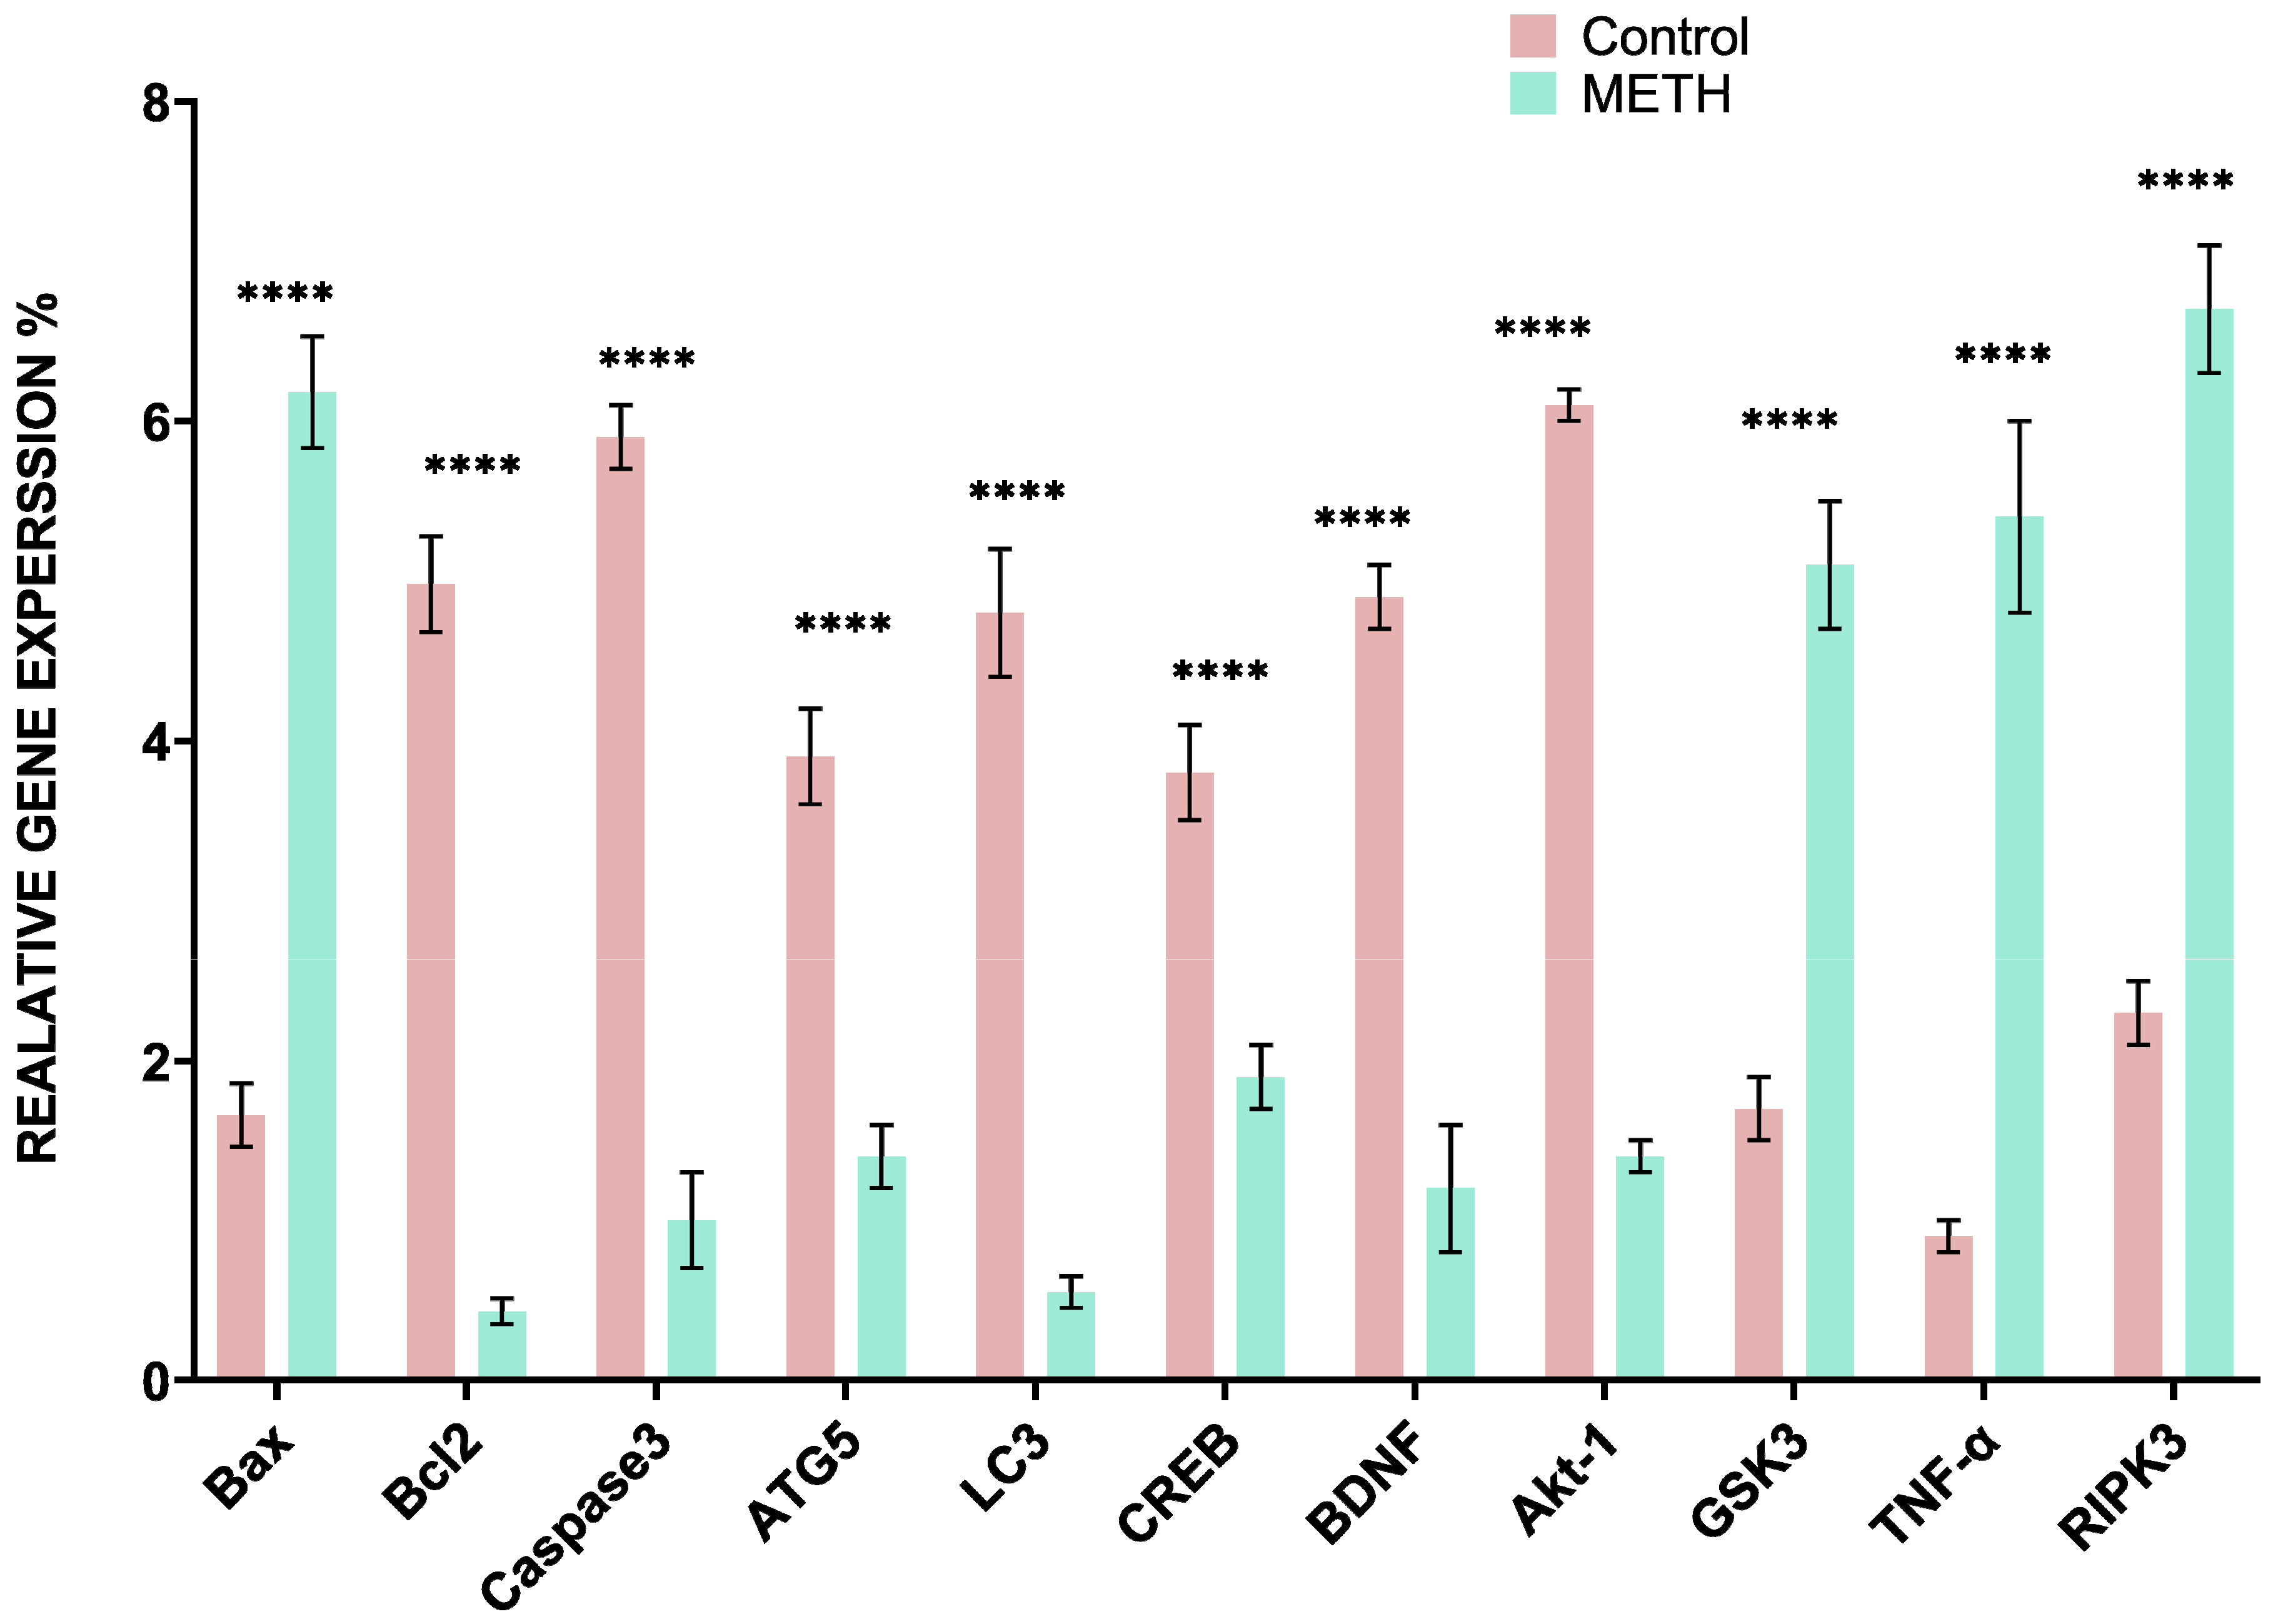
The relative qRT-PCR analysis was performed using the Pfaffl method to determine gene expression levels. Our analysis revealed that in the METH group, the expression levels of certain genes, including GSK3, TNF-α, and RIPK3, were significantly increased compared to the control group. On the other hand, the expression levels of other genes such as CREB, BDNF, and Akt-1 were decreased. Additionally, genes associated with apoptosis, such as Caspase 3 and Bax, showed increased expression, while the anti-apoptotic gene Bcl2 displayed decreased expression. Furthermore, the autophagy-related genes LC3 and ATG5 exhibited increased expression in the METH group.
Figure 1. The relative quantitative expression levels of CREB, BDNF, Akt-1, GSK3, TNF-α, RIPK3, Caspase 3, Bax, Bcl2, LC3, and ATG5 in the METH (mild gray) and control group (black). The results indicate a significant impact of METH on gene expression, leading to both decreased and increased expression of the target genes (****: P<0.05) (mean±SD).
Preprints 74774 g001

Immunohistochemistry result

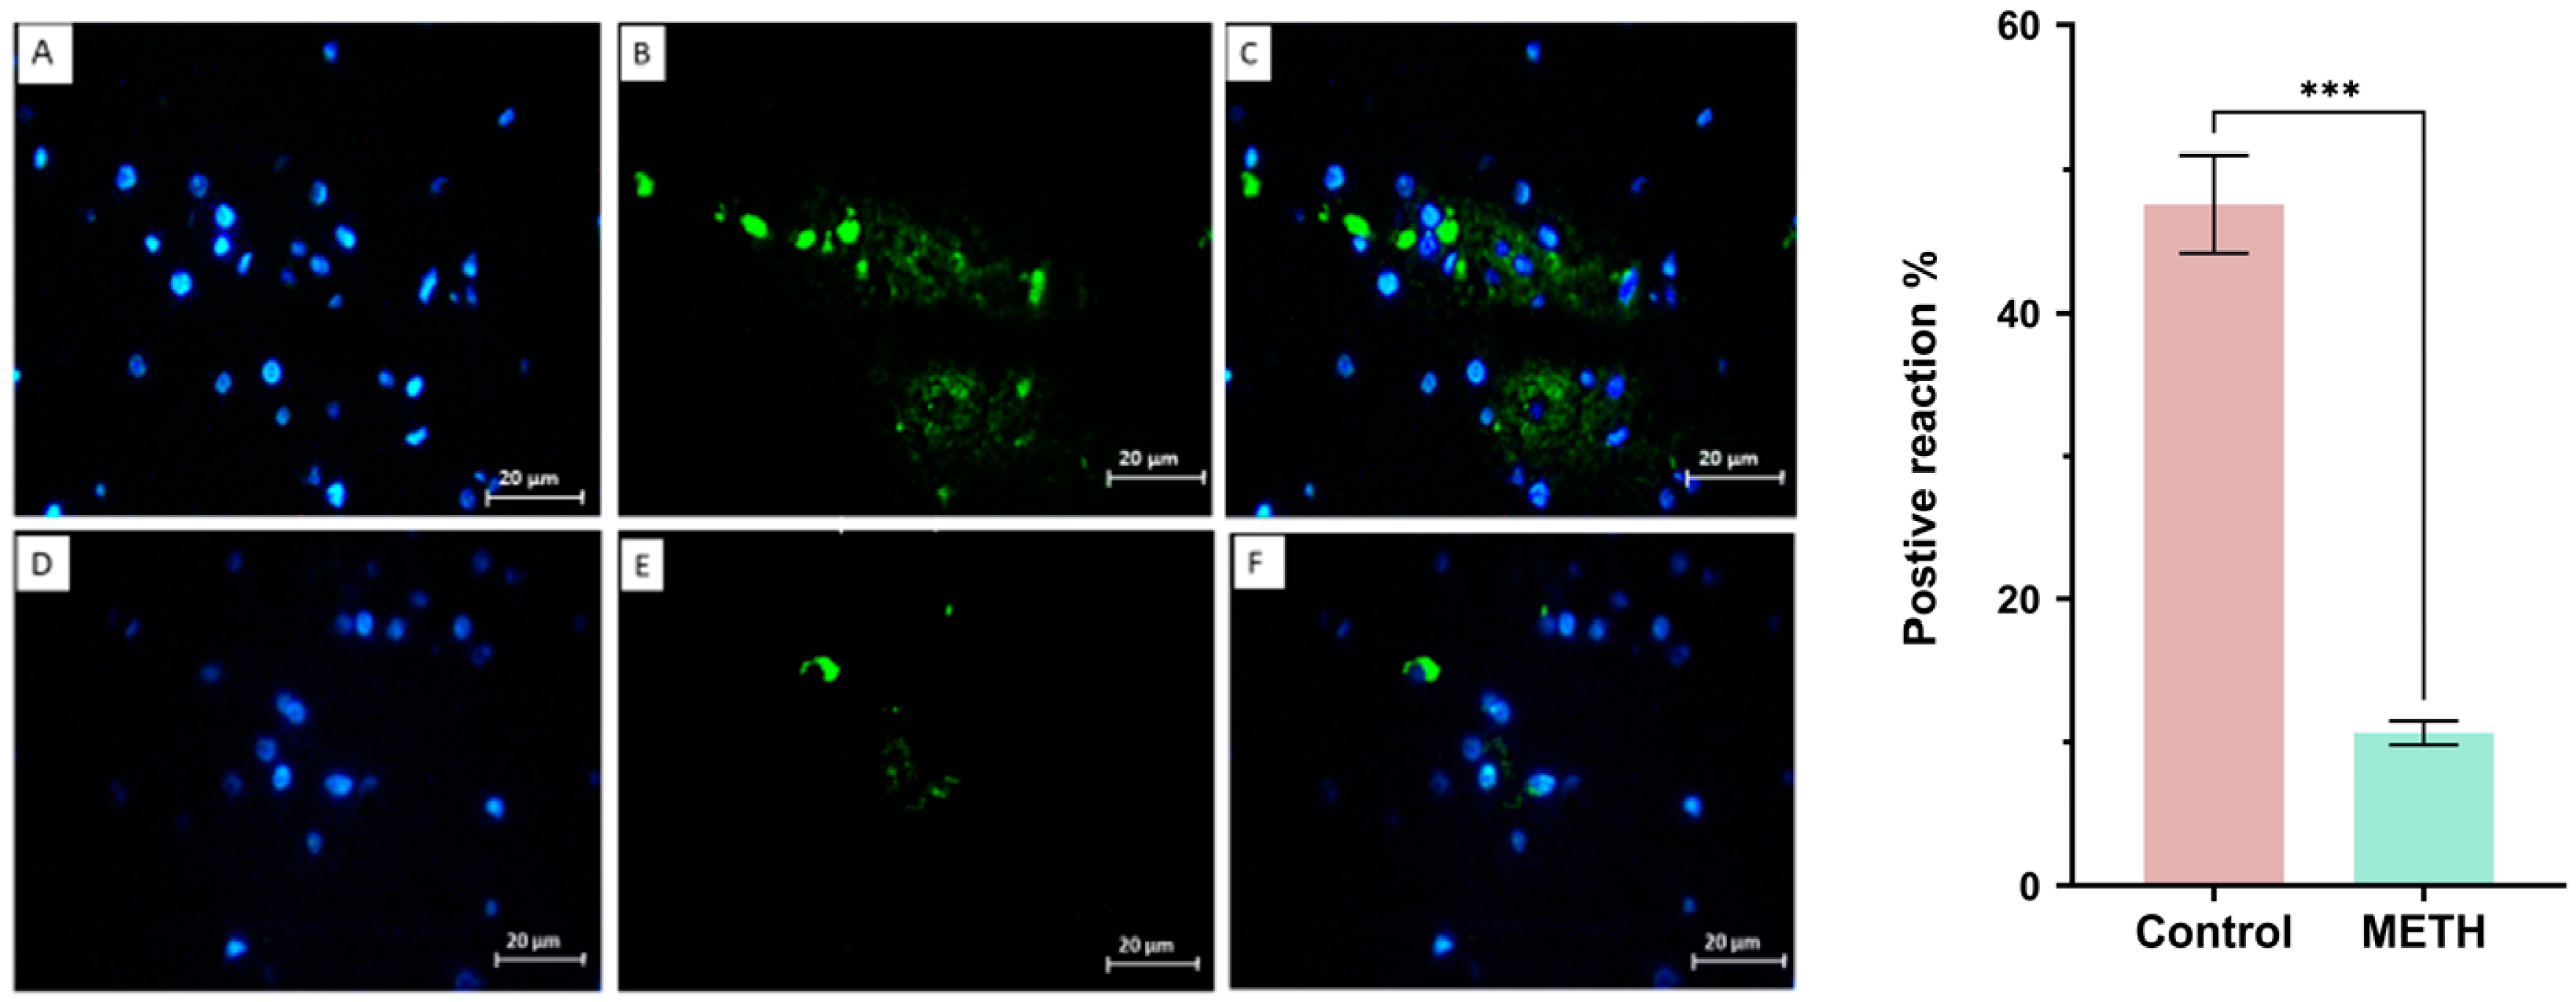
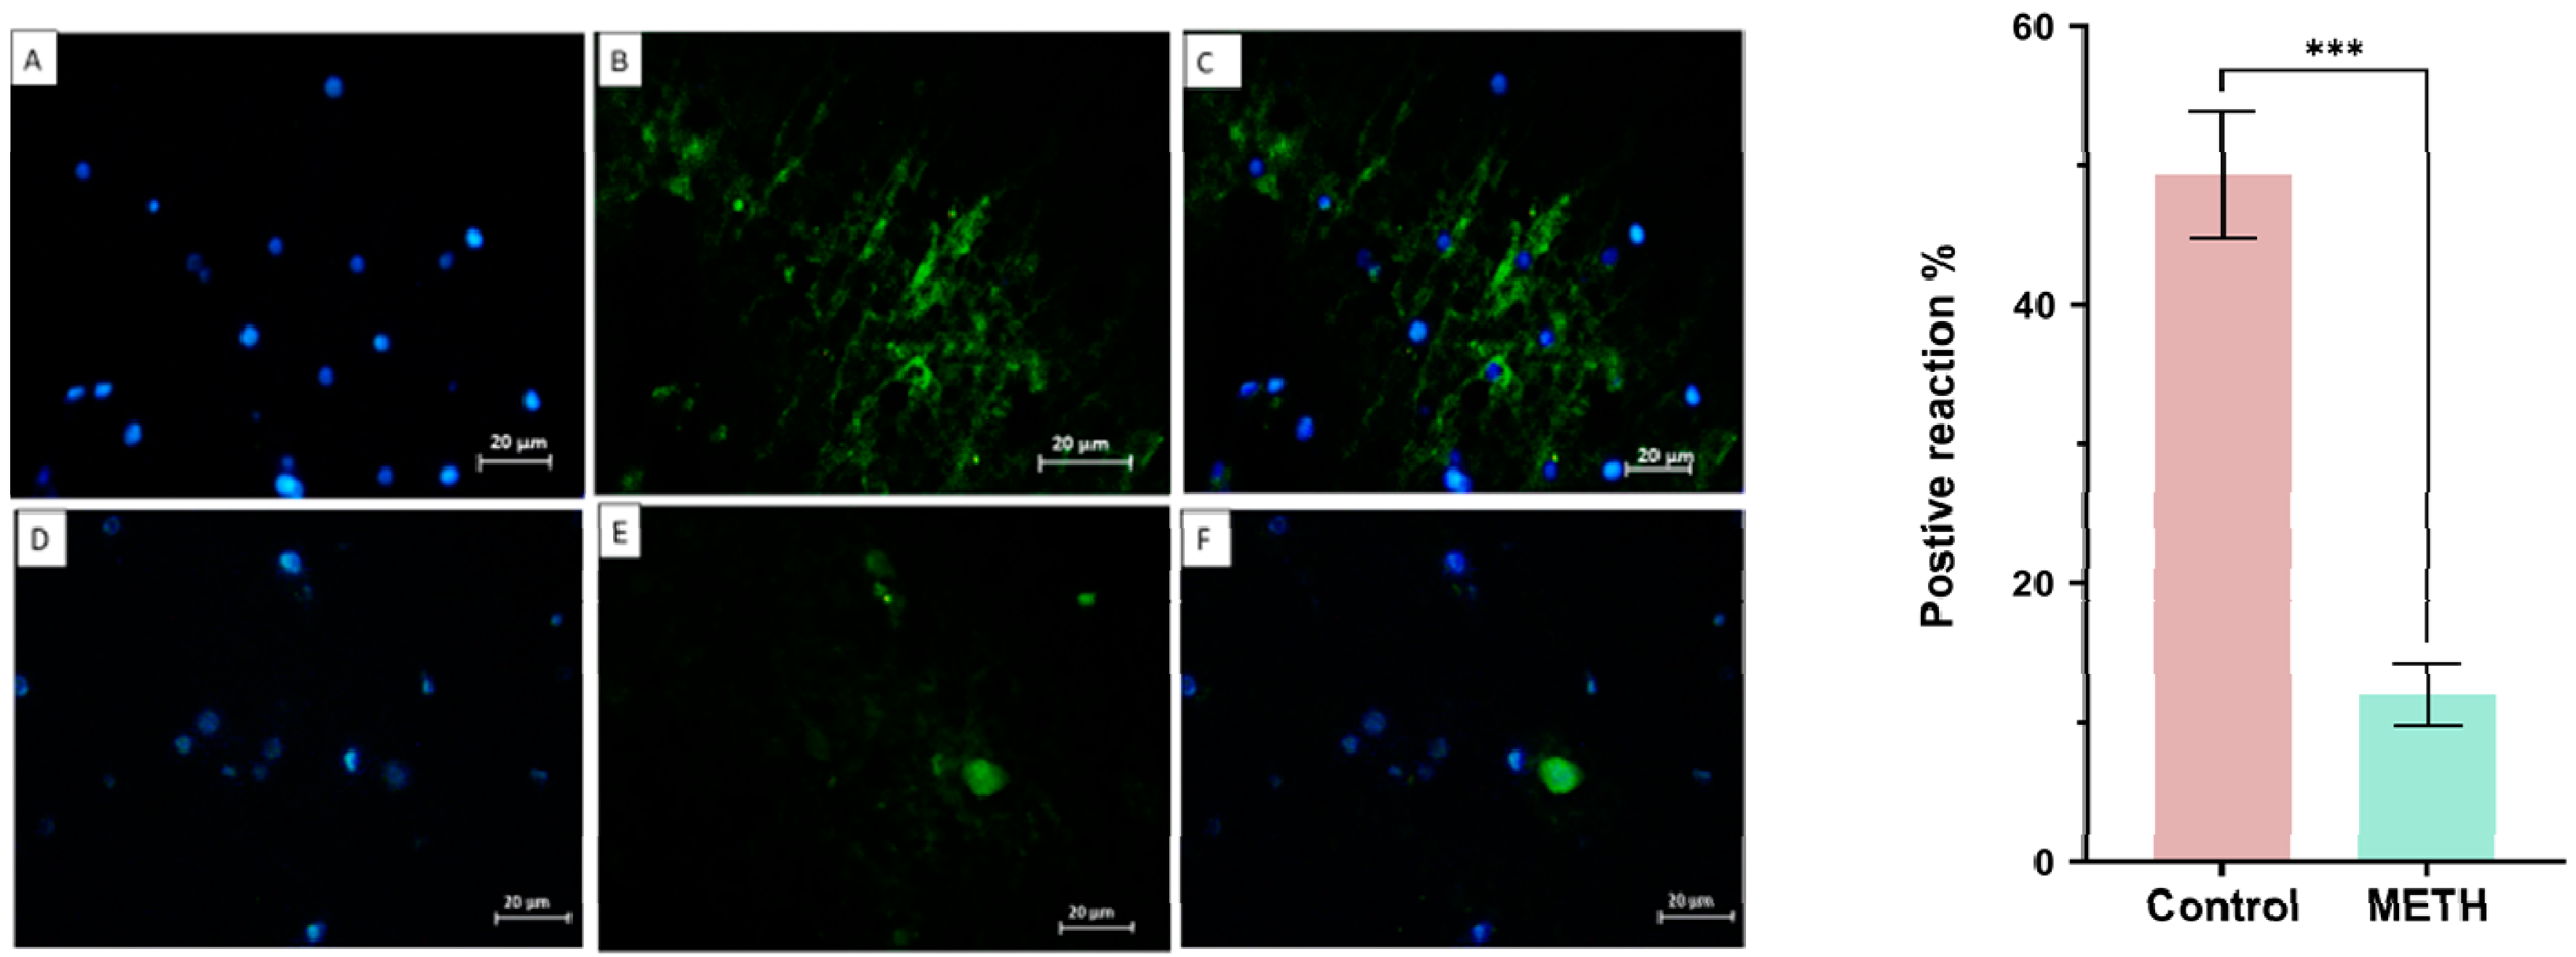
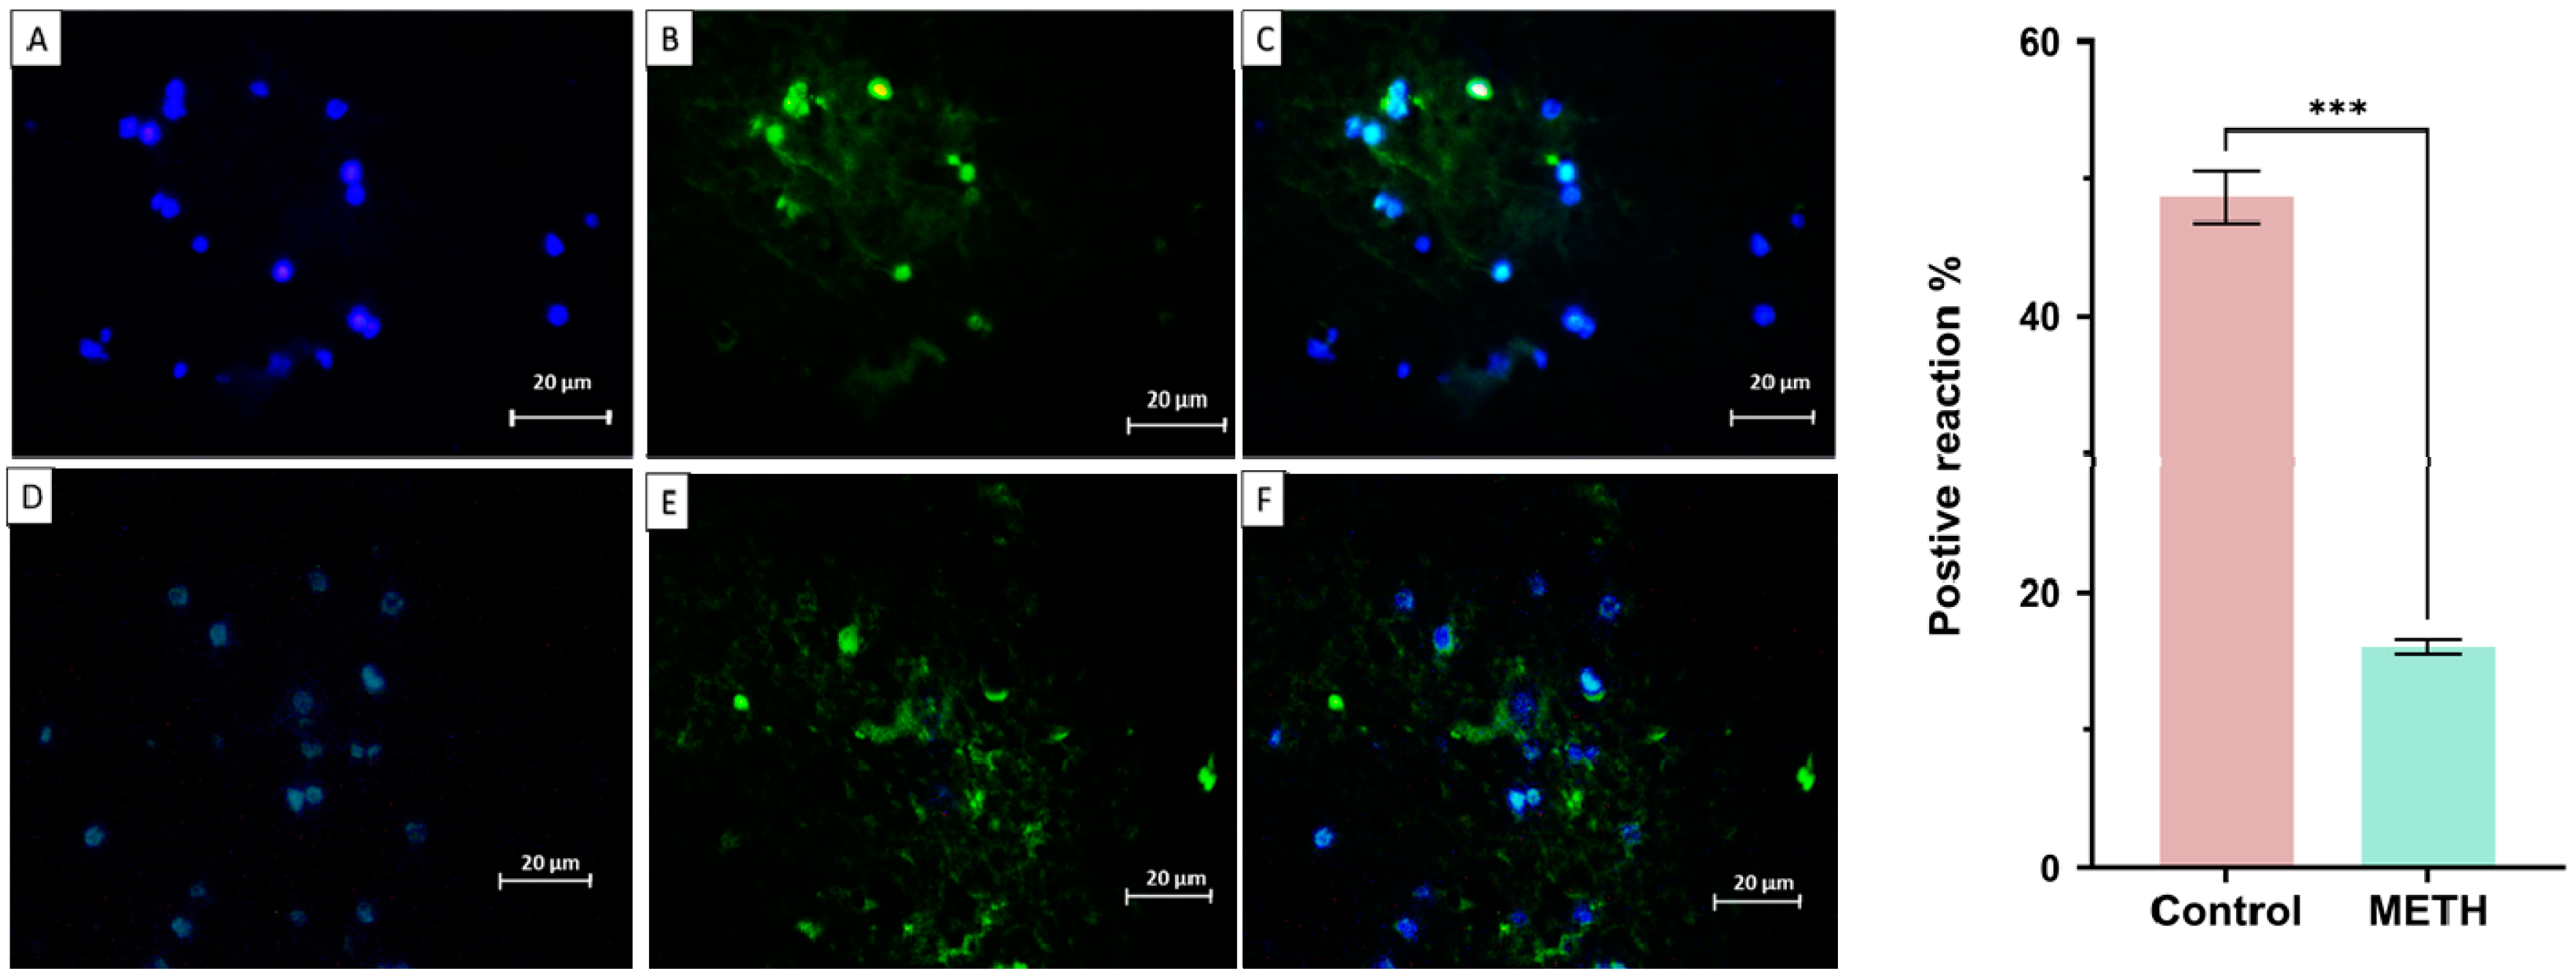
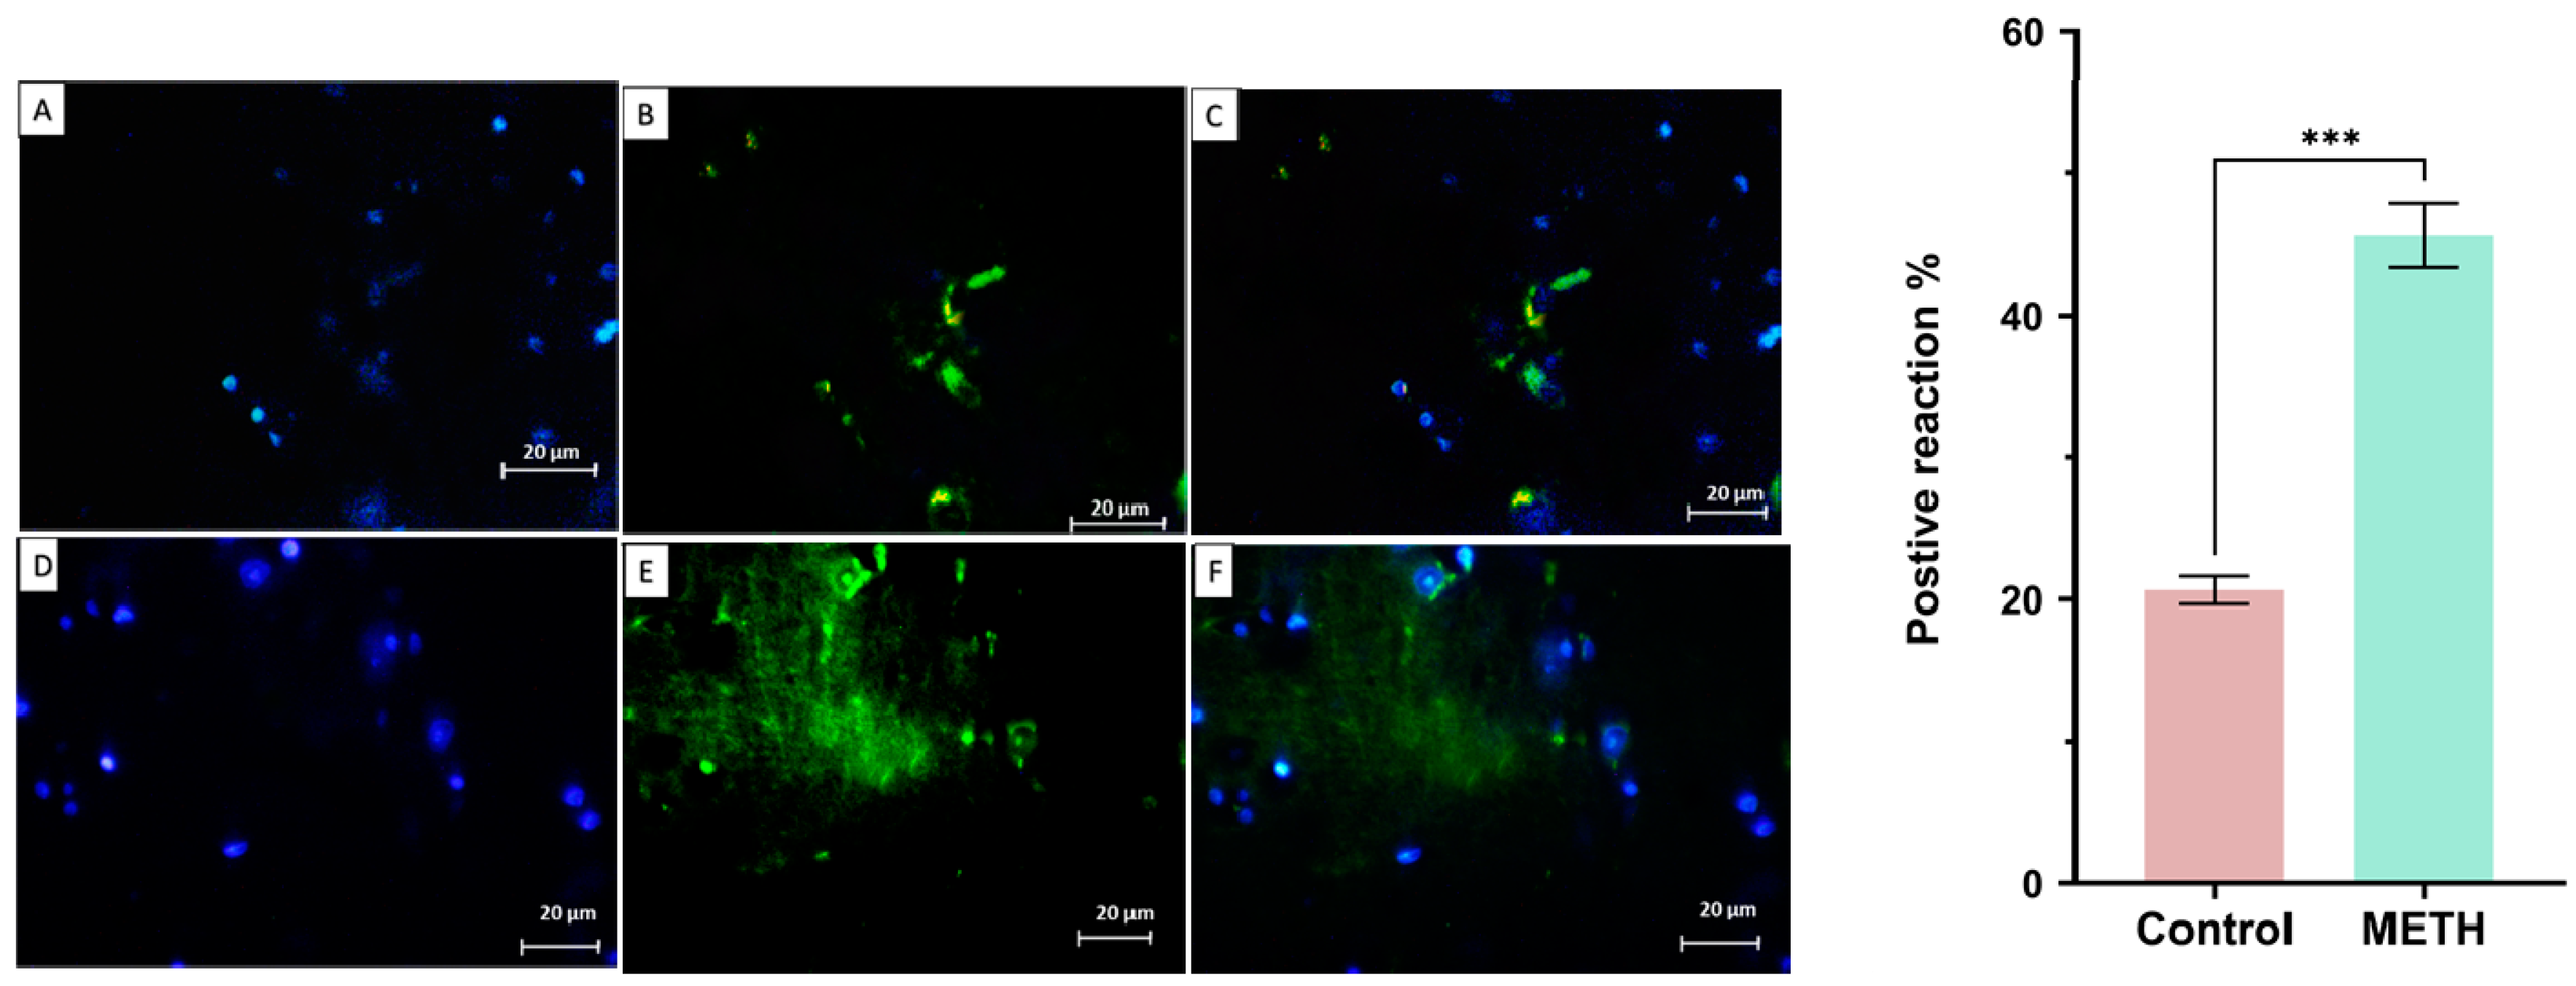
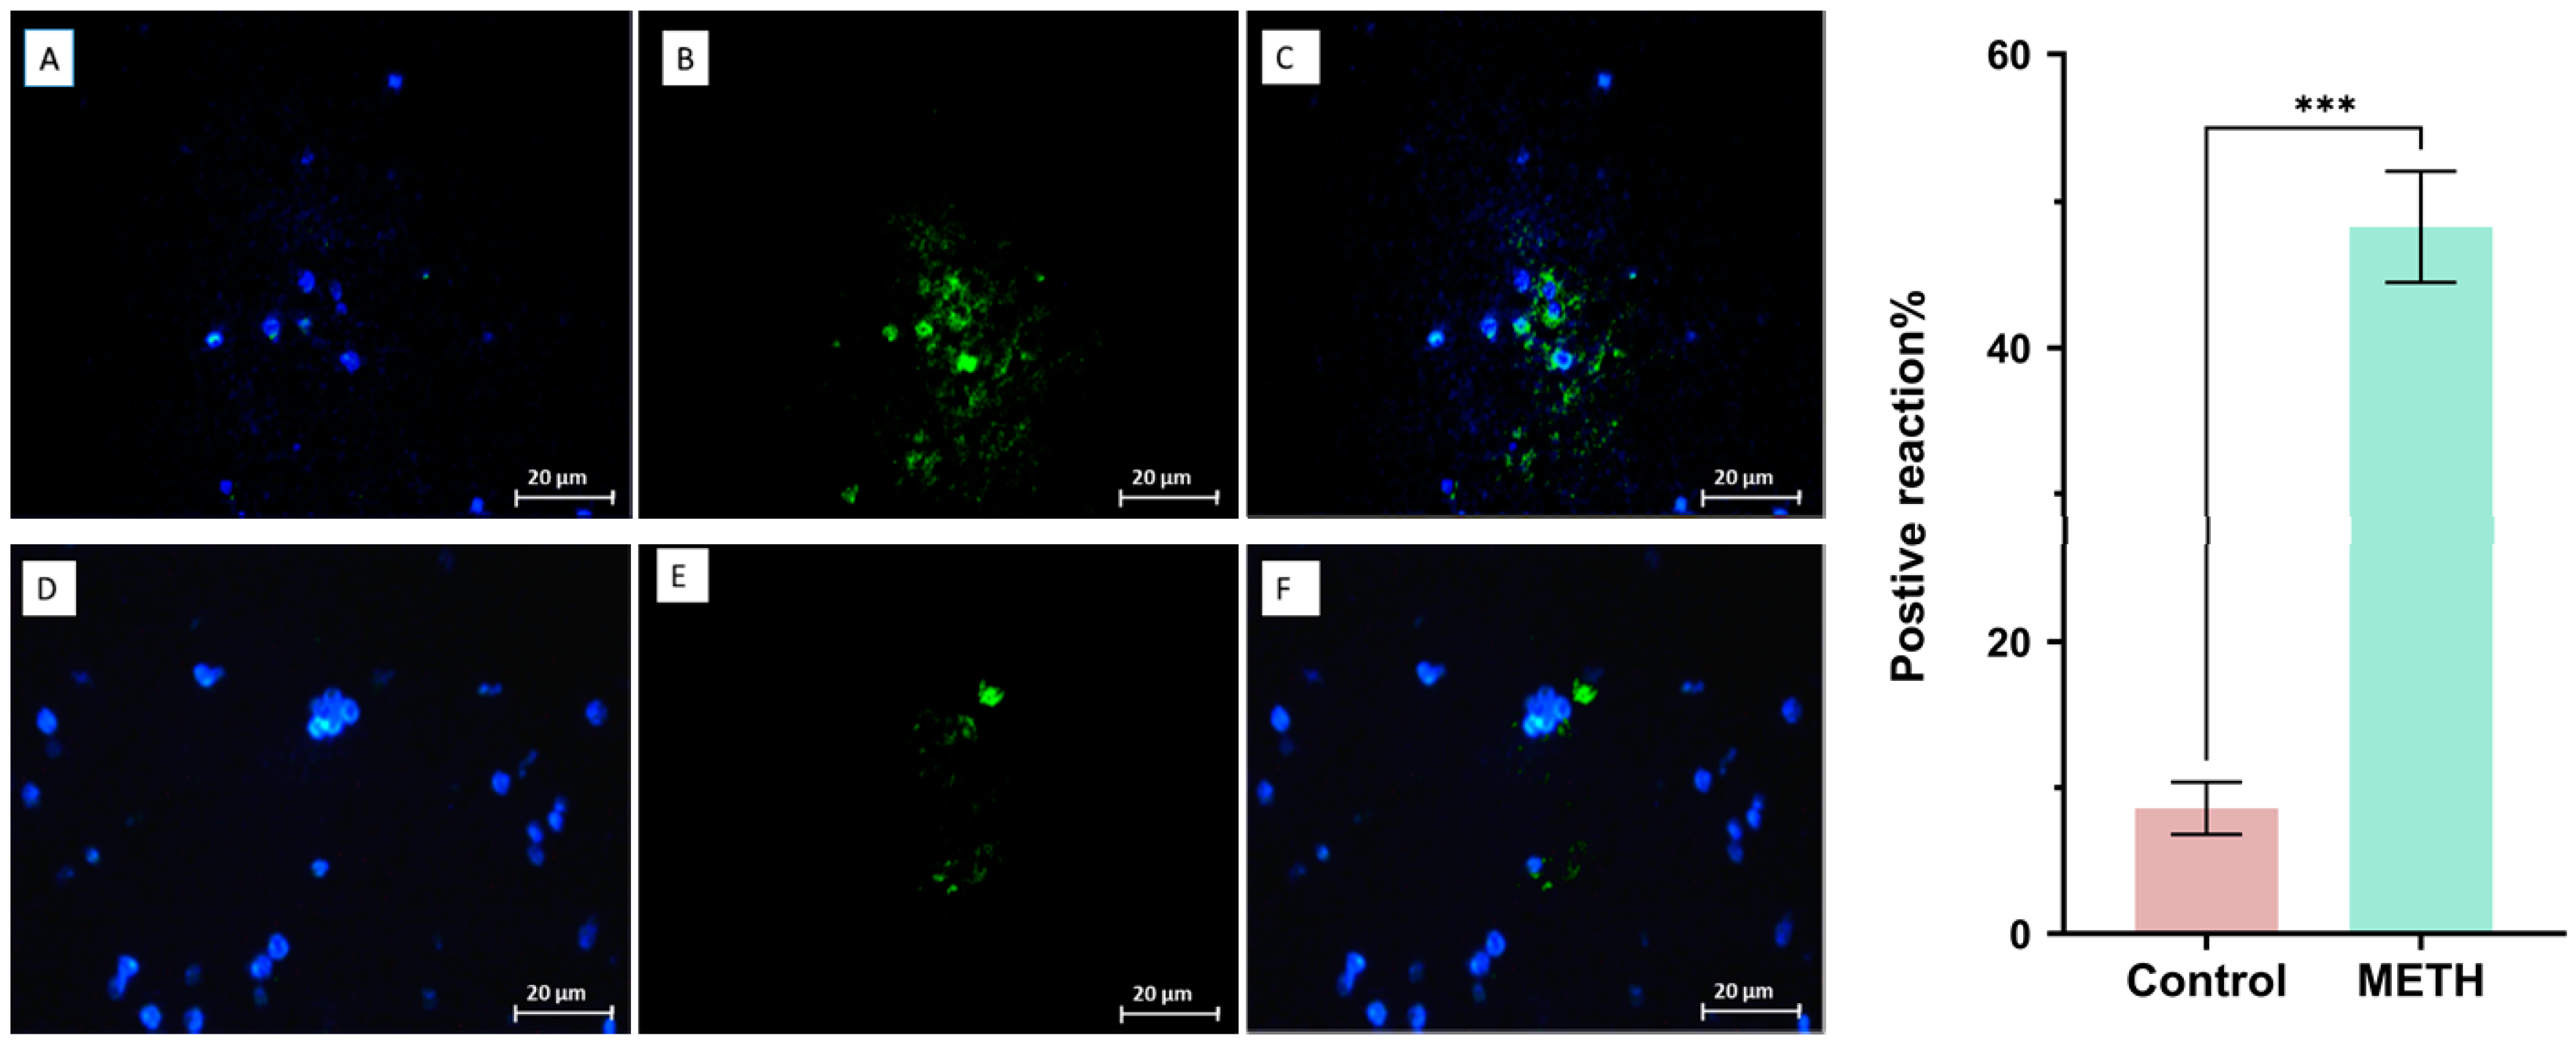
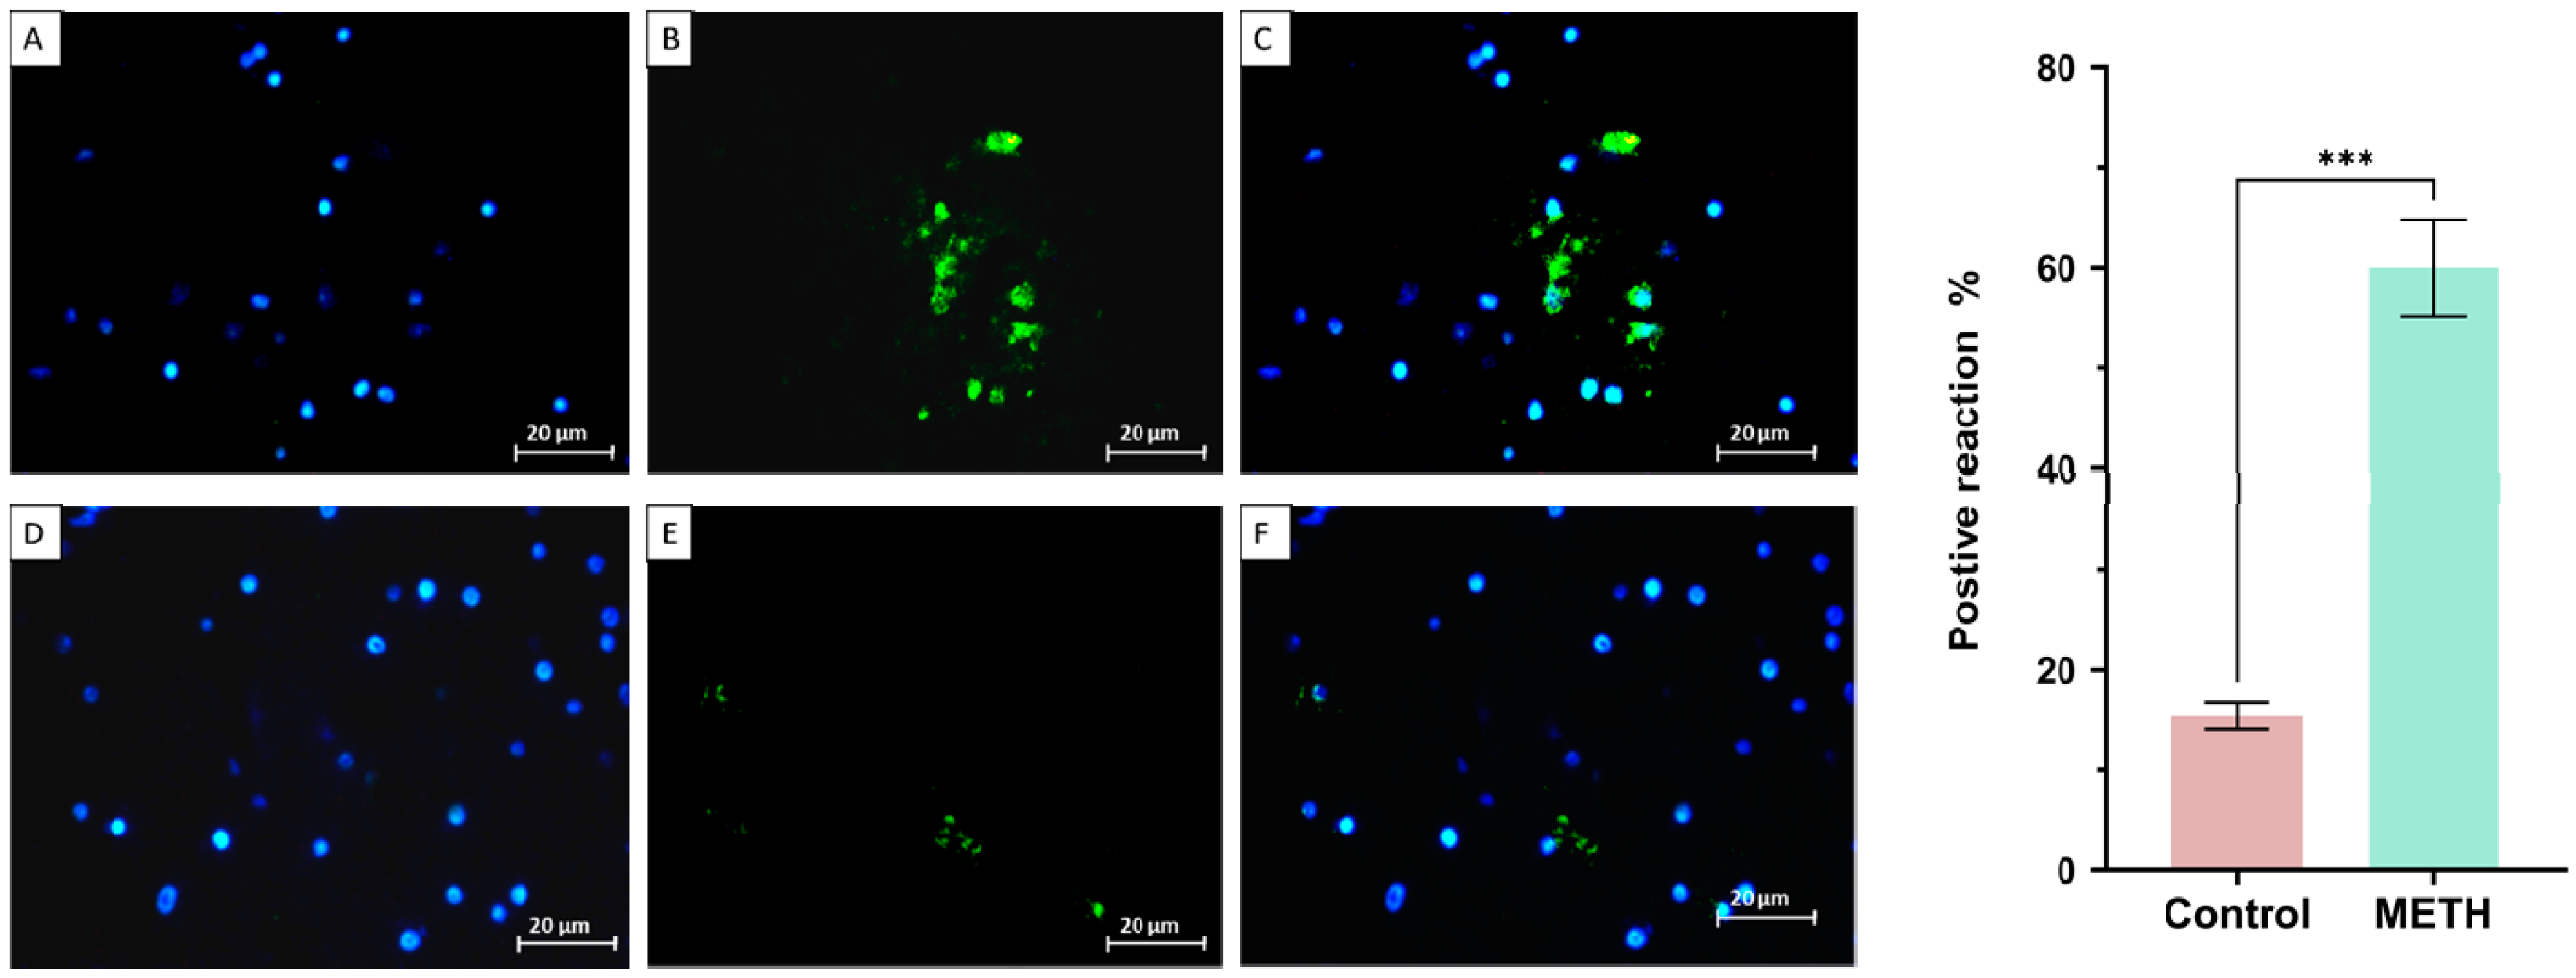
The protein expression of CREB, BDNF, Akt-1, GSK3, TNF-α, and RIPK3 in the amygdala samples was investigated, specifically in relation to the effects of METH. The findings revealed significant changes in the expression levels of these proteins. Notably, there were decreases in CREB (METH group: 9.65 ± 2.12, control group: 48.38 ± 1.27), BDNF (METH group: 12.59 ± 6.14, control group: 49.75 ± 4.52), and Akt-1 (METH group: 15.95 ± 4.03, control group: 47.71 ± 2.17). Conversely, there were increases in GSK3 (METH group: 46.66 ± 44.74, control group: 9.28 ± 9.38), TNF-α (METH group: 58.57 ± 8.44, control group: 16.56 ± 9.32), and RIPK3 (METH group: 44.71 ± 7.97, control group: 21.40 ± 9.73) (***P < 0.001).
Figure 2. The expression of CREB in the control group (upper row) and METH (lower row). DAPI (A, D), CREB (B, E), and merge (C, F). The results showed that METH reduced CREB expression in the METH group compared to the control group and these changes were significant (***P < 0.001) (mean±SD).
Preprints 74774 g002
Figure 3. The expression of BDNF in the control group (upper row) and METH (lower row). DAPI (A, D), BDNF (B, E), and merge (C, F). The results showed that METH reduced BDNF expression in the METH group compared to the control group (***P < 0.001) (mean±SD).
Preprints 74774 g003
Figure 4. The expression of Akt-1 was evaluated in the control (lower row) and METH (upper row) groups. DAPI (A, D), Akt-1 (B, E), and merge (C, F). The results showed that METH decreased Akt-1 expression in the METH group compared to the control group and these changes were significant (***P < 0.001) (mean±SD).
Preprints 74774 g004
Figure 5. The expression of RIPK3 in the control group (upper row) and METH (lower row). DAPI (A, D), RIPK3 (B, E), and merge (C, F). The results showed that METH increased RIPK3 protein expression in the METH group compared to the control group and these changes were significant (***P < 0.001) (mean±SD).
Preprints 74774 g005
Figure 6. The expression of GSK3 in the METH (upper row) and control groups (lower row). DAPI (A, D), GSK3 (B, E), and merge (C, F). The results showed that METH increased GSK3 expression in the METH group compared to the control group and these changes were significant (***P < 0.001) (mean±SD).
Preprints 74774 g006
Figure 7. The expression of TNF-α in the METH group (upper row) and control group (lower row). DAPI (A, D), TNF-α (B, E), and merge (C, F). The results showed that METH increased TNF-α expression in the METH group compared to the control group and these changes were significant (***P < 0.001) (mean±SD).
Preprints 74774 g007

Tunel assay

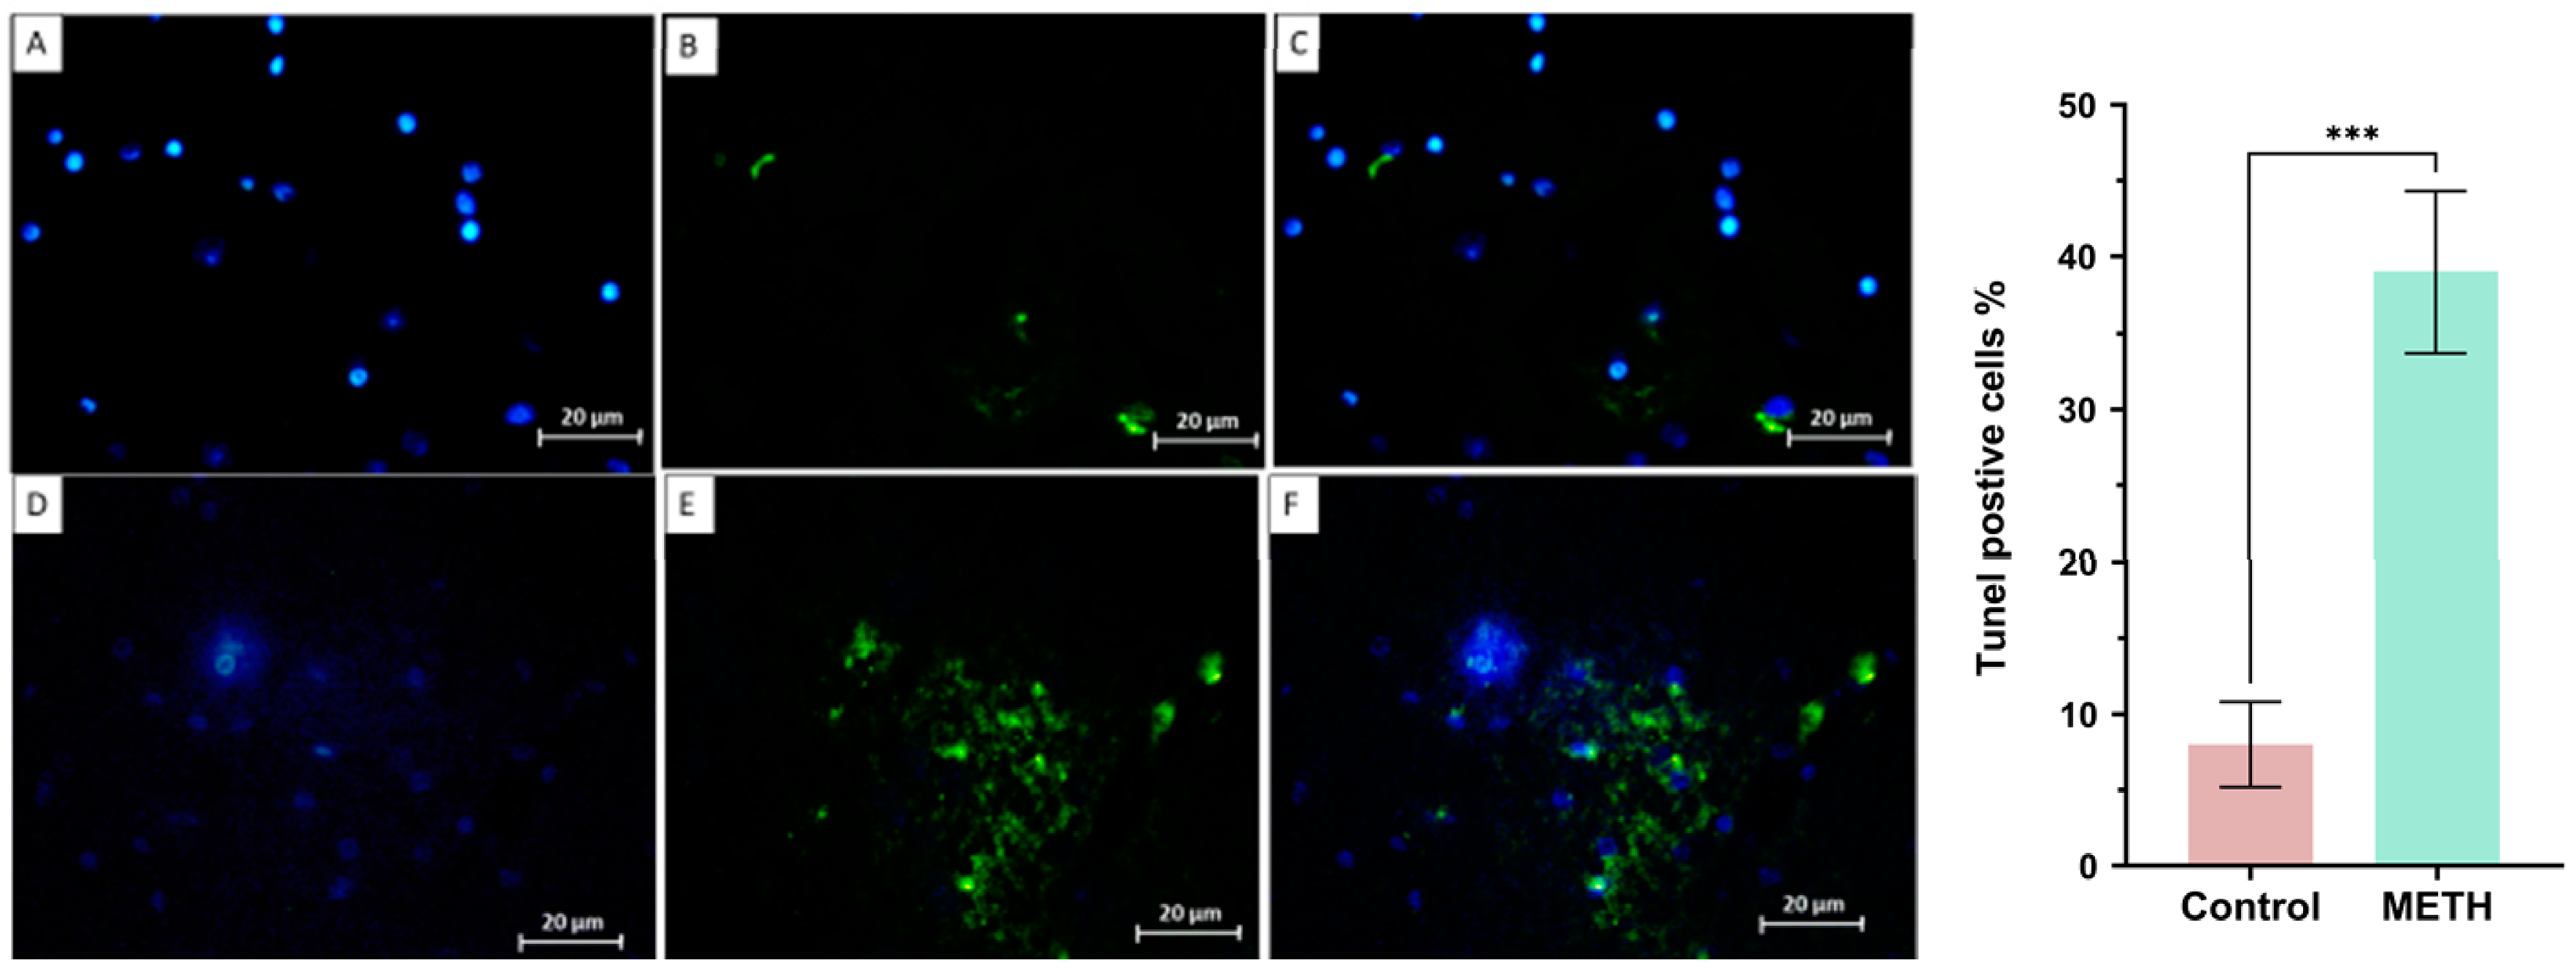
In our study, all apoptotic cells were counted. DAPI staining was used to discover the nucleus, and apoptotic cells were found through Tunel staining (Figure 8).
Figure 8. The result of tunel assay in the METH group (lower row) and control group (upper row). DAPI (A, D), apoptotic cells (B, E), and merge (C, F). The following chart confirmed that the apoptotic cells in the METH group increased in comparison with the control group (*** P<0.001).
Preprints 74774 g008

GPX Activation, GSSG, ROS

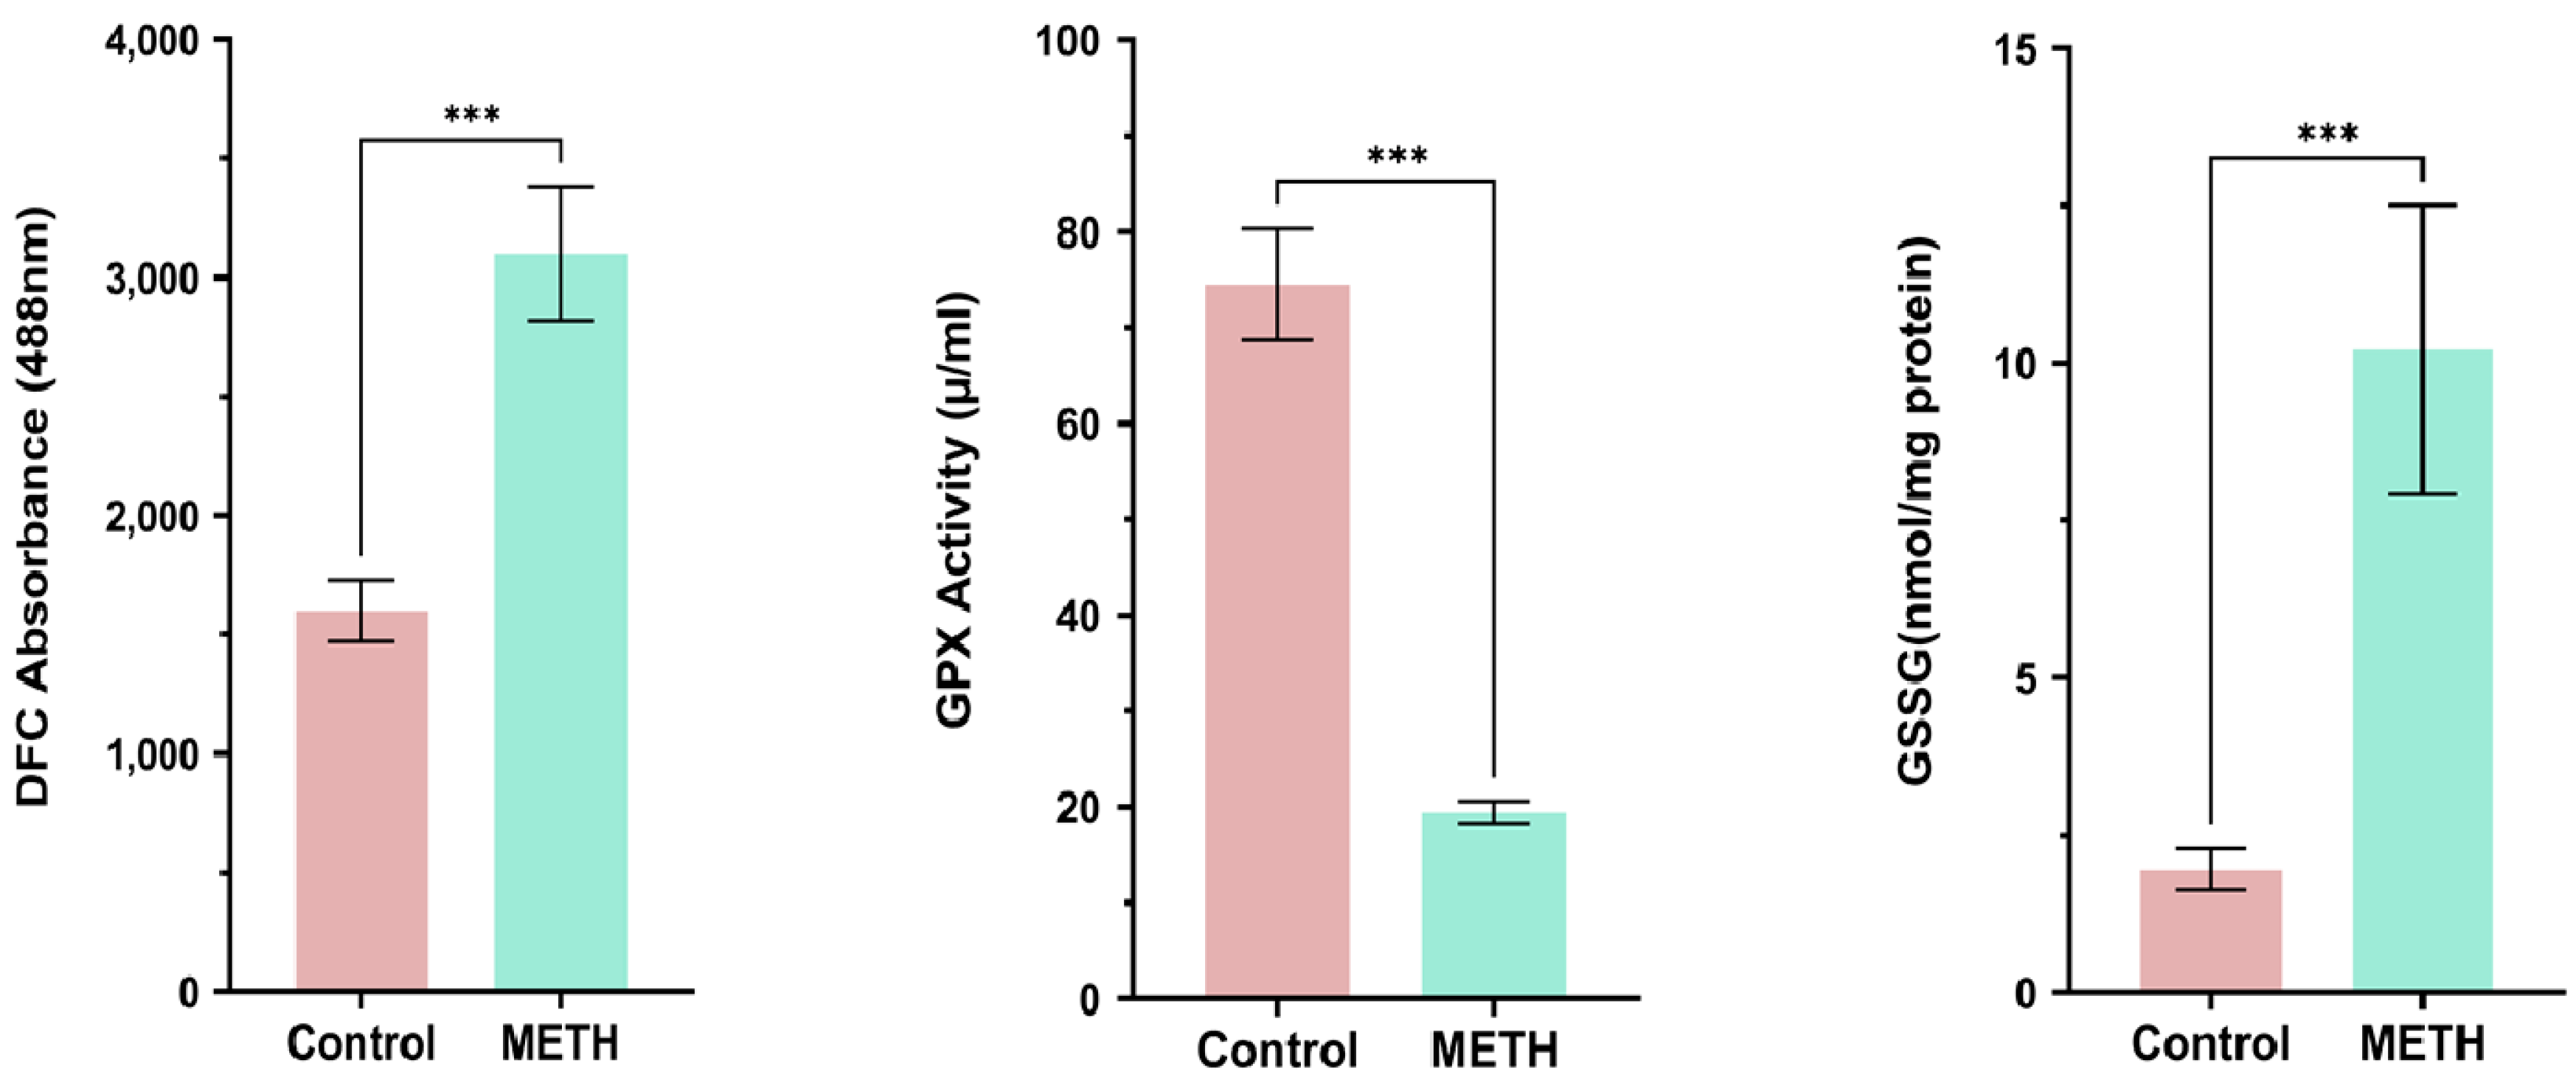
We conducted measurements of ROS production, GSSG, and GPX to assess oxidative stress levels. Our findings revealed a significant increase in the formation of ROS and GSSG in the METH group, indicating heightened oxidative stress. In contrast, the level of GPX, an antioxidant enzyme, decreased significantly compared to the control group (*** P<0.001) (Figure 9).
Figure 9. GPX Activation, GSSG, and ROS results in the METH and control groups. METH increases ROS, GSSG activity, but decreases GPX in comparison with the control group (*** P<0.001).
Preprints 74774 g009

Stereological analysis of the amygdala
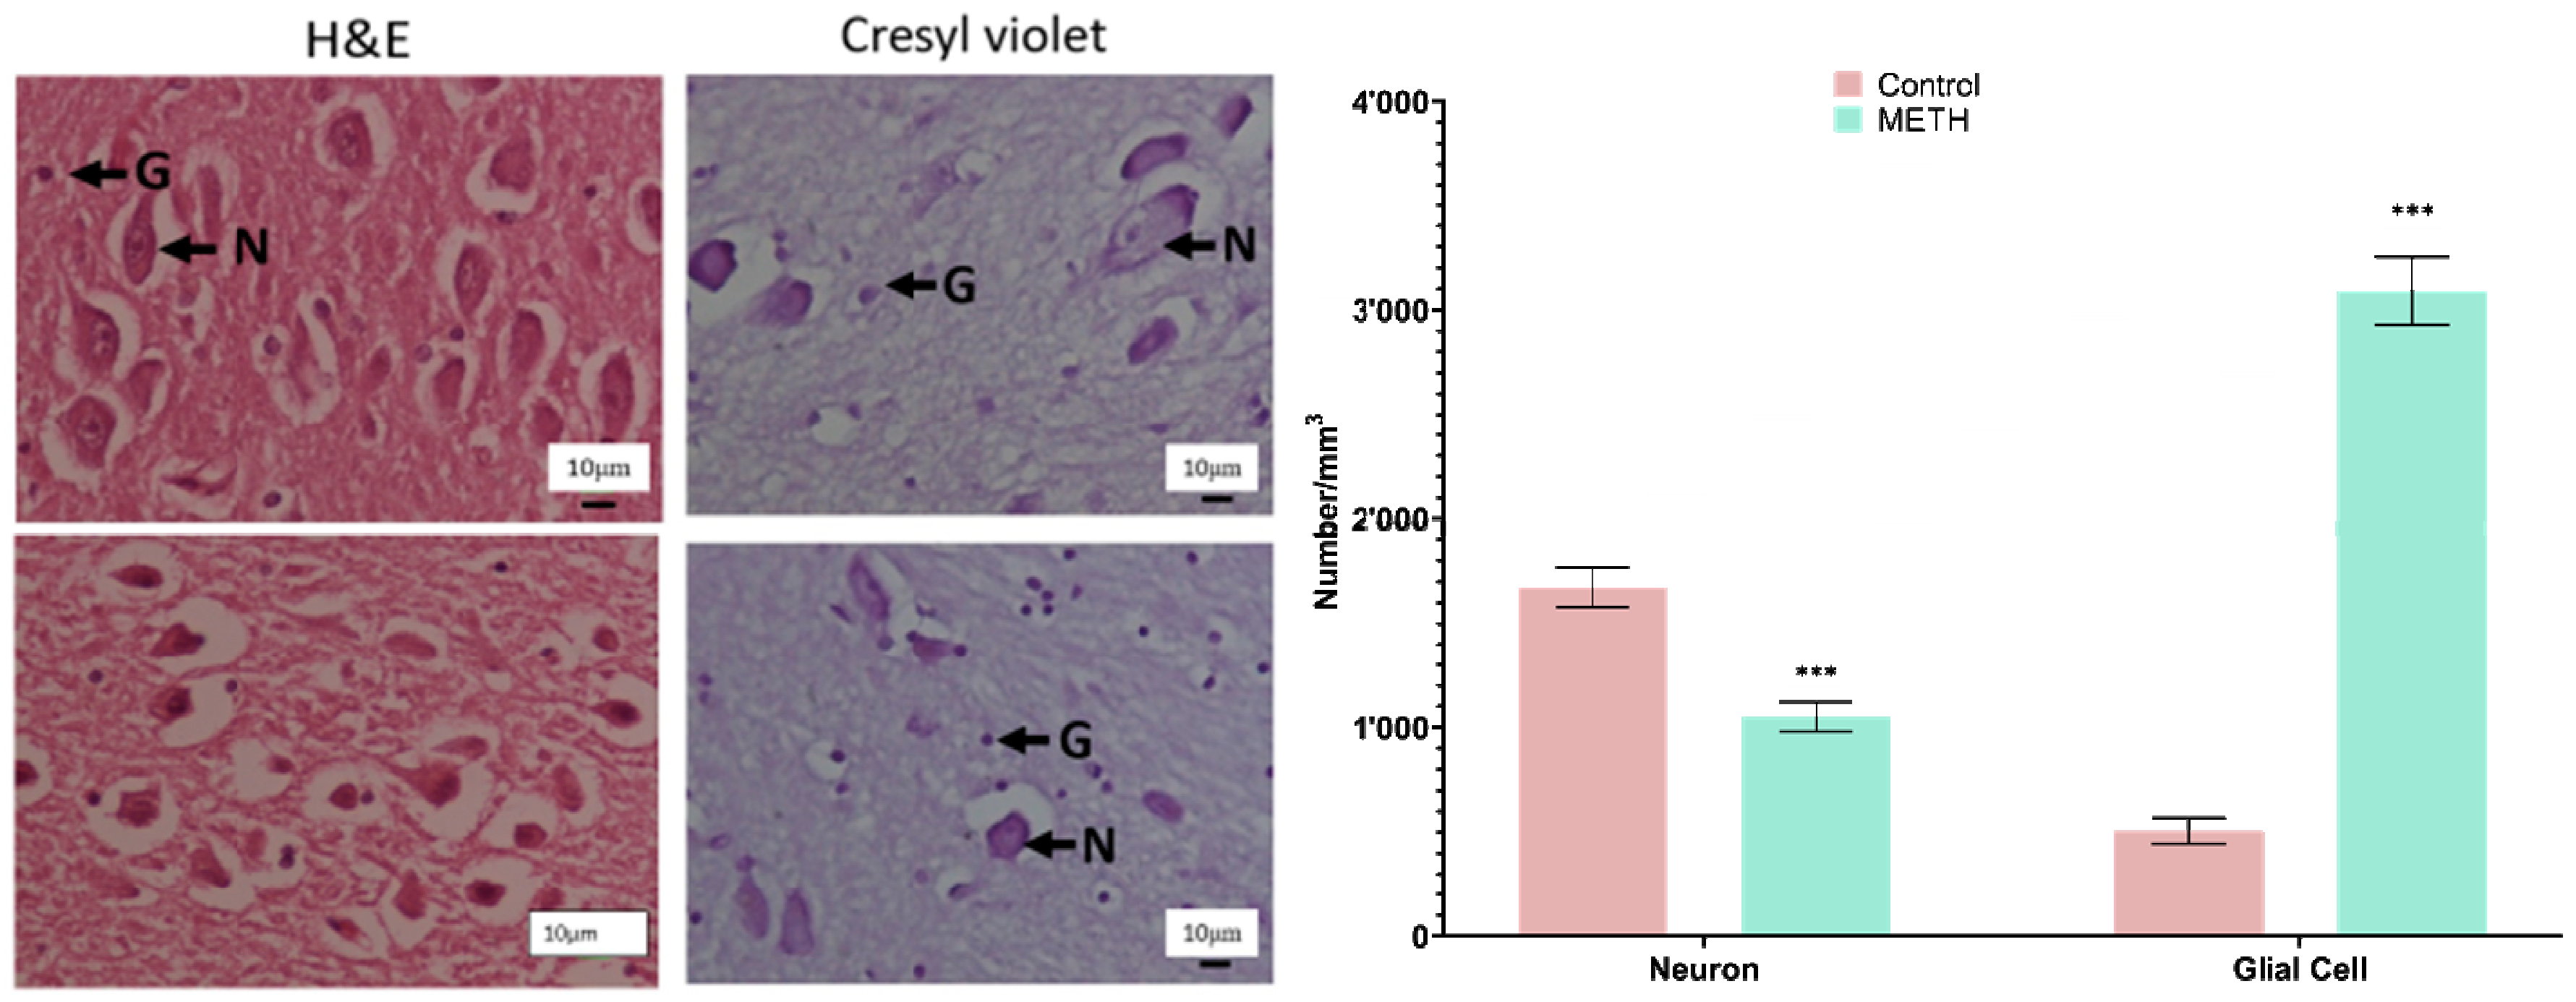
The amygdala nuclei were subjected to H&E and Cresyl violet staining in the study groups. Our observations revealed that neuronal vacuolation and gliosis were notably more severe in the METH group compared to the control group. Stereological analysis of neuron and glial cell numbers was performed on both groups. The METH group exhibited a significant decrease in the number of neurons and a marked increase in the number of glial cells compared to the control group (P < 0.001) (Figure 10).
Figure 10. (A) Photomicrograph of the amygdala nuclei stained with H&E and Cresyl violet. This neuronal vacuolation and gliosis were particularly severe in the METH group (lower row) compared to the control group (upper row). (B) The stereological data of the number of neurons and glial cells in the control and METH groups. The number of neurons in METH groups decreased compared to the control group, and the number of glial cells increased (P < 0.001). Abbreviation: N: Neuron, G: Glial molecular, DN: Degenerated Neuron.
Preprints 74774 g010

Immunoblotting

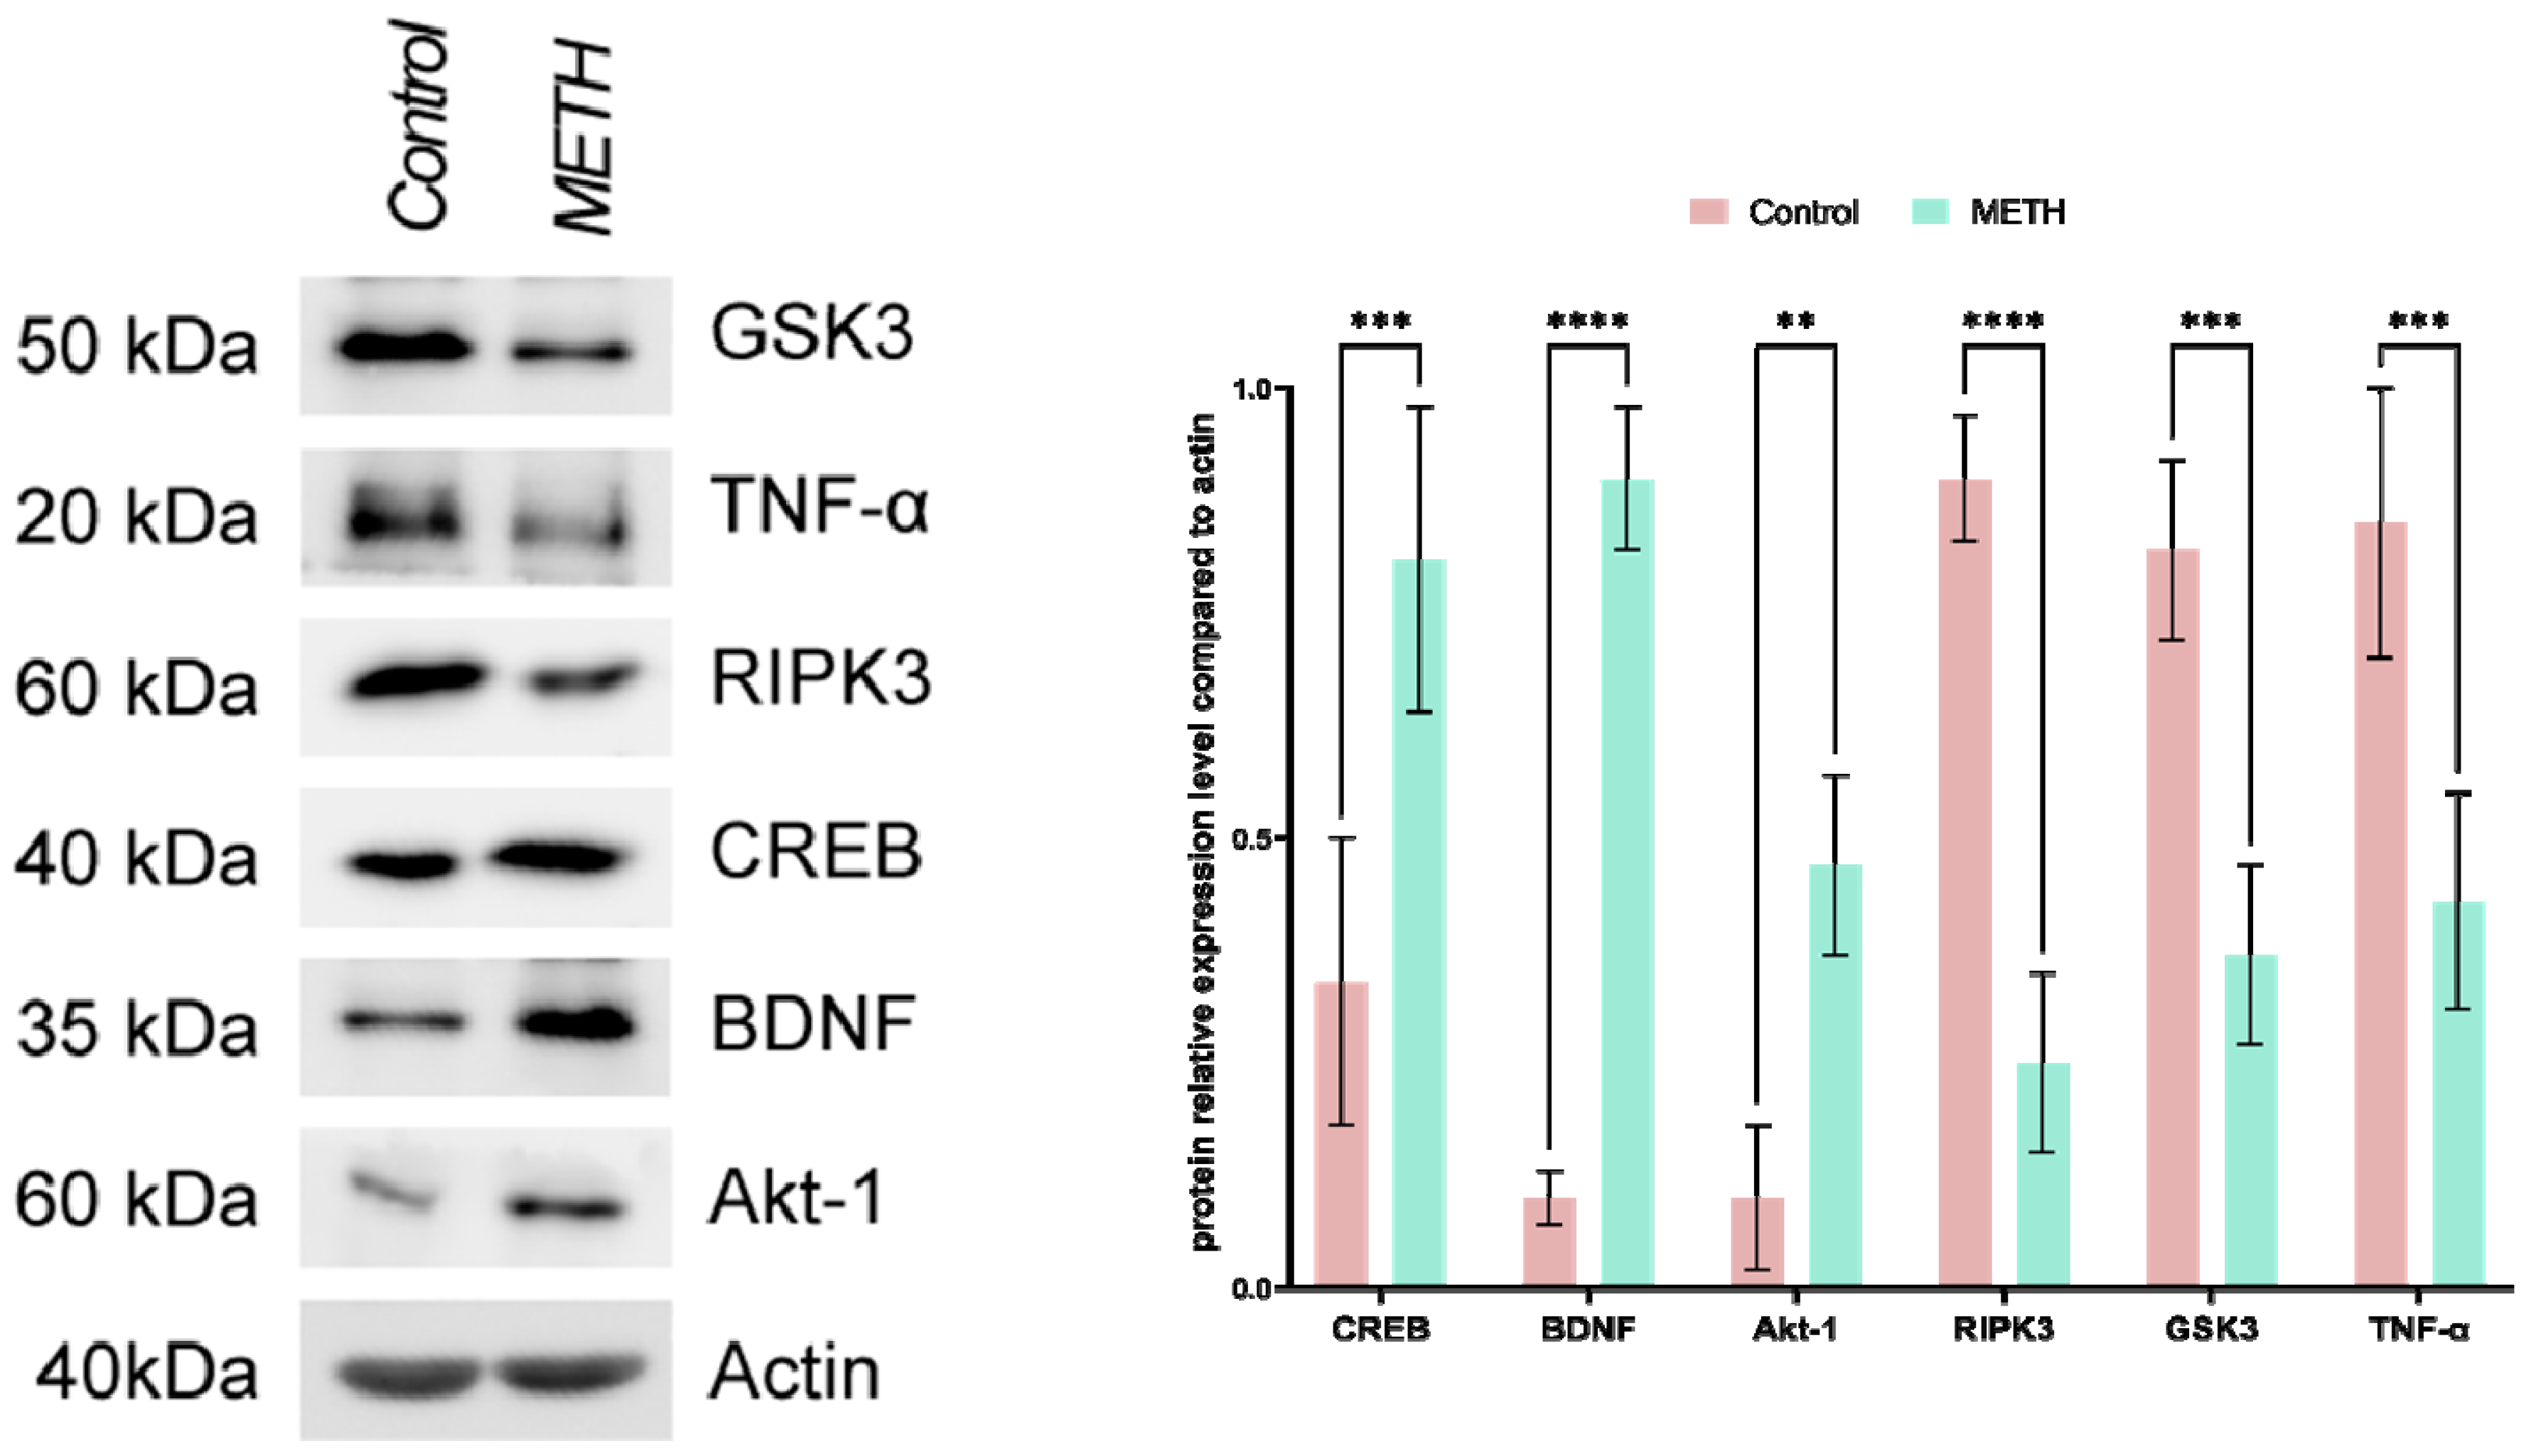
Following the execution of immunoblotting, protein levels were assessed. The results obtained align with our findings from real-time PCR. Specifically, in the METH group, there was a notable rise in the levels of various proteins, including GSK3, TNF-α, and RIPK3, when compared to the control group. Conversely, the levels of several proteins such as CREB, BDNF, and Akt-1 exhibited a decrease.
Figure 11. Immunoblotting shows effects of METH on the level of GSK3, TNF-α, and RIPK3, CREB, BDNF, and Akt-1. ACTIN is used as a loading control in blots.
Preprints 74774 g011

3. Discussion

METH is a widely known nervous system stimulant that has been extensively studied for its therapeutic effects in various diseases. However, the misuse and uncontrolled use of METH have become a growing concern due to its high potential for abuse and its illegal nature [8]. Previous research has clearly demonstrated the detrimental impact of METH on the central nervous system (CNS), leading to various neurological and behavioral disorders such as delirium, paranoia, anxiety, depression, memory impairment, hallucinations, and poor concentration among METH users [11]. The exact molecular mechanisms underlying METH-induced neurological effects are still not fully understood, although several hypotheses have been proposed. Increased production of reactive oxygen and nitrogen species, induction of autophagy and apoptosis, elevated levels of inflammatory factors, and mitochondrial dysfunction are believed to play a role [13,38]. Specifically, disruption of dopaminergic and serotonergic neurons has been linked to METH’s neurological effects [49]. Our study investigated the effects of METH on the amygdala and revealed significant alterations in various parameters. We observed a significant reduction in glutathione peroxidase (GPX) activation and downregulation of BDNF, CREB, and Akt-1 expression/levels. Additionally, we noted a marked increase in the levels of GSSG, reactive oxygen species (ROS), RIPK3, GSK3, and the inflammatory factor TNF-α in the postmortem amygdala of METH users compared to the control group. These findings align with previous studies suggesting that METH disrupts ion channels, leading to increased intracellular calcium levels, mitochondrial dysfunction, impaired energy metabolism, and excessive production of reactive oxygen species, ultimately interfering with the antioxidant system in neural cells [13,49,50].
In pathological states of the nervous system, astrocytes and microglia undergo hypertrophy and hyperactivation, resulting in the overproduction of inflammatory factors and subsequent neuroinflammation [49]. The combination of these factors ultimately leads to the destruction of nerve cells and the development of irreversible neurological defects in METH users [27].
Our findings are consistent with earlier research showing significant increases in GSSG, malondialdehyde (MDA), GSK3, and TNF-α in METH users, along with a notable decrease in mitochondrial glutathione (GSH) levels and an increase in GSSG and ROS in the amygdala [13,34] [38]. Although apoptosis, autophagy, and inflammation have been proposed as potential mechanisms for the adverse effects of METH on the CNS, the exact molecular mechanisms and signaling pathways involved have not been fully elucidated [34,38].
Previous studies have highlighted the neuroprotective effects of factors such as CREB, BDNF, and Akt-1 in the CNS, promoting neuronal regeneration, survival, and growth [51]. Impairment in CREB regulation has been linked to programmed cell death, ROS production, and neurodegeneration [52]. In light of this, we conducted a comprehensive analysis of the potential signaling pathways, namely CREB/BDNF and Akt-1/GSK-3, that may be disrupted in the amygdala of individuals using METH. Consistent with previous studies, our findings provide further evidence of significant downregulation in the expression/levels of BDNF, CREB, and Akt-1 (both total and phosphorylated forms), while demonstrating a noteworthy increase in GSK-3 levels [40,41,42]. We observed significant alterations in multiple parameters in the amygdala of METH users. These include elevated levels of inflammatory cytokine TNF-α, increased levels of GSSG, ROS, and GSK3, as well as notable downregulation of BDNF, CREB, and Akt-1. These changes are consistent with previous research, suggesting that METH disrupts ion channels, impairs mitochondrial function, and interferes with the antioxidant system in neural cells. Furthermore, our study aligns with previous findings regarding the hypertrophy and hyperactivation of astrocytes and microglia in pathological states of the nervous system. These processes contribute to the overproduction of inflammatory factors and subsequent neuroinflammation, ultimately leading to irreversible neurological defects in METH users.
Our results also support earlier studies reporting significant increases in GSSG, malondialdehyde (MDA), GSK3, and TNF-α, along with a decrease in mitochondrial glutathione (GSH) levels in the amygdala of METH users. While apoptosis, autophagy, and inflammation have been proposed as potential mechanisms, further research is required to fully elucidate the molecular mechanisms and signaling pathways involved in METH-induced CNS damage. Previous research has highlighted the neuroprotective effects of factors such as CREB, BDNF, and Akt-1, which promote neuronal regeneration, survival, and growth in the CNS. Impairment in CREB regulation has been associated with programmed cell death, ROS production, and neurodegeneration.
By examining the potential signaling pathways disrupted in the amygdala of METH users, namely CREB/BDNF and Akt-1/GSK-3, our study provides further evidence of the significant downregulation of BDNF, CREB, and Akt-1, as well as an increase in GSK-3 levels. These findings contribute to our understanding of the molecular mechanisms underlying METH-induced neurotoxicity. In summary, our study enhances the knowledge surrounding the detrimental effects of METH on the amygdala. By shedding light on previously unknown mechanisms and providing valuable insights into the impact of METH on the brain, our findings contribute to the development of targeted interventions and therapeutic strategies aimed at mitigating the harmful effects of METH use on the CNS.

4. Materials and methods

Sample preparation

A total of 20 male human brains, consisting of 10 control subjects and 10 individuals with a history of METH use, were obtained from the Iranian legal medicine organization in Tehran, Iran. Rigorous screening procedures were conducted to ensure the quality and validity of the samples, including verification of medical history, documentation of expiration, and examination of postmortem reports. The samples selected for this study were obtained from individuals with an average age of 38 ± 2 years at the time of death, and the entirety of the amygdala was included in the analysis.
The research procedures conducted in this study have received ethical approval from the Ethics Committee of Shahid Beheshti University of Medical Sciences (SBMU) under the reference number IR.SBMU.RETECH.REC.1400.432. To determine the presence of METH in the samples, three different methods were employed: Urine rapid test, High-Performance Liquid Chromatography (HPLC), and Gas Chromatography/Mass Spectrometry (GC/MS). The urine rapid test utilized a Detect Diagnostics kit capable of identifying 12 different types of drugs, including METH, cannabis, tramadol, morphine, and methadone. Initially, all samples underwent preparation for preliminary examination. Protein extraction and isolation were performed by adjusting the pH using acidic, alkaline, and opioid solvents. Thin Layer Chromatography (TLC) was used as the preliminary screening method to detect the presence of drugs in the samples. If the TLC results were positive for the presence of the drug, further analysis was carried out using HPLC and GC/MS. If any drugs other than amphetamines were detected in the samples at this stage, the sample would be excluded from the study, as the presence of any other drugs could confound the results. Samples that yielded satisfactory results were accepted for further analysis. Following the initial preparation of the samples, METH in urine and stomach contents was examined. The presence of METH was detected by derivatizing it with heptafluorobutyric anhydride (HFBA), which allowed for the measurement of the METH or amphetamine derivative using GC/MS [33].

Tissue Preparation

The brain samples were carefully extracted from the skull and thoroughly rinsed to eliminate any traces of blood clots. To facilitate hematoxylin and eosin (H and E) staining, TUNEL assay, and immunohistochemistry analysis, the amygdala region of all brain samples was dissected by a skilled neuroanatomist and subsequently fixed in 4% paraformaldehyde for a period of one week. For the real-time PCR assay, the amygdala was also dissected and immediately stored at a temperature of -80 °C.

Real-time PCR

Total RNA was extracted from the samples using RNX-plus, and cDNA synthesis was performed using the RevertAid H Minus First Strand cDNA Synthesis Kit from Fermentase. The cDNA synthesis reaction involved the addition of 0.2 μg of Random Hexamer and 1 μg of total RNA. Subsequently, a mixture of 1 μl of each primer, 10 μl of SYBR Green Master Mix, and 10 μl of dH2O was prepared, to which 2 μl of the sample cDNA was added. The real-time PCR reactions were carried out using an ABI device, with each sample analyzed in duplicate and repeated three times (n = 3). The data obtained were evaluated using the ∆∆Ct method [45].
Table 1. Sequence of primers used in the qRT-PCR amplification.
GENE FORWARD REVERSE Accession No
CREB CCAGGTGTAGTTTCTCGAGGTGC TGTTGGTGAGTCTCGAGGC NM_004379
BDNF CATCCGAGGACAAGGTGGCTTG GCCGAACTTTCTGGTCCTCATC NM_001143810,
Akt-1
GSK3
TNF-α
TGGACTACCTGCACTCGGAGAA
CCGACTAACACCACTGGAAGCT
CTCTTCTGCCTGCTGCACTTTG
GTGCCGCAAAAGGTCTTCATGG
AGGATGGTAGCCAGAGGTGGC
ATGGGCTACAGGCTTGTCACTC
NM_005163.2,
NM_002093.3
NM_000594
BAX TCAGGATGCGTCCACCAAGACC TGTGTCCACGGCGGCAATCACTA NM_001291428
CASPASE3 TCAGAGGAGACCGATGCAAGAC AAGTCGGCCTCCACTGGAATAC NM_004346
LC3 TCCAGCACCTTAGTAACCCACG TGTAGAACGAGGACACTGGCAC NM_026160
ATG5 TGCAGATGGACAGTTGCACACG GCTCAGATGTTCACTCAGCCAC NM_001286106
GAPDH
RIPK3
BCL2
TGCTACAACTGCCACCCAGAAG
ATCGCCCTGTGGATGACTGAGT
GAAGACACGGCACTCCTTGCA
ATTGGCAACAGGTACACGGAAG
CTTGAGGCAGTAGTTCTTGGTGG
GCCAGGAGAAATCAAACAGAGGCC
NM_001256799
NM_019955.2
NM_000633

Immunohistochemistry

After fixation with 4% paraformaldehyde, the brain sections were embedded in paraffin and sliced into 10 μm thick sections. Cryoprotective media containing 25% ethylene, 25% glycerin, and 0.05 M phosphate buffer was used to preserve the sections at -20 °C. The sections were deparaffinized using fresh xylene and then rehydrated through a series of graded alcohol concentrations (100%, 90%, and 70%). Subsequently, the sections were incubated in methanol with 0.3% hydrogen peroxide for 20 minutes to block endogenous peroxidase activity. Following that, the sections were incubated with primary antibodies against CREB, BDNF, Akt-1, GSK3, RIPK3, and TNF-α (1:100) (Abcam, Cambridge, UK) at 4 °C overnight in a blocking buffer solution containing 1% bovine serum albumin (BSA) in PBS. After rinsing, the sections were incubated with a secondary antibody (goat anti-mouse, 1:100) (Abcam, Cambridge, UK) for 60 minutes. Finally, the sections were stained with DAPI. The stained sections were then analyzed using Image J software to measure the areas of positive immunoreactivity associated with the aforementioned antibodies. For this analysis, seven sections from each group (Meth and control) were selected, and adjustments were made before conducting the analysis for all sections [46,47].

H&E and Nissl staining

The brain tissue was carefully dissected, and the amygdala was immersed in a 4% Paraformaldehyde solution. Subsequently, the amygdala tissue was embedded in paraffin blocks. The microtome was used to create sections with a thickness of 5 μm for general analysis and 25 μm for estimating the quantity and range of cells. Finally, the sections of the amygdala were stained using the Nissl and H & E staining procedures [32].

Stereological study

Number of neurons and glial cells

To determine the total number of neuroglial cells, microscopic images were captured using a calculating frame grid. The z-axis in the brain samples was measured using a microcator connected to the microscope stage. The numerical density of neurons and glial cells was calculated using the optical dissector method, following the equation:
N v = Q P × h × a f × t B A
The variables ΣQ- and ΣP represent the calculated number of cells and the total number of microscopic fields, respectively. The parameters a/f and h denote the area per frame and the height of the director, respectively. Additionally, t represents the actual section thickness, and BA corresponds to the block advance of the microtome [33].

Tunel assay

The Amygdala was then fixed and embedded in paraffin. Subsequently, sections were prepared and mounted on glass slides using gelatin. The samples underwent deparaffinization using Xylene to remove the paraffin. For the analysis of DNA fragmentation, TUNEL staining (green) was utilized, with DAPI serving as a nuclear counterstain (blue). Quantification of TUNEL-positive cells in the groups was performed using Image J software. This involved selecting seven images from each group, adjusting the threshold, and conducting analyses on all images [32].

Reactive oxygen species (ROS)

Brain tissue cells were isolated and subjected to trypsin-EDTA treatment. The cell suspension from the plates was then centrifuged at 1,400 x g for 5 minutes at 4 °C. To assess intracellular reactive oxygen species (ROS) levels, 2,7-dichlorofluorescein diacetate (DCFDA) was added to the samples at a concentration of 20 μM, followed by incubation at 37 °C for 45 minutes. Subsequently, the samples were analyzed using a flow cytometer, with fluorescence intensity measured at 495 nm, to determine ROS levels.[48]

Glutathione disulfide content assessments and GSSG assay

The tissue samples were assessed for glutathione peroxidase (GPX) activity using a GPX test kit (Zellbio GmbH, Ronsee, Germany). The assay measured GPX activity in the entire sample by catalyzing the degradation of 1 μmol of GSH per minute. Aliquots of sample suspensions containing O-phthalaldehyde (OPA) and N-ethylmaleimide (NEM) probes were collected from the incubation medium through centrifugation at 1,000 rpm for 1 minute [48].

SDS-PAGE sample preparation, gel preparation, and running conditions.

To prepare samples for SDS-PAGE, as well as for immunoblot studies, homemade gels were used.For homemade gels, the Laemmli resolving gel was prepared by combining the following components per 10mL: 3 mL of 40% Acrylamide/Bis (Bio-Rad), 2.5 mL of 1.5M Tris-HCl pH 8.8 (Bio-Rad), 1 mL of 10% SDS (Bio-Rad), 50 μL of 10% APS (Bio-Rad), and 5 μL of TEMED (Bio-Rad).The stacking gel was prepared separately per 2.5 mL, using 0.25 mL of 40% Acrylamide/Bis, 0.63 mL of 0.5M Tris-HCl pH 6.8 (Bio-Rad), 250 μL of 10% SDS, 12.5 μL of 10% APS, and 2.5 μL of TEMED.
To facilitate gel electrophoresis, a running buffer was prepared by dissolving the following components in 1 L of solution: 3 g Tris base (Sigma-Aldrich), 14.4 g Glycine (Sigma-Aldrich), and 1 g SDS (Sigma-Aldrich).

Immunoblotting

In each experiment, samples were homogenized in a lysis buffer consisting of 50 mM Tris-HCl (pH 7.4), 150 mM NaCl, 5 mM EDTA, 10% glycerol, 1% Triton X-100, 0.5 mM DTT, 60 mM β-glycerolphosphate, 1 mM sodium vanadate, 20 mM NaF, and 1x protease inhibitor cocktail. The samples were heated for 10 minutes, then subjected to centrifugation at 12000x g. Subsequently, they were mixed with 5x SDS loading buffer and separated on a 10% SDS-PAGE gel. Following that, the proteins were transferred to Immobilon PSQ PVDF membranes and incubated with the corresponding primary antibodies overnight at 4℃, with a 1:1000 dilution. The secondary antibodies were then applied at a 1:10,000 dilution for 2 hours at room temperature. The membranes were exposed to Western Lightning Plus-ECL regent (PerkinElmer) and examined using the ChemiDoc Imaging system (Bio-Rad).

Statistical analysis

The data was analyzed using t-test in IBM SPSS Statistics Version 21, and the results were presented as mean ± standard deviation. Additionally, GraphPad Prism was utilized for data analysis.

5. Conclusions

In conclusion, our study expands our understanding of the detrimental effects of METH on the central nervous system (CNS), particularly in the amygdala. METH misuse and uncontrolled use have been associated with various neurological and behavioral disorders. While the exact molecular mechanisms of METH-induced neurotoxicity remain incompletely understood, our findings provide valuable insights into the underlying mechanisms.

Ethical publication statement

The collection and preservation of all brains in this study were carried out in strict accordance with the principles outlined in the Declaration of Helsinki. The research protocols employed in this study were reviewed and approved by the Ethics Committee of Shahid Beheshti University of Medical Sciences (IR.SBMU.RETECH.REC.1400.432).

Declaration of Competing Interest

The authors declare that they have no conflicts of interest related to this study.

Acknowledgment

We gratefully acknowledge the funding support provided by the Hearing Disorders Research Center at Loghman Hakim Hospital, Shahid Beheshti University of Medical Sciences, Tehran, Iran. Additionally, we extend our appreciation to the Iranian legal organization for their assistance.

References

  1. Behl, T., et al., Current trends in neurodegeneration: Cross talks between oxidative stress, cell death, and inflammation. International Journal of Molecular Sciences, 2021. 22(14): p. 7432. [CrossRef]
  2. Tahmasebinia, F. and S. Emadi. Effects of clioquinol on the aggregation of beta-amyloid peptides in the presence and absence of metal ions and astrocyte-mediated inflammation. in EUROPEAN JOURNAL OF IMMUNOLOGY. 2016. WILEY-BLACKWELL 111 RIVER ST, HOBOKEN 07030-5774, NJ USA.
  3. Pourgholaminejad, A. and F. Tahmasebinia, The Role of Th17 Cells in Immunopathogenesis of Neuroinflammatory Disorders. Neuroimmune Diseases: From Cells to the Living Brain, 2019: p. 83.
  4. Mahmoudiasl, G., Abbaszadeh, H., Rezaei-Tavirani, M., Abdollahifar, M., Khoramgah, M., Niknazar, S., Roozbahany, N. (2019). Nod-like receptor protein 3 and nod-like receptor protein 1 inflammasome activation in the hippocampal region of postmortem METH chronic user. Bratislavske lekarske listy, 120(10), 769-776.
  5. Khoshsirat, S., Khoramgah, M. S., Mahmoudiasl, G.-R., Rezaei-Tavirani, M., Abdollahifar, M.-A., Tahmasebinia, F., . . . Abbaszadeh, H. A. (2020). LC3 and ATG5 overexpression and neuronal cell death in the prefrontal cortex of postmortem chronic METH users. Journal of Chemical Neuroanatomy, 107, 101802.
  6. Rasti Boroojeni F, Mashayekhan S, Abbaszadeh HA, Ansarizadeh M, Khoramgah MS, Rahimi Movaghar V. Bioinspired nanofiber scaffold for differentiating bone marrow-derived neural stem cells to oligodendrocyte-like cells: design, fabrication, and characterization. International Journal of Nanomedicine. 2020 Jun 2:3903-20.
  7. Cadet, J.L. and I.N. Krasnova, Molecular bases of methamphetamine-induced neurodegeneration. International review of neurobiology, 2009. 88: p. 101-119.
  8. İvecen, B. and O. GOKDEMIR, Methamphetamine Addiction. DAHUDER Medical Journal, 2022. 2(4): p. 98-101.
  9. Prakash, M.D., et al., Methamphetamine: effects on the brain, gut and immune system. Pharmacological research, 2017. 120: p. 60-67. [CrossRef]
  10. Chavda, V., et al., Narcolepsy—A Neuropathological Obscure Sleep Disorder: A Narrative Review of Current Literature. Brain Sciences, 2022. 12(11): p. 1473. [CrossRef]
  11. Rusyniak, D.E., Neurologic manifestations of chronic methamphetamine abuse. Psychiatric Clinics, 2013. 36(2): p. 261-275. [CrossRef]
  12. Compton, W.M. and N.D. Volkow, Abuse of prescription drugs and the risk of addiction. Drug and alcohol dependence, 2006. 83: p. S4-S7. [CrossRef]
  13. Downey, L.A. and J.M. Loftis, Altered energy production, lowered antioxidant potential, and inflammatory processes mediate CNS damage associated with abuse of the psychostimulants MDMA and methamphetamine. European journal of pharmacology, 2014. 727: p. 125-129. [CrossRef]
  14. Varner, K.J., et al., Cardiovascular responses elicited by the “binge” administration of methamphetamine. Journal of Pharmacology and Experimental Therapeutics, 2002. 301(1): p. 152-159. [CrossRef]
  15. Tehrani, A.M., et al., Methamphetamine induces neurotoxicity-associated pathways and stereological changes in prefrontal cortex. Neuroscience letters, 2019. 712: p. 134478. [CrossRef]
  16. Volkow, N.D., et al., Association of dopamine transporter reduction with psychomotor impairment in methamphetamine abusers. American Journal of Psychiatry, 2001. 158(3): p. 377-382. [CrossRef]
  17. Shrestha, P., et al., Methamphetamine induced neurotoxic diseases, molecular mechanism, and current treatment strategies. Biomedicine & Pharmacotherapy, 2022. 154: p. 113591. [CrossRef]
  18. Hong, S., et al., Expression of dopamine transporter in the different cerebral regions of methamphetamine-dependent rats. Human & Experimental Toxicology, 2015. 34(7): p. 707-717. [CrossRef]
  19. Yuan, J., et al., Dopamine transporter dysfunction in Han Chinese people with chronic methamphetamine dependence after a short-term abstinence. Psychiatry Research: Neuroimaging, 2014. 221(1): p. 92-96. [CrossRef]
  20. London, E.D., et al., Mood disturbances and regional cerebral metabolic abnormalities inrecently abstinent methamphetamine abusers. Archives of general psychiatry, 2004. 61(1): p. 73-84. [CrossRef]
  21. Moszczynska, A., et al., Why is parkinsonism not a feature of human methamphetamine users? Brain, 2004. 127(2): p. 363-370.
  22. Thompson, P.M., et al., Structural abnormalities in the brains of human subjects who use methamphetamine. Journal of Neuroscience, 2004. 24(26): p. 6028-6036. [CrossRef]
  23. Miller, D.B. and J.P. O’Callaghan, Elevated environmental temperature and methamphetamine neurotoxicity. Environmental research, 2003. 92(1): p. 48-53. [CrossRef]
  24. Jayanthi, S., et al., Calcineurin/NFAT-induced up-regulation of the Fas ligand/Fas death pathway is involved in methamphetamine-induced neuronal apoptosis. Proceedings of the National Academy of Sciences, 2005. 102(3): p. 868-873. [CrossRef]
  25. Kiyatkin, E.A. and H.S. Sharma, Permeability of the blood–brain barrier depends on brain temperature. Neuroscience, 2009. 161(3): p. 926-939. [CrossRef]
  26. Nopparat, C., et al., The mechanism for the neuroprotective effect of melatonin against methamphetamine-induced autophagy. Journal of pineal research, 2010. 49(4): p. 382-389. [CrossRef]
  27. Huang, X., et al., Methamphetamine abuse impairs motor cortical plasticity and function. Molecular psychiatry, 2017. 22(9): p. 1274-1281. [CrossRef]
  28. Salo, R., et al., Behavioral regulation in methamphetamine abusers: an fMRI study. Psychiatry Research: Neuroimaging, 2013. 211(3): p. 234-238. [CrossRef]
  29. Morales, A.M., et al., Gray-matter volume in methamphetamine dependence: cigarette smoking and changes with abstinence from methamphetamine. Drug and alcohol dependence, 2012. 125(3): p. 230-238. [CrossRef]
  30. Jernigan, T.L., et al., Effects of methamphetamine dependence and HIV infection on cerebral morphology. American Journal of Psychiatry, 2005. 162(8): p. 1461-1472. [CrossRef]
  31. Gonçalves, J., et al., Methamphetamine-induced neuroinflammation and neuronal dysfunction in the mice hippocampus: preventive effect of indomethacin. European Journal of Neuroscience, 2010. 31(2): p. 315-326. [CrossRef]
  32. Khoshsirat, S., et al., LC3 and ATG5 overexpression and neuronal cell death in the prefrontal cortex of postmortem chronic methamphetamine users. Journal of Chemical Neuroanatomy, 2020. 107: p. 101802. [CrossRef]
  33. Mirakabad, F.S.T., et al., NUPR1-CHOP experssion, autophagosome formation and apoptosis in the postmortem striatum of chronic methamphetamine user. Journal of Chemical Neuroanatomy, 2021. 114: p. 101942. [CrossRef]
  34. Roohbakhsh, A., K. Shirani, and G. Karimi, Methamphetamine-induced toxicity: The role of autophagy? Chemico-biological interactions, 2016. 260: p. 163-167.
  35. Mata, M.M., et al., Methamphetamine decreases CD4 T cell frequency and alters pro-inflammatory cytokine production in a model of drug abuse. European journal of pharmacology, 2015. 752: p. 26-33. [CrossRef]
  36. Mahmoudiasl, G., et al., Nod-like receptor protein 3 and nod-like receptor protein 1 inflammasome activation in the hippocampal region of postmortem methamphetamine chronic user. Bratislavske lekarske listy, 2019. 120(10): p. 769-776. [CrossRef]
  37. Kohno, M., et al., The relationship between interleukin-6 and functional connectivity in methamphetamine users. Neuroscience letters, 2018. 677: p. 49-54. [CrossRef]
  38. Guo, D., et al., Molecular mechanisms of programmed cell death in methamphetamine-induced neuronal damage. Frontiers in Pharmacology, 2022. 13. [CrossRef]
  39. Wu, C.-W., et al., Enhanced oxidative stress and aberrant mitochondrial biogenesis in human neuroblastoma SH-SY5Y cells during methamphetamine induced apoptosis. Toxicology and applied pharmacology, 2007. 220(3): p. 243-251. [CrossRef]
  40. Gholami, M., et al., Pharmacological and molecular evidence of neuroprotective curcumin effects against biochemical and behavioral sequels caused by methamphetamine: Possible function of CREB-BDNF signaling pathway. Basic and Clinical Neuroscience, 2021. 12(3): p. 325. [CrossRef]
  41. Motaghinejad, M., et al., Possible involvement of CREB/BDNF signaling pathway in neuroprotective effects of topiramate against methylphenidate induced apoptosis, oxidative stress and inflammation in isolated hippocampus of rats: molecular, biochemical and histological evidences. Brain research bulletin, 2017. 132: p. 82-98. [CrossRef]
  42. Motaghinejad, M., et al., The possible role of CREB-BDNF signaling pathway in neuroprotective effects of minocycline against alcohol-induced neurodegeneration: molecular and behavioral evidences. Fundamental & Clinical Pharmacology, 2021. 35(1): p. 113-130. [CrossRef]
  43. Feizipour, S., et al., Selegiline acts as neuroprotective agent against methamphetamine-prompted mood and cognitive related behavior and neurotoxicity in rats: Involvement of CREB/BDNF and Akt/GSK3 signal pathways. Iranian Journal of Basic Medical Sciences, 2020. 23(5): p. 606. [CrossRef]
  44. Keshavarzi, S., et al., Protective role of metformin against methamphetamine induced anxiety, depression, cognition impairment and neurodegeneration in rat: the role of CREB/BDNF and Akt/GSK3 signaling pathways. Neurotoxicology, 2019. 72: p. 74-84. [CrossRef]
  45. Darabi, S., et al., SMER28 attenuates dopaminergic toxicity mediated by 6-hydroxydopamine in the rats via modulating oxidative burdens and autophagy-related parameters. Neurochemical Research, 2018. 43: p. 2313-2323. [CrossRef]
  46. Darabi, S., et al., Creatine and retinoic acid effects on the induction of autophagy and differentiation of adipose tissue-derived stem cells into GABAergic-like neurons. Journal of Babol university of medical sciences, 2017. 19(8): p. 41-49.
  47. Abbaszadeh, H.-A., et al., Bone marrow stromal cell transdifferentiation into oligodendrocyte-like cells using triiodothyronine as a inducer with expression of platelet-derived growth factor α as a maturity marker. Iranian biomedical journal, 2013. 17(2): p. 62. [CrossRef]
  48. Moghimi, N., et al., COVID-19 disrupts spermatogenesis through the oxidative stress pathway following induction of apoptosis. Apoptosis, 2021. 26(7-8): p. 415-430. [CrossRef]
  49. Shaerzadeh, F., et al., Methamphetamine neurotoxicity, microglia, and neuroinflammation. Journal of neuroinflammation, 2018. 15: p. 1-6.
  50. Castellano, P., et al., Methamphetamine compromises gap junctional communication in astrocytes and neurons. Journal of neurochemistry, 2016. 137(4): p. 561-575. [CrossRef]
  51. Mayr, B. and M. Montminy, Transcriptional regulation by the phosphorylation-dependent factor CREB. Nature reviews Molecular cell biology, 2001. 2(8): p. 599-609. [CrossRef]
  52. Yang, G., et al., Ginsenoside Rb1 attenuates methamphetamine (METH)-induced neurotoxicity through the NR2B/ERK/CREB/BDNF signalings in vitro and in vivo models. Journal of Ginseng Research, 2022. 46(3): p. 426-434. [CrossRef]
Disclaimer/Publisher’s Note: The statements, opinions and data contained in all publications are solely those of the individual author(s) and contributor(s) and not of MDPI and/or the editor(s). MDPI and/or the editor(s) disclaim responsibility for any injury to people or property resulting from any ideas, methods, instructions or products referred to in the content.
Copyright: This open access article is published under a Creative Commons CC BY 4.0 license, which permit the free download, distribution, and reuse, provided that the author and preprint are cited in any reuse.
Prerpints.org logo

Preprints.org is a free preprint server supported by MDPI in Basel, Switzerland.

Subscribe

© 2024 MDPI (Basel, Switzerland) unless otherwise stated