Submitted:
23 May 2023
Posted:
26 May 2023
You are already at the latest version
Abstract
In the paper, we measure the digital financial inclusion index of 31 provinces in China from 2011 to 2020 based on three dimensions: coverage breadth, depth of use and digitalization degree. By means of weighted Dagum Gini coefficient and quantile standardization, we explored the degree of imbalance and insufficiency of the development of digital inclusive finance in China and four major regions and its structural causes. Using Kernel density estimation method and Markov chain analysis method, we further investigates the evolution trend of imbalance and insufficiency. The study finds that (1) the Digital Inclusive Financial Index in China and the four major regions rise significantly, with the COVID-19 epidemic reducing its growth rate. Of these, the eastern region has the highest development level. (2) The imbalance level of digital inclusive finance development obviously has reduced. The level of imbalance is highest within the eastern region, and the development gap between the eastern and western regions is the widest. The imbalance of overall development is mainly due to the regional imbalance. The imbalance of coverage breadth and depth of use is the main structural cause of unbalanced development in the four major regions. There is a trend of bipolarization or multipolarization in China and the other three major regions, with the exception of the central region. (3) The western region is the least developed. The development shortcoming of digital inclusive finance in China and the four major regions is the breadth of coverage. There are "Club Convergence" and "Matthew Effect" in the eastern, central and western regions.
Keywords:
digital inclusive finance
; imbalance and insufficiency
; weighted Dagum Gini coefficient
; quantile standardization
1. Introduction
Digital inclusive finance is an effective way to promote inclusive growth by using digital technology to bridge the "last mile" of inclusive financial services [1,2]. In 2016, the G20 High-Level Principles for Digital Inclusive Finance were adopted to provide direction for the global development of Digital Inclusive Finance. From 2017 to 2020, the banking and financial institutions in China processed a total of 123,220 million mobile payments, up from 37,552 million, as digital financial inclusion grew rapidly in China. At the same time, the unbalanced and insufficient development of digital inclusive finance in China is becoming increasingly evident. In 2020, the balance of inclusive micro and micro loans in Yunnan Province was RMB 209.48 billion, while the accumulative balance of Shanghai city reached RMB 520.63 billion, suggesting significant regional differences in the development of digital inclusive finance. In addition, the development shortcoming of digital inclusive finance is prominent. In 2020, the payment system of the People’s Bank of China processed a total of RMB 432.16 trillion in mobile payment, accounting for only 5.27% of all payment. The mobility of digital inclusive financial services has not been fully manifested. Given this, we measures the unbalanced and insufficiency level of the development of digital inclusive finance, and examines the causes of its main structure and dynamic evolution characteristics, which provide useful references for promoting the coordinated development of digital inclusive finance in China and even worldwide.
Digital inclusive finance is a powerful engine for economic growth [3,4,5], provides entrepreneurship support [6,7,8], alleviates poverty [9,10], reduces income gap [11,12], and is also important for reducing environmental protection [13,14,15]. Therefore, there has been a great deal of research around digital inclusion finance by scholars around the world.
With the formal introduction of the concept of digital inclusive finance, the related research needs to be based on the index of digital inclusive finance. Some scholars have constructed the index system of digital inclusive finance based on the three dimensions of coverage breadth, depth of use and digitization degree, using the massive micro data of China Ant Financial transaction accounts to measure the total digital financial inclusion index in China [16]. In addition, a few scholars have constructed an inclusive digital inclusive finance index based on the web crawler technology in order to explore the inherent influence mechanism of China digital inclusive finance on green growth from the perspective of fairness and efficiency [17]. Taking into account the accessibility and use of traditional financial services and digital inclusive financial services, some other scholars, have measured the digital inclusive financial index for 101 countries worldwide in 2017, and the new digital inclusive financial index for 52 emerging markets and developing economies in 2014 and 2017, respectively [18,19].
The combination of inclusive finance and digital technology has made the digital inclusive finance a highly geographical penetration, but the inclusive finance itself has regional disparity due to differences in populations and countries [20]. There are also disparities in inclusive finance between provinces within countries. For example, financial inclusion is better developed in the western provinces of Turkey compared to the eastern provinces [21]. Evidence suggests that the positive correlation between fintech development and financial inclusion is heterogeneous across the 16 largest emerging economies in the world [22]. Arguably, there are also national gaps in the development of digital inclusive finance. With regard to China's regions, the introduction of digital inclusion has resulted in better financial efficiency in the east regions than in the non-east regions, with the development of digital inclusive finance in the central and west regions lagging behind [23,24].
At present, quantitative research on the insufficient development of digital inclusive finance in China is relatively scarce. Some scholars have conducted analyses based on insufficiency fund supply for infrastructure construction and insufficiency healthcare coverage for non-citizens [25,26]. With regard to inclusive finance, women entrepreneurs in the Middle East and North Africa hare under-served by microfinance [27]. With regard to digital finance, there are many problems such as lack of equipment, financial exclusion, security loopholes and supervision restrictions [4]. With regard to digital inclusive finance, most scholars have found, based on simple data analysis, that there is a lack of willingness to make mobile payments in China, and a lack of financial literacy and social awareness has also left some digital inclusion financial services underutilized [28,29].
The innovations of this paper include (1) construct the weighted Gini coefficient to measure the imbalance level of digital inclusive finance development from the perspective of development difference, and reveal its structural causes. (2) Based on the perspective of development shortcomings, measure the insufficiency level of the development of digital inclusive finance and identify its structural causes. The research findings are of great significance to further improve the development level of digital inclusive finance. (3) Based on a dynamic perspective, we further analyzes the evolution trend of unbalanced and insufficient development of digital inclusive finance in China, so as to explore the effective path of coordinated development of digital inclusive finance in the future.
2. Study Methods and Data
2.1. Research Methods
2.1.1. Analytic hierarchy Process
As a widely used subjective weighting method, the Analytic Hierarchy Process (AHP) is one of the more rational and systematic approaches to quantifying qualitative problems [30]. It is able to dismantle complex problems and translate people's judgment into importance-based comparison among the disassembled factors, thus translating qualitative judgment into more operational quantitative judgment. AHP can assign weights to indicators based on subjective judgments even when sample data is missing.
2.1.2. Weighted Dagum Gini Coefficient
While retaining the traditional Dagum Gini coefficient method, the weighted Dagum Gini coefficient first calculates the difference between the indicators of each dimension and the contribution of regional difference, inter-region difference and super-variable density, and then calculates the overall difference and contribution according to the weight of each dimension [31]. This approach is able to reflect the overall level of development imbalances and its sources. Therefore in this paper, the Gini coefficient of each dimension of digital inclusive finance is taken as the index of imbalance of each dimension, and then the overall weighted Dagum Gini coefficient is synthesized according to the weight of each dimension as the overall imbalance index. The specific equation is as follows:
where μ donates the average value of the development level of digital inclusive finance, n donates the number of all provinces. nj (nh) is the number of provinces in the j (h)-th region, μj (μh) donates the average value of the development level of digital inclusive finance in the j (h)-th region, pj=nj/n, sj=nj μj/nμ. k donates the number of regions, d donates the d-th dimension in the index system of digital inclusive finance. yjdr (yhdr) donates the development level of the d-th dimension of digital inclusive finance of any province in the j (h)-th region, yji (yhr) donates the development level of digital inclusive finance of any province in the j (h)-th region. Djhd donates the relative gap between the development level of digital inclusive finance of any province in the j (h)-th and h-the regions in the dimension d.
Gd represents the weighted Gini coefficient of each dimension, which is calculated by Equation (1). G donates the weighted Gini coefficient, which is obtained by weighting the weight ωd of each dimension obtained by combining Gd with the analytic hierarchy process, and represented by Equation (4). Gjjd and Gjhd represent the Gini coefficients of each dimensionality in the region and between regions respectively, and the weighted Gini coefficients Gjj and Gjh in the region and between regions are calculated by Equation (5) and (6). Thesource of the imbalance in the development of digital inclusive finance is calculated from Equations (7) to (12). Gwd, Gnbd, and Gtd represent the intra-region imbalance contribution, the inter-region imbalance contribution, and the supervariable density contribution, respectively, and the total contributions Gw, Gnb, and Gt are calculated by Equations (10) to (12). Gdjj and Gdjh represent the contribution rate of the development imbalance of each dimension to the overall development imbalance within and between regions, respectively, and are calculated by Equations (13) and (14).
2.1.3. Quantile Standardization
In remove the influence of extreme values, in this paper, the original data is normalized by replacing extreme values with quantiles, and weighting the sum to obtain the insufficiency index of digital inclusive financial development, with the following steps:
Step one, perform quantile normalization on the raw data:
Forward indicator:
Reverse indicator:
where, yistQ1donates the 1% quantile of the original index value, and yistQ99donates the 99% quantile of the original index value. yist indicates the indicator value of the indicator s of the i-th province in the t-th year. y’ist donates the normalized indicator value, the higher the value, the more fully developed the indicator is.
Step two, perform reverse operation on the normalized value:
Step three, calculate the insufficiency index and total index of each dimension of digital inclusive financial development in t-th year of province i:
where, ωd represents the weight of each dimension, and ωs represents the corresponding weight of each index under each dimension. IFIdit donates the insufficiency index of d-th dimension d and IFIit donates the composite index of insufficiency development of digital inclusive finance.
2.1.4. Kernel Density Estimation
Kernel Density Estimation is an important non-parametric estimation method that is weakly model dependent and robust, and has now become a common method for the study of distribution dynamics [32]. Assuming that the density function of the random variable X is f(x), the probability density at the point x is estimated by Equation (20). In the equation, N donates the number of observed values, K(·) is the kernel function, Xi is the independent and identically distributed observed values, and x is the mean value; h is the bandwidth, the smaller the bandwidth, the higher the estimation accuracy. In this paper, Gaussian kernel function is selected to characterize the distribution dynamics of digital inclusive finance development imbalance, as shown in Equation (21).
2.1.5. Markov Chain Analysis Method
Markov chain analysis discretizes the data into k types and calculates the probability distribution of the corresponding types and their variation over time, thus giving an approximation of the whole process of evolution. Assuming that is the probability distribution vector of the attribute types of the object at time t, then the transition between attribute types at different times can be expressed as a traditional Markov transition probability matrix of k×k. Based on this method, the long-term transfer law of insufficiency development of digital inclusive finance has been explored in this paper.
2.1. Data Sources
After 1999, China has gradually formed an overall regional development strategy of taking the lead in the eastern region, rising from the central region, developing the western region and revitalizing the northeastern region. Accordingly, China's 31 provinces can be divided into the eastern, the central, the western and the northeastern regions. The eastern region includes Beijing, Tianjin, Hebei, Shanghai, Jiangsu, Zhejiang, Fujian, Shandong, Guangdong and Hainan; the central region includes Shanxi, Anhui, Jiangxi, Henan, Hubei and Hunan; the western region includes Inner Mongolia, Guangxi, Sichuan, Chongqing, Guizhou, Yunnan, Tibet, Shaanxi, Gansu, Qinghai, Ningxia and Xinjiang; the northeastern region includes Liaoning, Jilin, Heilongjiang. The data involved in this paper are mainly from Peking University Digital Inclusive Financial Index (2011-2020), China Inclusive Financial Index Analysis Report (2017), China Inclusive Financial Index Analysis Report (2020), Yunnan Financial Operation Report (2021), Shanghai Financial Operation Report (2021) and Overall Operation of Payment System of 2020.
3. Construction and Level Measurement of Digital Inclusive Financial Index
3.1. Index System of Digital Inclusive Finance
Digital inclusive finance is a new inclusive financial model developed by banks and other traditional financial institutions as well as internet enterprises. In constructing the index system for digital inclusive finance, it should reflect the digital innovation of traditional financial institutions to the original products, as well as the Internet financial services provided by some emerging financial-like institutions. The consistency of data and the reasonableness of cross-year comparisons should also be taken into account. Hence, based on the index system of Peking University Digital Inclusive Finance Index (2011-2020), we excluded secondary indicators of money funds, investment and credit investigation, which are not available in some years under the depth of use, and construct a revised digital inclusive finance indicator system. Then, considering the consistency of the data, we constructed a judgment matrix by using the analytic hierarchy process to determine the weights of the corresponding secondary indicators under the depth of use (see Table 1). All other indicator weights were calculated and determined using the judgment matrix shown in the original report. The revised digital financial inclusion indicator system and the weights of some indicators are shown in Table 2.
3.2. Measurement of Digital Inclusive Finance Level
Figure 1 illustrates the digital inclusive finance index in China and four major regions from 2011 to 2020. As can be seen from the figure, the national and four regional digital inclusion indices show a clear year-on-year increase. The average value of the national digital inclusive finance index is 226.04, showing a rapid increase over the sample period, with an average annual growth rate of 27.21%. In terms of regional development, the eastern region has the highest development level, with the average index value of 253.11, followed by the central and northeastern regions. The western region has the lowest level of development, but has the highest annual growth rate of 31.29%. Although there is a gap between the development of digital inclusive finance in the western region and the other three regions, its development speed is the fastest. This suggests that with the effective implementation of China's financial poverty alleviation policy, the development of digital inclusive finance in the western region has achieved initial success. Notably, the growth trend of the Digital Financial Inclusion Index slowed down in 2020, which may be related to the impact of the COVID-19 epidemic.
4. Analysis of the Imbalance of Development of Digital Inclusive Finance
4.1. Imbalance Level and Source
4.1.1. Imbalance Level
The national digital inclusion development imbalance index has maintained an overall downward trend (Figure 2a), indicating that the development of digital inclusive finance becoming more balanced across the country. The imbalance index declined rapidly from 2011 to 2012 with an average annual decline of 54.11%; the declining trend slowed down from 2013 to 2020, with an annual decline rate of 9.50%.
At the regional level, the average imbalance index of digital inclusive finance in the eastern region is the highest, reaching 0.0841, which suggests that the development of digital inclusive finance in the eastern region is the most unbalanced. Further study reveals that it is mainly due to the large differences between provinces with a higher level of digital inclusive finance inclusion in the eastern region (Beijing, Shanghai, Zhejiang, Guangdong, etc.) and those with a lower level of development (Hebei, Hainan, Shandong, etc.). In terms of the change trend, all four regions show an overall downward trend in the Imbalance Index. Among them, the average annual decline rate of northeastern region has the highest average annual rate of decline at 24.82%, while the eastern region has the lowest average annual rate of decline at 16.44%. In general, the imbalance of the development of digital inclusive finance in the four major regions has declined, suggesting that the development gap of digital inclusive finance in each region has gradually narrowed.
The overall trend of the inter-regional imbalance index is all declining (Figure 2b), suggesting that the digital inclusive finance inclusion gap between the two major regions has narrowed. The highest average annual rate of decline in the imbalance index was recorded between the western and the northeastern regions at 22.14%, which indicates that the development gap between the western and the northeastern regions is narrowing at the fastest speed. With the largest mean value of 0.1461, the imbalance index between the eastern and western regions shows the most unbalanced development of digital inclusion finance between regions. This may be due to the lack of favorable conditions for the development of digital inclusive finance in the western region, which makes its service acceptance and utilization much lower than that in the eastern region. It is worth noting that the trend of decline in the imbalance index between the eastern region and the other three regions in 2020 was more pronounced than in the previous year. This situation suggests that the development gap between the eastern region and the other three regions can be narrowed rapidly under the impact of the epidemic, showing the strong development toughness of digital inclusive finance to a certain extent.
4.1.2. Sources of Imbalance and Their Contribution
Figure 3 shows the sources and contribution rates of China's overall digital inclusive finance development imbalance. The contribution of inter-regional imbalance shows a clear upward trend during the sample period, with values consistently above 61.79% and an average annual growth rate of 2.01%, which suggests that inter-regional imbalance is the main source of overall development imbalance. The contribution rate of regional imbalance is between 20.77% and 24.07%, with an overall stable decreasing trend and an average annual decrease of 1.38%. The contribution rate of supervariable density is the lowest, with its average value being only 10.22%, and the overall decline trend being 10.60%.
The decomposition of the intra-regional and inter-regional imbalance contributions are shown in Figure 4. From the perspective of the imbalance contribution within the region, the unbalanced contribution rate in the eastern region consistently has the largest and over 50.00% imbalance contribution, with an average value of 56.11%, increasing at an average annual rate of 0.70%. The contribution rate of northeastern region is the lowest, with its average value being only 1.24%, meanwhile, the unbalance contribution rate of northeastern region decreases the most, with the annual decline rate of 5.48%.
From the perspective of the contribution of inter-regional imbalance, the contribution rate of the imbalance between the eastern and western regions to the overall imbalance is the largest, with an average of 57.98%, but the overall trend is declining, with an annual decline rate of 0.67%. This suggests that the large gap in digital inclusive financial development between the eastern and western regions is the main source of inter-regional imbalance. The imbalance between the central and northeastern regions contributed the least to the overall imbalance, with an average contribution of only 1.38%, but the contribution rate shows an upward trend, with an average annual growth rate of 6.10%.
4.2. Structural Causes of Imbalance Development
Figure 5 reflects the structural causes of imbalance of development of digital inclusive finance in China as well as the four major regions. At the national level, the imbalance in coverage breadth is the main structural cause of the overall imbalance in development, with an average contribution rate of 56.82%. The contribution of the imbalance of the digitalization degree is the smallest, with an average value of only 7.78%. In addition, the imbalance contribution rates of coverage breadth and digitalization degree imbalance show an overall declining trend, while the contribution rate of depth of use imbalance shows a larger increase, with an average annual growth rate of 7.49%, suggesting that the imbalance in depth of use is increasingly becoming an important structural factor affecting the overall development imbalance of digital inclusive finance nationwide.
From the regional level, the structural causes of unbalanced development in the four major regions are heterogeneous. Specifically, the main structural causes of the overall unbalanced development in the eastern, central and northeastern are the unbalanced coverage breadth, with the average value of its contribution exceeding 50%. Among them, the eastern region has the highest coverage breadth imbalance contribution rate, with its average value reaching 61.36%, but the coverage breadth imbalance contribution rate is on a decreasing trend, while the depth of use imbalance contribution rate shows a faster rising trend, with an average annual growth rate of 8.55%. In addition, the imbalance in the development of the western region was mainly affected by the imbalance of coverage breadth from 2011 to 2017, with its contribution rate declining continuously, and an average annual decline rate of 2.34%. However, the contribution rate of depth of use imbalance continues to rise during this period and surpasses the coverage breadth imbalance contribution rate from 2018 to 2020, making the depth of use imbalance the biggest structural cause affecting the imbalance of the western region. Generally speaking, the contribution rate of the imbalance of coverage breadth is the largest in the four regions, the second is the imbalance of the depth of use, and the contribution rate of the imbalance of the digitaliaztion degree is the smallest.
4.3. Trend Evolution of Iimbalance Development
The analysis of the weighted Dagum Gini coefficient provides a clear picture of the imbalance development of digital inclusive finance in China and its structural causes. Then, we use the Kernel density estimation method to explore the dynamic trend evolution characteristics of the imbalance development of digital inclusive finance in China and the four major regions from an absolute difference perspective, as shown in particular in Figure 6.
(1) The rightward shift in the distribution of digital inclusive finance across China and in the four major regions indicates an increasing level of development of digital inclusive finance across the country and in the four major regions, which is consistent with the objective facts presented in the previous section. Bounded by 2015, the rightward shift is greater until 2015, after which the shift decreases significantly. Among them, the rightward shift in 2020 is smaller than that of the previous year, suggesting that the Covid-19 pandemic may hinder the development of digital inclusive finance to a certain extent. In addition, the right shift is relatively large across the country and in the eastern region, while the right shift decreases in the central, western and northeastern regions. This suggests that digital inclusive finance is growing faster nationwide and in the eastern region, and relatively slowly in the other three regions. Hence, the development gap of digital inclusive finance between the eastern region and the other three major regions has gradually widened.
(2) The main peaks show a downward trend nationally and in the eastern, central and western regions, with the width of the main peaks widening. In northeastern region, the peak value of the main peak increases slightly, and the width of the main peak is obviously reduced. This indicates that the development of digital inclusive finance is gradually dispersed nationwide and in the eastern, central and western regions, and the absolute difference in the internal development of digital inclusive finance tends to expand. However, the development of the northeastern region is gradually concentrated, which represents the improvement of the absolute difference.
(3) From a national perspective, the distribution curve of digital inclusion shows a more pronounced trailing to the right, with a widening trend of distribution extension. This indicates that the provinces with higher development degree of digital inclusive finance (such as Beijing and Shanghai) have been further improved, and the gap between the development level of the provinces and that of other provinces nationwide is gradually increasing, with the situation of "the best getting better". From the regional perspective, there is no obvious tailing in the distribution curves of the four regions. This indicates that the provinces in the region have similar levels, with the highest level of development having a very small gap with other provinces in the region.
(4) The development of digital inclusive finance is multi-polar nationwide and in the eastern region. The western and northeastern region shows polarization and the central region shows no polarization. Specifically, the national Kernel density curve develops from one side peak to two side peaks, but the peaks of the side peaks are both lower. It is indicated that the digital inclusive finance in China is gradually shifting from polarization to multi-polarization, but the degree of polarization is always weak. The density curve in the eastern region is mainly composed of a main peak and two lateral peaks distributed on both sides of the main peak. The left-hand peak tends to diverge into two lateral peaks, with a gradual deepening of multipolar differentiation. In most years, the western and northeastern regions consist of one main peak and one lateral peak, showing obvious polarization. The distribution curve in the central region has only one peak, and there is no polarization phenomenon. The development of digital inclusive finance in the central region is balanced
5. Analysis of the Insufficiency of Development of Digital Inclusive Finance
5.1. Level Measures of Insufficiency
Figure 7 shows the development trend of the national and four regions digital inclusive finance insufficiency index. The national insufficiency index shows a steady and fluctuating development trend, rising slightly on the whole. The average annual growth rate of it is only 0.53%, suggesting that the insufficiency level of the national digital inclusive finance development is relatively stable. The level and development trend of the digital inclusive finance insufficiency index vary among the four regions. In terms of index level, the western region has the largest mean insufficiency index (76.69), followed by the northeastern and central regions, and the eastern region has the smallest (41.68). In terms of the development trend, the insufficiency index in the eastern and central regions rose first and then fell, and the overall value decreased slightly. The insufficiency indices for the western and northeastern regions rose twice from 2011 to 2020. Among them, the second rising time is longer and the rising range is larger. Hence, the insufficieny index as a whole has a high growth.
5.2. Structural Causes of Insufficiency Development
Figure 8 shows the structural causes of insufficiency development of digital inclusive finance nationwide and the four major regions. The main structural cause of insufficiency of digital inclusive finance nationwide is the insufficient breadth of coverage, the contribution of which is consistently above 50% with an average value of 55.83% over the sample period examined. From the perspective of the change trend, the insufficient contribution rates of the three dimensions all show a steady fluctuation trend. The contribution rate of coverage breadth insufficiency decreased slightly with an annual decline rate of 0.65%, and the contribution rate of depth of use and digitization degree insufficiency increased slightly.
Overall, the structural shortcoming in the development of digital inclusive finance inclusion in all four regions is the coverage breadth, with the average value of its insufficiency contribution exceeding 50.00%. The average contribution rate of coverage breadth insufficiency is the highest (59.66%) in the central region and the smallest (50.67%) in the eastern region. Specifically, the contribution rate in the eastern region fluctuates greatly, showing the characteristic of decreasing first, then rising and then decreasing, with an overall average annual growth rate of 0.47%. Digitalization degree and depth of use insufficiency alternate from 2011 to 2016 as a secondary cause of insufficiency development of digital inclusive finance in the eastern region. After 2016, the contribution of digitisation degree sufficiency fell by an average of 8.81% per year, while the contribution of depth of use sufficiency rose significantly, with an average annual growth rate of 5.53%. It is indicated that a shortfall in the use of financial services in the eastern region. The insufficiency contribution rate of each dimension in the central region shows a fluctuating trend, and the overall variation range is relatively small. Overall, the insufficiency contribution rate of coverage breadth in the western region dropped slightly, while the insufficient contribution rate of digitalization degree showed an obvious upward trend. The main reason may be that the financing environment in the western region is relatively poor, and the use of credit points is limited to a certain extent. The overall contribution rate of coverage breadth insufficiency in northeastern region has increased, with an average annual increase of 0.74%, and the development shortage is more significant. This may be related to the decrease of effective financial account caused by population loss in northeast region.
Further investigation of the impact of COVID-19 on the development shortcomings in four major regions shows that the insufficiency contribution rate of digitalization degree in all four major regions would decrease in 2020. This may be due to the implementation of contactless prevention and control measures during the epidemic led to the widespread popularity of mobile payments. So that mobile payment means such as QR code payments was widely used in major establishments, and the advantages of digital financial inclusion in terms of mobility and convenience were fully utilized in the epidemic era.
5.3. Trend Evolution of Insufficiency Development
Then, the characteristics of the trend evolution of digital inclusive finance are revealed in this paper through the long-term transfer law of insufficiency development of digital inclusive finance. The state transition probability matrix of insufficiency development of digital inclusive finance in China and the four major regions is shown in Table 3.
(1) There is a significant "Club Convergence" in the sufficiency development of digital inclusive finance in the whole country and in the eastern, central and western regions. The transfer probability on the main diagonal is higher than that on the non-main diagonal in the transfer matrix. From the national transfer matrix, the mean of the main diagonal shift probability is 0.7779, suggesting that the overall insufficiency level is likely to remain stable. According to the regional transfer matrix, it is easy to self-solidify if the main diagonal of the eastern, central and western regions is not sufficient. In the transfer matrix of northeastern region, the transfer probability of medium and low level is less than the corresponding downward transfer probability. It indicates that the development of digital inclusive finance in northeastern region is not fully self-reinforcing, and the structural weakness will be more obvious.
(2) There is a "Matthew Effect" of insufficient development of digital inclusive finance nationwide and in the four major regions. Provinces at low and high levels are less likely to transfer, especially the low ones. The low level stable probability of the whole country and the four major regions is more than 65%. It indicates that the insufficiency development of the low-level provinces will not be expanded basically, and it is difficult for the high-level provinces to make up for the development gaps, and the sufficiency development of digital inclusive finance is easy to fall into spatial disequilibrium.
(3) The probabilities on both sides of the diagonal of the shift matrix are mostly non-zero nationwide and in the four major regions, suggesting that the insufficiency level of digital inclusive finance development is shifted upward or downward within one year. In addition, there is no leapfrog transfer in the whole country and in the eastern, central and northeastern regions, and the level of insufficiency tends to remain stable. With the exception of the low and medium level provinces, provinces with other insufficiency level in the western region are likely to experience leapfrogging, but the probability is small, not exceeding 0.0811. For provinces in the western region, no matter whether there is a high or low level of insufficiency development of digital inclusive finance, there will be little leapfrogging or further improvement in a year.
6. Conclusion and Insights
Based on the revised Digital Inclusive Finance Index, we have measured the imbalance and insufficiency level of digital inclusive finance development in China from 2011 to 2020, further investigated its structural causes and analyzed the evolution trend. The main findings of this study are as follows:
- Over all, the Digital Inclusive Financial Index in China and the four major regions shows an upward trend, maintaining positive growth under the impact of the COVID-19 epidemic in 2020, but the growth rate has declined. Specifically, the eastern region has the highest development level. The western region has the highest annual growth rate.
- In terms of the imbalance of development, the imbalance level of digital inclusive finance development shows an downward trend. The eastern region has the highest imbalance level, and the development between the eastern and western regions is the most unbalanced. Inter-regional imbalance is the main source of overall development imbalance. The imbalance in coverage breadth is the main structural cause of imbalance development in China and the four major regions. The development gap of digital inclusive finance between the eastern region and the other three major regions has gradually widened, and the absolute difference tends to expand nationwide and in the eastern, central and western regions. The gap between the provinces with higher development degree and other provinces nationwide is gradually increasing, and there is a trend of bipolarization or multipolarization in China and the other three major regions, with the exception of the central region.
- In terms of the insufficiency of development, the insufficiency level of digital inclusive finance rose slightly in China. The eastern region is relatively fully sufficient, and the western region is the most insufficient. The development shortcoming of digital inclusive finance in China and the four major regions is the coverage breadth. There is a significant "Club Convergence" nationwide and in the eastern, central and western regions. There is a "Matthew effect" of insufficient development of digital inclusive finance nationwide and in the four major regions. With the exception of the low and medium level provinces, provinces with other insufficiency level in the western region are likely to experience leapfrogging.
According to the above research findings, the specific insights are as follows:
First, it should accelerate the construction of digital inclusive finance to promote the upward catch-up of low level regions and the sustainable improvement of high-level regions. Regions with low development level of digital inclusive finance should deepen the application of digital technology in the field of inclusive finance and improve and improve the level of intelligent services in various fields such as payment, credit and insurance. At the same time, it should strengthen the training of digital innovative talents and further reduce the threshold of financial services. Regions with a high development level of digital inclusive finance should accelerate innovation in digital inclusive financial products and services to continuously meet people's needs for comprehensive and differentiated financial services, and strengthen digital inclusive financial risk management to prevent and control possible infringements of consumer rights and interests arising from the application of digital technology.
Second, it should coordinate the development of digital inclusive finance among regions and narrow the development gap within the region. On the one hand, the government should accelerate the construction of inter-regional digital inclusive financial infrastructure connection, make full use of the pull effect and radiation effect of developed regions, further extend the coverage of digital inclusive financial institutions by utilizing the geographic penetration of digital inclusive finance to provide advanced experience for backward regions. On the other hand, the regional governments should strengthen the cooperation and exchange of digital inclusive finance in the region, establish and improve the financial benign operation mechanism serving the low-income groups, and improve the coverage of effective digital accounts and the utilization degree of financial services such as insurance and credit.
Third, it should focus on the development gaps of digital inclusive finance to break self-solidification. Provinces that are more fully developed should focus on the weak links in the early development process, carry out financial knowledge popularization activities aiming at specific groups, improve people's digital economic literacy[33], deepen the construction of rural digital credit system, and narrow the "digital gap" between urban and rural areas. Provinces with less adequate development should combine the development experience of advanced provinces with the development characteristics of the province to build a characteristic digital inclusive financial system. At the same time, it should further improve the coverage of effective digital accounts in the region, promote the organic linkage among financial services to expand the depth of use, optimize the online payment, micro-credit and other facilitation services to improve the digitization degree.
This paper also has some limitations. On the one hand, the research area of this paper is limited to China. The scope of the study can be further expanded in future research to provide reference for other countries and regions around the world. On the other hand, in this paper, we focus on digital inclusive finance itself. Future research may combine digital inclusive finance with the themes of green development and poverty return curbing to provide a new perspective on global issues.
Author Contributions
Conceptualization, M.C. and Q.C.; methodology, Q.L. and T.Z.; software, J.L. and W.Y.; validation, Q.C, Q.L. and T.Z.; formal analysis, M.C.; investigation, Q.C. and Q.L.; resources, T.Z. and J.L.; data curation, W.Y.; writing—original draft preparation, M.C. and Q.C.; writing—review and editing, Q.L.; visualization, T.Z., J.L. and W.Y.; supervision, M.C.; project administration, Q.C. and Q.L.; funding acquisition, M.C. All authors have read and agreed to the published version of the manuscript.
Funding
This research was funded by National Social Science Foundation(grant number 19BJY087); and Ministry of Education Humanities and Social Science Research Youth Fund Project(grant number 15YJC790011).
Institutional Review Board Statement
Not applicable.
Informed Consent Statement
Not applicable.
Data Availability Statement
Not applicable.
Acknowledgments
The authors would like to thank the editors and reviewers for their insightful comments and efforts toward improving this manuscript.
Conflicts of Interest
The authors declare no conflict of interest.
References
- Joia, L.A.; Cordeiro, J.P.V. Unlocking the Potential of Fintechs for Financial Inclusion: A Delphi-Based Approach. Sustainability 2021, 13, 11675. [Google Scholar] [CrossRef]
- Morgan, P.J. Fintech and Financial Inclusion in Southeast Asia and India. Asian Economic Policy Review 2022, 17, 183–208. [Google Scholar] [CrossRef]
- Kim, D.W.; Yu, J.S.; Hassan, M.K. Inclusive finance and economic growth in OIC countries. Research in International Business and Finance 2017, 43, 1–14. [Google Scholar] [CrossRef]
- Ozili, P.K. Impact of digital finance on inclusive finance and stability. Borsa Istanbul Review 2018, 18, 329–340. [Google Scholar] [CrossRef]
- Duvendack, M.; Mader, P. Impact of inclusive finance in lowand middle-income countries: a systematic review of reviews. Campbell Systematic Reviews 2019, 15, e1012. [Google Scholar] [CrossRef] [PubMed]
- Liang, C.A.; Du, G.M.; Cui, Z.D.; Faye, B. Does Digital Inclusive Finance Enhance the Creation of County Enterprises? Taking Henan Province as a Case Study. Sustainability 2022, 14, 14542. [Google Scholar] [CrossRef]
- Liu, S.; Koster, S.; Chen, X.Y. Digital divide or dividend? The impact of digital finance on the migrants entrepreneurship in less developed regions of China. Cities 2022, 131, 103896. [Google Scholar] [CrossRef]
- Li, L.; Li, Z.L.; Li, L.H.; Wang, Z.H. Digital financial inclusion and environmental entrepreneurship: evolution of state legal environmental responsibility in China. Environmental Science and Pollution Research 2023. [Google Scholar] [CrossRef]
- Chen, B.; Zhao, C.K. Poverty reduction in rural China: Does the digital finance matter? Plos One 2021, 16, e0261214. [Google Scholar] [CrossRef]
- Xiong, M.Z.; Li, W.Q.; Teo, B.S.X.; Othman, J. Can China's Digital Inclusive Finance Alleviate Rural Poverty? An Empirical Analysis from the Perspective of Regional Economic Development and an Income Gap. Sustainability 2023, 14, 16984. [Google Scholar] [CrossRef]
- Xiong, M.Z.; Fan, J.J.; Li, W.Q.; Xian, B.T.S. Can China's digital inclusive finance help rural revitalization? A perspective based on rural economic development and income disparity. Frontiers In Environmental Science 2022, 10, 985620. [Google Scholar] [CrossRef]
- Li, Q.Q.; Liu, Q.L. Impact of Digital Financial Inclusion on Residents’ Income and Income Structure. Sustainability 2023, 15, 2196. [Google Scholar] [CrossRef]
- Ding, X.M.; Gao, L.F.; Wang, G.J.; Nie, Y. Can the development of digital financial inclusion curb carbon emissions? Empirical test from spatial perspective. Frontiers In Environmental Science 2022, 10, 1045878. [Google Scholar] [CrossRef]
- Zhao, H.; Yang, Y.R.; Li, N.; Liu, D.S.; Li, H. How Does Digital Finance Affect Carbon Emissions? Evidence from an Emerging Market. Sustainability 2021, 13, 12303. [Google Scholar] [CrossRef]
- Wang, H.L.; Guo, J.G. Impacts of digital inclusive finance on CO(2 )emissions from a spatial perspective: Evidence from 272 cities in China. Journal of Cleaner Production 2022, 355, 131618. [Google Scholar] [CrossRef]
- Guo, F.; Wang, J.; Wang, F.; Kong, T.; Zhang, X.; Cheng, Z.J.E.Q. Measuring the Development of Digital Inclusive Finance in China:Index Compilation and Spatial Characteristics. China Econ 2020, 19, 1401–1418. [Google Scholar]
- Asif, R.; Yang, X. D. Digital finance and green growth in China: Appraising inclusive digital finance using web crawler technology and big data. Technological Forecasting and Social Change 2023, 188, 122262. [Google Scholar] [CrossRef]
- Shen, Y.; Hueng, J.C.; Hu, W.X. Measurement and spillovereffect of digital financial inclusion: a cross-country analysis. Applied Economics Letters 2021, 28, 1738–1743. [Google Scholar] [CrossRef]
- Khera, P.; Ng, S.; Ogawa, S.; Sahay, R. Measuring Digital Financial Inclusion in Emerging Market and Developing Economies: A New Index. Asian Economic Policy Review 2022, 17, 213–230. [Google Scholar] [CrossRef]
- Vasile, V.; Panait, M.; Apostu, S.A. Financial Inclusion Paradigm Shift in the Postpandemic Period. Digital-Divide and Gender Gap. International Journal of Environmental Research and Public Health 2022, 18, 10938. [Google Scholar] [CrossRef]
- Takmaz, S.; Sari, E.; Alatas, S. Financial inclusion in Turkey: unpacking the provincial inequality and its determinants. Applied Economics Letters 2022. [Google Scholar] [CrossRef]
- Lyons, A.C.; Kass-Hanna, J.; Fava, A. Fintech development and savings, borrowing, and remittances: A comparative study of emerging economies. Emerging Markets Review 2022, 51, 100842. [Google Scholar] [CrossRef]
- Wang, Q.; Yang, J.B.; Chiu, Y.H.; Lin, T.Y. Cross-regional comparative study on digital finance and finance efficiency in China: The eastern and non-eastern areas. Managerial Decision Economics 2022, 44, 68–83. [Google Scholar] [CrossRef]
- Li, H.J.; Shi, Y.; Zhang, J.X.; Zhang, Z.K.; Zhang, Z.S.; Gong, M.G. Digital inclusive finance & the high-quality agricultural development: Prevalence of regional heterogeneity in rural China. Plos One 2023, 18, e0281023. [Google Scholar] [CrossRef]
- Bacha, O.I.; Mirakhor, A . Funding development infrastructure without leverage: A risk-sharing alternative using innovative sukuk structures. World Economy 2018, 41, 752–762. [Google Scholar] [CrossRef]
- Loganathan, T.; Chan, Z.X.; Pocock, N.S. Healthcare financing and social protection policies for migrant workers in Malaysia. Plos One 2020, 15, e0243629. [Google Scholar] [CrossRef]
- Saviano, M.; Nenci, L.; Caputo, F. The financial gap for women in the MENA region: a systemic perspective. Gender in Management 2017, 32, 203–217. [Google Scholar] [CrossRef]
- Lloyd, A.D.; Antonioletti, M.; Sloan, T.M. Able but not willing? Exploring divides in digital versus physical payment use in China. Information Technology & People 2016, 29, 250–279. [Google Scholar]
- Aziz, A.; Naima, U. Rethinking digital financial inclusion: Evidence from Bangladesh. Technology in Society 2021, 64, 101509. [Google Scholar] [CrossRef]
- Spires, E.E. Using the Analytic Hierarchy Process to Analyze Multiattribute Decisions. Multivariate behavioral research 1991, 26, 345–361. [Google Scholar] [CrossRef]
- Dagum, C. A New Approach to the Decomposition of the GiNi Income Inequality Ratio. Empirical Economics, 1997, 22, 515–531. [Google Scholar]
- Quah, D. Galton’s Fallacy and Tests of the Convergence Hypothesis. The Scandinavian Journal of Economics 1993, 95, 427–443. [Google Scholar] [CrossRef]
- Xie, B.; Charness, N.; Fingerman, K.; Kaye, J.; Kim, M.T.; Khurshid, A. When Going Digital Becomes a Necessity: Ensuring Older Adults' Needs for Information, Services, and Social Inclusion During COVID-19. Journal of Aging & Social Policy 2020, 32, 460–470. [Google Scholar] [CrossRef]
Figure 1.
The digital inclusive finance index in China and four major regions from 2011 to 2020.
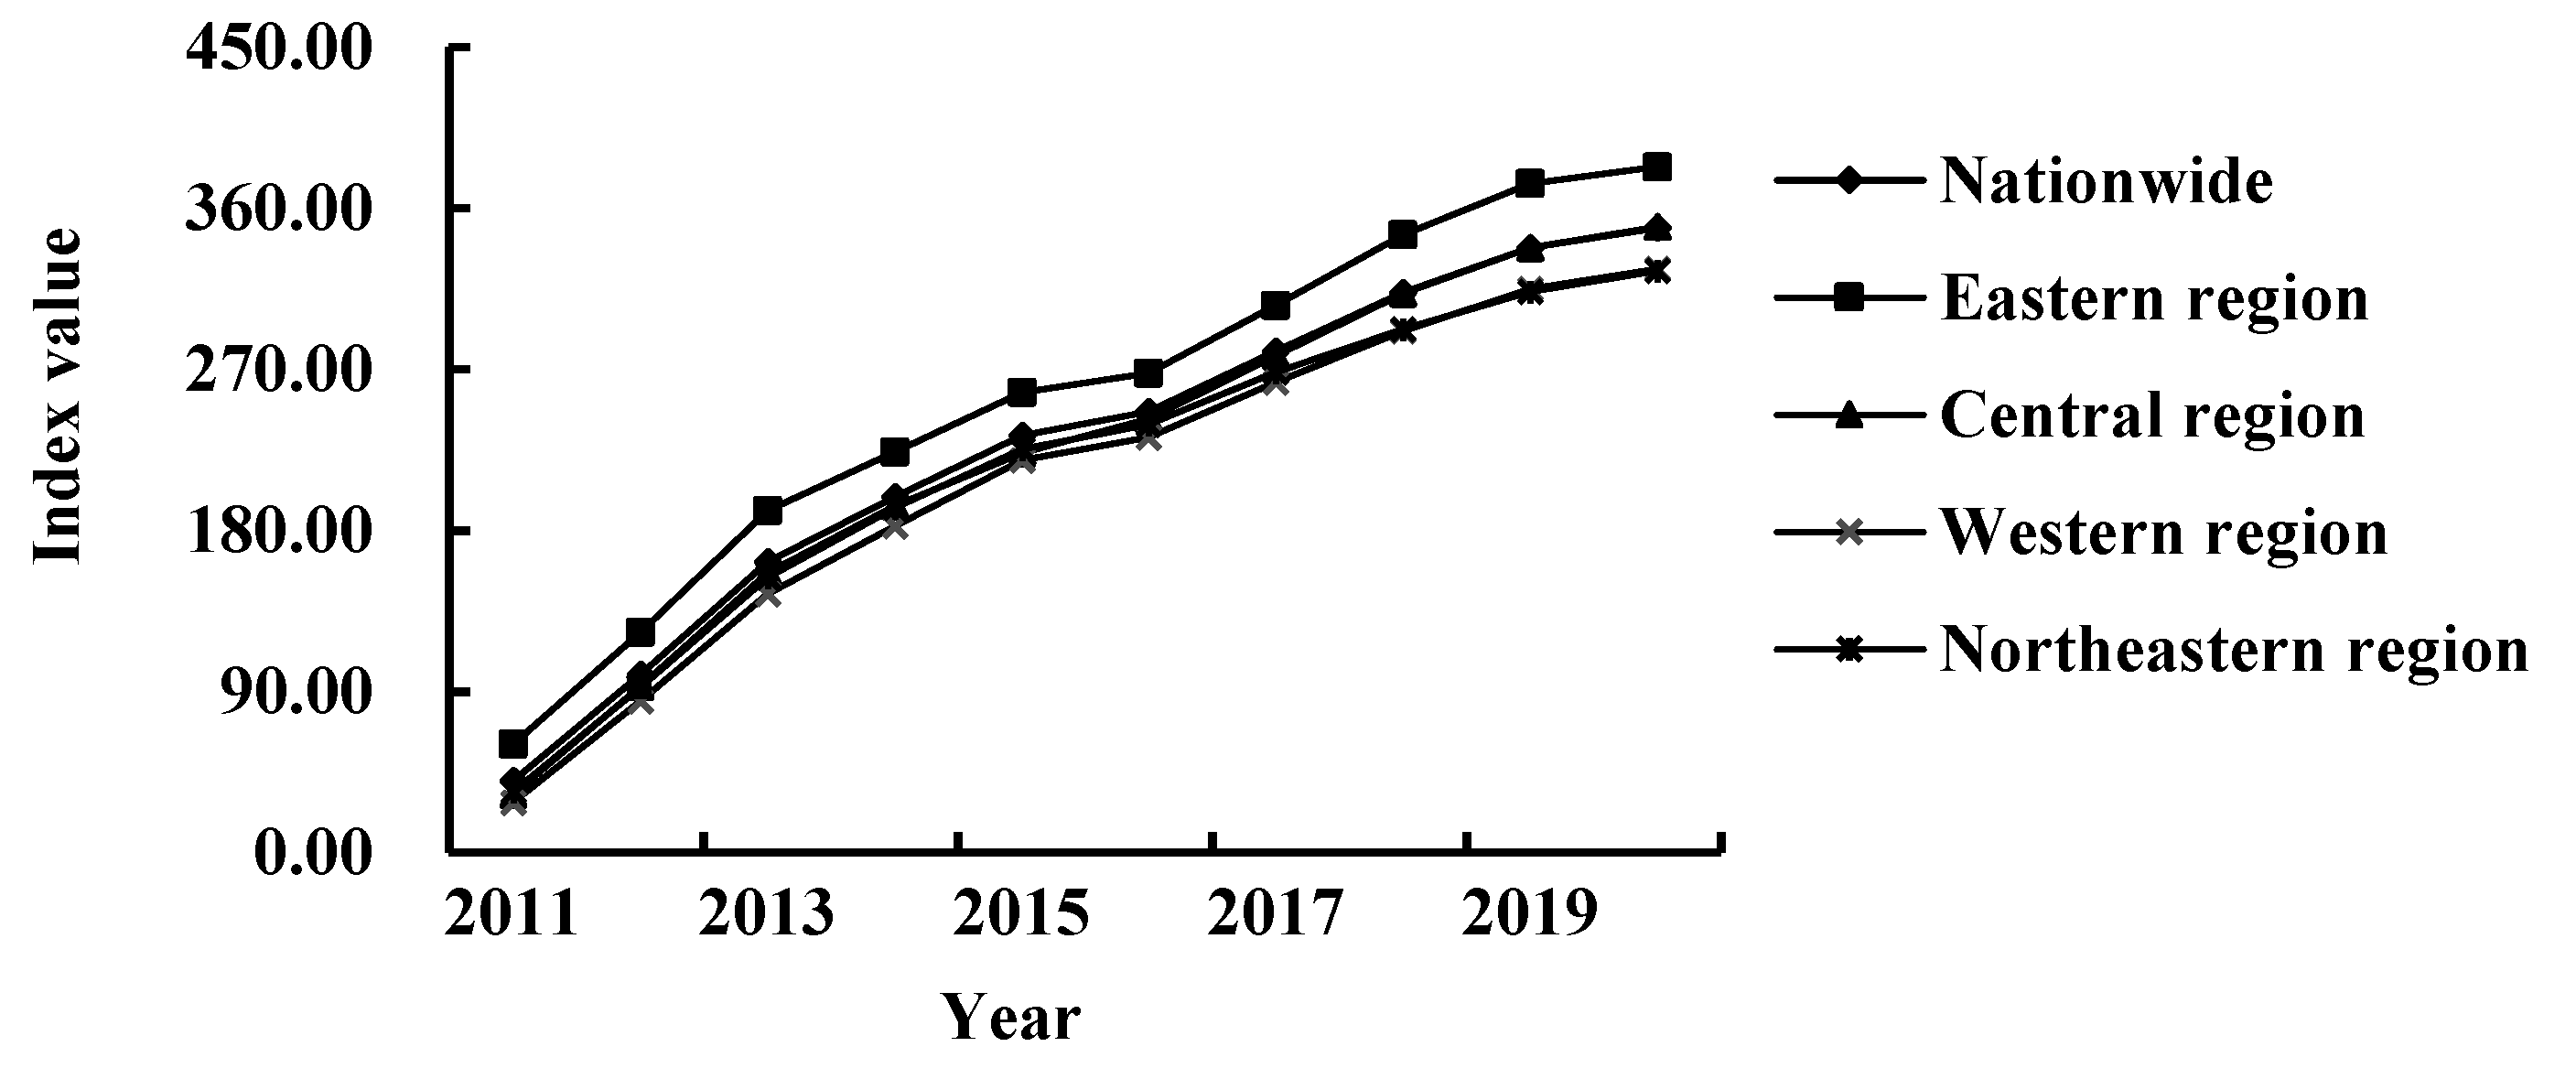
Figure 2.
China's national and four major regional imbalance index and inter-regional imbalance index from 2011 to 2020. In Figure b, 1 represents the eastern region, 2 represents the central region, 3 represents the western region, and 4 represents the northeast region.
Figure 2.
China's national and four major regional imbalance index and inter-regional imbalance index from 2011 to 2020. In Figure b, 1 represents the eastern region, 2 represents the central region, 3 represents the western region, and 4 represents the northeast region.
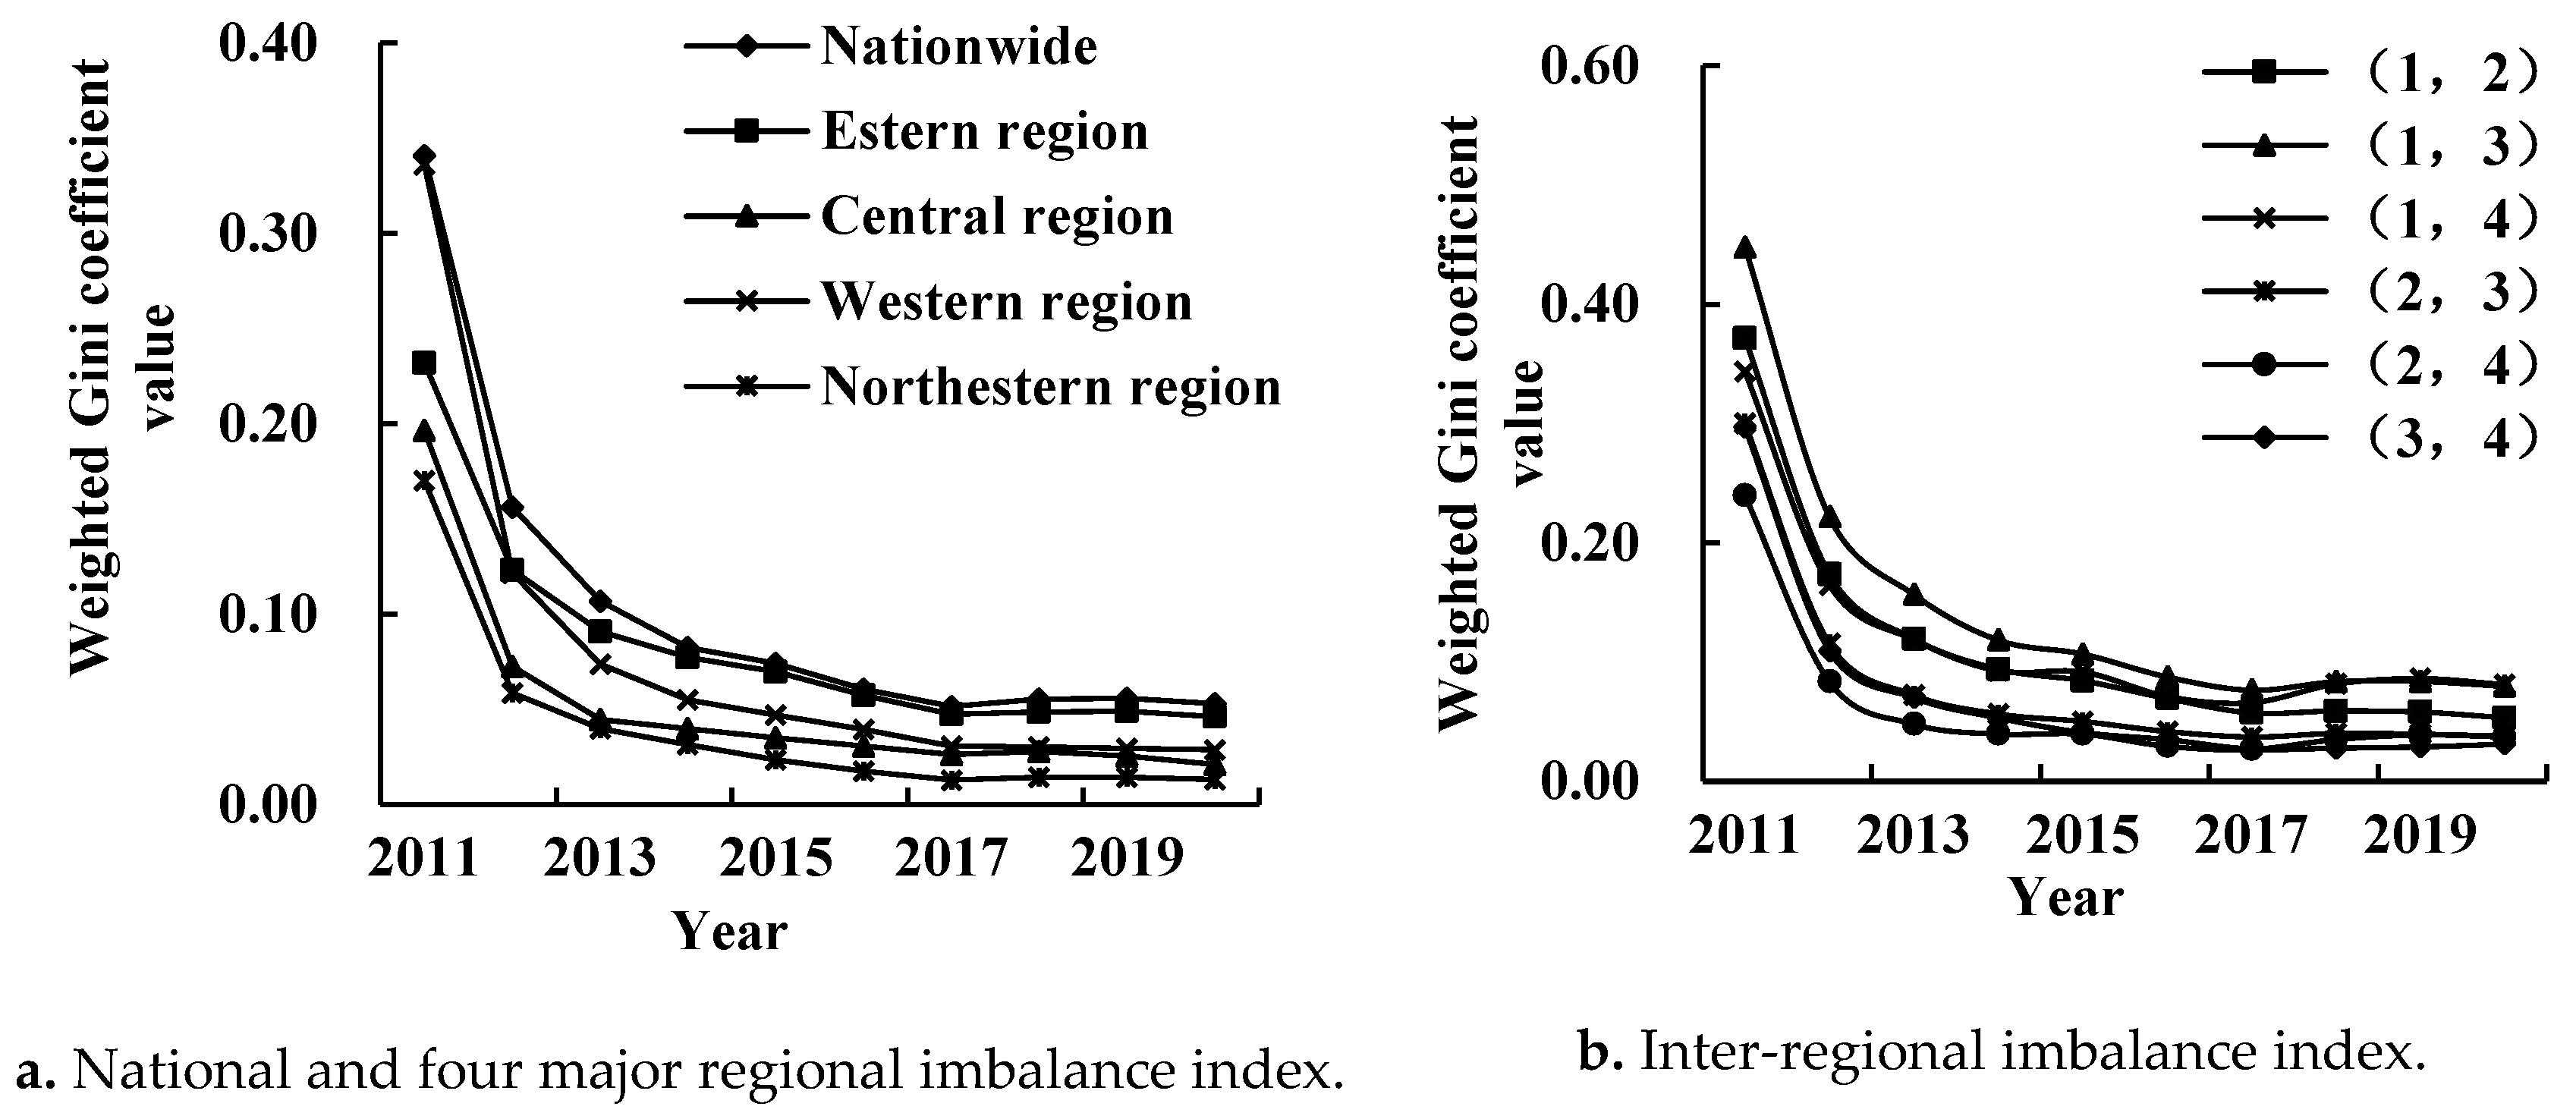
Figure 3.
Sources and contribution rates of China's overall digital inclusive finance development imbalance.
Figure 3.
Sources and contribution rates of China's overall digital inclusive finance development imbalance.
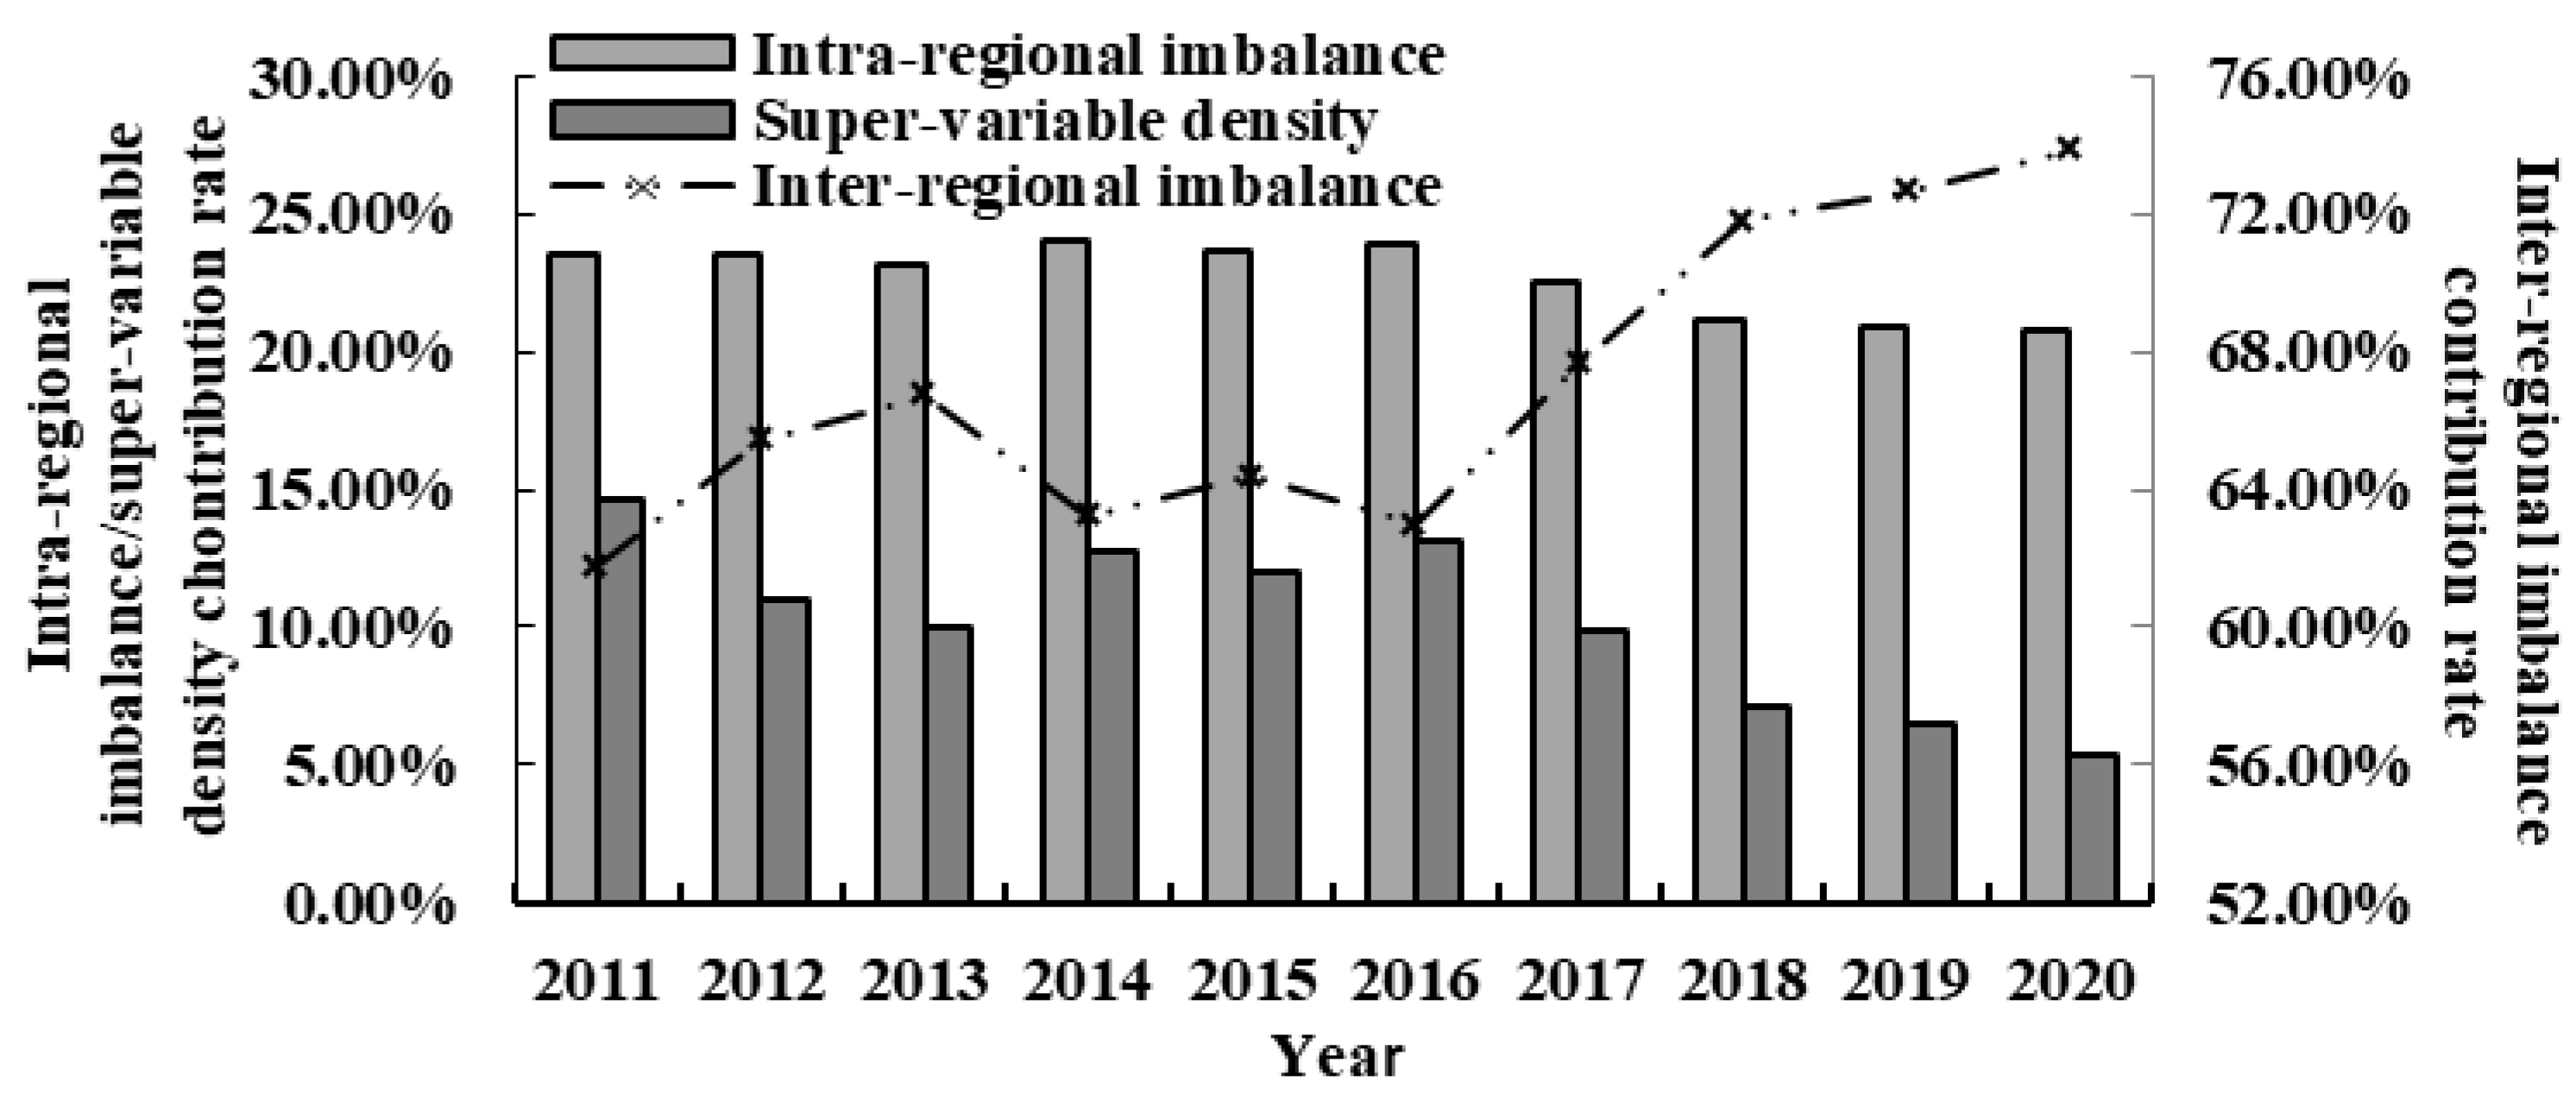
Figure 4.
Results of the decomposition of the contribution of intra-regional and inter-regional imbalances in the four major regions of China. In Figure b, 1 represents the eastern region, 2 represents the central region, 3 represents the western region, and 4 represents the northeast region.
Figure 4.
Results of the decomposition of the contribution of intra-regional and inter-regional imbalances in the four major regions of China. In Figure b, 1 represents the eastern region, 2 represents the central region, 3 represents the western region, and 4 represents the northeast region.
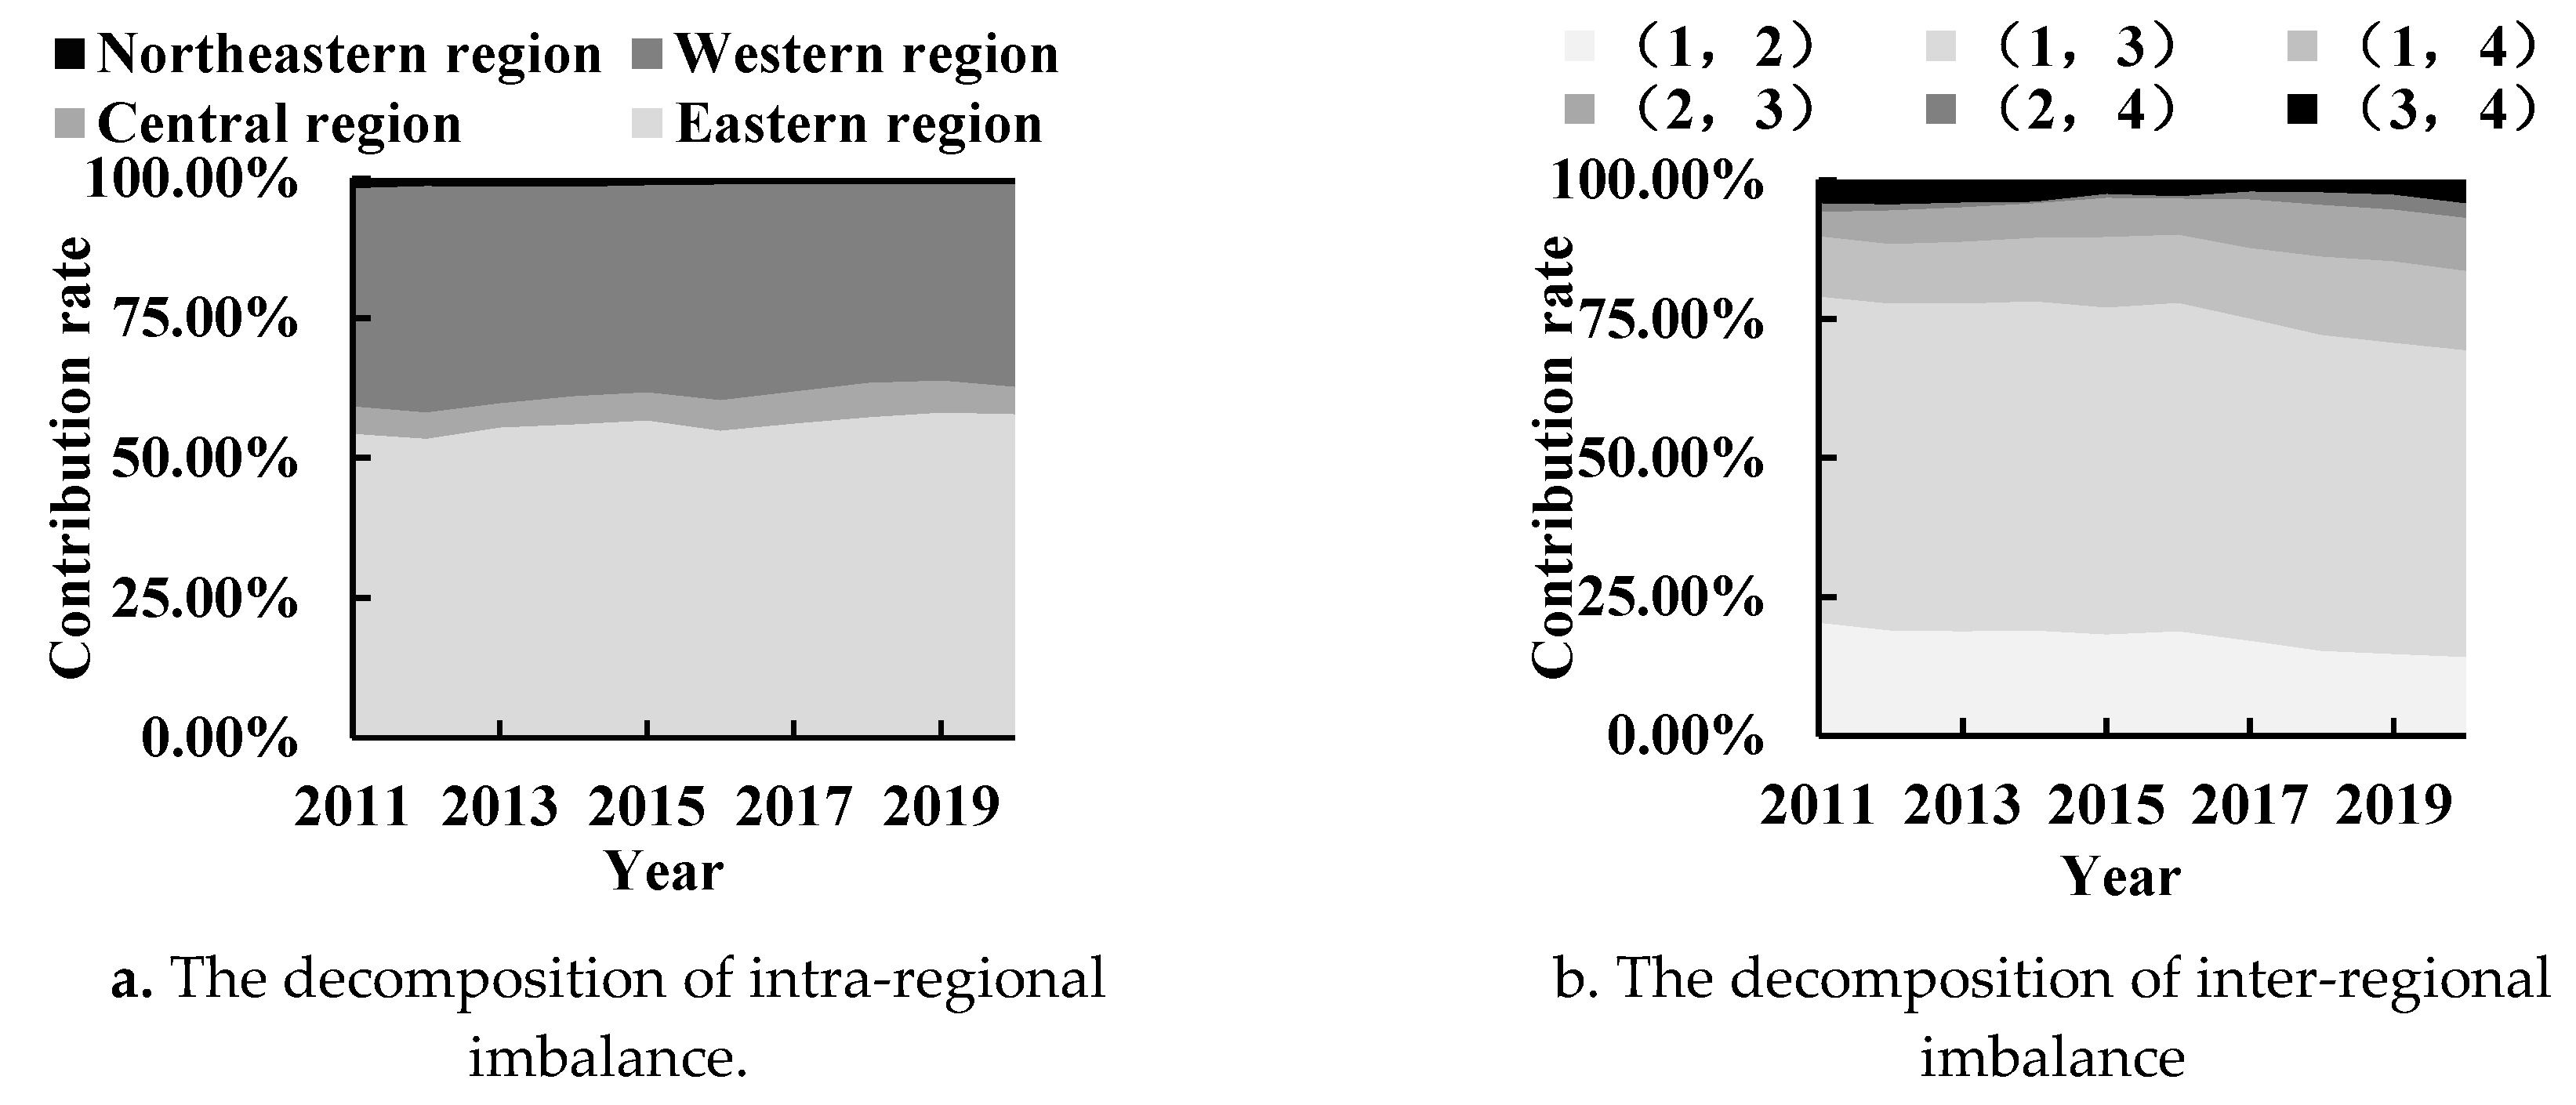
Figure 5.
The structural contribution to the imbalance of China and the four major regions.

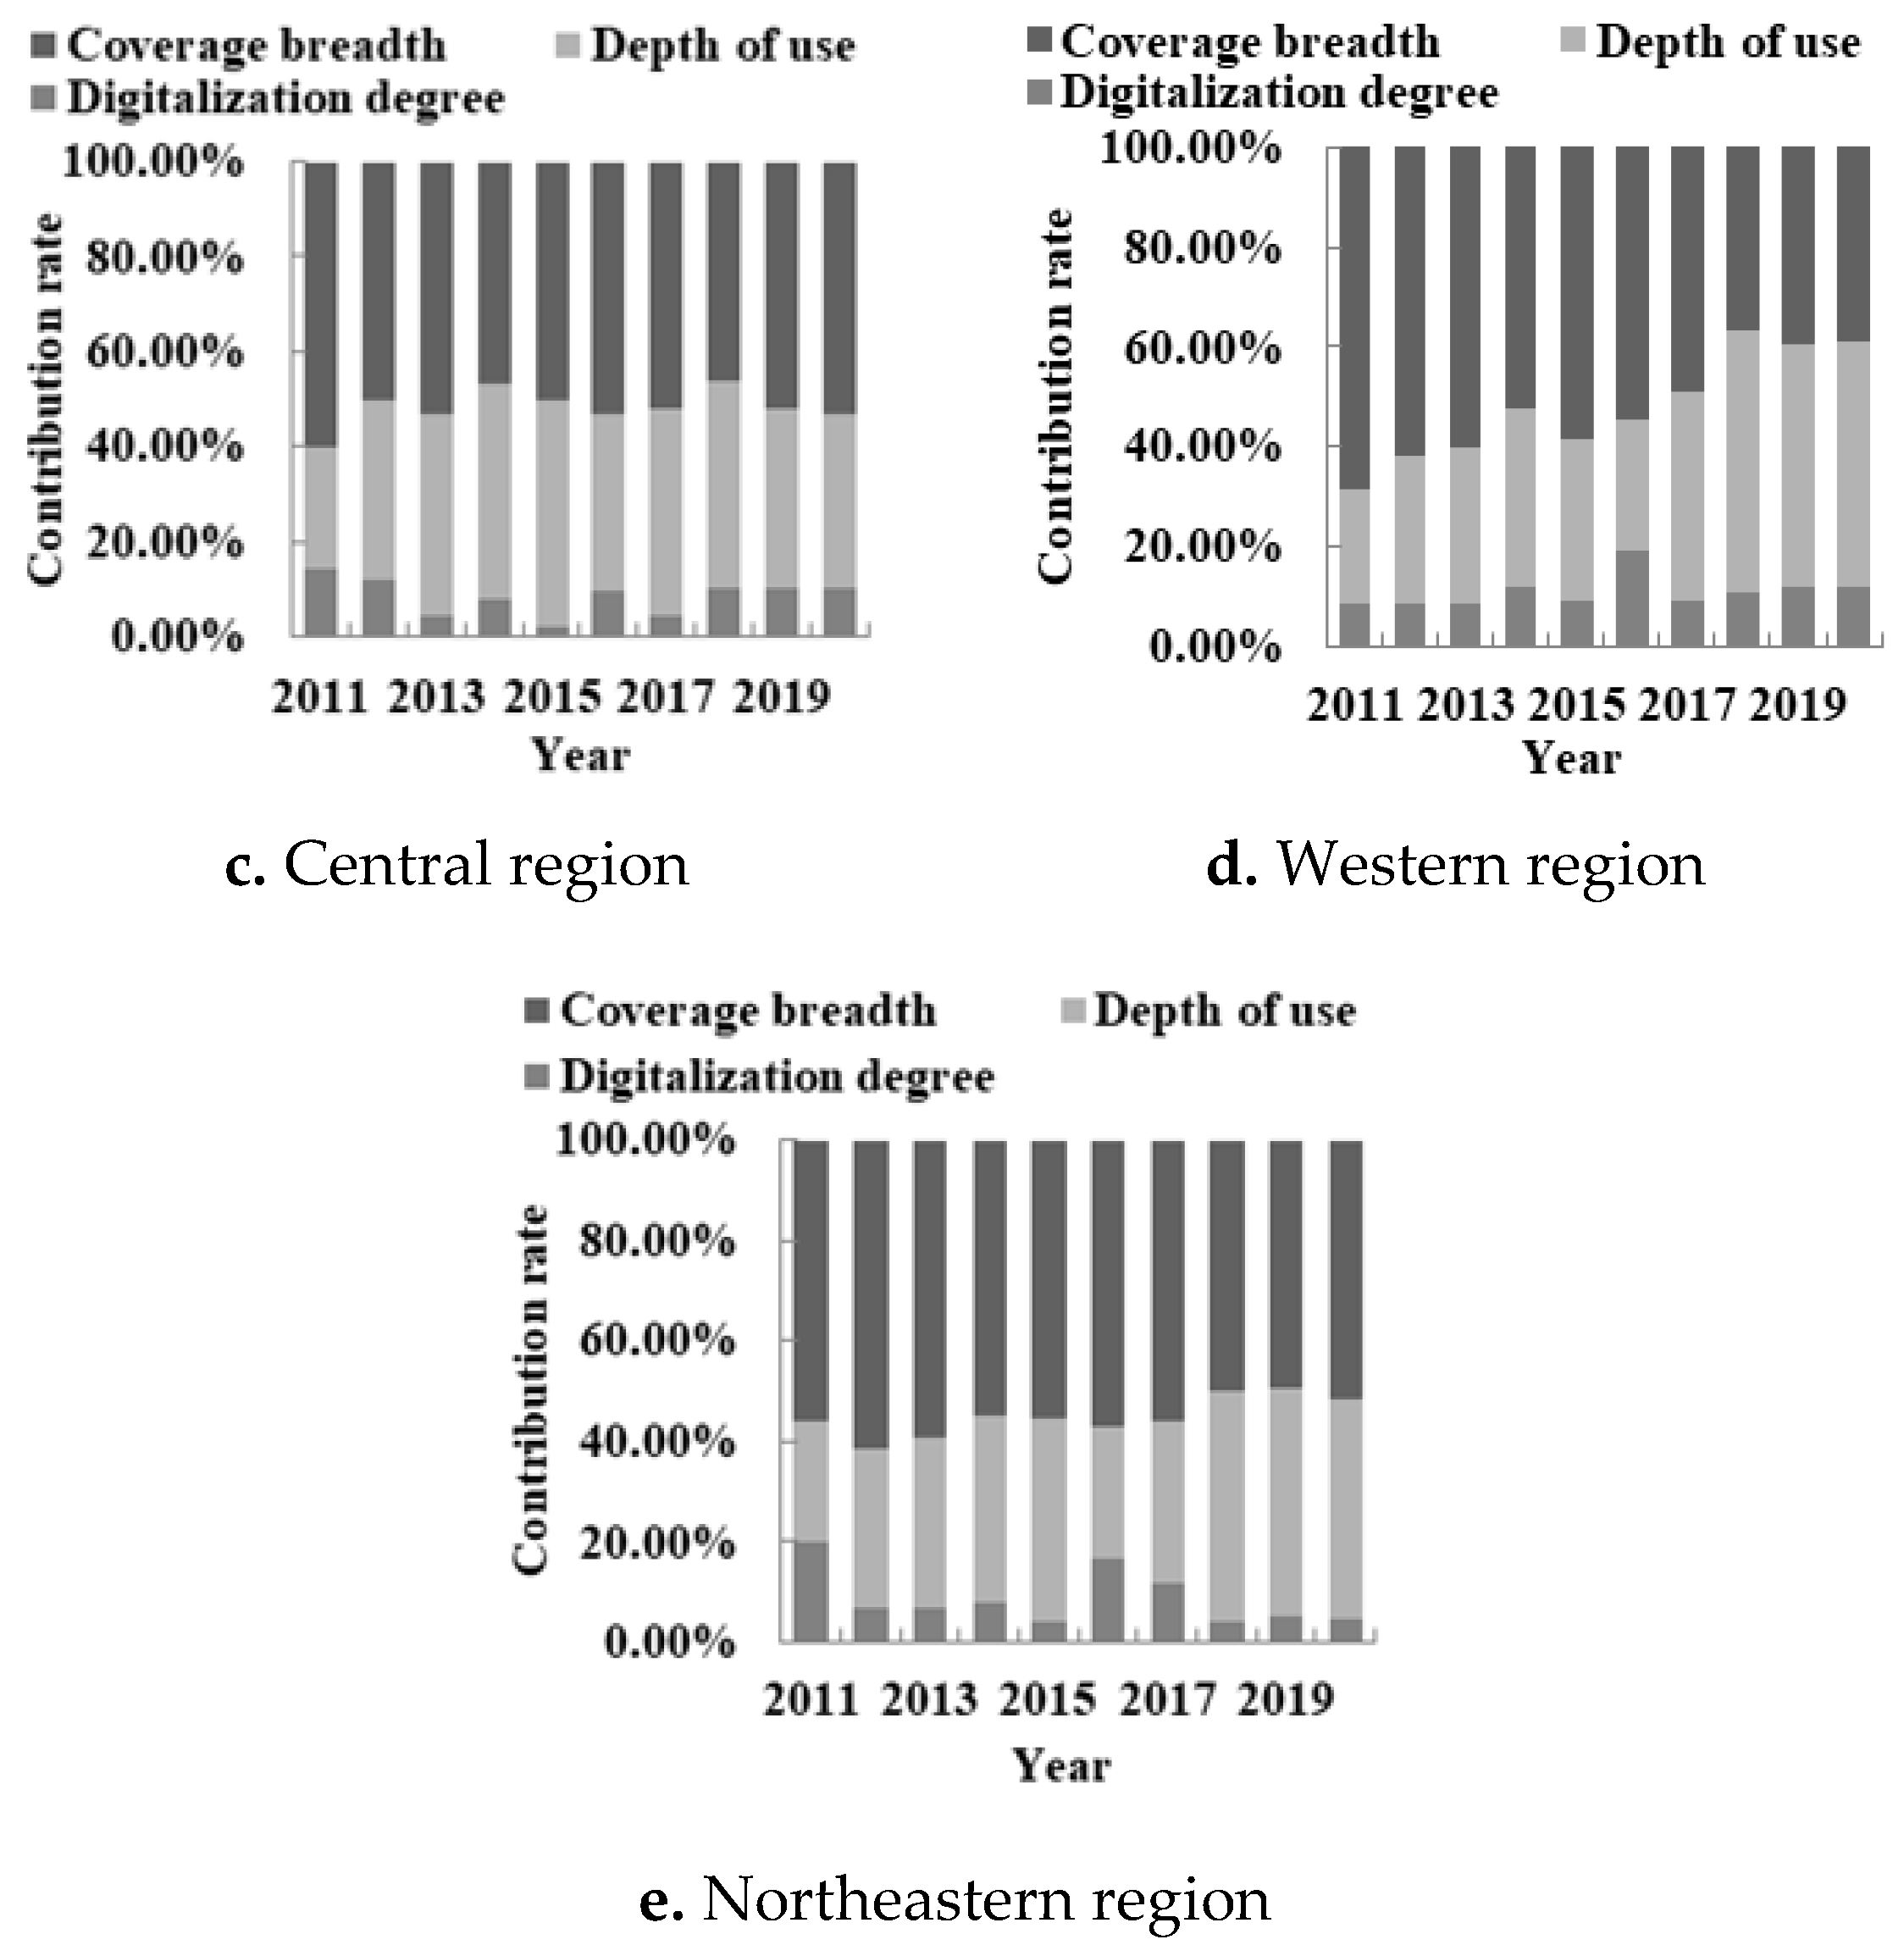
Figure 6.
The trend evolution of digital financial inclusion in China and the four major regions from 2011 to 2020.
Figure 6.
The trend evolution of digital financial inclusion in China and the four major regions from 2011 to 2020.
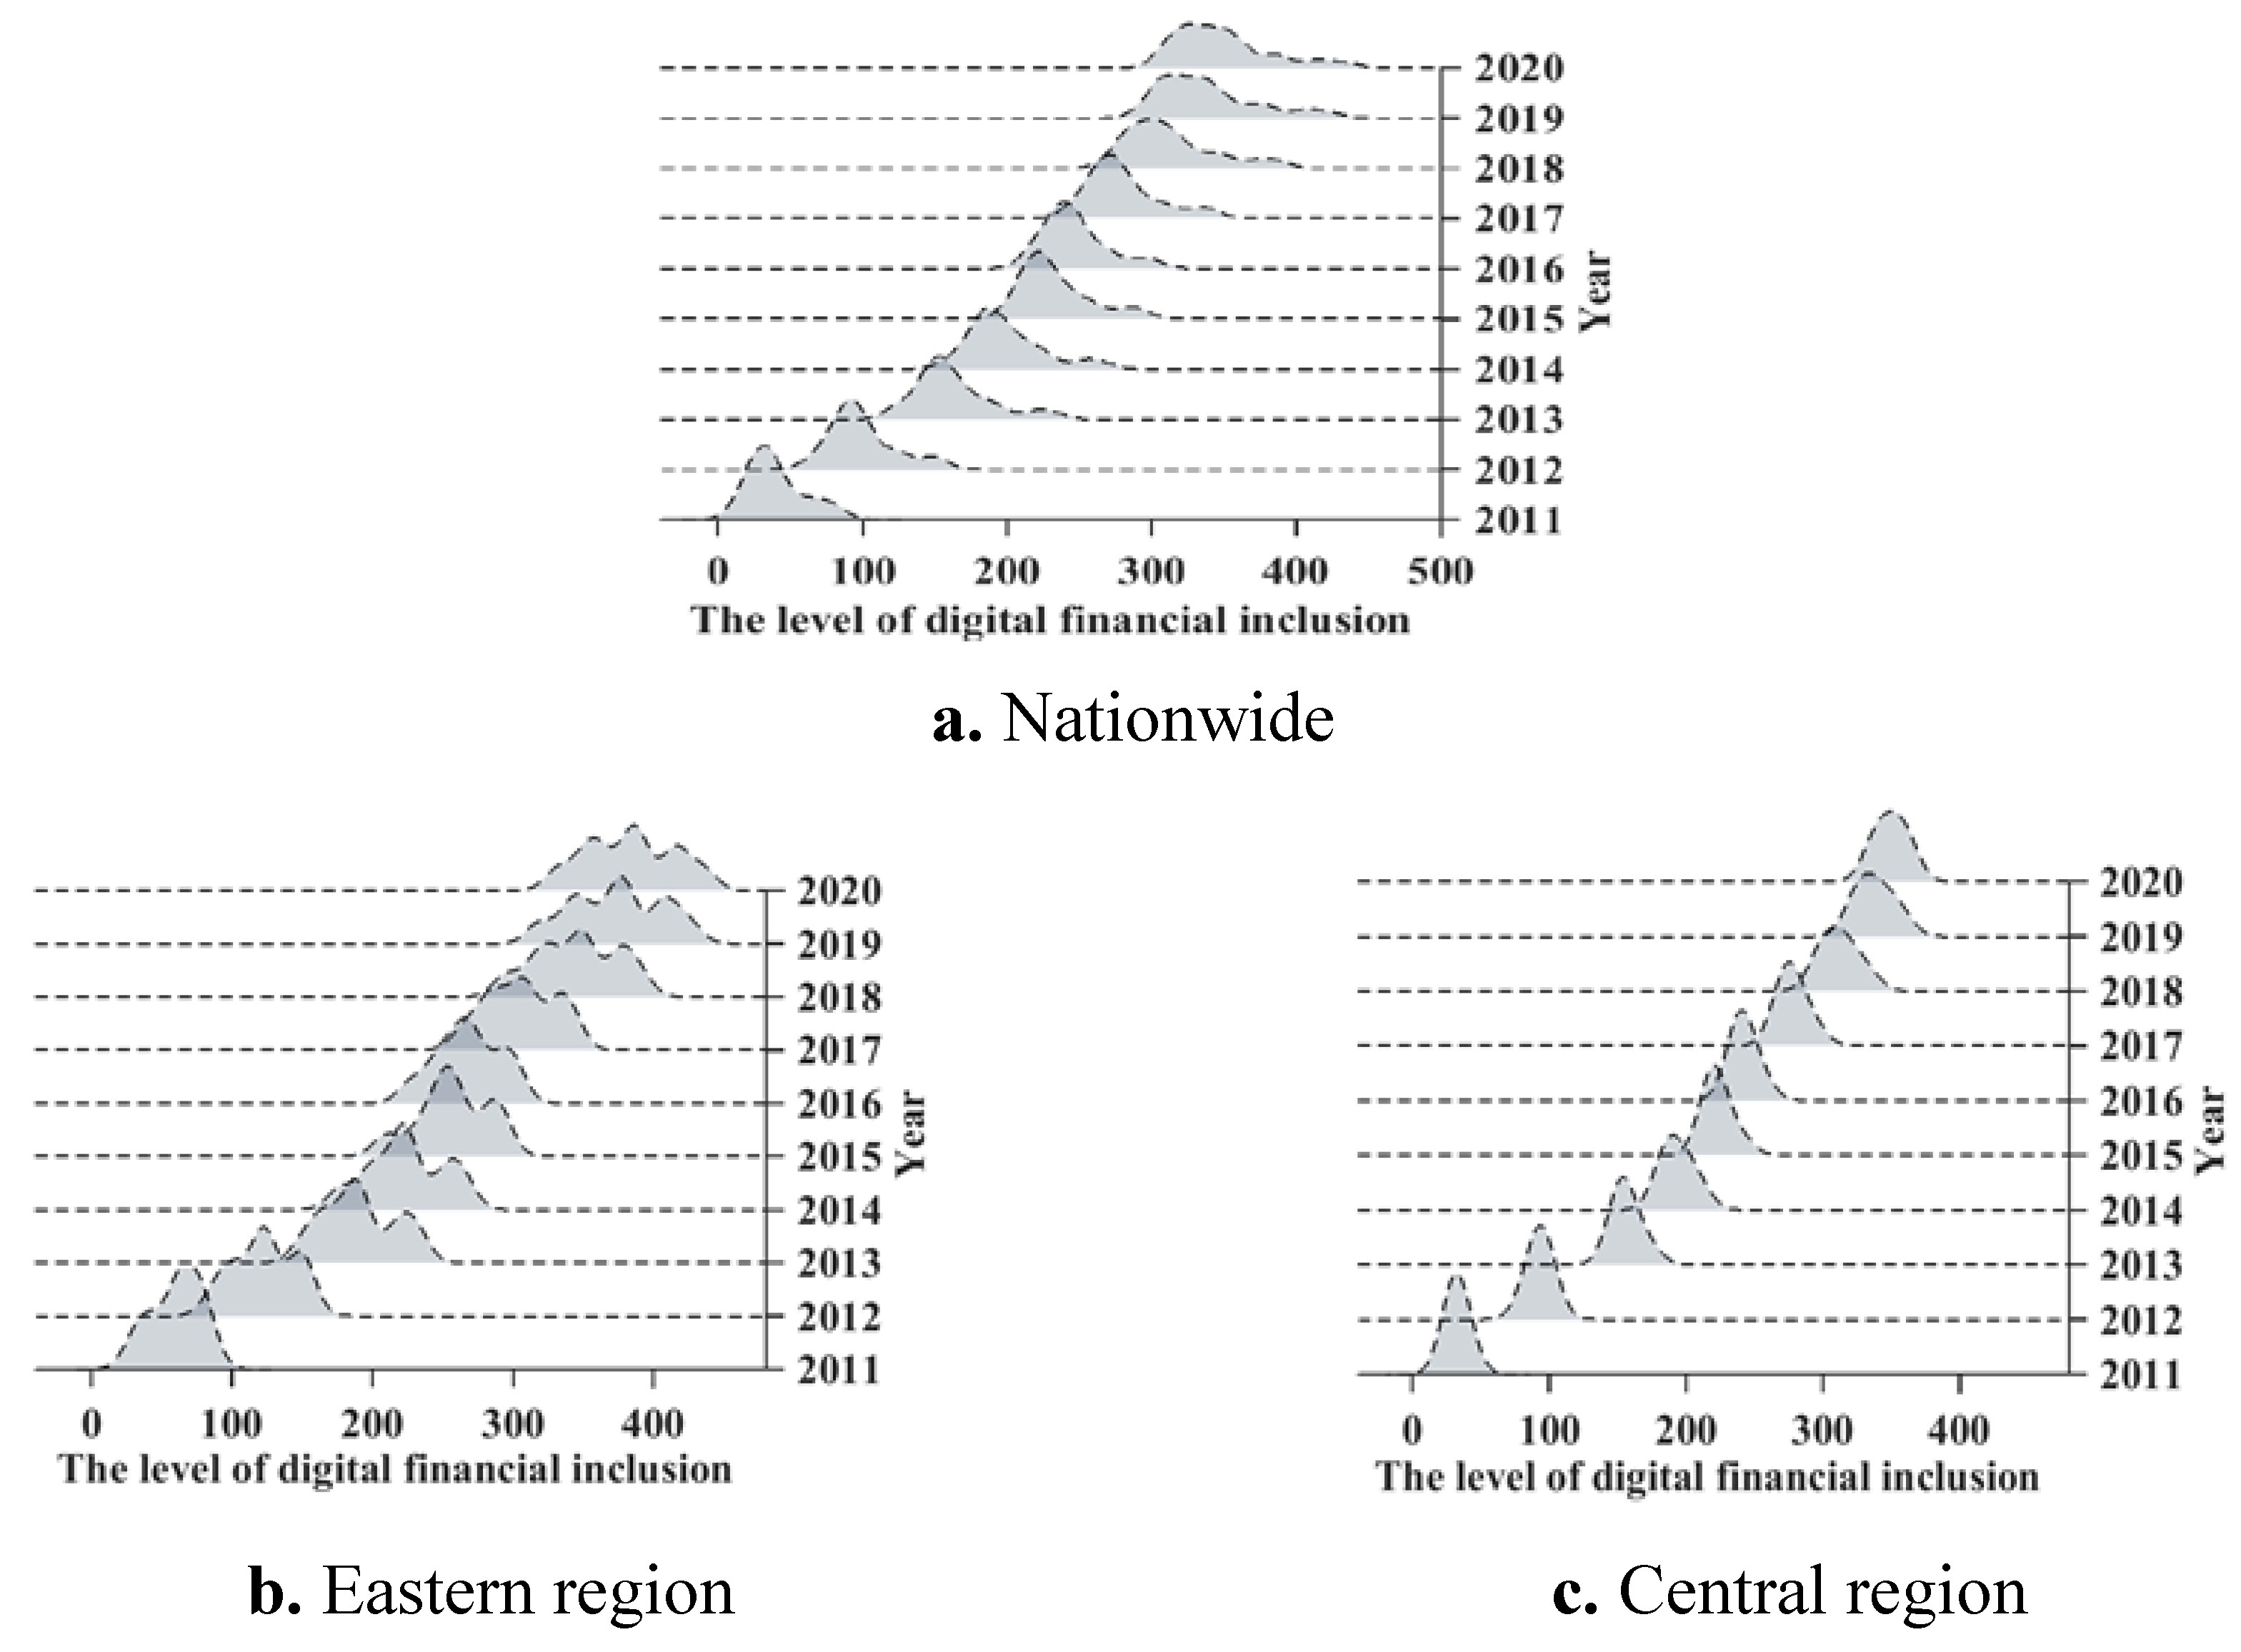
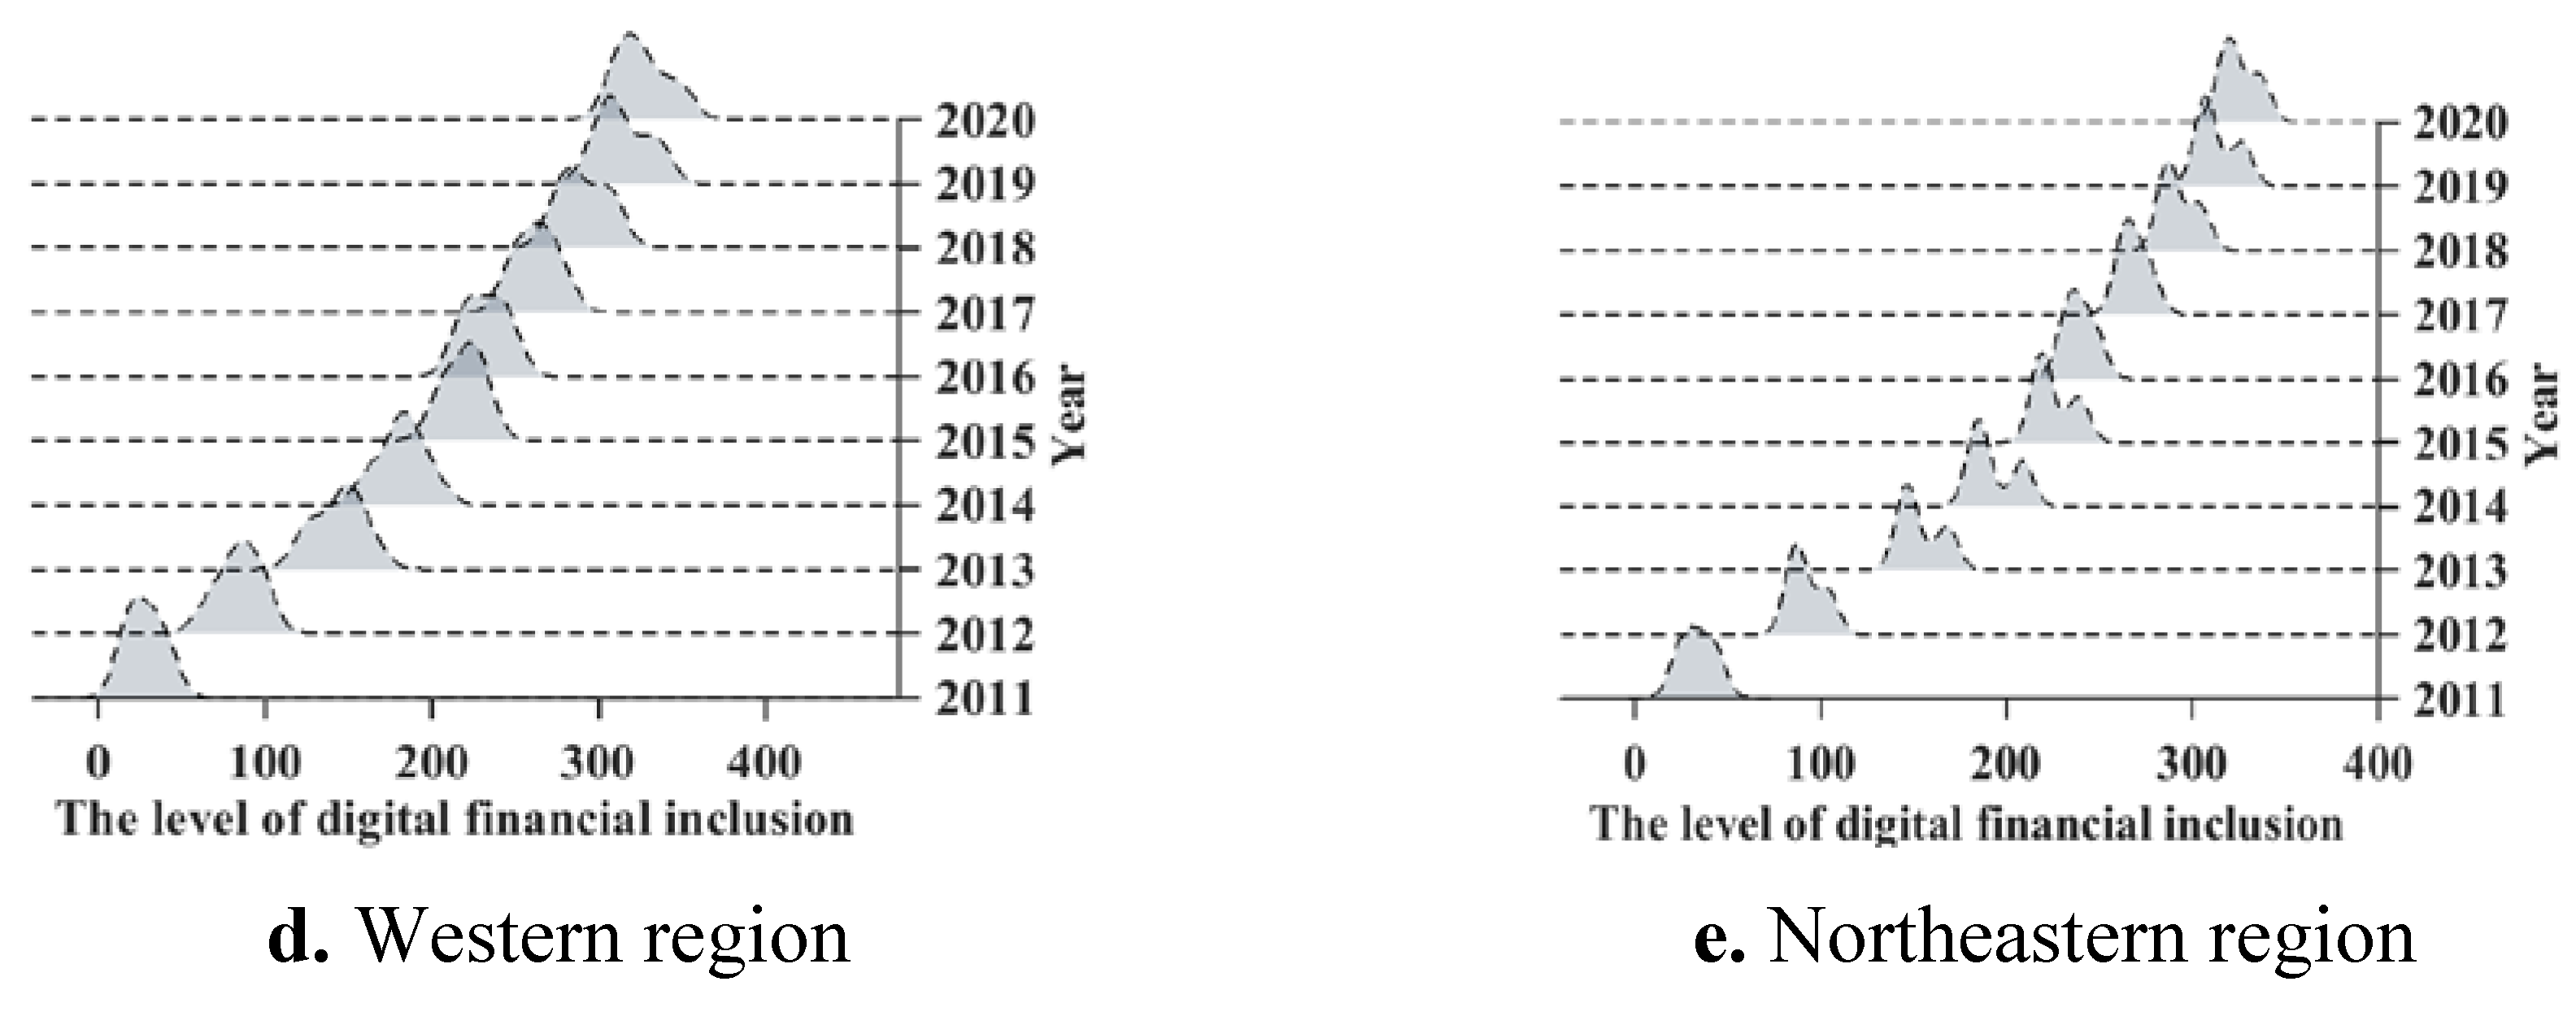
Figure 7.
China's national and four major regional insufficiency index from 2011 to 2020.
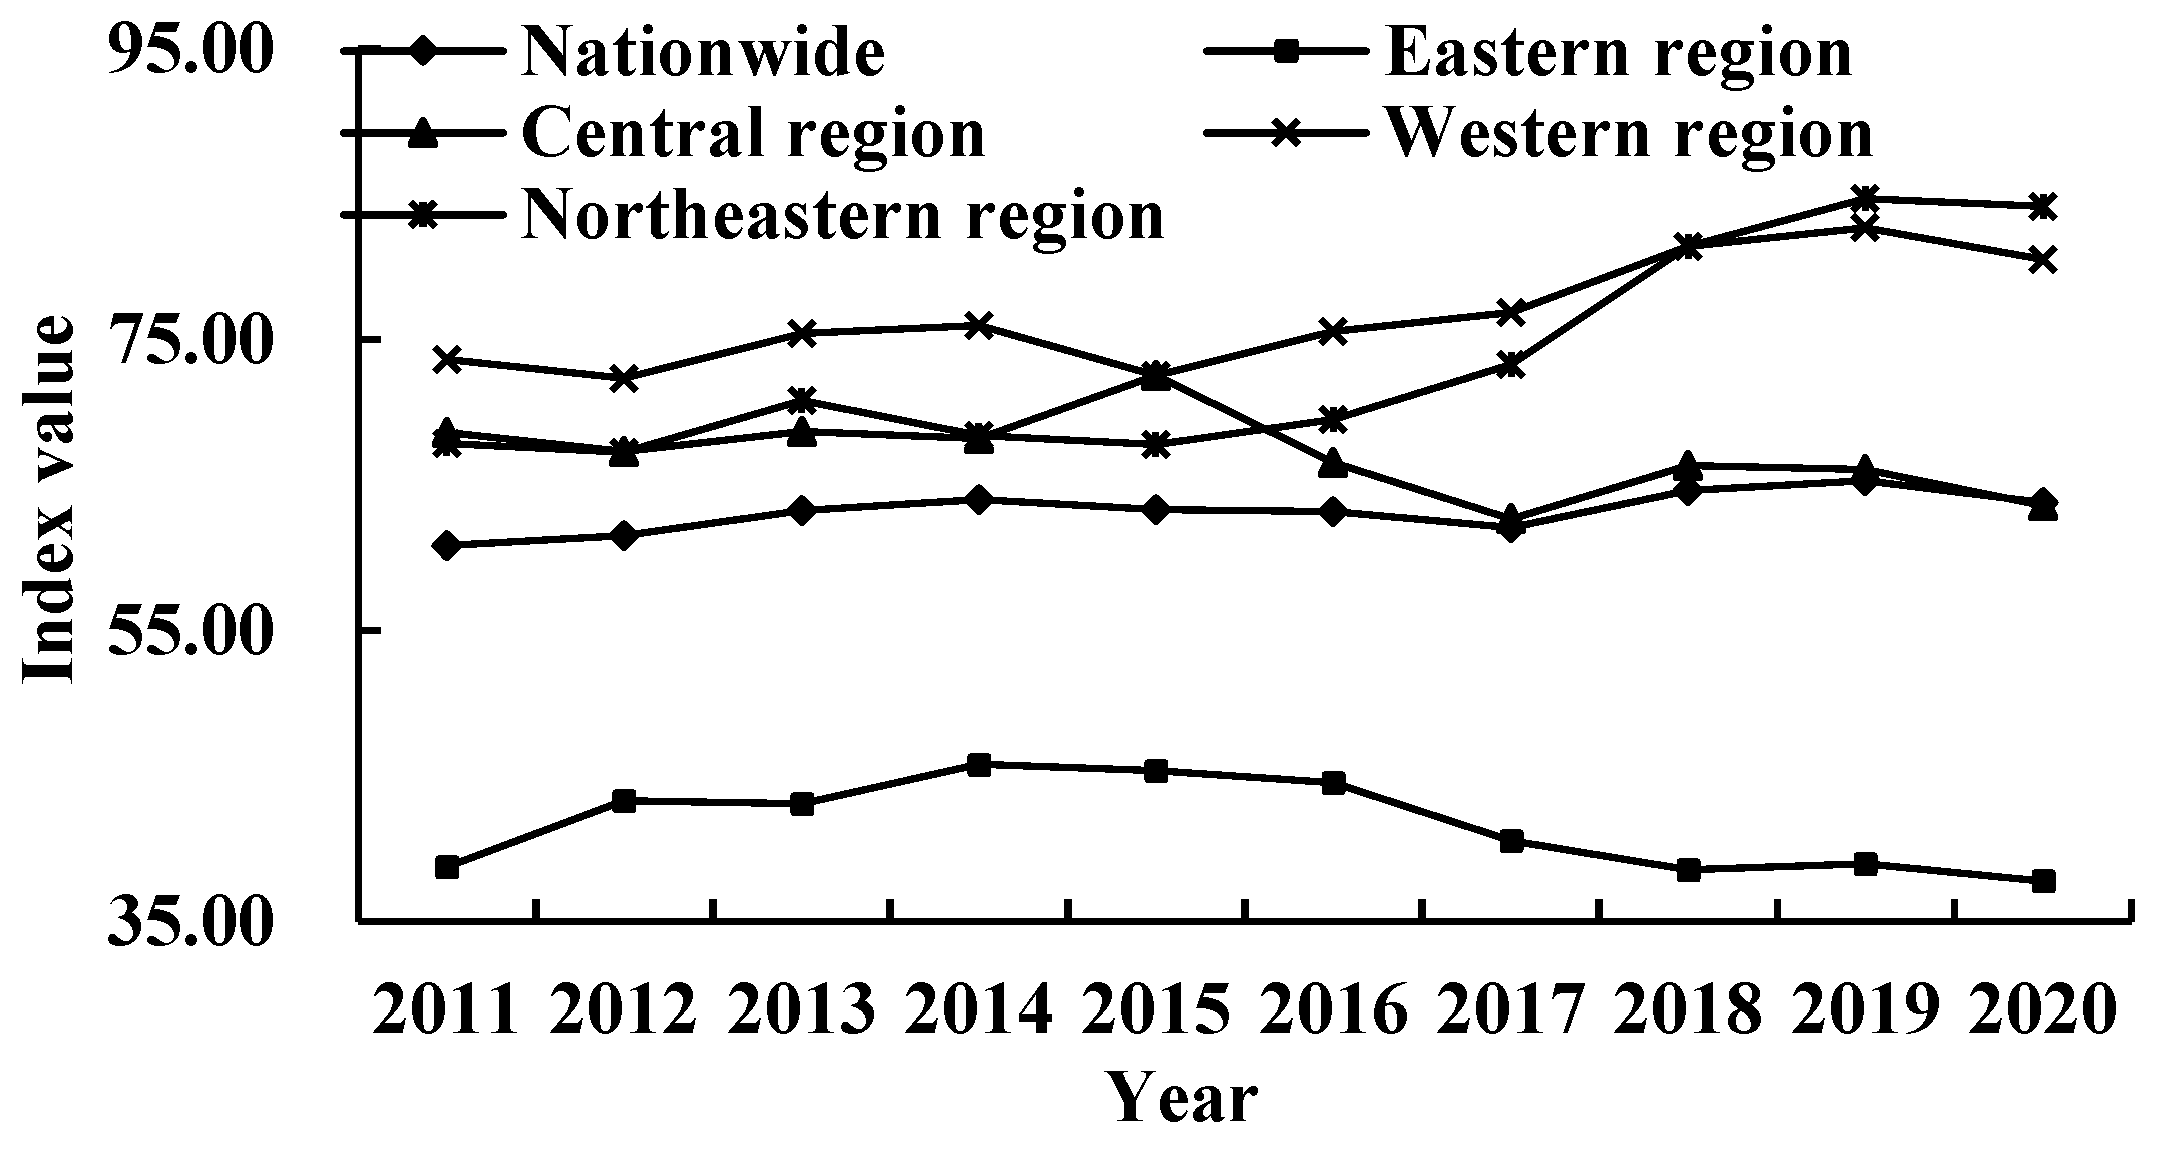
Figure 8.
The structural contribution to the insufficiency of China and the four major regions.
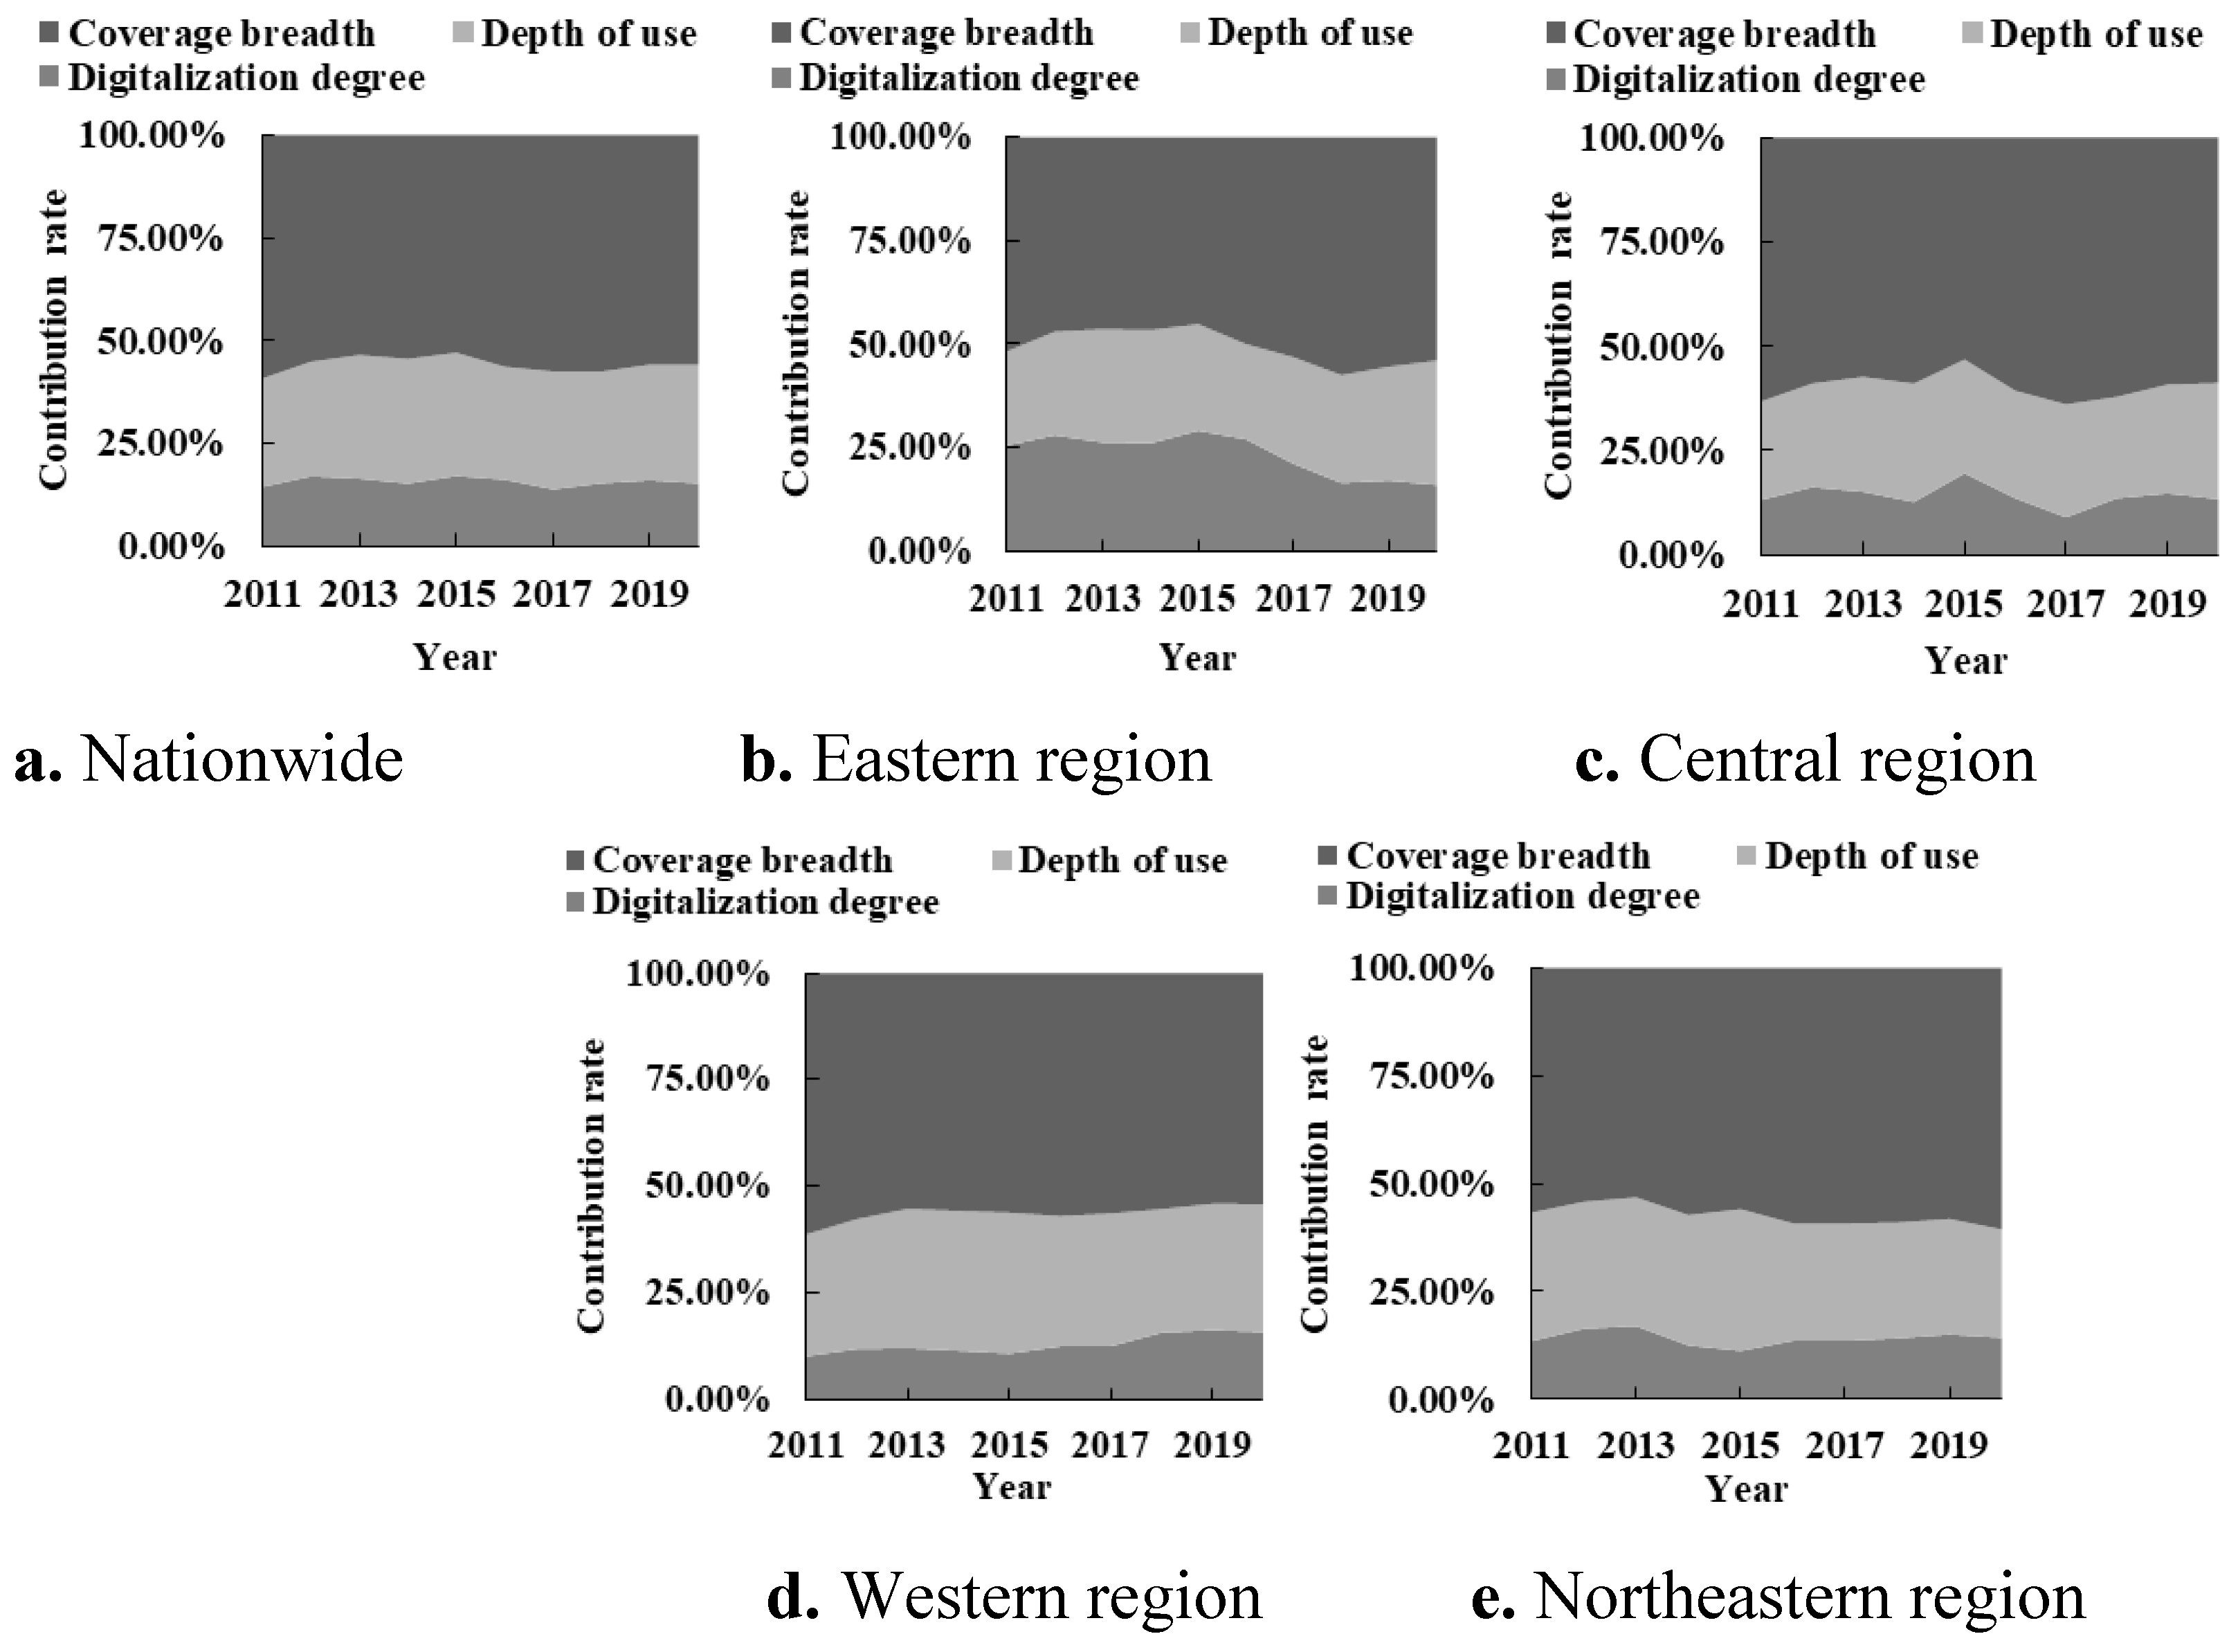

Table 1.
Judgment matrix of depth of use.
| Payment | Insurance | Credit | |
|---|---|---|---|
| Payment | 1 | 1/2 | 1/3 |
| Insurance | 2 | 1 | 1/2 |
| Credit | 3 | 2 | 1 |
Table 2.
Revised digital financial inclusion evaluation indicators and weights.
| Level 1 dimension | Level 2 dimension | Indicator | |
|---|---|---|---|
| Coverage breadth 0.540 |
Account coverage rate 1.000 |
Number of Alipay accounts owned by per 10000 people | |
| Proportion of Alipay users who have bank cards bound to their Alipay accounts | |||
| Average number of bank cards bound to each Alipay account | |||
| Depth of use 0.297 |
Payment 0.163 |
Number of payments per capita | |
| Amount of payments per capita | |||
| Proportion of number of high frequency active users (50 times or more each year) to number of users with frequency of once or more each year | |||
| Credit 0.540 |
Individual user | Number of users with an Internet loan for con-sumption per 10000 adult Alipay users | |
| Number of loans per capita | |||
| Total Amount of loan per capita | |||
| Small & Micro Business | Number of users with an Internet loan for small & micro businesses per 10000 adult Alipay users | ||
| Number of loans per small & micro business | |||
| Average amount of loan among small & micro businesses | |||
| Insurance 0.297 |
Number of insured users per 10000 Alipay users | ||
| Number of insurance policies per capita | |||
| Average insurance amount per capita | |||
| Digitalization degree 0.163 | Mobility 0.497 |
Proportion of the number of mobile payments | |
| Proportion of total amount of mobile payments | |||
| Affordability 0.248 |
Average loan interest rate for small & micro businesses | ||
| Average loan interest rate for Individuals | |||
| Credit 0.095 |
Proportion of number of Ant Check Later payments | ||
| Proportion of total amount Ant Check Later payment | |||
| Proportion of number of ‘Zhima Credit as deposit’ case (to number of full-deposit cases) | |||
| Proportion of total amount of ‘Zhima Credit as deposit’ (to amount of full-deposit) | |||
| Convenience 0.160 |
Proportion of number of QR-code payments by users | ||
| Proportion of as above, please clarify with ‘average amount’ or ‘total amount’ of QR-code payments by users | |||
Table 3.
Traditional Markov transfer matrix for digital financial inclusion in the Chian and four major regions.
Table 3.
Traditional Markov transfer matrix for digital financial inclusion in the Chian and four major regions.
| Region | t / t + 1 | L | ML | MH | H |
|---|---|---|---|---|---|
| Nationwide | L | 0.8400 | 0.0238 | 0 | 0 |
| ML | 0.0400 | 0.8333 | 0.0140 | 0 | |
| MH | 0 | 0.0714 | 0.7483 | 0.1600 | |
| H | 0 | 0 | 0.1678 | 0.6900 | |
| Eastern region | L | 0.6818 | 0.1379 | 0 | 0 |
| ML | 0.1818 | 0.5862 | 0.1250 | 0 | |
| MH | 0 | 0.1724 | 0.7188 | 0.1765 | |
| H | 0 | 0 | 0.0625 | 0.7647 | |
| Central region | L | 0.8000 | 0.1000 | 0 | 0 |
| ML | 0 | 0.7000 | 0.0909 | 0 | |
| MH | 0 | 0 | 0.5455 | 0.2609 | |
| H | 0 | 0 | 0.3182 | 0.6522 | |
| Western region | L | 0.7027 | 0.1786 | 0.0556 | 0 |
| ML | 0.1351 | 0.5000 | 0.1667 | 0 | |
| MH | 0.0811 | 0.2500 | 0.4167 | 0.3158 | |
| H | 0.0270 | 0 | 0.2222 | 0.5263 | |
| Northeastern region | L | 0.8333 | 0 | 0 | 0 |
| ML | 0.1667 | 0.2000 | 0.1538 | 0 | |
| MH | 0 | 0.8000 | 0.6154 | 0 | |
| H | 0 | 0 | 0.1538 | 0.6667 |
Note: L: low-level provinces; ML: medium and low level provinces; MH: medium and high level provinces; H: high-level provinces.
Disclaimer/Publisher’s Note: The statements, opinions and data contained in all publications are solely those of the individual author(s) and contributor(s) and not of MDPI and/or the editor(s). MDPI and/or the editor(s) disclaim responsibility for any injury to people or property resulting from any ideas, methods, instructions or products referred to in the content. |
© 2023 by the authors. Licensee MDPI, Basel, Switzerland. This article is an open access article distributed under the terms and conditions of the Creative Commons Attribution (CC BY) license (http://creativecommons.org/licenses/by/4.0/).
Copyright: This open access article is published under a Creative Commons CC BY 4.0 license, which permit the free download, distribution, and reuse, provided that the author and preprint are cited in any reuse.


