Submitted:
25 May 2023
Posted:
26 May 2023
You are already at the latest version
Abstract
Automatic milking systems (AMSs) are among the earliest Precision Livestock Farming developments that have transformed dairy farming worldwide. This review aims to gather, evaluate, and summarize papers that focus on the use of modeling approaches in the context of AMS. We provided a review of 60 articles with a specific focus on cows’ health, production, and behavior/management. The most used modeling approach was Machine Learning (ML, present in 63% of the studies), followed by statistical analysis (14%), fuzzy algorithms (9%), deterministic mod-els (7%), and detection algorithms (7%). Most of the reviewed studies (82%) focused on the detection of cows' health, specifically mastitis, while only 11% were concerned with milk production. Accurate forecasting of dairy cow milk yield and knowledge on the deviation between expected and observed milk yields of individual cows would be beneficial in dairy cow management. Likewise, the study of cows’ behavior and the herd management in AMSs is under-explored (7%). Despite the increasing use of ML techniques in this field there is still a lack of a robust methodology for their application. In particular, we identified a significant gap in the systematic balancing of positive and negative classes for health prediction models.
Keywords:
Dairy cows
; Automatic Milking System
; algorithms
; modeling approaches
; statistical analyses
; Machine Learning
; mastitis detection
; milk production
; cows’ behavior
1. Introduction
The introduction of automated milking systems (AMSs), or milking robots, in the early 1990s represented one of the major headways in dairy farming techniques. Automatic milking is based on cows’ voluntary visits to the robot, so that cows are no longer brought to the milking parlor 2 or 3 times daily by human handlers. Animals are free to go to milking at any time on a daily basis as well as to dynamically change intervals between milking throughout the lactation period [1]. The process of AMS is fully mechanized, and it has relieved the farmers from a significant amount of labor by improving their quality of work and their lifestyle. AMS has the potential to increase milk production in cows as they can be milked up to three times a day, compared to twice-daily milking in conventional systems. Studies have shown an increase in milk production ranging from 3% to 25% with the use of AMS [2]. The increased frequency of the number of milkings also reduces the external udder pressure when lying whilst at the same time reducing stress on the udder ligaments, thus increasing the comfort of the animal [3].
During each milking, automatic sensors allow monitoring of the udder health and the milk quality by providing detailed information about each cow, which was not easily obtained with previous conventional systems [4]. Moreover, the cows may benefit from the freedom to control their physical activity, and to reduce potential stress at the time of milking avoiding gathering and crowding phenomena usually present in conventional parlors [5]. Therefore, the adoption of AMS has grown significantly worldwide with an estimated 50,000 units on 25,000 farms in operation in 2019 [6]. The implementation of AMS technology not only provides milk quantity and quality data but also presents an opportunity to study cow behavior and welfare in a system that is managed differently from traditional milking. The introduction of AMS has altered the daily rhythms and behavior of cows throughout their lactation cycle, making it important to consider both AMS efficiency and animal welfare. Despite the large amount of data collected in AMS-equipped farms, there is still a significant potential for herd characterization and management optimization that remains largely unexplored [7].
However, the impressive increase of newly available data, precious for researchers, could become too complex for farmers, running the risk of having little feedback in daily farm management. This is included by the phenomenon of “Big Data'', i.e., massive volumes of data with a wide variety that can be analyzed and used for decision-making [8]. Improving data integration is crucial to fully utilize the vast amount of data and make the resulting information easily accessible to farmers [9]. However, the complex and nonlinear relationships hidden within large and often redundant data are hard to unravel using traditional statistical models [10]. Machine Learning (ML) is a subfield of Artificial Intelligence that uses complex algorithms and complementary data modeling techniques to those used in traditional statistics [11]. One of the key benefits of using machine learning (ML) techniques is that they can effectively identify meaningful relationships within large, complex, and often redundant datasets from multiple sources. In general, ML methods involve a learning process where the model learns to perform a task by analyzing and processing a set of training data. Over time, the performance of the ML model is continuously improved by refining the model's learning algorithm to better analyze and interpret the data. ML approaches are often referred to as data-driven since the algorithms rely on learning from the data. They can provide more accurate results than traditional statistical approaches, which may be influenced by the researcher's preconceptions or hypotheses [9]. Recently, ML techniques have been applied to Precision Livestock Farming (PLF) [12], with applications in livestock management and productivity e.g., [13,14], animal behavior and welfare e.g., [15,16]. In the dairy sector, ML methods are being used for various tasks, such as estrus detection [13,17], heat stress severity evaluation [18,19], and social interaction tracking [20]. Although AMS systems have become increasingly popular in dairy farming, there remains a lack of understanding regarding the specific algorithms used, the challenges faced, and the problems addressed by applying ML techniques to the data collected from the milking robot sensors and other sensors in AMS-equipped farms.
Driven by the rapid progress of ML, its growing popularity worldwide, and its potential impact on PLF, we present a literature review on modeling approaches, including ML, using data from farms equipped with AMS for the analysis of animal health, production, behavior, and management. It is anticipated that the dairy farm sector will continue to see the increasing adoption of ML in future, and the results of this review will guide and help the researchers and the practitioners on how the adoption of ML could support the monitoring of dairy cows in AMS. The remainder of this review is structured as follows. The second section introduces the review methodology, including the database and keywords used in literature retrieval, as well as the search results. The third section briefly describes the most widely used ML techniques and its main performance metrics. The fourth section shows an overview of the works related to modeling and AMS in the field of health, behavior, and production. In the last section, the review concludes with future research directions according to our analysis of the previous studies.
2. Review Methodology and Results
The articles contained in this review were mainly from the Web of Science and Google Scholar websites. The keywords used to determine appropriate scientific articles mainly include the following categories: “Machine Learning”, “Artificial Intelligence”, “modeling approaches”, “Automatic Milking Systems” (or “milking robots”), and “Precision Livestock Farming” (or “Precision Dairy Farming”), both abbreviations and full names. In addition to the search of keywords, we also paid attention to the cited references in the published literature. These articles also met the search scope. The published time of the selected literature in this work was restricted to the last 22 years, i.e., from 2000 to 2022. Finally, we selected and thoroughly reviewed 60 publications from the retrieved results. In addition, we also consulted other relevant articles and supporting literature, including other reviews, to provide comprehensive insights. Indeed, due to the broad range of applications of ML in PLF, several reviews have been published in this research field e.g., [12] and in particular on dairy farming [21,22]. The selected 60 studies were classified into the three generic categories: health, production, and behavior/management. Most of the studies were intended for the detection of cows' health problems (82%), in particular mastitis; 7% of the papers focused on cows’ behavior/management and 11% focused on milk production.
The 60 articles included in the review are summarized in Table S1 (Supplementary materials), which provides information on the application domain, the addressed problems, the modeling techniques used in the analyses, the datasets, and the list of variables used. Figure 1 illustrates the geographical distribution of the contributing studies in modeling approaches in farms equipped with AMS, considering the location of the dataset collection. It is noteworthy that investigations into modeling approaches in AMS are not distributed worldwide, with most studies originating from European countries (71%). This reflects the distribution of milking robots in farms, which are not yet widely present in developing countries.
Figure 2 displays the temporal trend of the number of publications from 2000 to 2022. The number of publications showed a peak in 2010, and it increased slowly in the last few years, starting from 2015.
3. Machine Learning Algorithms and Performance Metrics
ML is a subfield of Artificial Intelligence that enables computers to learn from data without being explicitly programmed [23]. It comprises a diverse set of algorithms, each with distinct objectives and learning strategies. According to the type of learning, ML methods can be grouped into three primary categories: supervised, unsupervised, and reinforcement.
In supervised learning, a predictive model is developed using the labeled data with the prior knowledge of the input and the desired output [24]. The goal of the supervised learning approach is to produce an inferred function that can be utilized for mapping new observations based on a set of training examples [25]. Thus, supervised ML algorithms are those which need external assistance. The input and the output are known, and the algorithms try to find the optimal way to reach an output given its input. This task is carried out in two phases. The first phase consists of the training phase where a collection of data samples is used to build or improve a computer model by learning from inherent structure and relationships within the data. The second phase consists of applying this computer model to new unseen observations to predict certain properties of these new samples. The overall goal of a supervised ML method is to generalize from a few training examples to make accurate predictions on large sets of data samples that were not observed during training [26]. The generalization ability of the algorithm is monitored by partitioning the data. The dataset is split into two sets: the training and the test sets. The former is used on the algorithm optimization task. So, the performance of the algorithm assessed with this subset measures how much the algorithm was able to learn from the data. The latter is not seen by the algorithm during the learning phase. It is used to assess the performance of the algorithm on unseen data, which gives an assessment of the generalization ability of the algorithm. If the performance on the training set is good, but it is not on the test set, it means that the algorithm works only on training data, but not on new instances. In most of the cases, this kind of algorithm would result useless. The partitioning can be made fully at random or through a technique called k-fold cross validation. In this case, the data is split in k folds and the model is fitted with all but one of the folds. The left-out fold is used as the test set. Then the process is repeated k times, each time with a different fold being used as the test set. Thus, it is guaranteed that all data points are used both in train and in test sets.
Unsupervised learning generally involves the analysis of unlabeled data under assumptions about structural properties of the data without prior knowledge of the input and output variables [24,27] These are called unsupervised learning because, unlike supervised learning, no labels are provided, and the algorithms discover and present the structure in the data.
Reinforcement learning is the problem faced by an agent that learns behavior through trial-and-error interactions with a dynamic environment [28]. The information available in the training data provides an indication as to whether an action is correct or not [27], instead of indicating the correct output for a given input. Reinforcement learning algorithms are used, for example, for real-time decision making and robot navigation [24]. Figure 3 provides an overview of the different types of supervised and unsupervised ML problems categorized by the data type (discrete or continuous) and grouped into four main classes: classification, clustering, regression, and dimensionality reduction based on their learning styles.
The main difference between ML and the traditional statistical data analysis and deterministic modeling is that statistical and deterministic models work under the assumption of a hypothesis, mathematically represented by a model, to be analyzed or fitted based on the data. In ML, the algorithm itself is in charge of finding this model [29]. Simply put, statistical and deterministic analysis are model-driven. The former is based on a model-family that should be fitted to define the specific model instance that represents the data. The latter is based on a dynamic model that mathematically represents the rules that operate in the system, and the mathematical behavior of this model is studied. On the other hand, ML is data-driven, the algorithm rules are set to find the specific model that better fits the training data, but this model does not have any predefined form. However, in literature this distinction is not always considered, and many articles consider statistical techniques as ML analysis.
In this review, we have included articles that used deterministic models, statistical analysis, and both supervised and unsupervised ML algorithms, while no work selected used reinforcement learning. Table 1 provides a summary of prominent supervised and unsupervised modeling techniques mentioned in this review.
Performance metrics are essential for evaluating the effectiveness of a model, but the choice of metric can significantly impact the importance placed on different aspects of a model's performance. Therefore, selecting an appropriate performance metric is crucial for accurately assessing modeling performance [40]. In the context of classification algorithms, the confusion matrix constitutes one of the most intuitive metrics towards finding the correctness of a model. For binary classification modeling, the confusion matrix is a 2x2 table having two dimensions, namely “Actual” and “Predicted”, and its values are the outcomes of the comparison between the predictions with the actual class label (Figure 4).
True Positives (TP) represent the total number of data points that have been correctly predicted as positive examples and True Negative (TN) represent the total number of data points that have been correctly predicted as negative examples. On the other hand, False Positives (FP) represent the total number of data points that have been predicted as positive examples when they were actually negative, while False Negatives (FN) represent the total number of data points that have been predicted as negative examples when they were actually positive. The aforementioned values can be implemented to estimate several performance metrics (Table 2).
In addition to these measures, the Receiver Operating Characteristic (ROC) curve is also used to evaluate the performance of a classifier. Figure 5 gives an example of this curve. It is a plot of the TP rate versus the FP rate.
Each point on this curve is the combination of TP and FP rates for a given value of the threshold used by the classifier to separate the classes. A robust classifier is expected to not increase the FP rate if the TP rate increases and vice-versa. On the other hand, a random classifier will directly increase the FP rate with the increase of the TP rate, as indicated by the dashed gray line in the plot. The ROC curve visually helps in analyzing the balance between these rates, since how close to the top-left corner is the plot, the more robust is the classifier. The Area Under the ROC (AUR) curve gives a value of the quality of the classifier and it is especially useful when comparing two or more classifiers.
4. Application of Modeling Approaches in AMS
4.1. Health
4.1.1. Mastitis
Modeling tools have been widely used in predicting mastitis based on data from AMS, proving useful in addressing the economic losses and welfare concerns associated with this disease in the dairy industry. Mastitis is a condition of significant concern as it leads to a loss of milk production, reduction in milk quality, and decreased cow welfare [41]. Detecting mastitis in its early stages is crucial for improving both milk production and cow welfare. This disease can present in clinical or subclinical forms, with the latter being up to 40 times more common than the former [42]. Subclinical mastitis is more difficult to detect than its clinical form as clinical signs are not evident in the infected cow. This form, in fact, may result unnoticed because no gross sign of inflammation or gross changes in milk composition is observed. Therefore, timely detection of subclinical mastitis is very important to initiate proper treatment, control, and preventive measures. With the introduction of AMS in farms, the identification of udder infections is no longer established through direct visual observation, and the control of the health status is based on sensor measurements [43]. Several studies evaluated the performance of automated mastitis detection systems with respect to their practical value for the farmers and investigated the systems specificity and sensitivity. Aspects of milking machine design and performance are addressed in standards issued by the International Standards Organization (ISO). The International Standard ISO/FDIS 20966 describes a minimum sensitivity of 80% combined with specificity higher than 99% as requirements for a reliable mastitis detection system [44], but these recommendations are still under discussion.
Variables Used to Detect Mastitis
Milking robots can collect various data during milking, including milking time, milk yield, Electrical Conductivity (EC), Somatic Cell Count (SCC), and milk components. Therefore, there is an opportunity to integrate these measurements in disease detection models for mastitis. Identifying the most effective variables for the detection of clinical and subclinical mastitis is of paramount importance. SCC, which reflects the inflammatory status of the mammary gland, is historically the most used predictor of mastitis, and it is an indicator of both resistance and susceptibility of cows to mastitis [45]. Typically, a level of 200,000 cells/mL of SCC is considered the threshold to identify subclinical mastitis [46]. However, when the SCC is very low (below 50,000 cells/mL), the Differential Somatic Cell Count (DSCC) (i.e., the ratio of neutrophils and lymphocytes) is a useful tool to improve the identification of the mammary gland status of dairy cows [47]. At the same time, the SCC day-test used for mastitis surveillance, gives data that fluctuate widely between days, creating doubts on its reliability [48].
Therefore, the combined use of different indirect indicators of mastitis could be more successful to detect the disease. Other detection systems are based on testing the EC of milk. EC is an indicator of ionic changes as a consequence into the milk that occurs during mastitis. Norberg et al. [49] observed that EC of milk may be an important trait that can be used in detection of mastitis, because cows that suffer from that disease are characterized by an increased conductivity of their milk. These authors applied a Generalized Linear Model to distinguish between healthy and unhealthy cows based on EC. Their results indicated that cows with mastitis may not always show an increased EC, nevertheless the variation in EC of milk from infected quarters may be larger than variation in EC of milk from healthy quarters. The results of this study showed that EC has poor diagnostic test properties for the detection of subclinical mastitis. In fact, the accuracy for clinical cases was 80.6%, while the accuracy for subclinical cases reached only 45% [49]. Later studies demonstrated that the combination of EC and SCC improved detection of subclinical mastitis in detection algorithms [50,51]. Using EC and SCC information, a Fuzzy Logic algorithm produced a 2- to 3-fold increase in the success rate (i.e., positive predictive value) and a 2- to 3-fold decrease in the false alert rate, compared to the use of EC alone [50]. Additionally, quarter-level (i.e., every quarter of each cow was considered as an independent unit) SCC assessment results in higher sensitivity and specificity than does cow-level assessment, even when combined with EC measurement [50,51]. In agreement with these studies, [52] also achieved poor mastitis detection results with the use of EC alone. The authors tested four different detection methods, namely: threshold of EC, creation of indexes ad hoc and control chart of cumulative sum applied directly to EC data and to the residuals of a Linear Mixed Model with lactation and parity as fixed effects and the cow and quarter as random effects. Since the model was unable to achieve the ISO standard sensitivity (>80%) and specificity (>99%), the authors suggested that improvements can be achieved by using other parameters, such as milk yield, milk flow, and composition analysis, to increase the method's accuracy and thereby improving the utility of mastitis detection systems. Sun et al. [53] used the combination of EC and quarter milk yield to detect clinical mastitis, by the application of two types of Neural Networks (NN), Multilayer Perceptron (MLP) and Self-Organizing Map (SOM). The MLP model achieved 91% of sensitivity and 87% of specificity when using data transformed by Principal Component Analysis. The SOM, using K-means as clustering algorithm, revealed three clusters that reflected the stage of progression of mastitis in a quarter: healthy, moderately ill, and severely ill. Other parameters such as milk color and milk yield are associated with SCC and EC to classify abnormal milk, often caused by clinical mastitis [42]. In a study by Hovinen et al. [54] milk color was used for the detection of mastitis in addition to the EC. Their findings showed that specificity for EC was quite high, but the false alert rate was also high. In 11 out of 17 cases, clinical mastitis was detected during a 6-days period before clinical signs were detected. Five of those were detected solely based on milk color and not on EC. We can conclude that milk color added value to the detection system. In agreement with these results, Kamphuis et al. [55] suggested that mastitis detection performance might be improved by combining different predictive variable types, including milk colors and milk production. They found that green and blue colors were the best indicators for both abnormal milk and clinical mastitis [55]. However, in a study conducted by Altay et al. [56] on two breeds of dairy cows (Holstein and Brown Swiss), a Logistic Regression model showed that only SCC and EC were effective variables on mastitis detection, but not other variables, including the milk color.
Alternative markers such as Lactate Dehydrogenase (LDH) have been proposed as markers for early mastitis detection and diagnosis [57,58,59]. The LDH enzyme is found in the cytoplasm of all cells in the body, and during an inflammatory process involving cell damage and breakdown as observed during mastitis, it is released from the cells into the milk [60]. In dairy milk, LDH is correlated with SCC [61]. Chagunda et al. [57] developed a dynamic deterministic model using LDH as the main indicator measured in milk and obtained a sensitivity and specificity for detecting clinical mastitis at a level of 82% and 99%, respectively. In their study, healthy cows were defined as having no veterinary treatment within the incurrent lactation period and a SCC <100,000 cells/mL, and the additional factors incorporated in the model are days from calving, breed, parity, milk yield, udder characteristics, other disease records, EC, and herd characteristics. As biosensor assays for enzymes like LDH in milk are now becoming available, they provide an opportunity for automated, real-time mastitis detection. Friggens et al. [58] successfully tested the mastitis risk model by Chagunda et al. [57] for individual cows based on LDH on a scale from 0 (completely healthy) to 1 (full-blown mastitis) for the early identification of acute mastitis cases (4 days before treatment). Ankinakatte et al. [59] also used LDH in addition to SCC and EC as indicators and evaluated the performance of NNs and Generalized Additive Models to predict mastitis. The study showed similar performance of the two models, even though the inclusion of SCC improved their predictive ability by > 5%, thus confirming the importance of this parameter in the detection of mastitis. Penry et al. [62] proposed as primary hypothesis that quarter peak milk flow rate was the variable associated with increased risk of clinical mastitis. They conducted a retrospective, case-control study using a Logistic Regression model, and included in the model five predictor variables besides to the peak milk flow rate, i.e., parity, quarter position, day in milk at diagnosis of clinical mastitis, udder milk yield, and milking interval. However, only the milking interval, but not quarter peak milk flow rate was associated with risk of clinical mastitis.
More recently, Naqvi et al. [63,64] developed a Recurrent Neural Network model for the detection of clinical mastitis by comparing numerous subsets of variables to determine their importance and impact on model performance. They integrated several variables that are regularly measured on AMS farms (including milk and behavioral characteristics, cow traits and farm-level/environmental variables) but have typically been excluded from mastitis detection models. Their results showed that SCC, the variance in the milk intervals observed during the day, and milk temperature were identified as the three most important variables defined by their impact on model predictions. Interestingly, eight of the top twenty variables were behavioral measurements (such as activity, rumination, milking duration), suggesting they can play a role in the detection of mastitis. The significance of SCC as a crucial mastitis indicator was showcased in a study by Bonestroo et al. [65], which designed a prediction model utilizing gradient-boosting trees to detect subclinical mastitis. The model accurately predicted whether SCC would decrease below the 200,000 SCC/ml threshold within 50 days after an initial increase in SCC, using 30 days of sensor data. However, reducing the input requirement from 30 days to 15 days had a minimal effect on the model's performance.
Mastitis Alert List
Dairy farmers using an AMS often complain about the high number of false positive (FP) alerts on the mastitis alert lists. These alerts can lead to overestimation of the number of animals diagnosed and treated for mastitis, which is a concern for both animal welfare and production losses. Therefore, reducing the number of FP alerts is crucial for improving the specificity of the system, particularly when milk is automatically separated. As suggested by Mollenhorst et al. [66], an ideal monitoring system would produce a low number of false alerts while alerting with emphasis on the more severe cases and in a timely manner (a maximum 24 hours before onset of the disease as desirable). A detection model that includes Time Series regression models for two variables (milk yield and EC) was used to generate mastitis alerts [67]. In this study, the model outcomes (alerts for mastitis) were compared with actual occurrences of clinical mastitis. A case of mastitis was classified as true positive (TP) if one or more alerts were given in a defined period around the recorded date of an observed case, otherwise the case was false negative (FN). Applying the Time Series models led to a better performance of AMS in mastitis detection by reduction of the number of FP alerts. Similarly, the application of Fuzzy Logic gave an important improvement in decreasing the number of FP test results [68]. With a Fuzzy Logic model for classifying alerts of clinical mastitis as true or false, the number of FP alerts could be reduced. De Mol and Woldt [68] detected which animal was infected with mastitis based on traits for each cow and the model achieved a sensitivity of 100% and a specificity higher than 99%, the FP were reduced with 95% while the number of TP alerts remained at the same level [68]. This improvement is certainly beneficial for herd management support. More recently, Khamaysa Hajaya et al. [69] proposed a NN to build a mastitis detection model. The model achieved a specificity of 99%, and sensitivity of 97%, demonstrating that, with this high specificity, and a relatively high sensitivity, the model could reduce the problem of FP alerts.
Combining the probability of clinical mastitis based on AMS sensor measurements with non-AMS cow information was proposed as a way to improve disease detection [70]. The authors presented a method in which a previous probability of clinical mastitis (based on parity, DIM, season, SCC history and clinical mastitis history) was combined with the test characteristics (sensitivity and specificity) of the AMS detection system to discriminate between alerts. A Tree-augmented Naíve Bayesian Network was trained from available data to determine cow-specific prior probabilities for clinical mastitis. Results showed a similar specificity and sensitivity of the system when different types of information were included or with the AMS-alerts only. Moreover, in this study the additional value of non-AMS cow information to discriminate between TP alerts and FP alerts was not specifically investigated. Steeneveld et al. [44] used a Naíve Bayesian Network as a successful method (70% sensitivity and 97.8% specificity) for discriminating between TP and FP alarms in the detection of clinical mastitis. This study reported a minor effect of using non-AMS cow information on making a distinction between TP and FP mastitis alerts. Thus, according to the authors, the use of additional non-AMS data did not add much to the detection performance of sensor systems. Nevertheless, the effect of combination AMS sensor data and other cow information on FP needs to be further investigated. Kamphuis et al. [71,72] used EC, milk production, dead milking time, and milk flow with a Random Forest (RF) algorithm for clinical mastitis detection. RF are ensembles of Decision Trees (DT), which were created with Bagging and Boosting. Bagging consists in creating different DT for different Bootstrap samples of the dataset. The final model outcome was the average of all models. Boosting consists in creating different DT classifiers sequentially in such a way that the next model gives more weight to the instances that were incorrectly classified by the previous classifier. Both studies achieved a high specificity but a low sensitivity for clinical mastitis, using a narrow timeframe, and they concluded that RF made it possible to decrease the number of FP alerts by more than 50%. However, increasing the length of the time window significantly improves the apparent sensitivity and specificity of detection systems. The authors demonstrated that increasing the length of the time window significantly affects performance indicators: using a 24-h time window preceding the occurrence of a clinical mastitis episode resulted in a sensitivity of 40% at a specificity of 99%. Increasing the time window to 96-h preceding the occurrence until 72-h after the occurrence of a clinical mastitis episode increased sensitivity to 75% at the same specificity level of 99% [72]. Bausewein et al. [73] recently identified parameters that could enhance the sensitivity and specificity of AMS alerts when analyzed by farmers after each milking. The study also revealed minor variations in mastitis alerts among manufacturers, likely attributable to differences in sensor technology and proprietary algorithms.
Mastitis Indicators
Mastitis infection has traditionally been viewed as a dichotomous quantity (healthy vs. sick). This could be convenient from the point of view of clinical treatment and of measuring the efficacy of treatments with respect to clinical symptoms. However, this does not reflect the real development of the infection. It might be useful to get away from a binary mastitis variable and to go to a continuous mastitis variable. Some authors introduced the measure of Degree of Infection (DOI), i.e., not a dichotomous quantity but a continuous varying quantity [58,74]. Friggens et al. [58] tested a dynamic deterministic model to detect the DOI on a scale from 0 (completely healthy) to 1 (full-blown mastitis) for the early identification of acute mastitis cases by using continuous analysis data of SCC in comparison to levels of LDH in cow milk. Their model, mainly based on LHD measurements, was able to detect significant differences between cows with mastitis (mastitis risk 0.12) and healthy cows four days before treatment. Later, Højsgaard and Friggens [74] demonstrated that by combining a panel of measures reflecting different aspects of mastitis (EC, SCC, LDH) it is possible to derive a DOI measure that is a considerable improvement in precision relative to binary healthy/sick type classifications of health status. An Elevated Mastitis Risk (EMR) indicator to detect cases of clinical mastitis was proposed by Sørensen et al. [75] This EMR indicator is a continuous variable (from 0 to 1), where values close to 0 indicate a low risk of mastitis and higher values, approaching 1, indicate an increased risk of clinical mastitis [75]. The estimated EMR values were used to issue 2 types of alerts, new and on-going intramammary infection alerts. The algorithm developed by the authors yielded a high specificity of 99%, but a low sensitivity: between 28% and 43% when reporting new mastitis cases, and between 55% and 89% when indicating on-going intramammary infections.
Comparison Between Modeling Approaches to Detect Mastitis
Comparing the performance of different modeling techniques for mastitis detection is challenging due to differences in mastitis definition and data properties. However, comparing studies that used different models on the same dataset is possible. Ideally, the studies should also use the same data partitioning, but this is not always the case. Therefore, a comparison of different models is presented here, highlighting the data partitioning used in each study. Cavero et al. [43,76] used a dataset of 403,537 milkings involving 478 cows to develop classification models for early mastitis detection, and in both studies, mastitis was determined according to udder treatments or SCC. Cavero et al. [43] developed a model that incorporated EC, milk yield, and milk flow rate. They applied a Fuzzy Logic classification model to aid decision-making that classified results as indicating mastitis, different degrees of likelihood for mastitis, or no mastitis. The authors trained the model with two thirds of the data and left the remaining third for test data. They evaluated the model according to sensitivity, specificity and error ratio and reported that the specificity of mastitis diagnosis changes between 75.8% and 93.9% and the error ratio varies from 41.9 % to 95.5 % when the sensitivity ratio is at least 80%. In the later research, Cavero et al. [76] constructed their classification system by application of NN using the following variables: EC, milk yield, milk flow and days in milk. Four different NN were used, trained with the backpropagation algorithm, and containing one neuron in the output layer (presence or absence of mastitis). The model was trained with a 5-fold cross validation data partitioning. Mastitis cases were correctly identified between 51.3% and 80.5%, however the results were inferior in comparison with those obtained in the previous study. In particular, in [43] specificity and error rate obtained with Fuzzy Logic were found to be better compared to the estimates in Cavero et al. [76] through the use of NNs. The same results were obtained by Krieter et al. [77] that used this same dataset to investigate the usefulness of NN in the early detection and control of mastitis. The only difference to Cavero et al. [76] is that they used a different data partitioning, with 80% of data records for the training set and 20% for the test set without the cross validation. The specificity and error rate obtained with Fuzzy Logic [43] could be found to be better compared to the estimates obtained from the Krieter et al. [77]. Mammadova and Keskin [78,79,80] detected the presence of subclinical mastitis applying four different ML algorithms (NN, Adaptive Neuro Fuzzy Inference System, Fuzzy Logic, Support Vector Machine - SVM) on the same dataset. They used four different data partitions: 90%, 75%, 70% and 60% of the data for the training set and the remaining data for the test set. The overall result presented by the authors is the average of these 4 data partitioning solutions. Mastitis alerts were generated with the input data of lactation rank (current lactation number), milk yield, EC, average milking duration and season. The SVM was the best model prediction of subclinical mastitis with sensitivity 89% and specificity 92%.
Predictions obtained using different modeling methods on data collected at different time points were reported by Ankinakatte et al. [57]. The authors evaluated the performance of NN and Generalized Additive Models (GAM) in terms of sensitivity and specificity. Similar results of 75% sensitivity and 80% specificity have been reported from NNs, and GAM, though their results showed that the performance of the GAM model was slightly better than that of the NNs depending on what input variables were used, and the inclusion of SCC improved the predictive ability of both models by > 5%. Also, Anglart et al. [81] reported GAM to be a good predictive method to detect cow composite SCC, instead of predicting the mastitis events, by using quarter and cow milk data regularly recorded in cows milked in an AMS in an 8-week trial. The authors evaluated three modeling methods (GAM, Random Forest, and Multi-layer Perceptron - MLP), all with the 5-fold cross-validation data partitioning and found GAM and MLP to be promising for udder health prediction. Ebrahimi et al. [82] applied several modeling techniques (NN, Naiíve Bayes, GLM, Logistic Regression, DT, Adaptive Boost - AdaBoost and Random Forest - RF) to determine the best model that could predict the risk of sub-clinical mastitis. Data from 364,249 milking instances were collected and milk volume, lactose concentration, EC, protein concentration, peak flow and milking time were analyzed using a 10-folds cross validation. Overall, they found a high sensitivity (>93%) of all employed models, demonstrating the high distinguishing power of these models in the reliable identification of sub-clinical mastitis. However, the general low specificity showed a lower power to identify healthy samples of the tested models. The study concluded that the AdaBoost algorithm provided the best accuracy of 84.9% from the former parameters, however the RF algorithms showed a similar level of accuracy (82.3%) [82]. Recently, a comparison study on ML methods was performed using data from both AMS and traditional milking parlor [47]. Eight different modeling methods (Linear Discriminant Analysis - LDA, Logistic Regression - LR, Naiíve Bayes, classification, and regression Decision Trees - DT, k-NN, SVM, RF and NN) were compared to predict subclinical mastitis based on SCC on a test set with 20% of the data observations. High specificity and the best precision were observed for SVM, LR and LDA. On the contrary, k-NN achieved the highest accuracy (> 94%) compared to RF, SVM, and AdaBoost models in a study conducted by Tian et al. [83] to detect clinical mastitis. However, the small dataset used in this study (60 cows, being 54 for training set) may not represent population characteristics of conditions induced by mastitis and it does not allow generalizations on the performance of the algorithms used. Interestingly, an open-source ML application was recently developed to predict the risk of mastitis [84]. To achieve this goal, 26 classification models were built without any hyperparameter tuning and using 80% of the data for the training phase. The best performing model proved to be the RF model and it was, then, tuned with 10-fold cross validation. Its results were accuracy >98%, and sensitivity and specificity of 99.4% and 98.8%, respectively. The application could be integrated into AMS to detect the risk of mastitis in real time.
Presence of Mastitis Pathogens
Models that utilize milk parameters to detect the presence of mastitis-causing pathogens can provide valuable information for managing the disease. After consulting the mastitis alert lists, farmers must be aware of the causal pathogen to initiate an effective antimicrobial treatment [85]. Bacteria that cause mastitis can be grouped into contagious or environmental, gram-positive, or gram-negative, or major and minor pathogens. Hassan et al. [86] focused on using both unsupervised (USNN) and supervised (SNN) neural network models to detect small and large pathogens that cause bovine mastitis based on changes in milk parameters. They observed that SCC, protein percentage in milk, and EC showed to be the best predictors for major pathogen infections. SCC were also useful for differentiating minor pathogens of intra-mammary infections. Both USNN and SNN models were able to detect pathogen cases with a high degree of accuracy, with the USNN model providing a better overall result in terms of sensitivity (89% for minor pathogen, and 80% for major pathogen) and specificity (close to 99% for all bacteriological states). It was concluded that this model was better compatible with the results obtained from traditional microbiological methods. Bayesian Network (BN) were also used to identify the probability of occurrence of causal pathogens and associated risk factors. This technique uses the concept of conditional probability to find the relationships between risk event and disease [87], and it can help farmers in making management decisions, rather than only identifying the type of pathogens [88]. Steeneveld et al. [88] classified mastitis bacteria as gram-negative or gram-positive using data that could be made available in AMS and cow information (e.g., parity, lactation stage, and history of clinical mastitis). The accuracy of classifying clinical mastitis cases into gram-positive or gram-negative pathogens obtained by applying naïve BNs was 73%. In a later study, a Decision Tree model was used to predict the gram-status of clinical mastitis causal pathogens in conjunction with sensor information from the EC, milk color, and milk yield [85]. The authors failed to provide evidence to predict the gram status of causal pathogens when EC values were used for only one day, suggesting that considering the temporal pattern of the EC may be beneficial. In addition, the results of the study suggest the potential of using milk color as a causal pathogen detection or prediction tool [85]. Castro et al. [89] described the distribution of mastitis pathogens in milk samples collected from several farms and identified the operational reliability and sensibility of mastitis alerts using a classification model. The average sensitivity and specificity of the mastitis detection system were 58.2% and 94.0%. Moreover, they found a high prevalence of environmental and contagious mastitis pathogens, due to the incomplete cleaning and disinfection of milk liners and teat dipping cups in AMS. The authors concluded that special attention needs to be placed on the prevention and control of pathogens, as all the cows are milked with the same machine and with AMS, milk cups are not disinfected between cows [89]. The use of commonly measured milk parameters in conjunction with ML techniques are a promising tool for detecting specific mastitis-causing pathogens and they should make detection systems more robust. However, given the conflicting results of the studies carried out so far, this potential still needs to be explored further.
4.1.2. Other Diseases
Only a few studies explored the potentiality of modeling approaches for the detection of dairy cows’ diseases, besides mastitis, using data from farms equipped with AMS. Health problems are associated with reductions in activity, rumination, and milk yield. Therefore, the use of this information to detect a disease status is advised. Liberati and Zappavigna [90] combined measurements of milk production, milk flow and animal activity for detection of abnormal cow health using a Fuzzy Logic model and Linear Discriminant Analysis (LDA). The reliability of these models in detecting the relevant animal conditions (including lameness, mastitis, and ovarian cystis) was verified by comparing the alarms given by each method with the results of the farm observations. Both models were not very accurate in detecting specific abnormalities. However, the fuzzy model proved to be efficient in discriminating between “normal” and “not normal” statuses, which is useful for dairy herd management, because it allows to notice an abnormal condition before direct observation by the farmer [90]. Data associated with AMS and recorded by neck collar monitors (rumination and activity) can be combined to make management decisions more efficient, which in turn may improve the detection of periparturient metabolic disorders and other diseases. A possible approach with a Decision Tree model considering multiple sources of sensor data was proposed by Steensels et al. [91], combining rumination, activity, and milk yield to assess the probability of a cow being sick. The overall accuracy of the model was 78% and the sensitivity and specificity were 69% and 87%, respectively. Their results suggest that a post-calving health-detection model can be created using available sensors in a robotic-milking dairy farm, however, the use of additional data from additional sensors might improve the accuracy of the model. In a recent study, Zhou et al. [92] utilized eight machine learning algorithms to detect health issues in dairy cows, utilizing data from automated monitoring systems (AMS) and milking systems. The study emphasized the importance of using AMS data for predicting and monitoring health disorders in dairy cows, including variables such as milk yield, physical activity, changes in rumination time, and electrical conductivity of milk.
4.2. Cows Behaviour and Hard Management
One potential benefit of using AMS is the ability to monitor cows' individual patterns of physical activity, as cows in free stall barns may develop unique patterns over time [93]. Despite the obvious benefits due to milking robots on the voluntary movement of cattle inside the barn, the daily human–cow interaction decreases with the change from a conventional to an AMS. This entails a reduced direct supervision of the behavior and welfare of the animals from the farmer, and other ways of observing changes in cows’ behavior and welfare become necessary. The behaviors of individual cows must be ensured despite the decrease in time the stockperson can devote to each animal. Adamczyk et al. [94] classified the physical activity of dairy cows milked in the voluntary milking system using cluster analysis from data obtained by neck mounted tags. Specifically, they classified the physical activity of cows by means of Ward’s method, a hierarchical agglomeration method, and Kohonen's self-organizing map, a method based on NNs, with regard to varying environmental conditions. Physical activity during individual months showed small variability. However, over the individual months, the cluster obtained by Ward's method highlighted different groups depending on daytime light length, temperature, and relative humidity. In this study, Kohonen networks were used only for the verification of Ward's method and to test the similarity between clusters obtained with both methods. The rapid technological progress gives hope that in the future the most significant forms of cows' physical activity will be measured even more precisely, and the analysis thereof will be made in real time [94]. The application of machine vision systems to recognize and monitor the activity and behavior of animals in a quantitative manner could become the solution needed [95]. Guzhva et al. [96] used top-view cameras to automatically detect social interactions (head pressing and body pushing). A two-step pattern recognition approach was used. First, the distances from every couple of cows were extracted. Then, a SVM was used to classify the behavior of cows. Guzhva et al. [97] implemented a tracking algorithm for cow detection and motion extraction, based on Convolutional Neural Networks (CNNs). The CNN-detector used was implemented in two steps:
- a fully CNN that detects the landmarks in the image;
- a CNN that works with the probability map produced by the first CNN as input to detect the cows and their orientations.
Both studies [96,97] implemented a successfully non-invasive system capable for individual tracking and identification, and for detection of social interactions. However, the region of interest for the recordings was limited to a waiting area with free entrances to AMSs (6 × 18 meters). Considering the increasing average size of dairy herds and number of individuals requiring monitoring, a computer vision system to track and monitor the social interactions and the space-usage of the whole herd is required, and the potential to identify welfare-compromised animals through motion characteristics or spatial characteristics needed be explored. The great potential of the AMS datasets for herd characterization and management optimization is still underexploited [7]. Data of AMS are for example suitable to identify clusters within the herd with the focus to support the farm management in the herd segmentation decision. For this purpose, a K-means model was used to provide an automatic grouping of the cows based on production and behavioral features [7]. The time series data of cows milked in AMS were used to categorize herd characteristics and classify cows based on five different parameters (number of daily milking procedures, parity, average daily activity, milking regularity, and cow body weight). K-means clustering models were implemented for each of these parameters, and the herd was characterized in clusters according to different productivity and behavioral features. As suggested by the authors, the methodology was developed according to general criteria that are independent of the single case of application, thus it could be applied to other study cases with different herd characteristics.
4.3. Production
The AMS provides farmers with detailed data concerning parameters connected with the milk production (such as milk yield, days in lactation, percentage of lactose, fat, and protein) which are of great interest to improve the farm performance in terms of milk quantity and quality. Farmers can benefit from an accurate forecasting of milk yield to implement financial plans and to detect deviating yield patterns [98]. Dynamic linear modeling (DLM) was able to predict the cows’ individual milk yields per milking [98]. DLM offers several advantages, such as the handling of missing data because the forecast values are automatically adjusted over time considering the expected trend of the data [99]. This dynamic approach for estimating the expected milk yield per milking of individual cows was able to detect the deviation between observed and predicted milk production. Moreover, the DLM was affected by the SCC level, and a significant interaction between SCC and lactation stage was observed which suggests that the model could be used also to predict the cow’s health [98]. Decision Tree (DT) techniques have found several applications in predicting milk yield. The advantages of DTs are that they are intuitive, and it is easy to interpret the data shown as simple graphical models for analyzing the effect of single factors in the model but also their interactions [100]. Piwczyński et al. [101] showed that milking frequency, lactation number (parity number), month of milking, and type of lying stall represent important factors responsible for the monthly milk yield of dairy cows. At the same time, they demonstrated that there were several interactions between the aforementioned factors, the understanding of which is significantly facilitated by the DT techniques. According to Piwczyński et al. [101] the DT method, through analysis of the graphic model, enables herd managers to identify factors affecting specific productive traits of animals. More recently, a Classification and Regression Trees (CART) Decision Tree algorithm was employed to predict lactation milk yield based on information recorded during the periparturient period [102]. CART is a ML technique that has been shown to be particularly valuable when analyzing nonlinear relationships and interactions, and to identify the variables that automatically affect and reduce the complexity of the data [103]. This study is a continuation of a study on prediction of lactational milk yield of cows based on data recorded by AMS during the periparturient period [104]. In this earlier work published by the authors, descriptive statistics were presented for the prediction of services per conception and calving intervals characteristics. The CART method showed that the most important factors responsible for lactation yield were the survival to the next calving, the milking time per visit and number of milkings per day.
It is well-known that heat stress is an important factor that negatively influences lactating cows’ performance [105]. Applications of ML modeling have been recently implemented to analyze environmental factors, such as THI (Temperature Humidity Index), and its effects on heat stress of dairy cows and final productivity and quality of milk to maximize the utility of big data available from robotic dairy farms. A few studies used ML approaches to predict production traits in challenging climatic conditions, often evaluated using THI [18,106]. A RF algorithm was adopted to assess the trend in daily milk yield in relation to environmental conditions, both as a regression tool and a predictive tool, in short and long periods [18]. The daily milk yield was evaluated as a function of the position of the day in the lactation curve and the daily average of the THI in the same day and its value in each of the five previous days. The RF model detected the drop in the cow’s milk yield due to extreme hot conditions and represented a reliable tool for the evaluation of milk production in the presence of heat stress effects [18]. Fuentes et al. [106] used two ML models based on NN using the Bayesian regularization training algorithm. The first model used data from cows with similar heat tolerance, and the second one, data from all cows from the farm. The input data consisted of programmed concentrate feed and weight combined with microclimatic parameters, i.e., temperature, relative humidity, rainfall, wind speed, wind, THI. Both models presented similar results with high accuracy to predict milk yield, milk fat, and protein content, and concentrate feed intake. A study conducted by Ji et al. [107] investigated the feasibility of utilizing data collected by AMS to forecast milk yield, milk composition, and milk frequency. The authors suggested various potential applications of their machine learning framework, including identifying cows that experience heat stress or health issues and providing accurate treatment, such as nutrient adjustment or cooling, using AMS data.
5. Conclusions and Future Directions
ML algorithms have become common research tools in the livestock sector, and they can advance knowledge, particularly in areas where predictions are required. Although traditional statistical methods evolved an inevitable foundation of information, ML algorithms provide new opportunities for further advanced data-driven discoveries. The aim of this review was to draw current knowledge on the use of modeling approaches to the data obtained specifically from the sensors of milking robots and, in general, to the data obtained from the farms equipped with AMS. We provided a literature review of 60 works with a specific focus on cows’ health, production and behavior/management from 2000 to 2022. Based on the selected studies, several interesting observations were determined. The most used modeling approach was the ML (present in 63% of the studies), followed by statistical analysis (14%), fuzzy algorithms (9%), deterministic models (7%), and detection algorithms (7%). The number of articles increased slowly in the last few years, demonstrating a growing interest in the use of modeling approaches in the dairy sector, and in analyzing data from the AMS systems.
Most of the studies were intended for the detection of cows' health problems (82%), notably subclinical and clinical mastitis. Despite that, there is still a lack of a robust methodology on the application of ML techniques in this field, which hinder the development of these studies. For example, in the reviewed studies whose goal was to model the mastitis occurrence, some used quarted-specific data, while others used the integrated data of all quarters to detect the disease. Although they deal with the same disease, from the modeling point of view, they are two distinct problems. Another issue identified in this review is the absence of a systematic balancing of the positive and negative classes for mastitis prediction models. As for mastitis data the dominant class is the negative, unbalanced data lead to high specificity but a low sensitivity, as observed in many studies, and makes the models comparison infeasible. However, the potentiality of ML approaches for the detection of other diseases, besides mastitis, from AMS data is still underexploited. Surprisingly, only 11% of the studies focused on milk production. Accurate forecasting of dairy cow milk yield and knowing the deviation between expected and observed milk yields of individual cows would be beneficial in dairy cow management. This raises the question of why ML methods are not being fully exploited to improve production strategies. One reason could be the lack of availability of multiparameter datasets that include more information on milk quality and quantity. Well-described, multifactorial and high-quality datasets would allow for development of better algorithms for production management. Likewise, the study of cows’ behavior and the herd management in AMS systems is under-explored. Since AMS rely on cows milking themselves voluntarily, in this system the cows are free to move and interact during the whole day and this allows the study of cows’ social interactions. Thus, farms equipped with milking robots represent a good environment to investigate physical activity and social networks through, for example, computer vision systems.
Supplementary Materials
The following supporting information can be downloaded at the website of this paper posted on Preprints.org, Table S1: Summary of reviewed articles. Table S2: List of abbreviations.
Author Contributions
Conceptualization, L.O. and M.G.; methodology, L.O. and K.B.R.; writing—original draft preparation, L.O. and K.B.R.; writing—review and editing, C.F. and M.G. All authors have read and agreed to the published version of the manuscript.
Funding
This research received no external funding.
Institutional Review Board Statement
Not applicable.
Informed Consent Statement
Not applicable.
Data Availability Statement
Not applicable.
Conflicts of Interest
The authors declare no conflict of interest.
References
- Vijayakumar, M.; Park, J.H.; Ki, K.S.; Lim, D.H.; Kim, S.B.; Park, S.M.; Jeong, H.Y.; Park, B.Y.; Kim, T.I. The effect of lactation number, stage, length, and milking frequency on milk yield in Korean Holstein dairy cows using automatic milking system. Asian-Australasian J. Anim. Sci. 2017, 30, 1093–1098. [Google Scholar] [CrossRef] [PubMed]
- Tse, C.; Barkema, H.W.; DeVries, T.J.; Rushen, J.; Pajor, E.A. Impact of automatic milking systems on dairy cattle producers’ reports of milking labour management, milk production and milk quality. Animal 2018, 12, 2649–2656. [Google Scholar] [CrossRef] [PubMed]
- Österman, S.; Redbo, I. Effects of milking frequency on lying down and getting up behaviour in dairy cows. Appl. Anim. Behav. Sci. 2000, 70, 167–176. [Google Scholar] [CrossRef]
- Jacobs, J.A.; Siegford, J.M. Invited review: The impact of automatic milking systems on dairy cow management, behavior, health, and welfare. J. Dairy Sci. 2012, 95, 2227–2247. [Google Scholar] [CrossRef] [PubMed]
- Miguel-Pacheco, G.G.; Kaler, J.; Remnant, J.; Cheyne, L.; Abbott, C.; French, A.P.; Pridmore, T.P.; Huxley, J.N. Behavioural changes in dairy cows with lameness in an automatic milking system. Appl. Anim. Behav. Sci. 2014, 150, 1–8. [Google Scholar] [CrossRef]
- Gargiulo, J.; Lyons, N.; Kempton, K.; Armstrong, D.; Garcia, S. Physical and economic comparison of pasture-based automatic and conventional milking systems. J. Dairy Sci. 2020, 103, 8231–8240. [Google Scholar] [CrossRef] [PubMed]
- Bonora, F.; Benni, S.; Barbaresi, A.; Tassinari, P.; Torreggiani, D. A cluster-graph model for herd characterisation in dairy farms equipped with an automatic milking system. Biosyst. Eng. 2018, 167, 1–7. [Google Scholar] [CrossRef]
- Wolfert, S.; Ge, L.; Verdouw, C.; Bogaardt, M.-J. Big Data in Smart Farming – A review. Agric. Syst. 2017, 153, 69–80. [Google Scholar] [CrossRef]
- Cockburn, M. Review: Application and Prospective Discussion of Machine Learning for the Management of Dairy Farms. Animals 2020, 10, 1690. [Google Scholar] [CrossRef]
- Nayeri, S.; Sargolzaei, M.; Tulpan, D. A review of traditional and machine learning methods applied to animal breeding. Anim. Heal. Res. Rev. 2019, 20, 31–46. [Google Scholar] [CrossRef]
- Rebala, G.; Ravi, A.; Churiwala, S. Machine Learning Definition and Basics. In An Introduction to Machine Learning; Springer: Cham, 2019; pp. 1–17. [Google Scholar]
- García, R.; Aguilar, J.; Toro, M.; Pinto, A.; Rodríguez, P. A systematic literature review on the use of machine learning in precision livestock farming. Comput. Electron. Agric. 2020, 179, 105826. [Google Scholar] [CrossRef]
- Wang, Z.; Shadpour, S.; Chan, E.; Rotondo, V.; Wood, K.M.; Tulpan, D. ASAS-NANP SYMPOSIUM: Applications of machine learning for livestock body weight prediction from digital images. J. Anim. Sci. 2021, 99, skab022. [Google Scholar] [CrossRef] [PubMed]
- Brock, J.; Lange, M.; Tratalos, J.A.; More, S.J.; Graham, D.A.; Guelbenzu-Gonzalo, M.; Thulke, H.-H. Combining expert knowledge and machine-learning to classify herd types in livestock systems. Sci. Rep. 2021, 11, 1–10. [Google Scholar] [CrossRef] [PubMed]
- Rao, Y.; Jiang, M.; Wang, W.; Zhang, W.; Wang, R. On-farm welfare monitoring system for goats based on Internet of Things and machine learning. Int. J. Distrib. Sens. Networks 2020, 16. [Google Scholar] [CrossRef]
- Carslake, C.; Vázquez-Diosdado, J.A.; Kaler, J. Machine Learning Algorithms to Classify and Quantify Multiple Behaviours in Dairy Calves Using a Sensor: Moving beyond Classification in Precision Livestock. Sensors 2020, 21, 88. [Google Scholar] [CrossRef]
- Higaki, S.; Miura, R.; Suda, T.; Andersson, L.M.; Okada, H.; Zhang, Y.; Itoh, T.; Miwakeichi, F.; Yoshioka, K. Estrous detection by continuous measurements of vaginal temperature and conductivity with supervised machine learning in cattle. Theriogenology 2018, 123, 90–99. [Google Scholar] [CrossRef]
- Bovo, M.; Agrusti, M.; Benni, S.; Torreggiani, D.; Tassinari, P. Random Forest Modelling of Milk Yield of Dairy Cows under Heat Stress Conditions. Animals 2021, 11, 1305. [Google Scholar] [CrossRef]
- Gorczyca, M.T.; Gebremedhin, K.G. Ranking of environmental heat stressors for dairy cows using machine learning algorithms. Comput. Electron. Agric. 2019, 168, 105124. [Google Scholar] [CrossRef]
- Ren, K.; Bernes, G.; Hetta, M.; Karlsson, J. Tracking and analysing social interactions in dairy cattle with real-time locating system and machine learning. J. Syst. Arch. 2021, 116. [Google Scholar] [CrossRef]
- Lokhorst, C.; De Mol, R.M.; Kamphuis, C. Invited Review: Big Data in Precision Dairy Farming. Animal 2019, 13, 1519. [Google Scholar] [CrossRef]
- Slob, N.; Catal, C.; Kassahun, A. Application of machine learning to improve dairy farm management: A systematic literature review. Prev. Veter- Med. 2020, 187, 105237. [Google Scholar] [CrossRef]
- Samuel, A. L. Some studies in machine learning using the game of checkers, in IBM Journal of Research and Development, vol. 44, no. 1.2, 2000. 206; 226. [Google Scholar]
- Sharma, R.; Kamble, S.S.; Gunasekaran, A.; Kumar, V.; Kumar, A. A systematic literature review on machine learning applications for sustainable agriculture supply chain performance. Comput. Oper. Res. 2020, 119, 104926. [Google Scholar] [CrossRef]
- Sharma, D.; Kumar, N. A Review on Machine Learning Algorithms, Tasks and Applications. Int. J. Adv. Res. 2017, 6, 1548–1552. [Google Scholar]
- Tarca, A.L.; Carey, V.J.; Chen, X.-W.; Romero, R.; Drăghici, S. Machine Learning and Its Applications to Biology. PLOS Comput. Biol. 2007, 3, e116. [Google Scholar] [CrossRef] [PubMed]
- Jordan, M.I.; Mitchell, T.M. Machine learning: Trends, perspectives, and prospects. Science 2015, 349, 255–260. [Google Scholar] [CrossRef]
- Kaelbling, L.P.; Littman, M.L.; Moore, A.W. Reinforcement Learning: A Survey. J. Artif. Intell. Res. 1996, 4, 237–285. [Google Scholar] [CrossRef]
- Shalev-Shwartz, S.; Ben-David, S. Understanding Machine Learning: From Theory to Algorithms; Cambridge: Cambridge University Press, 2014. [Google Scholar] [CrossRef]
- Ramsey, F.; Schafer, D. The Statistical Sleuth: A Course in Methods of Data Analysis. 1st ed. Wadsworth Publishing Company, 1996, Belmont CA. 1996. [Google Scholar]
- Kingsford, C.; Salzberg, S.L. What are decision trees? Nat. Biotechnol. 2008, 26, 1011–1013. [Google Scholar] [CrossRef]
- Biau, G.; Scornet, E. A random forest guided tour. Test 2016, 25, 197–227. [Google Scholar] [CrossRef]
- Cielen, D.; Meysman, A.D.B.; Ali, M. Introducing Data Science: Big Data, Machine Learning, and More, Using Python Tools. 2016, New York: Manning Publications Co.
- Vapnik, V.; Izmailov, R. Knowledge transfer in SVM and neural networks. Ann. Math. Artif. Intell. 2017, 81, 3–19. [Google Scholar] [CrossRef]
- Jensen, F.V.; Nielsen, T.D. Bayesian networks and decision graphs (Vol. 2). 2007, New York: Springer.
- Schmidhuber, J. Deep Learning in Neural Networks: An Overview. Neural Netw. 2015, 61, 85–117. [Google Scholar] [CrossRef]
- Zadeh, L.A. Fuzzy sets. Inf. Control 1965, 8, 338–353. [Google Scholar] [CrossRef]
- Goldberg, D.E. Genetic Algorithms in Search Optimization and Machine Learning. 1989, Addison-Wesley, Reading, MA.
- Shapiro, J. Genetic algorithms in machine learning. In: Advanced Course on Artificial Intelligence, 1999 Springer, Berlin, Heidelberg, pp. 146-168.
- Benos, L.; Tagarakis, A.C.; Dolias, G.; Berruto, R.; Kateris, D.; Bochtis, D. Machine Learning in Agriculture: A Comprehensive Updated Review. Sensors 2021, 21, 3758. [Google Scholar] [CrossRef]
- Melchior, M.; Vaarkamp, H.; Fink-Gremmels, J. Biofilms: A role in recurrent mastitis infections? Veter- J. 2006, 171, 398–407. [Google Scholar] [CrossRef]
- Ebrahimie, E.; Ebrahimi, F.; Ebrahimi, M.; Tomlinson, S.; Petrovski, K.R. A large-scale study of indicators of sub-clinical mastitis in dairy cattle by attribute weighting analysis of milk composition features: highlighting the predictive power of lactose and electrical conductivity. J. Dairy Res. 2018, 85, 193–200. [Google Scholar] [CrossRef]
- Cavero, D.; Tölle, K.-H.; Buxadé, C.; Krieter, J. Mastitis detection in dairy cows by application of fuzzy logic. Livest. Sci. 2006, 105, 207–213. [Google Scholar] [CrossRef]
- Steeneveld, W.; van der Gaag, L.; Ouweltjes, W.; Mollenhorst, H.; Hogeveen, H. Discriminating between true-positive and false-positive clinical mastitis alerts from automatic milking systems. J. Dairy Sci. 2010, 93, 2559–2568. [Google Scholar] [CrossRef]
- Sharma, N.; Singh, N.K.; Bhadwal, M.S. Relationship of Somatic Cell Count and Mastitis: An Overview. Asian-Australasian J. Anim. Sci. 2011, 24, 429–438. [Google Scholar] [CrossRef]
- Zecconi, A.; Dell’orco, F.; Vairani, D.; Rizzi, N.; Cipolla, M.; Zanini, L. Differential Somatic Cell Count as a Marker for Changes of Milk Composition in Cows with Very Low Somatic Cell Count. Animals 2020, 10, 604. [Google Scholar] [CrossRef]
- Bobbo, T.; Biffani, S.; Taccioli, C.; Penasa, M.; Cassandro, M. Comparison of machine learning methods to predict udder health status based on somatic cell counts in dairy cows. Sci. Rep. 2021, 11, 1–10. [Google Scholar] [CrossRef]
- Ebrahimie, E.; Ebrahimi, F.; Ebrahimi, M.; Tomlinson, S.; Petrovski, K.R. Hierarchical pattern recognition in milking parameters predicts mastitis prevalence. Comput. Electron. Agric. 2018, 147, 6–11. [Google Scholar] [CrossRef]
- Norberg, E.; Hogeveen, H.; Korsgaard, I.; Friggens, N.; Sloth, K.; Løvendahl, P. Electrical Conductivity of Milk: Ability to Predict Mastitis Status. J. Dairy Sci. 2004, 87, 1099–1107. [Google Scholar] [CrossRef] [PubMed]
- Kamphuis, C.; Sherlock, R.; Jago, J.; Mein, G.; Hogeveen, H. Automatic Detection of Clinical Mastitis Is Improved by In-Line Monitoring of Somatic Cell Count. J. Dairy Sci. 2008, 91, 4560–4570. [Google Scholar] [CrossRef] [PubMed]
- Mollenhorst, H.; van der Tol, P.; Hogeveen, H. Somatic cell count assessment at the quarter or cow milking level. J. Dairy Sci. 2010, 93, 3358–3364. [Google Scholar] [CrossRef]
- Khatun, M.; Clark, C.E.F.; Lyons, N.A.; Thomson, P.; Kerrisk, K.L.; García, S.C. Early detection of clinical mastitis from electrical conductivity data in an automatic milking system. Anim. Prod. Sci. 2017, 57, 1226–1232. [Google Scholar] [CrossRef]
- Sun, Z.; Samarasinghe, S.; Jago, J. Detection of mastitis and its stage of progression by automatic milking systems using artificial neural networks. J. Dairy Res. 2009, 77, 168–175. [Google Scholar] [CrossRef]
- Hovinen, M.; Aisla, A.-M.; Pyörälä, S. Accuracy and reliability of mastitis detection with electrical conductivity and milk colour measurement in automatic milking. Acta Agric. Scand. Sect. A — Anim. Sci. 2006, 56, 121–127. [Google Scholar] [CrossRef]
- Kamphuis, C.; Pietersma, D.; van der Tol, R.; Wiedemann, M.; Hogeveen, H. Using sensor data patterns from an automatic milking system to develop predictive variables for classifying clinical mastitis and abnormal milk. Comput. Electron. Agric. 2008, 62, 169–181. [Google Scholar] [CrossRef]
- Altay, Y.; Kılıç, B.; Aytekin, I.; Keskin, I. Determination of Factors Affecting Mastitis in Holstein Friesian and Brown Swiss by Using Logistic Regression Analysis. Selcuk J. Agric. Food Sci. 2019, 33, 194–197. [Google Scholar] [CrossRef]
- Chagunda, M.; Friggens, N.; Rasmussen; Larsen, T. A Model for Detection of Individual Cow Mastitis Based on an Indicator Measured in Milk. J. Dairy Sci. 2006, 89, 2980–2998. [Google Scholar] [CrossRef]
- Friggens, N.; Chagunda, M.; Bjerring, M.; Ridder, C.; Hojsgaard, S.; Larsen, T. Estimating Degree of Mastitis from Time-Series Measurements in Milk: A Test of a Model Based on Lactate Dehydrogenase Measurements. J. Dairy Sci. 2007, 90, 5415–5427. [Google Scholar] [CrossRef]
- Ankinakatte, S.; Norberg, E.; Løvendahl, P.; Edwards, D.; Højsgaard, S. Predicting mastitis in dairy cows using neural networks and generalized additive models: A comparison. Comput. Electron. Agric. 2013, 99, 1–6. [Google Scholar] [CrossRef]
- Zank, W.; Schlatterer, B. Assessment of subacute mammary inflammation by soluble biomarkers in comparison to somatic cell counts in quarter milk samples from dairy cows. J. Veter- Med. Ser. A 1998, 45, 41–51. [Google Scholar] [CrossRef] [PubMed]
- Nyman, A.-K.; Emanuelson, U.; Waller, K. Diagnostic test performance of somatic cell count, lactate dehydrogenase, and N-acetyl-β-d-glucosaminidase for detecting dairy cows with intramammary infection. J. Dairy Sci. 2016, 99, 1440–1448. [Google Scholar] [CrossRef]
- Penry, J.; Crump, P.; Ruegg, P.; Reinemann, D. Short communication: Cow- and quarter-level milking indicators and their associations with clinical mastitis in an automatic milking system. J. Dairy Sci. 2017, 100, 9267–9272. [Google Scholar] [CrossRef] [PubMed]
- Naqvi, S.A.; King, M.T.; Matson, R.D.; DeVries, T.J.; Deardon, R.; Barkema, H.W. Mastitis detection with recurrent neural networks in farms using automated milking systems. Comput. Electron. Agric. 2021, 192, 106618. [Google Scholar] [CrossRef]
- Naqvi, S.A.; King, M.T.; DeVries, T.J.; Barkema, H.W.; Deardon, R. Data considerations for developing deep learning models for dairy applications: A simulation study on mastitis detection. Comput. Electron. Agric. 2022, 196. [Google Scholar] [CrossRef]
- Bonestroo, J.; van der Voort, M.; Hogeveen, H.; Emanuelson, U.; Klaas, I.C.; Fall, N. Forecasting chronic mastitis using automatic milking system sensor data and gradient-boosting classifiers. Comput. Electron. Agric. 2022, 198. [Google Scholar] [CrossRef]
- Mollenhorst, H.; Rijkaart, L.; Hogeveen, H. Mastitis alert preferences of farmers milking with automatic milking systems. J. Dairy Sci. 2012, 95, 2523–2530. [Google Scholar] [CrossRef]
- de Mol, R.; Ouweltjes, W. Detection model for mastitis in cows milked in an automatic milking system. Prev. Veter- Med. 2001, 49, 71–82. [Google Scholar] [CrossRef]
- De Mol, R.; Woldt, W.; Blokhuis, H. Application of Fuzzy Logic in Automated Cow Status Monitoring. J. Dairy Sci. 2001, 84, 400–410. [Google Scholar] [CrossRef]
- Khamaysa Hajaya, M. , S., Kulasiri, G. D., & Lopez Benavides, M. Detection of dairy cattle Mastitis: Modelling of milking features using deep neural networks. In Modelling and Simulation Society of Australia and New Zealand (Eds.), Proceedings of the 23rd International Congress on Modelling and Simulation, 2019, (pp.; pp. 1656–1662.
- Steeneveld, W.; van der Gaag, L.; Barkema, H.; Hogeveen, H. Simplify the interpretation of alert lists for clinical mastitis in automatic milking systems. Comput. Electron. Agric. 2010, 71, 50–56. [Google Scholar] [CrossRef]
- Kamphuis, C.; Mollenhorst, H.; Heesterbeek, J.A.P.; Hogeveen, H. Data Mining to Detect Clinical Mastitis with Automatic Milking. In Proceedings of the 5th IDF Mastitis Conference: Mastitis Research into Practice, Christchurch, New Zealand, 2010a pp. 568-572. 21-24. [Google Scholar]
- Kamphuis, C.; Mollenhorst, H.; Heesterbeek, J.; Hogeveen, H. Detection of clinical mastitis with sensor data from automatic milking systems is improved by using decision-tree induction. J. Dairy Sci. 2010, 93, 3616–3627. [Google Scholar] [CrossRef] [PubMed]
- Bausewein, M.; Mansfeld, R.; Doherr, M.G.; Harms, J.; Sorge, U.S. Sensitivity and Specificity for the Detection of Clinical Mastitis by Automatic Milking Systems in Bavarian Dairy Herds. Animals 2022, 12, 2131. [Google Scholar] [CrossRef] [PubMed]
- Højsgaard, S.; Friggens, N. Quantifying degree of mastitis from common trends in a panel of indicators for mastitis in dairy cows. J. Dairy Sci. 2010, 93, 582–592. [Google Scholar] [CrossRef]
- Sørensen, L.; Bjerring, M.; Løvendahl, P. Monitoring individual cow udder health in automated milking systems using online somatic cell counts. J. Dairy Sci. 2016, 99, 608–620. [Google Scholar] [CrossRef]
- Cavero, D.; Tölle, K.-H.; Henze, C.; Buxadé, C.; Krieter, J. Mastitis detection in dairy cows by application of neural networks. Livest. Sci. 2008, 114, 280–286. [Google Scholar] [CrossRef]
- Krieter, J.; Cavero, D.; Henze, C. Mastitis detection in dairy cows using neural networks. Conference: Agrarinformatik im Spannungsfeld zwischen Regionalisierung und globalen Wertschöpfungsketten–Referate der 27. 2007, GIL Jahrestagung.
- Mammadova, N.; Keskin, I. Application of the Support Vector Machine to Predict Subclinical Mastitis in Dairy Cattle. Sci. World J. 2013, 2013, 1–9. [Google Scholar] [CrossRef]
- Mammadova, N.M.; Keskin, I. Application of neural network and adaptive neuro-fuzzy inference system to predict subclinical mastitis in dairy cattle. Indian J. Anim. Res. 2015, 49. [Google Scholar] [CrossRef]
- Mammadova, N.M.; Keskin, I. Subclinical mastitis prediction in dairy cattle by application of Fuzzy Logic. Pak. J. Agric. Sci., 2015b, 52(4).
- Anglart, D.; Hallén-Sandgren, C.; Emanuelson, U.; Rönnegård, L. Comparison of methods for predicting cow composite somatic cell counts. J. Dairy Sci. 2020, 103, 8433–8442. [Google Scholar] [CrossRef]
- Ebrahimi, M.; Mohammadi-Dehcheshmeh, M.; Ebrahimie, E.; Petrovski, K.R. Comprehensive analysis of machine learning models for prediction of sub-clinical mastitis: Deep Learning and Gradient-Boosted Trees outperform other models. Comput. Biol. Med. 2019, 114, 103456. [Google Scholar] [CrossRef]
- Tian, F.; Wang, Z.; Yu, S.; Xiong, B.; Wang, S. Clinical mastitis detection by on-line measurements of milk yield, electrical conductivity and deep Learn. In Journal of Physics: Conference Series, 2020, Vol. 1635, No. 1, p. 012046. IOP Publishing. [CrossRef]
- Ghafoor, N.A.; Sitkowska, B. MasPA: A Machine Learning Application to Predict Risk of Mastitis in Cattle from AMS Sensor Data. Agriengineering 2021, 3, 575–583. [Google Scholar] [CrossRef]
- Kamphuis, C.; Mollenhorst, H.; Hogeveen, H. Sensor measurements revealed: Predicting the Gram-status of clinical mastitis causal pathogens. Comput. Electron. Agric. 2011, 77, 86–94. [Google Scholar] [CrossRef]
- Hassan, K.; Samarasinghe, S.; Lopez-Benavides, M. Use of neural networks to detect minor and major pathogens that cause bovine mastitis. J. Dairy Sci. 2009, 92, 1493–1499. [Google Scholar] [CrossRef] [PubMed]
- Horpiencharoen, W.; Thongratsakul, S.; Poolkhet, C. Risk factors of clinical mastitis and antimicrobial susceptibility test results of mastitis milk from dairy cattle in western Thailand: Bayesian network analysis. Prev. Veter- Med. 2019, 164, 49–55. [Google Scholar] [CrossRef] [PubMed]
- Steeneveld, W.; van der Gaag, L.; Barkema, H.; Hogeveen, H. Providing probability distributions for the causal pathogen of clinical mastitis using naive Bayesian networks. J. Dairy Sci. 2009, 92, 2598–2609. [Google Scholar] [CrossRef] [PubMed]
- Castro, Ángel; Pereira, J. M.; Amiama, C.; Bueno, J. Mastitis diagnosis in ten Galician dairy herds (NW Spain) with automatic milking systems. Span. J. Agric. Res. 2015, 13, e0504. [Google Scholar] [CrossRef]
- Liberati, P.; Zappavigna, P. Improving the automated monitoring of dairy cows by integrating various data acquisition systems. Comput. Electron. Agric. 2009, 68, 62–67. [Google Scholar] [CrossRef]
- Steensels, M.; Antler, A.; Bahr, C.; Berckmans, D.; Maltz, E.; Halachmi, I. A decision-tree model to detect post-calving diseases based on rumination, activity, milk yield, BW and voluntary visits to the milking robot. Animal 2016, 10, 1493–1500. [Google Scholar] [CrossRef]
- Zhou, X.; Xu, C.; Wang, H.; Xu, W.; Zhao, Z.; Chen, M.; Jia, B.; Huang, B. The Early Prediction of Common Disorders in Dairy Cows Monitored by Automatic Systems with Machine Learning Algorithms. Animals 2022, 12, 1251. [Google Scholar] [CrossRef]
- Scott, V.; Thomson, P.; Kerrisk, K.; Garcia, S. Influence of provision of concentrate at milking on voluntary cow traffic in a pasture-based automatic milking system. J. Dairy Sci. 2014, 97, 1481–1490. [Google Scholar] [CrossRef]
- Adamczyk, K.; Cywicka, D.; Herbut, P.; Trześniowska, E. The application of cluster analysis methods in assessment of daily physical activity of dairy cows milked in the Voluntary Milking System. Comput. Electron. Agric. 2017, 141, 65–72. [Google Scholar] [CrossRef]
- Banhazi, T.M.; Tscharke, M. A brief review of the application of machine vision in livestock behaviour analysis. J. Agric. Informatics 2016, 7, 23–42. [Google Scholar] [CrossRef]
- Guzhva, O.; Ardö, H.; Herlin, A.; Nilsson, M.; Åström, K.; Bergsten, C. Feasibility study for the implementation of an automatic system for the detection of social interactions in the waiting area of automatic milking stations by using a video surveillance system. Comput. Electron. Agric. 2016, 127, 506–509. [Google Scholar] [CrossRef]
- Guzhva, O.; Ardö, H.; Nilsson, M.; Herlin, A.; Tufvesson, L. Now You See Me: Convolutional Neural Network Based Tracker for Dairy Cows. Front. Robot. AI 2018, 6, 107. [Google Scholar] [CrossRef] [PubMed]
- Jensen, D.B.; van der Voort, M.; Hogeveen, H. Dynamic forecasting of individual cow milk yield in automatic milking systems. J. Dairy Sci. 2018, 101, 10428–10439. [Google Scholar] [CrossRef]
- Jensen, D.B.; Hogeveen, H.; De Vries, A. Bayesian integration of sensor information and a multivariate dynamic linear model for prediction of dairy cow mastitis. J. Dairy Sci. 2016, 99, 7344–7361. [Google Scholar] [CrossRef]
- Ghiasi, H.; Piwczyński, D.; Khaldari, M.; Kolenda, M. ; And Application of classification trees in determining the impact of phenotypic factors on conception to first service in Holstein cattle. Anim. Prod. Sci. 2016, 56, 1061. [Google Scholar] [CrossRef]
- Piwczyński, D.; Sitkowska, B.; Kolenda, M.; Brzozowski, M.; Aerts, J.; Schork, P.M. Forecasting the milk yield of cows on farms equipped with automatic milking system with the use of decision trees. Anim. Sci. J. 2020, 91, e13414. [Google Scholar] [CrossRef]
- Kliś, P.; Sawa, A.; Piwczyński, D.; Sitkowska, B.; Bogucki, M. Prediction of cow's fertility based on data recorded by automatic milking system during the periparturient period. Reprod. Dom. Anim., 2021a, 56(9), 1227-1234. [CrossRef]
- Breiman, L., J.H. Friedman, R.A. Olshen, and C.J. Stone. Classification and Regression Trees. 1984. Wadsworth S, Pacific Grove, CA, USA.
- Kliś, P.; Piwczyński, D.; Sawa, A.; Sitkowska, B. Prediction of Lactational Milk Yield of Cows Based on Data Recorded by AMS during the Periparturient Period. Animals 2021, 11, 383. [Google Scholar] [CrossRef]
- Kadzere, C.; Murphy, M.; Silanikove, N.; Maltz, E. Heat stress in lactating dairy cows: a review. Livest. Prod. Sci. 2002, 77, 59–91. [Google Scholar] [CrossRef]
- Fuentes, S.; Viejo, C.G.; Cullen, B.; Tongson, E.; Chauhan, S.S.; Dunshea, F.R. Artificial Intelligence Applied to a Robotic Dairy Farm to Model Milk Productivity and Quality based on Cow Data and Daily Environmental Parameters. Sensors 2020, 20, 2975. [Google Scholar] [CrossRef] [PubMed]
- Ji, B.; Banhazi, T.; Phillips, C.J.; Wang, C.; Li, B. A machine learning framework to predict the next month's daily milk yield, milk composition and milking frequency for cows in a robotic dairy farm. Biosyst. Eng. 2022, 216, 186–197. [Google Scholar] [CrossRef]
Figure 1.
Geographical distribution of the 60 articles included in the review.
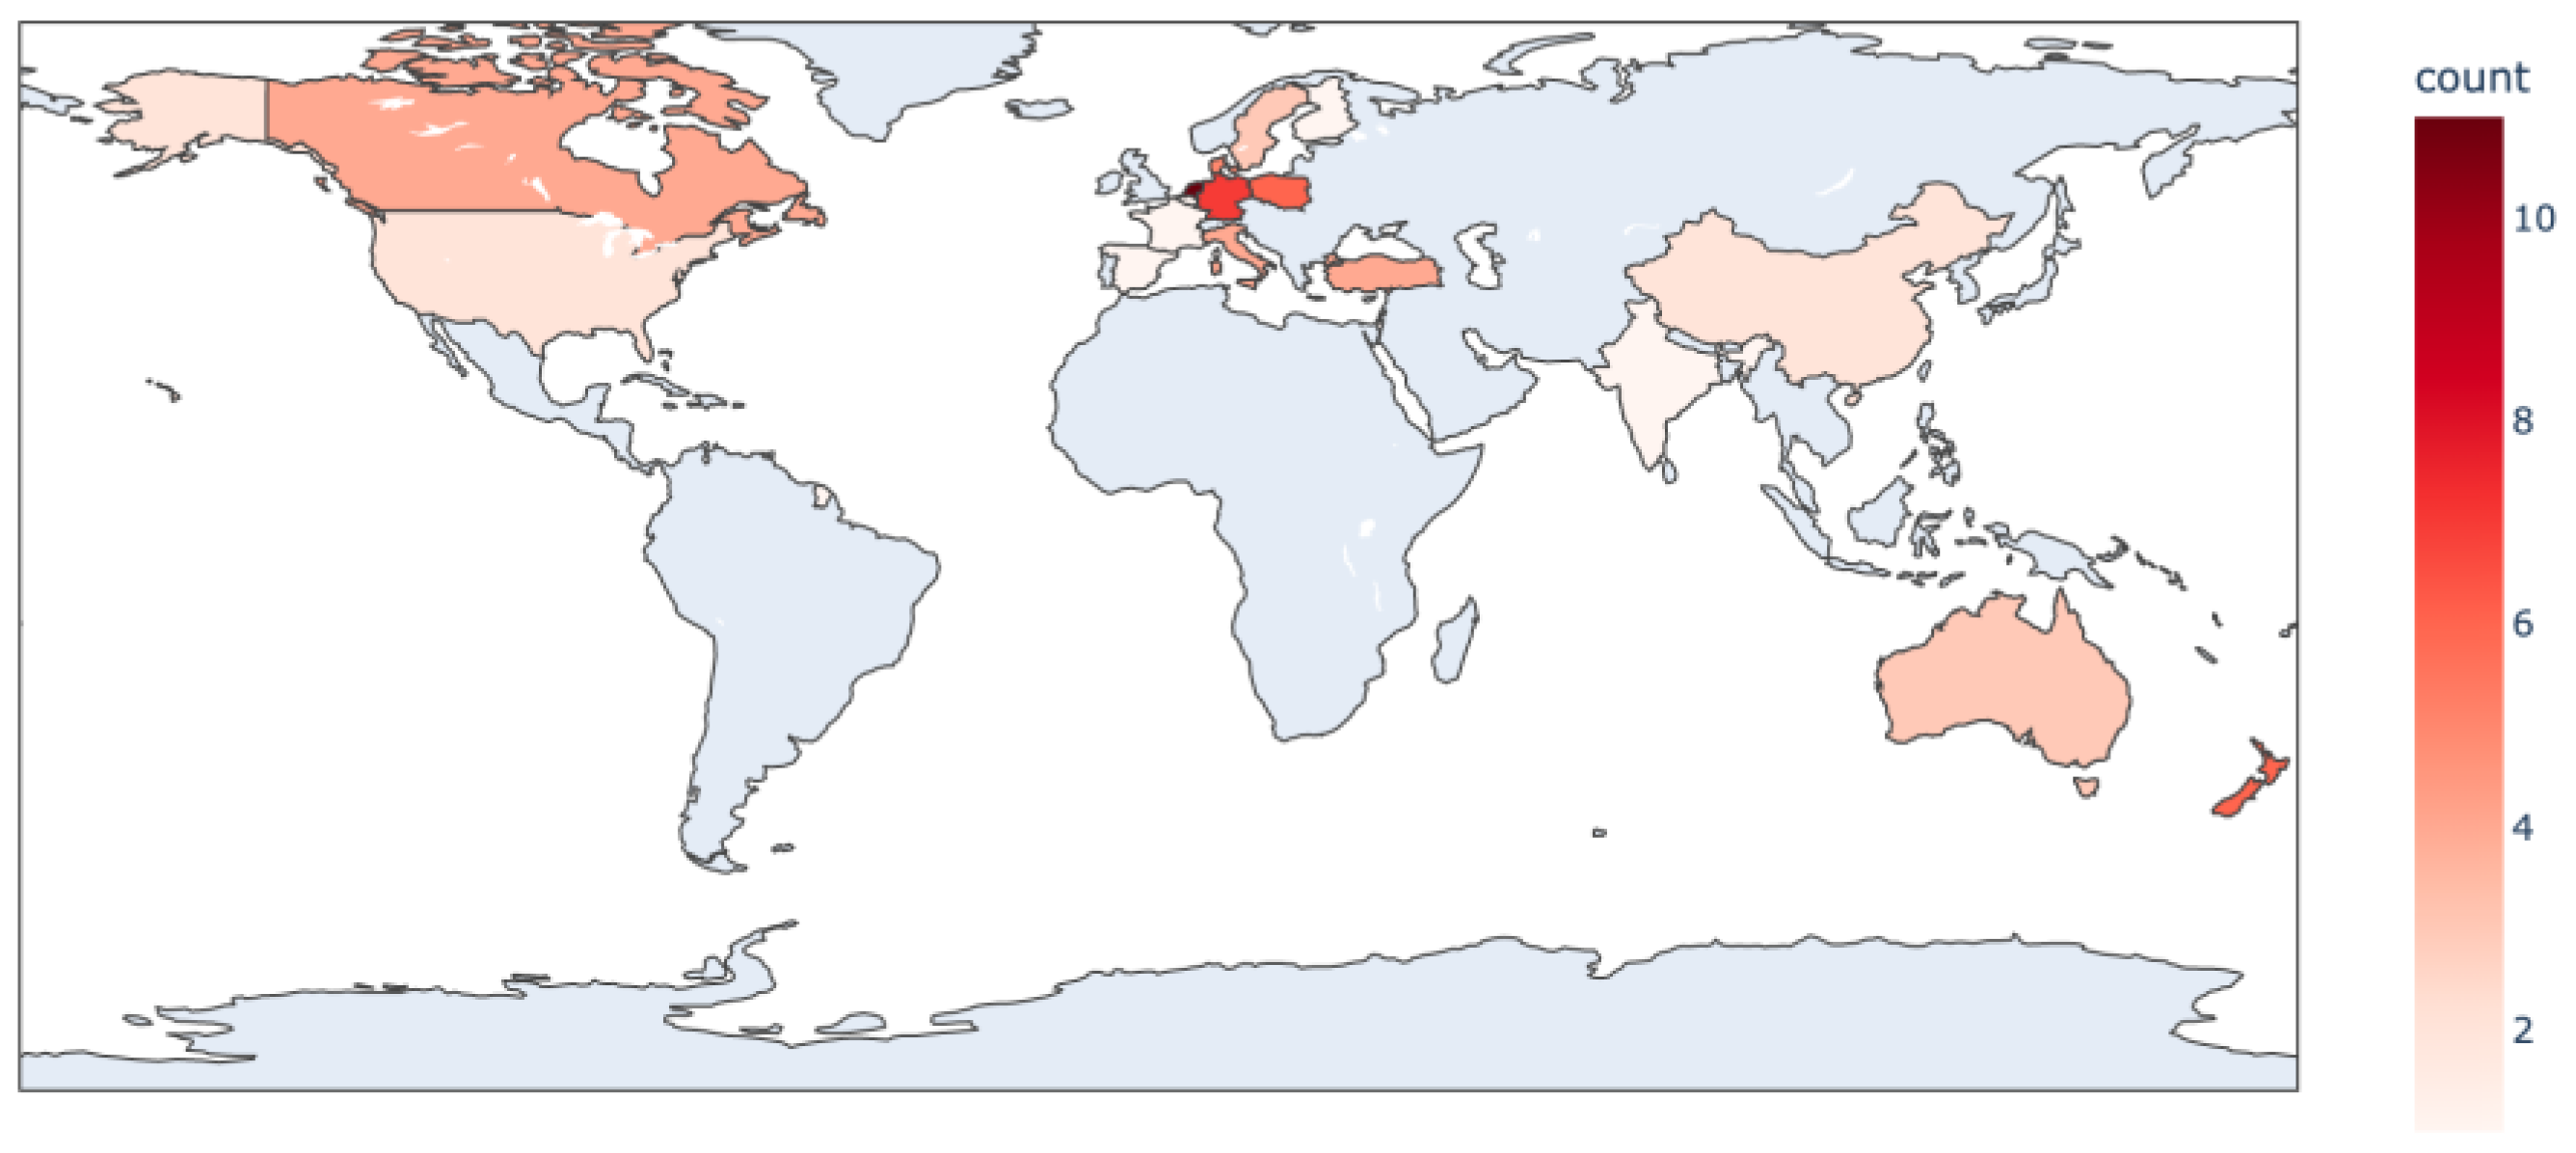
Figure 2.
Timeline of number of publications included in this review from 2000 to 2022.
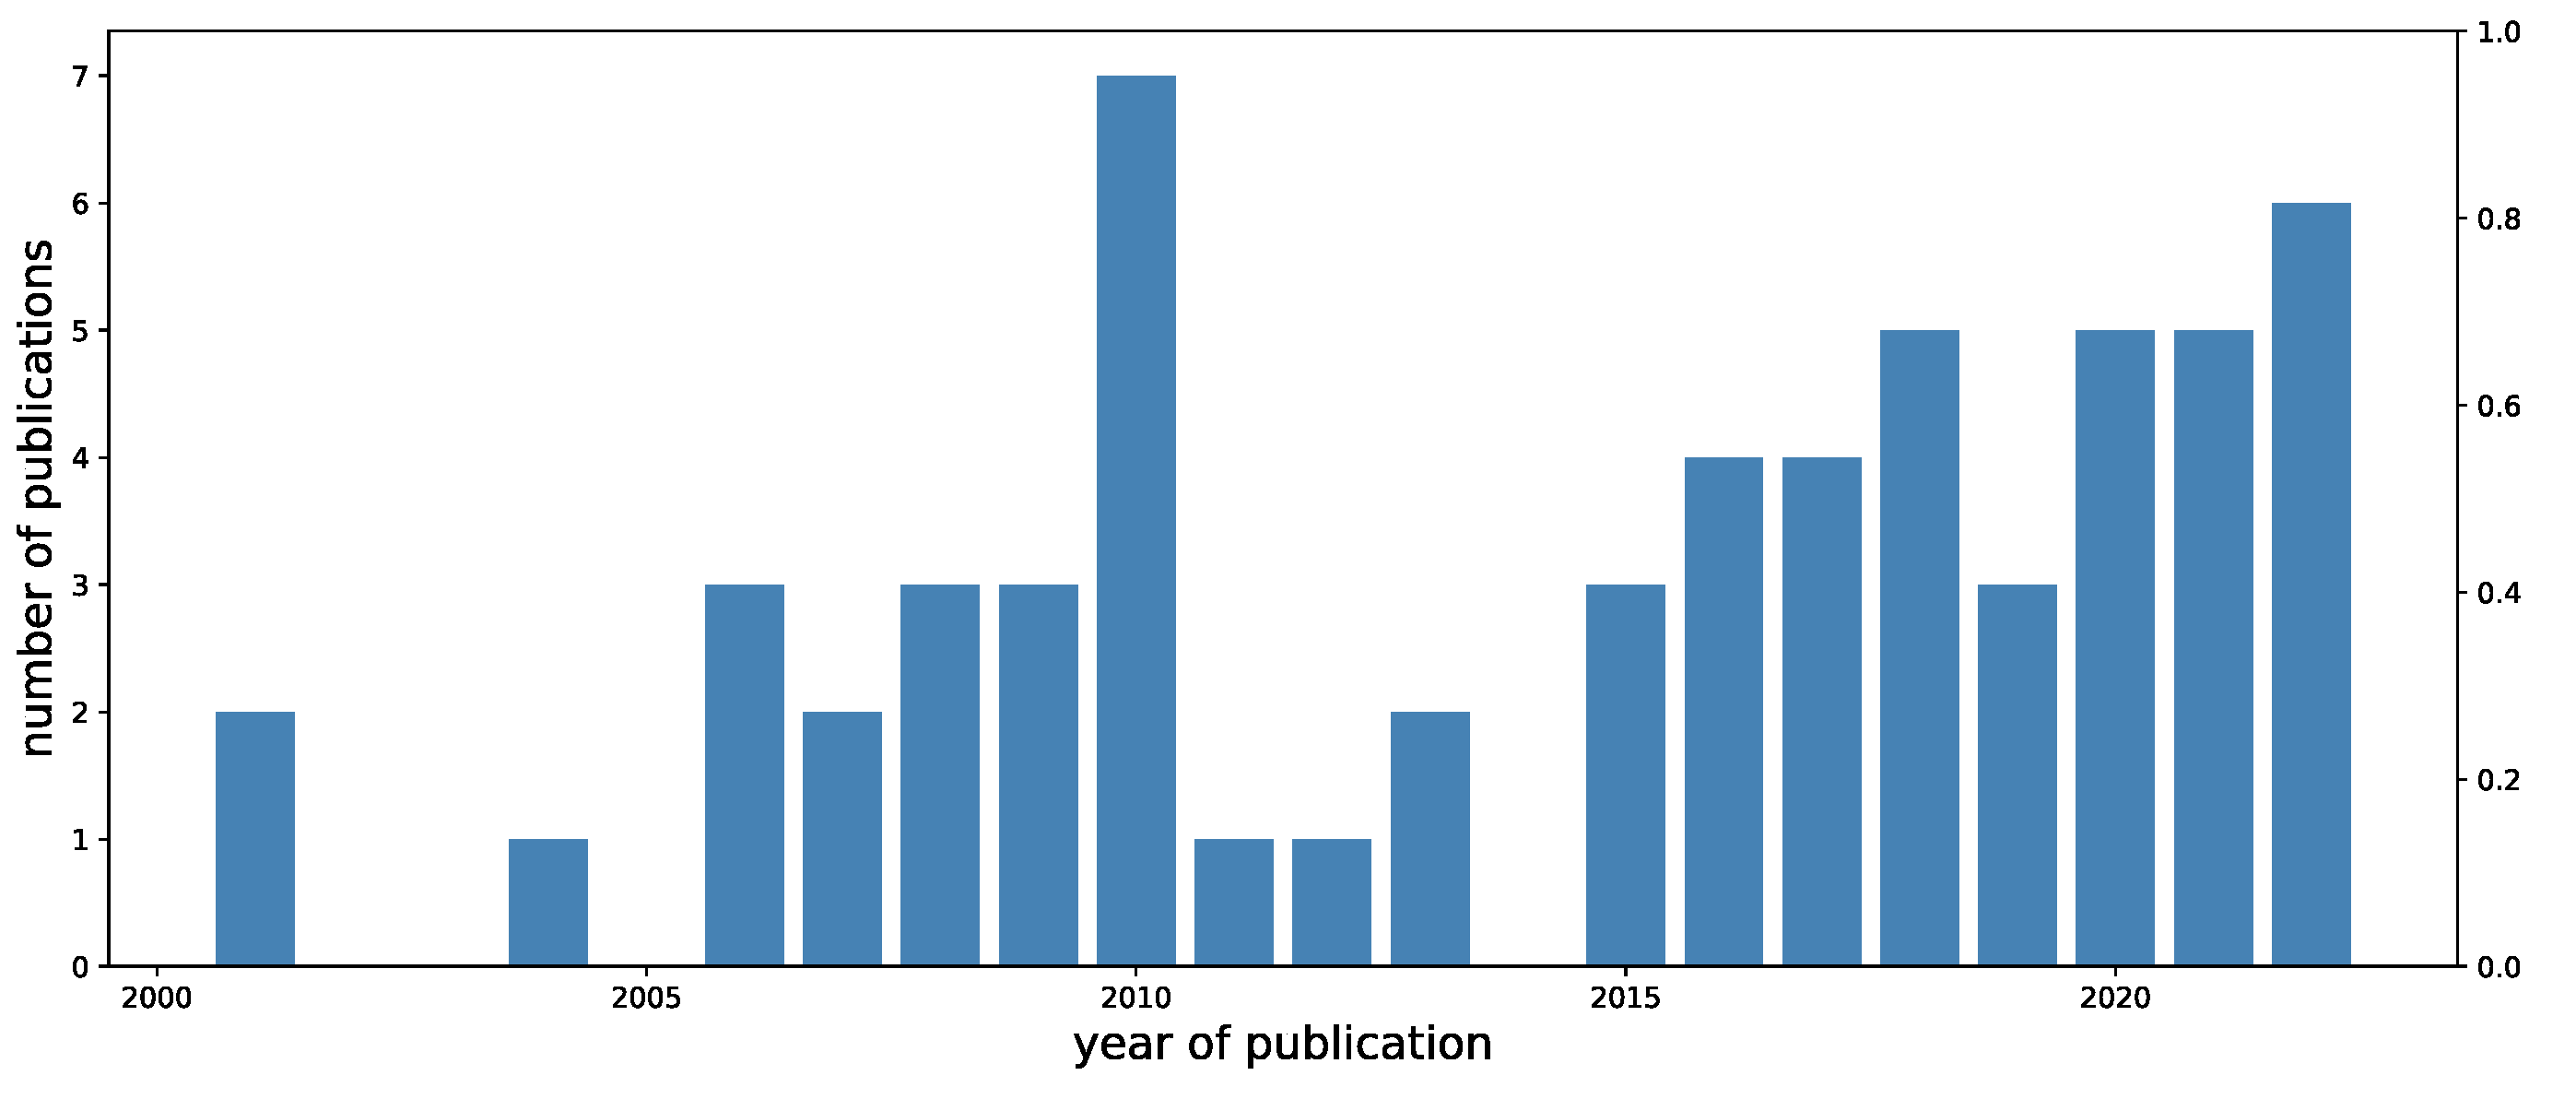
Figure 3.
Types of supervised and unsupervised machine learning. Problems are grouped into four main classes: classification, clustering, regression, and dimensionality reduction based on data type (discrete or continuous) and learning style (supervised or unsupervised) (adapted from [10]).
Figure 3.
Types of supervised and unsupervised machine learning. Problems are grouped into four main classes: classification, clustering, regression, and dimensionality reduction based on data type (discrete or continuous) and learning style (supervised or unsupervised) (adapted from [10]).
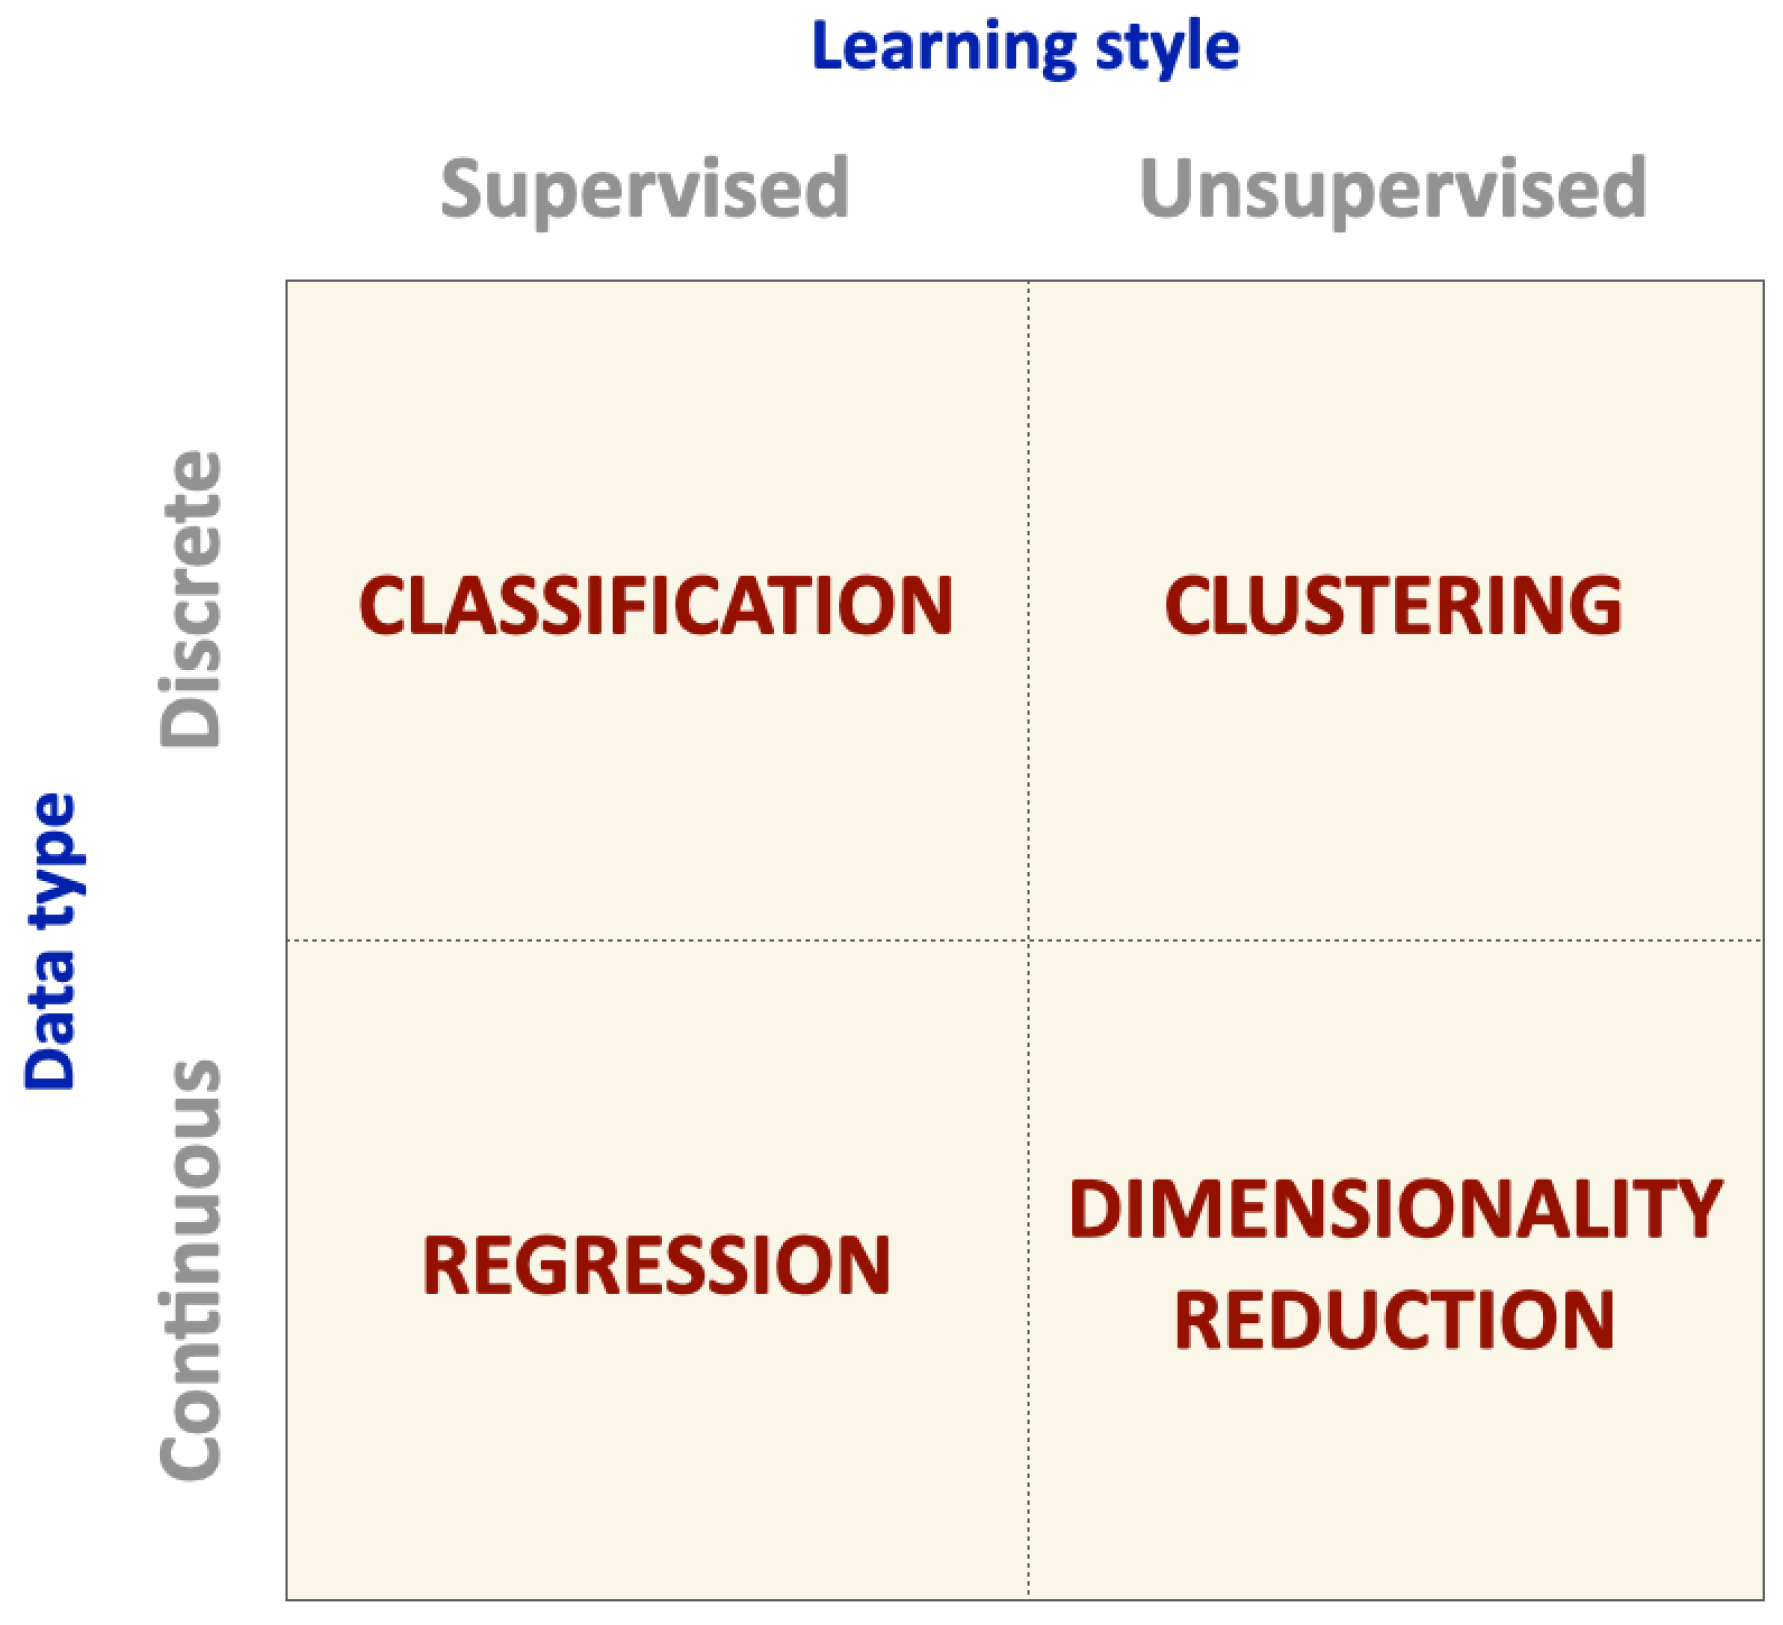
Figure 4.
Representative illustration of a confusion matrix.
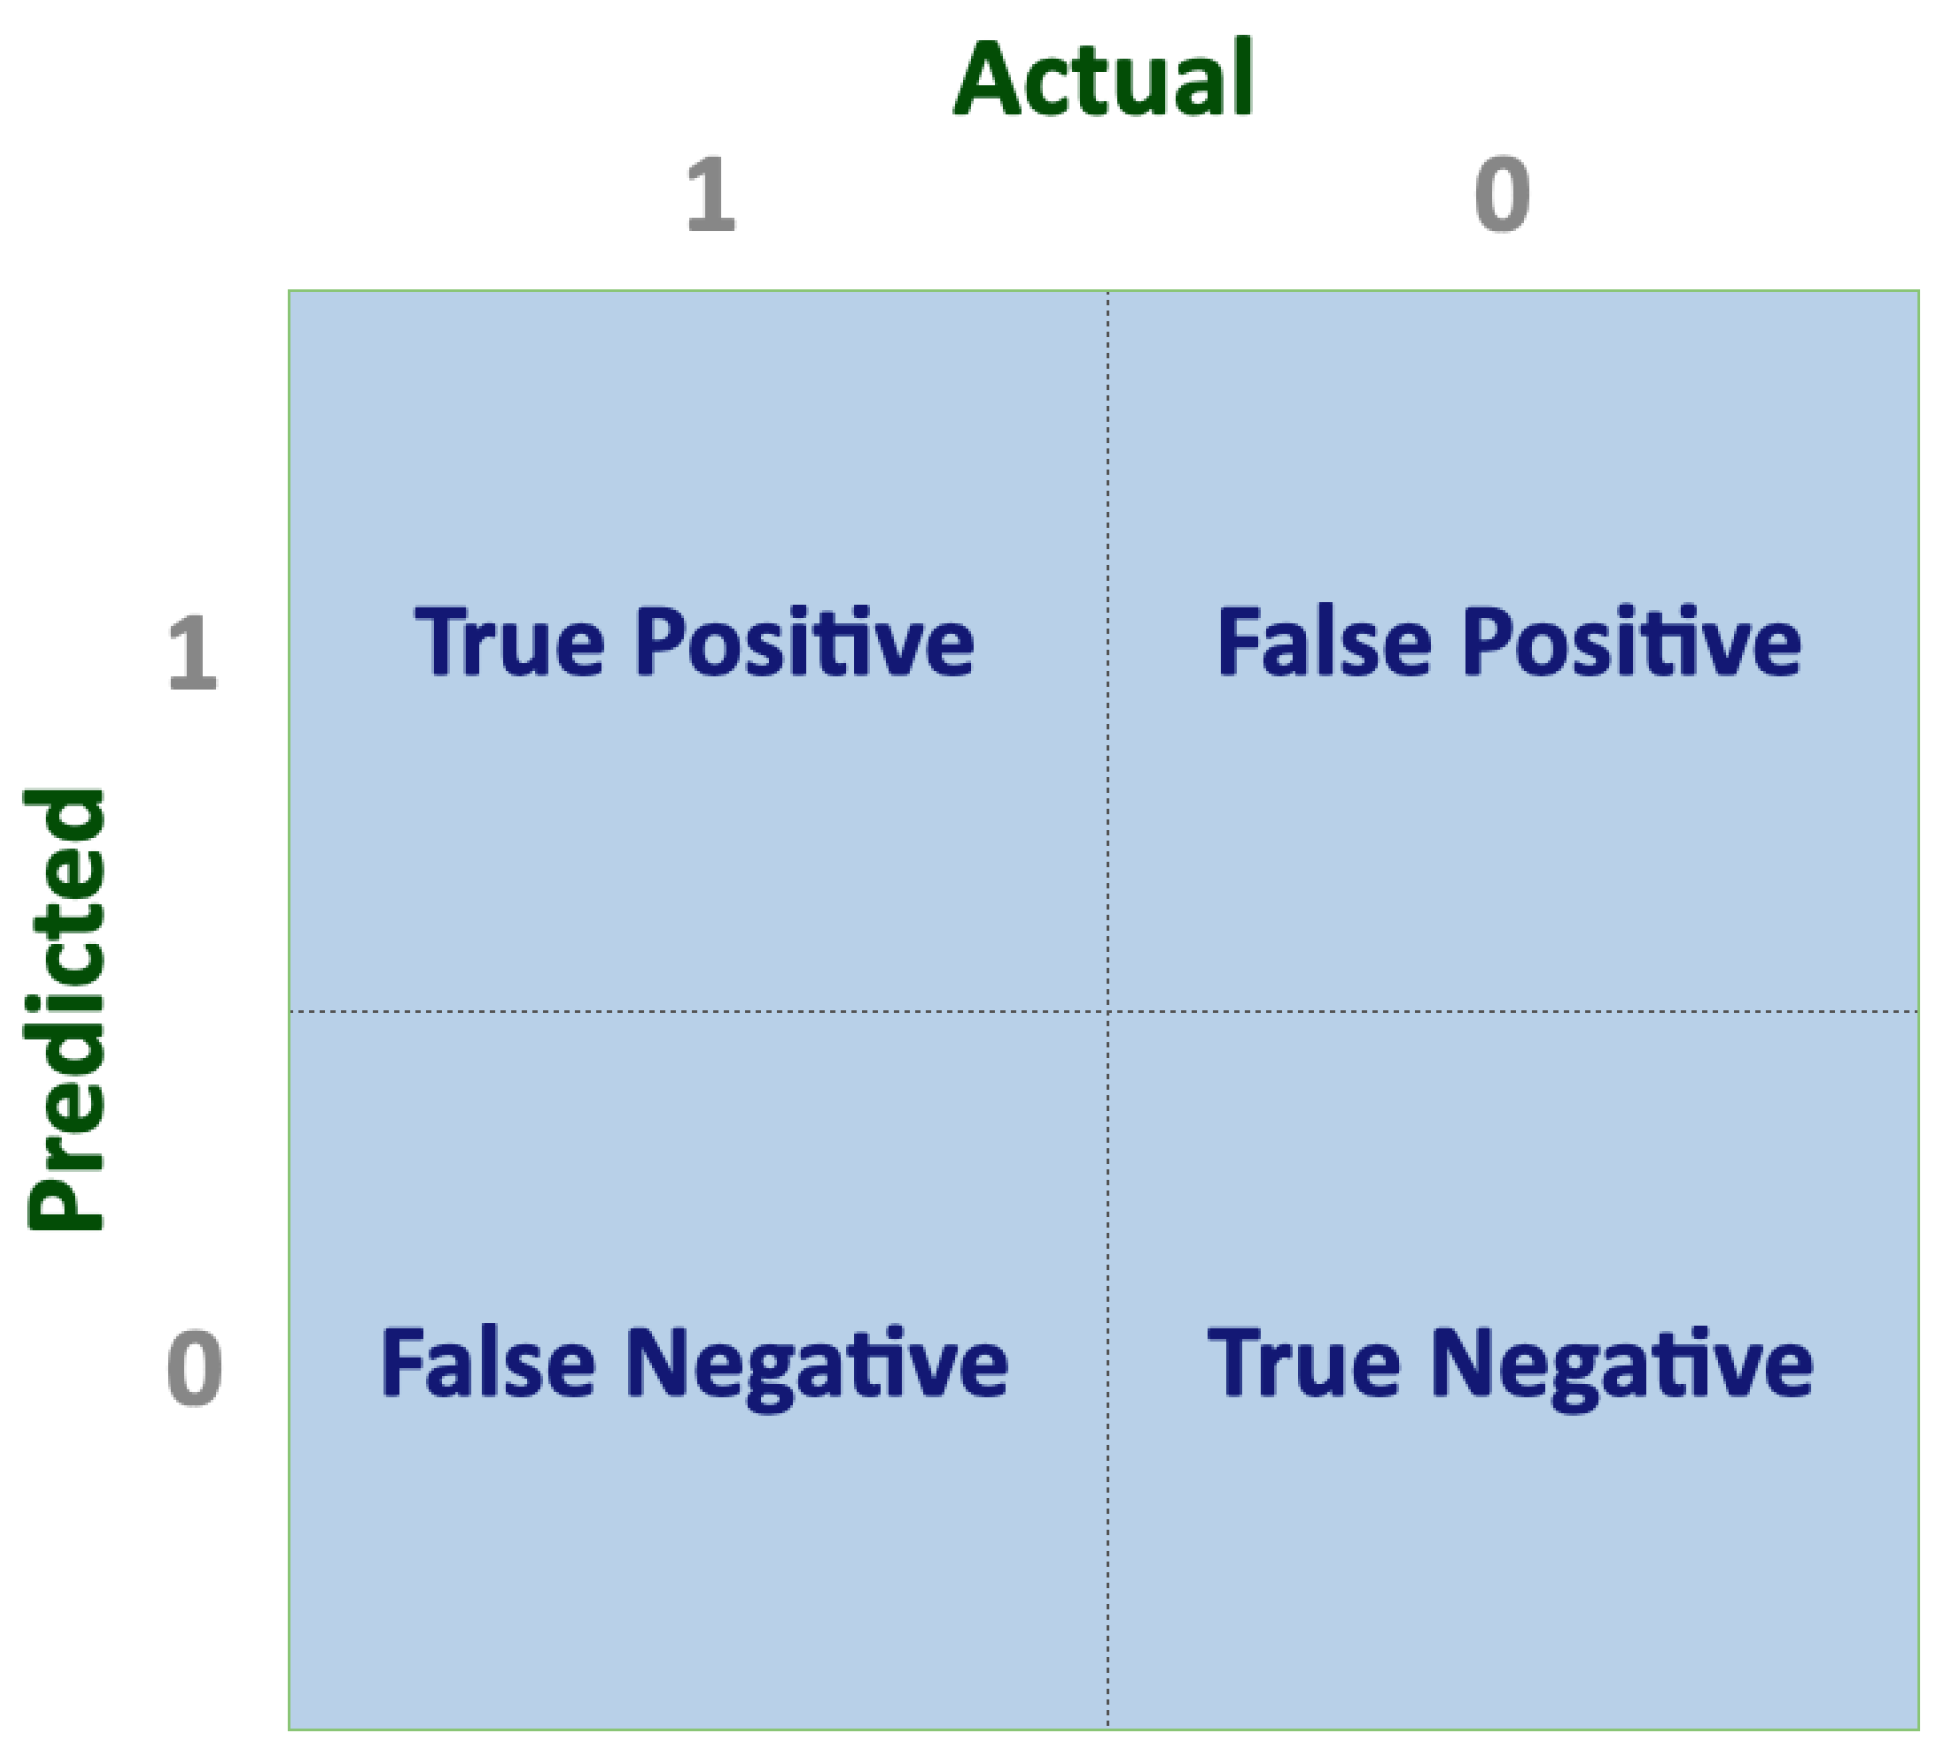
Figure 5.
Example of a Receiver Operating Characteristic Curve (ROC).
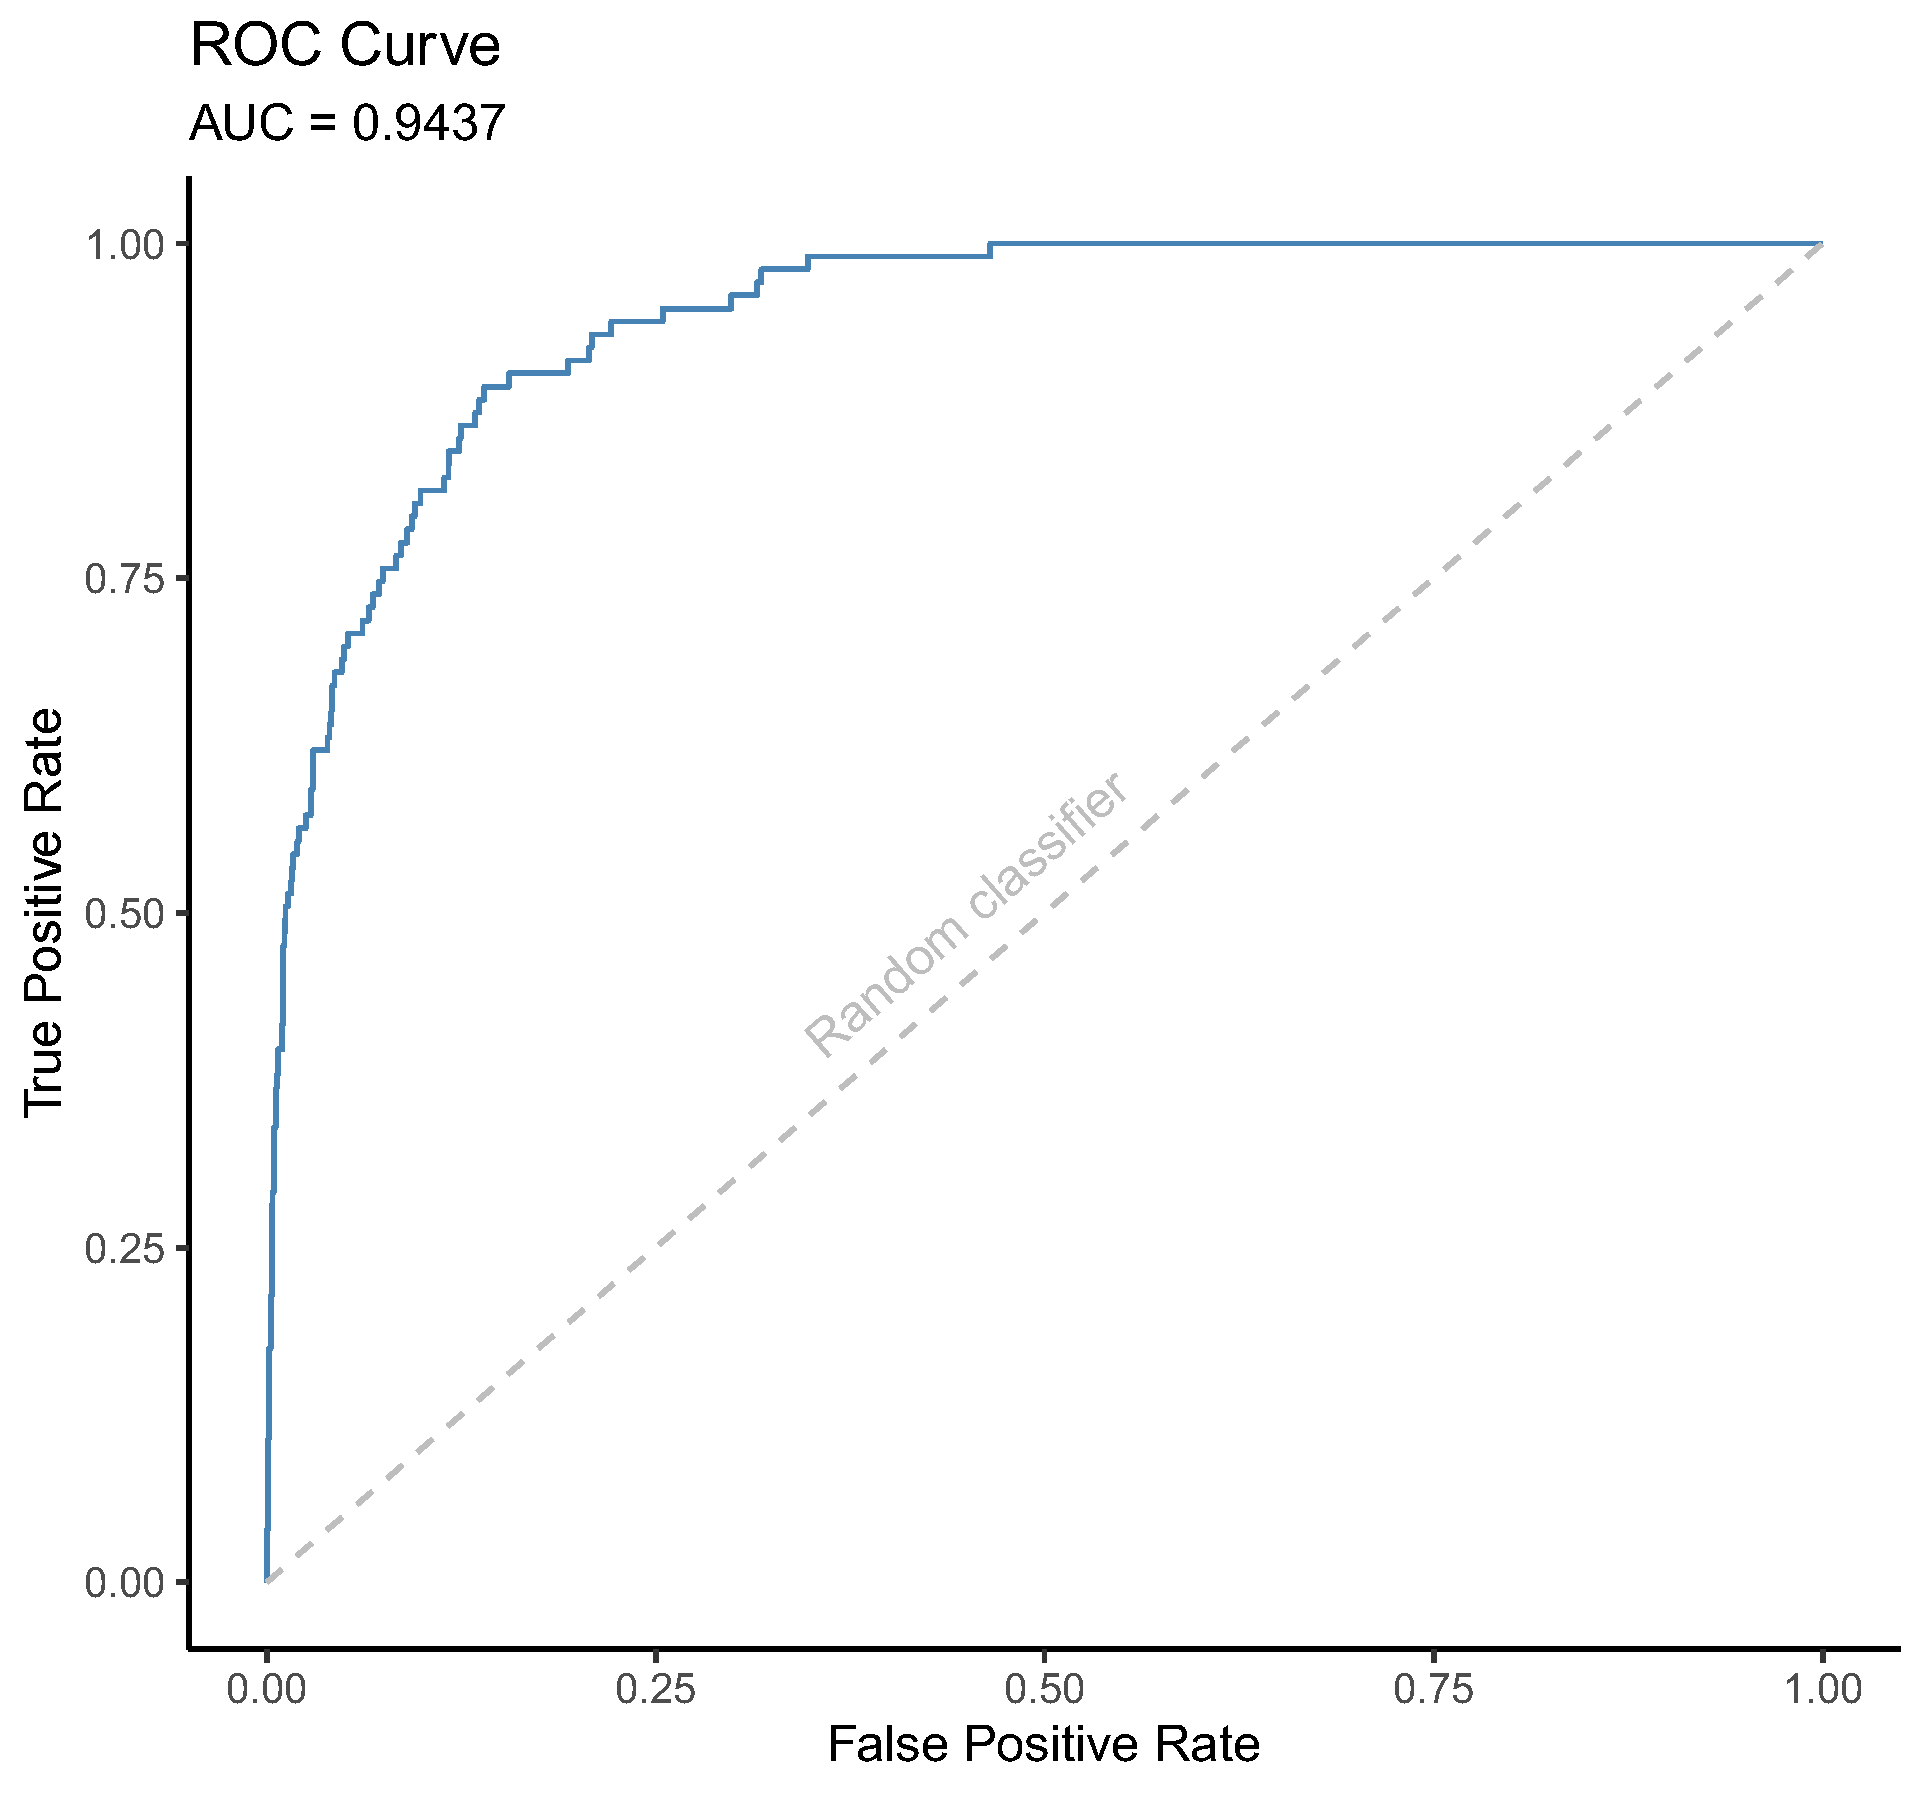

Table 1.
Modeling techniques used in the studies reviewed.
| Algorithm | Description |
|---|---|
| Regression analysis | Regression analysis is a statistical technique used to describe the relationships between variables. It allows predicting certain characteristics of output values based on input values [30]. It includes classical models such as simple and multiple linear regression, logistic regression, Generalized Linear Models (GLM), Generalized Additive Models (GAM), linear mixed models, polynomial regression, and time series. |
| Decision Tree (DT) |
A decision tree (DT) is a predictor that associates the features values with a label of a data instance by traveling from a root node to a leaf of a tree structure. Each node represents the splitting of the input space [29]. The feature or the value to be used for this splitting depends on the problem. A common splitting rule is the maximization of the Information Gain, which is the reduction in information entropy on splitted groups. When used for regression problems, it is called CART, an acronym for Classification and Regression Trees. |
| Random Forest (RF) | Random Forest (RF) is an ensemble classification model that combines several randomized decision trees. These decision trees are models that classify random subsets of the data where each subset contains responses of one class (either “yes” or “no”) [31]. Additionally, different trees can also use different sets of features to be trained or different random subsets of the data. For the RF outcome, the decision trees predictions are combined in a disambiguation method, as for example averaging [32] in the case of regression problems or major |
| AdaBoost | AdaBoost stands for Adaptive Boosting. It is also referred generically as Gradient Boosting. It combines sequentially the result of many weak decision trees. The first decision tree takes the raw data as input. The others receive as input the data weighted by the prediction errors of the previous classifier. Thus, each decision tree will adjust the prediction of the previous classifier. |
| k-Nearest Neighbors (k-NN) | The k-Nearest Neighbors (k-NN) algorithm looks at labeled points nearby an unlabeled point and based on this, to make a prediction of what the label should be [33]. Therefore, the learning strategy of k-NN is memorizing instead of finding relationships among features. |
| Support Vector Machine (SVM) | The objective of the Support Vector Machine (SVM) algorithm is to find the boundaries that maximize the distance of a multi-dimensional plane that separates the classes to be modeled. It uses the geometrical properties of the data to build these multi-dimensional boundaries between data points in the feature space belonging to different classes [34]. |
| Bayesian Networks (BN) | Bayesian networks (BN) are a type of probabilistic graphical model that uses Bayesian inference for probability computations. Bayesian networks aim to model conditional dependence, and therefore causation, by representing conditional dependence by edges in a directed graph [35]. The Naïve version assumes independence amongst the features, while the Tree-Augmented version also allows modeling the dependency amongst the features themselves. |
| Neural Networks (NN) | A Neural Network (NN) is a model that can be composed of three types of layers: an input layer, hidden layers, and an output layer. All layers are composed of nodes, which are sometimes called neurons. The outputs of each neuron are transformed by a nonlinear function and then are fed into the subsequent layers, with different weights along the connections between the neurons. The input layer takes in some numerical representation of the data. The output layer produces a prediction. The hidden layers perform transformations on the data which are usually nonlinear [36]. Various types of NN include Multilayer Perceptron (MLP), Back Propagation Neural Network (BPNN or NN for short, since this is the most used neural network), Probabilistic Neural Network (PNN), Recurrent Neural Network (RNN), Convolutional Neural Network (CNN). A CNN is a Deep Learning algorithm, which means that its network architecture usually needs a high number of hidden layers. The CNN takes in an input image, and, in these hidden layers, it assigns importance (learnable weights and biases) to various aspects/objects in the image. Then, this transformed image is used for the classification in the output layer. |
| Self-Organizing Maps (SOM) | Self-Organizing Maps (SOM) are a different type of Neural Network. They show only one layer with a predefined number of nodes. These nodes are linked to the input data and the value associated to these connections represent the distance between them. Thus, the SOM can be seen as a two-dimensional representation of the data, in which the data structure is preserved. The most common use of this algorithm is in clustering analysis, which requires a post-processing phase in which de SOM nodes will be clustered. |
| Clustering Algorithms | Clustering algorithms aim at dividing objects into groups (clusters) using measures of similarity and dissimilarity among the objects. The goal is to maximize the similarity among objects of the same cluster and, at the same time, maximize the dissimilarity among objects that belong to different clusters. Examples of these measures are one minus correlation or Euclidean distance. Some of the most frequently used clustering techniques include hierarchical clustering and k-means clustering. Hierarchical clustering (HC) creates a hierarchical tree-like structure of the data in which the length of the branches reflects the dissimilarity among the two clusters that it separates. The hierarchical tree is cutted at some point and the branches that are separated at this cut will define the clusters of the objects. The k-means clustering algorithm starts with random cluster centers (k), being the number of these clusters specified by the user [26]. The data points are assigned to the nearest cluster center. The center clusters are, then, redefined according to the new cluster configuration. This process is repeated iteratively until the cluster centers are no longer modified or until a maximum number of iterations. |
| Fuzzy logic | In Fuzzy Logic theory, the objects do not belong exclusively to one set (or class) or to another. Instead, they have a continuum of grades of membership to all classes, varying from 0 to 1 [37]. Fuzzy logic-based decision support systems usually follow three basic steps. First, the input values are fuzzified by the assignment of the membership functions. Second, a set of logic rules are applied to transform the input fuzzy values, generating the fuzzy output. Lastly, these outputs are defuzzified to generate the crisp system prediction. It is one of the methods developed to achieve the optimum solution situations where the input variables relate to the output variables by means of highly non-linear relationships. As a special case, the Adaptive Neuro Fuzzy Inference System (ANFIS) is a NN to map numerical inputs into an output through fuzzy-based rules. |
| Genetic Algorithms (GA) | Genetic Algorithms (GA) are search algorithms of the family of Evolutionary Algorithms based on the mechanics of natural selection and natural genetics [38]. The individuals are the possible solutions for the problem to be optimized. The set of these individuals that evolve together form the algorithm's population, and the fitness of the individuals is the criteria for a probabilistic selection of the solutions, in which the better the fitness, the higher the probability of that individual to be selected to the next generation. This type of stochastic search algorithm is often used in ML applications [39]. GAs are used in discrete spaces and find their applications where other gradient-based methods cannot be used. A GA is best suited to situations where information is a critical criterion for performance [24]. |
Table 2.
Summary of the most used performance metrics for classification tasks.
| Performance metric | Formula | Description |
|---|---|---|
| Accuracy | It is the ratio between the number of correct predictions versus the total number of inputs samples. | |
| Error rate | It is the ratio between the number of wrong predictions versus the total number of inputs samples. | |
| Sensitivity (Recall) | It measures the proportion of correctly identified positive examples. | |
| Specificity | It measures the proportion of correctly identified negative examples. | |
| Precision | It is the proportion of positive predictions that are correct. | |
| F1 score | It combines precision and sensitivity in a harmonic mean. |
Disclaimer/Publisher’s Note: The statements, opinions and data contained in all publications are solely those of the individual author(s) and contributor(s) and not of MDPI and/or the editor(s). MDPI and/or the editor(s) disclaim responsibility for any injury to people or property resulting from any ideas, methods, instructions or products referred to in the content. |
© 2023 by the authors. Licensee MDPI, Basel, Switzerland. This article is an open access article distributed under the terms and conditions of the Creative Commons Attribution (CC BY) license (http://creativecommons.org/licenses/by/4.0/).
Copyright: This open access article is published under a Creative Commons CC BY 4.0 license, which permit the free download, distribution, and reuse, provided that the author and preprint are cited in any reuse.


