
Submitted:
25 May 2023
Posted:
26 May 2023
You are already at the latest version
Abstract
Abstract: Background: Adolescents frequently self-report pain, according to epidemiological research. The knee is one of the sites where the pain is most common. One of the main factors contributing to the number of years people spend disabled and having substantial personal, societal, and economic burdens globally is musculoskeletal disorders. Insidious, slowly building onset that neither the adolescent nor the parent is aware of [5]. Patellofemoral Pain (PFP) is a clinical knee pain commonly affecting adolescents. In the present study, the authors aimed to estimate the frequency of knee pain in Saudi adolescents. Methods: This cross-sectional survey carried out from June to November 2022 included 676 adolescents, ages 10 to 18. The data are presented as frequencies and percentages for categorical variables. Analysis of variance (ANOVA) was used to compare means between groups, while the chi-square test was used for the comparison of categorical variables. Statistical significance was set at p < 0.05. Results: Adolescents were invited to take part in the study; 57.5% were female and 42.5% were male, and 68.8% were aged between 15 and 18. The prevalence of knee pain was considerably high among females (26%), while it was 19.2% among males. Moreover, age was a significant predictor for knee pain, and BMI was as well. We also found a significant difference between BMI classification and stiffness of the knee (p = 0.008). There is a difference between adolescents who do physical activities in leisure and difficulty bending (p = 0.03). Conclusion: Our study noted a high rate of knee pain among adolescents, so we need to raise awareness about risk factors. Adolescent knee pain can be prevented with conservative methods and some minor lifestyle/activity modifications.
Keywords:
knee pain
; frequency of knee pain
; exercise training
; physical activity
1. Introduction
Adolescents frequently self-report pain, according to epidemiological research. The knee is one of the sites where the pain is most common [1]. One of the main factors contributing to the number of years people spend disabled and having substantial personal, societal, and economical burdens globally is musculoskeletal disorders [2]. Half of the population over 50 years old suffers from knee pain, which is a frequent clinical complaint in the adult population [3]. Given that one in six people with knee pain will have at least one medical appointment each year and that one-third of them will be disabled, knee pain has a significant financial impact on the health system [4] .Even though knee pain is less common in adolescents, it is still a cause for concern because it can signify more severe pain later in life [4]. The adolescent may have knee pain due to an abrupt, traumatic injury or insidious, slowly building onset that neither the adolescent nor the parent is aware of [5]. Patellofemoral Pain (PFP) is a clinical knee pain that commonly affects adolescents and physically active adults. One of the most frequent causes of anterior knee pain in adolescents and young adults is patellofemoral pain syndrome (PFPS), which is characterized by peripatellar and retropatellar pain that worsens with certain postures and/or activities [6]. PFP and ongoing knee pain can be debilitating, causing adolescents to limit their physical activities. Reduced or discontinued physical leisure time activity due to knee pain may set off a chain reaction in which decreased physical activity leads to poor cardiorespiratory fitness, increased obesity, and poor health consequences [7,8] .Moreover, adolescents who abandon sports throughout adolescence may also be more likely to develop cardiometabolic illnesses and have sedentary lives as adults [7,8].
Due to the scarcity of published reports about the epidemiology of this disease or its associated factors, this study aims to estimate the frequency of knee pain in Saudi adolescents.
2. Subjects, Material, and Methods
2.1. Study Design
This cross-sectional observational study aims to estimate the prevalence of knee pain among Saudi adolescents. The study was conducted in Saudi Arabia, a country with a population of 35 million, including 11 million adolescents. Located in the far southwest of the Asian continent, the country is bordered on the west by the Red Sea and on the east by the Arabian Gulf, the United Arab Emirates, and Qatar. To the north, it is bordered by Kuwait, Iraq, and Jordan, while to the south, it is bordered by Yemen and the Sultanate of Oman.
2.2. Participants
The study employed a convenient sampling method to select participants. An online questionnaire was administered to participants or their parents using the Google Form platform between 30 October 2022 and 13 January 2022. Only investigators had access to the participants' responses to ensure data quality and frequent verification of the responses was conducted. The inclusion criteria for the study were Saudi adolescents aged 10 to 18 years residing in Saudi Arabia. Exclusion criteria included patients with known psychiatric illnesses, those who refused to participate, and non-Saudi adolescents living in Saudi Arabia. These criteria were established to ensure that the study sample was representative of the target population and to minimize the impact of confounding factors.
2.3. Questionnaire
A self-administered online questionnaire was developed based on previously published and pre-tested questionnaires [9]. The questionnaire consisted of three parts. The first part obtained socio-demographic characteristics of participants, such as age, gender, height, and weight. The second part assessed factors related to school, including how participants carried their backpacks and the weight of their backpacks, as well as their physical education activities at school and leisure-time physical activities. The third part of the questionnaire included an original tool to assess musculoskeletal pain over the previous 12 months and the Brazilian version of the Knee Injury and Osteoarthritis Outcome Score (KOOS) questionnaire to evaluate knee functional impairment [2]. The third part also included the Quality of Life Scale and a measure of knee pain symptoms.
2.4. Sample Size
The sample size for this study was calculated using a statistical formula for a cross-sectional survey design. The sample's anticipated population proportion (p) was estimated to be 50%. No previous studies have been conducted in the region on knee pain among adolescents, making it important to estimate the sample size required to ensure adequate statistical power. Additional parameters for sample size calculation included a 95% confidence interval (CI), a marginal error of 5%, and a nonresponse rate of 20%. Based on these parameters, the final sample size was 385 adolescents. However, 676 participants were recruited for the study to increase statistical power.
2.5. Statistical Analyses
Data management and analysis were performed in SPSS version 23 (IBM Corp., Armonk, NY, USA). Continuous variables were analyzed using the mean ± SD, and categorical variables were analyzed using the frequency and percentages. Analysis of variance (ANOVA) was used to compare means between groups, while the chi-square test was used for the comparison of categorical variables.
2.6. Ethical Considerations
The study protocol was approved by the internal review board of the Ethics Committee of King Abdullah International Medical Research Center. Approval No.: NRJ22J/209/08 (Date: 30 October 2022). Informed consent to participate was obtained before filling out the questionnaire via hospital records, while some information was obtained from the children’s parents, and each participant was provided with a serial number. All study participation was completely voluntary, and participants could withdraw from the study if they wished.
3. Results
Socio-Demographic Characteristics of the Participants
Adolescents were invited to take part in the study; 57.5% were girls, 68.8% were aged between 15 and 18, and 26.5% were from the northern region. In total, 65.7% of the participants had normal BMI/age ratings, half the participants (49.9%) took physical education at school, and 11.7% were considered to be physically active in their leisure time. In total, 29.3% carried more than 10% of their body weight in their backpacks, and 74.4% carried their backpacks on their backs (Table 1).
Walking was the most common situation that was reported by participants as associated with more knee pain (21.9%), followed by climbing and descending stairs (20.6%), while lying down was the least common (4.9%) (Figure 1).
Knee pain frequency among the adolescents assessed was 45.3% (n = 306), with no significant difference between boys and girls. Pain prevalence was found to increase as age increased, as participants aged 12–14 years and 15–18 years were found to be associated with more pain by 30% and 55%, respectively, in comparison to those who were aged 10 or 11 years (Table 2). Adolescents who had normal BMI reported less pain (40.5%; 95% CI: 1.147–3.298; p = 0.014) than those who were abnormal. Adolescents who carried ≤ 10% of their body weight in their backpacks reported less pain (42%; 95% CI: 1.364–2.665; p < 0.001). No significant differences we investigated in the other variable categories (Table 2).
Age, BMI, and backpack weight remained associated with the outcome in the adjusted analysis. Students aged between 15 and 18 years old were 52% more likely to have knee pain when compared to those aged under 12 (95% CI: 0.212–0.903; p = 0.025). Furthermore, those who are underweight, overweight, and obese were more likely to have knee pain than those who had a normal BMI (95% CI: 1.032–2.999; p = 0.038). Students who carried > 10% of their body weight in their backpacks were more likely to have knee pain than those who carried ≤ 10% of their body weight (95% CI: 1.494–3.039; p < 0.001). The remaining variables did not have a significant association with the outcome studied (Table 2).
There was a significant difference in knee pain between males and females. Females had significantly more knee pain compared to males (p = 0.003). There was also a significant difference as regards carrying the backpack—participants carrying their backpack on their back scored more pain (p = 0.02) in comparison to in the arms or hands (Table 3).
There was a significant difference in stiffness of the knee according to age (p = 0.013). We found a significant difference between BMI classification and stiffness of the knee (p = 0.008). We also found a significant difference between BMI classification and everyday activity (0.049). There was a difference between adolescents who undertake physical activities in leisure time and difficulty bending (p = 0.03.) There was also a significant difference between physical activities in leisure time and stiffness of the knee (p = 0.01). There was a significant difference in everyday activity and backpack weight (p = 0.004). We also found a significant difference between backpack weight and quality of life (p = 0.019). Significant differences were found between the means of handling the backpack and difficulty in bending (p = 0.03) (Table 4).
4. Discussion
Epidemiological studies show that adolescents regularly self-report pain. One of the areas where discomfort is most prevalent is the knee. Musculoskeletal problems are a significant contributor to the number of years that people are incapacitated and bear heavy personal, societal, and financial expenses on a global scale [9]. Therefore, a deeper comprehension of adolescent knee pain is necessary to develop knowledge of the condition’s causes and risk factors. In this study, we wanted to find out how common knee pain was among Saudi adolescents, and how it related to risk factors and functional impairment.
According to our study, the prevalence rate of knee pain in adolescents during the past 12 months was 45.3%, which mirrors a study done by Bhakti in India in 2021, where the prevalence of knee pain in adolescents was 43.3% [10]. While another study conducted in Brazil on adolescents in 2015 found that the percentage of knee pain they had was 22.6%. [11], and one studying the rate of knee pain among adolescents in Finland in 1995, found 18.5% [12]. Also another study, among adolescents between the ages of 13 and 17 in England in 1984, there was a 30% frequency of self-reported knee pain [13]. According to another study in Denmark in September 2011, the results were similar [14]. The rate of knee pain among adolescents was 27%.[15], while another study that was conducted in Denmark , found the rate of knee pain among adolescents to be 28% [16], while in a study conducted in Canada, the prevalence rate of knee pain among adolescents was lower than in our study and in other studies, at 7.4% [17]. We believe that the reason for the discrepancy in percentages is due to the race and the sample and the lack of knowledge of symptoms of knee pain, and therefore we need more studies on the subject.
In the multivariate analysis of this study, there was no correlation between the outcome and gender. In a related study conducted in Brazil [11], it was discovered that there was no difference in the prevalence of knee pain according to gender, but that girls were statistically more functionally impaired than boys. Yet another study that was conducted in Canada derived similar results [17]. We think that the measurement of functional impairment may be the source of this disparity between the presence of this association and its absence. The high frequency of symptoms certain symptoms can be used to explain this, such as the following: when examining the prevalence of knee discomfort among adolescent females, researchers looked for symptoms such as edema, fissures, trouble bending, stiffness when straightening, and greater difficulty in performing activities of daily living, sports, and leisure activities. These were also measured in 2368 German youth by Spahn et al. [18].
Our findings indicate that the prevalence of knee pain increased over time as the age of the teenagers evaluated increased. Previous studies of adolescents in Brazil and in Finland [11,12] support these conclusions.
When comparing the presence of musculoskeletal pain among children and adolescents, several studies found a significantly higher prevalence of knee pain in those who were overweight [17,19,20]. Our study agrees closely with others, as our results found a correlation between the presence of knee pain and obesity among adolescents. On the other hand, another study found that body weight has no impact on knee pain [11]. More studies are needed on this area.
It has been demonstrated that participating in physical education in school can help prevent the beginning of knee pain. Similar to this, although there was no significant difference in these categories, teenagers with knee discomfort who did not participate in physical education showed worse functional impairment of the knee joint. According to certain studies, persistent musculoskeletal pain and physical inactivity are related [21]. Our study did not find a relationship between knee pain and physical activity at school, and the findings of the Brazilian study are similar to ours [11]. Investments must be made in studies with various designs that can determine whether the pain is a cause or a result of inactivity, because there is no agreement regarding the relationship between engaging in physical activity and the presence of knee pain.
According to our study, there was no relationship between knee pain and the performance of physical activities in leisure time, which is consistent with the Brazilian study [11].
Our research found no links between a backpack’s extra weight and knee pain, but it uncovered links between how the rucksack is carried and the presence of knee pain. This is contrary to the results of another study[9] . Although there was no significant difference in the mean values of these items, there was a trend for greater functional impairment among adolescents with knee pain who carried more weight in their backpacks and who carried it with their arms or hands. The findings are conflicting as to whether the additional weight of a backpack may be a risk factor for knee joint pain; according to certain studies, carrying heavy burdens affects the lower extremity joints, alters walking kinematics, increases quadriceps muscle fatigue, increases contact fatigue with the ground,and impairs the body’s ability to absorb stress during walking [22,23].
Our study calculated the intensity of pain and found that there is a relationship between the severity of knee pain and gender in adolescents, as there was a rise in the intensity of pain for women compared to men, which is mirrored in the findings of others [11,24]. Additionally, our study found that there is a relationship between the intensity of pain and the style of carrying the backpack in adolescents, which is also found elsewhere [24].
According to our study, there was an effect of BMI on the quality of life and physical activities of adolescents, and we also found that there is a relationship between knee pain symptoms and physical activities, which is consistent with several previous studies[25,26,27,28]. However, another prior study found the opposite of this relationship [11].
Our study also found that there is a relationship between knee pain symptoms, weight-bearing, and quality of life, as carrying the backpack can cause discomfort in adolescents, and this impacts their growth and development [24].
5. Limitations
Despite being one of the few studies in Saudi Arabia to report the prevalence of knee pain, this study has some limitations. Because it is a cross-sectional study, there may have been limited time to cover all possible causes and other influencing factors, and future research can examine factors associated with knee pain. Moreover, the study uses a subjective method of data collection (self-questionnaire), and the responses collected via this method may be affected by the respondents’ psychological and emotional state, which may affect the outcome of the study. Finally, the generalizability of the study results may be limited due to the population being chosen purposefully from a single location and within a small scale. Thus, broader national research should be conducted to evaluate other factors associated with knee pain, and educational programs designed to reduce knee pain risk factors among adolescents could be developed.
6. Conclusions
Our study noted a high rate of knee pain among adolescents,and age was found to be a factor in the occurrence of pain, with participants aged 12 to 14 years and 15 to 18 years having 30% and 55% more pain, respectively, than those aged 10 or 11 years and also adolescents who had normal BMI reported less pain. There was a significant difference in knee pain between males and females. Females had significantly more knee pain compared to males .The effect of the quality of life of adolescents who have knee pain due to backpack weight bags so we need to raise awareness about risk factors. Adolescent knee pain can be prevented with conservative methods and some minor lifestyle/activity modifications. Initial treatment often involves reducing those activities that cause knee pain. Physical therapy can also be undertaken, including stretching the quadriceps muscles and undertaking exercises to improve strength, range of motion and flexibility.
Author Contributions
Writing of the first draft: H.D. and A.H.A. Data analysis: F.H. and A.H.A. Editing, writing and review, and revising the manuscript: A.H.A. and M.K. Participation in data analysis, reviewing the manuscript, concept, and design of the study:A.A F.H., M.A., S.H., N.B., A.S., K.H., A.A., M.K., A.H.A. and H.D. All authors have read and agreed to the published version of the manuscript.
Funding
This research received no external funding.
Institutional Review Board Statement
The study was approved by the internal review board of the Ethics Committee of King Abdullah International Medical Research Center. Approval No.: NRJ22J/209/08 (Date: 30 October 2022).
Informed Consent Statement
Informed consent was obtained from all subjects involved in the study.
Data Availability Statement
The data presented in this study are available on request from the corresponding author.
Acknowledgments
The authors are immensely thankful to the data collectors and the participants of this study.
Conflicts of Interest
The authors declare no conflict of interest.
References
- King S, Chambers CT, Huguet A, MacNevin RC, McGrath PJ, Parker L et al. T epidemiology of chronic pain in children and adolescents revisited: A systematic review. P [Internet]. 2011, 152, 2729–2738. [Google Scholar]
- Murray CJL, Vos T, Lozano R, Naghavi M, Flaxman AD, Michaud C, et al. Disability-adjusted life years (DALYs) for 291 diseases and injuries in 21 regions 1990-2010: A systematic analysis for the Global Burden of Disease Study 2010. Lancet. 2012, 380, 2197–2223. [Google Scholar] [CrossRef] [PubMed]
- Jinks C, Jordan K, Ong BN CPA brief screening tool for knee pain in primary care (KNEST). 2. R from a survey in the general population aged 50 and over. R 2004, 43, 55–61. [Google Scholar]
- Masiero S, Carraro E, Sarto D, Bonaldo L FCH service use in adolescents with non-specific musculoskeletal pain. APIJP 2010, 99, 1224–1228.
- El-Metwally A, Salminen JJ, Auvinen A, MacFarlane G MMR factors for development of non-specific musculoskeletal pain in preteens and early adolescents: A prospective 1-year follow-up study. BMD 2007, 8, 1–8.
- Mølgaard C, Rathleff MS, Simonsen O. Patellofemoral pain syndrome and its association with hip, ankle and foot function in 16-to 18-year-old high school students. JAPMA 2011, 101, 215–222. [Google Scholar] [CrossRef]
- Stodden DF, Langendorfer SJ, Goodway JD, Roberton MA, Rudisill ME, Garcia C et al. A developmental perspective on the role of motor skill competence in physical activity: A emergent relationship. Q 2008, 60, 290–306. [Google Scholar]
- Dahn JR AFE and well-being: a review of mental and physical health benefits associated with physical activity. COP [Internet]. 2005, 18, 189–193.
- Zilberman, ML. Brazilian Journal of. Brazilian J Phys Ther [Internet]. 2011, 1, 1–13. [Google Scholar] [CrossRef]
- Nunes G, Castro LV, Wageck B, Kume V, Chiesa GS NMT into P of questionnaires to assess knee injuries. AOB 2013, 21, 288–294.
- Naik BM, Akre M, Kumar A. Prevalence of Knee Pain in Football Players of Various Age Group. Int J Heal Sci Res. 2021, 11, 299–305. [Google Scholar] [CrossRef]
- Vahasarja, V. Prevalence of chronic knee pain in children and adolescents in northern Finland. Acta Pædiatrica. 1995, 84, 803–805. [Google Scholar] [CrossRef] [PubMed]
- Fairbank JC, Pynsent PB, van Poortvliet JA PHM factors in the incidence of knee pain in adolescents and young adults. JBJSB 1984, 66, 685–693.
- Rathleff CR, Baird WN, Olesen JL, Roos EM, Rasmussen S RMH and knee strength is not affected in 12-16 year old adolescents with patellofemoral pain-a cross-sectional population-based study. PlO 2013, 8, e79153.
- Nimon G, Murray D, Sandow M GJN history of anterior knee pain: a 14-to 20-year follow-up of nonop-erative management. JPO 1998, 18, 118–122.
- Rathleff CR, Olesen JL, Roos EM, Rasmussen S, Rathleff MS. Half of 12-15-year-olds with knee pain still have pain after one year. Dan Med J. 2013, 60, 1–5. [Google Scholar]
- Borschneck G, St. John L, Brundage K, Borschneck DP. Cross-Sectional Risk Factors of Anterior Knee Pain in Adolescents. Front Pain Res. 2021, 2, 1–7. [Google Scholar] [CrossRef] [PubMed]
- Spahn G, Schiele R, Langlotz A, Jung R. Prevalence of func- tional pain of the back the hip and the knee in adolescents. R of a cross-sectional study. DMW 2004, 129, 2285–2290. [Google Scholar]
- Fortunato LM, Kruk T, Lima Júnior E. Relationship between obesity and musculoskeletal disorders: systematic review and meta-analysis. Res Soc Dev. 2021, 10, e119101320212. [Google Scholar] [CrossRef]
- Holden S, Kasza J, Winters M, van Middelkoop M, Rathleff MS. Prognostic factors for adolescent knee pain: an individual participant data meta-analysis of 1281 patients. Pain. 2021, 162, 1597–1607. [Google Scholar] [CrossRef]
- SaesMO, SoaresMD, Mucillo-BaischA SF à dor musculoesquelética em escolares da rede pública municipal no extremo sul do BRBSMI [online]. 2014, 14, 211-218.
- Simpson KM, Munro BJ, Steele JR. Effect of load mass on posture heart rate and subjective responses of recreational, Ergon. female hikers to prolonged load carriage. A, 2011, 42, 403–410. [Google Scholar]
- Simpson KM, Munro BJ SJB load affects lower, Prolonged limb muscle activity patterns of female hikers during, load carriage. JEK. 2011, 21, 782–788.
- Salim N, vishal J. Prevalence and Factors Associated with Musculoskeletal Pain among Secondary School Students. Int J Musculoskelet Pain Prev. 2021, 6, 519–528. [Google Scholar] [CrossRef]
- Kim N, Browning RC, Lerner ZF. The effects of pediatric obesity on patellofemoral joint contact force during walking. Gait Posture [Internet]. 2019, 73, 209–14. [Google Scholar] [CrossRef] [PubMed]
- Makdessi M, Barton C, Goro P, Dundules K, Francis M, Crossley KM, et al. Do comorbidities impact on quality of life and pain in patients with knee osteoarthritis? Osteoarthr Cartil [Internet]. 2020, 28, S356. [Google Scholar] [CrossRef]
- Al-Nbaheen, MS. Impact of weight loss predictors in severe-morbid obesity patients in the Saudi population. Saudi J Biol Sci [Internet]. 2020, 27, 2509–2513. [Google Scholar] [CrossRef]
- Tamura LS, Cazzo E, Chaim EA, Piedade SR. Influence of morbid obesity on physical capacity, knee-related symptoms and overall quality of life: A cross-sectional study. Rev Assoc Med Bras. 2017, 63, 142–147. [Google Scholar] [CrossRef]
Figure 1.
Presenting the most common situations that were reported to be associated with more knee pain.
Figure 1.
Presenting the most common situations that were reported to be associated with more knee pain.
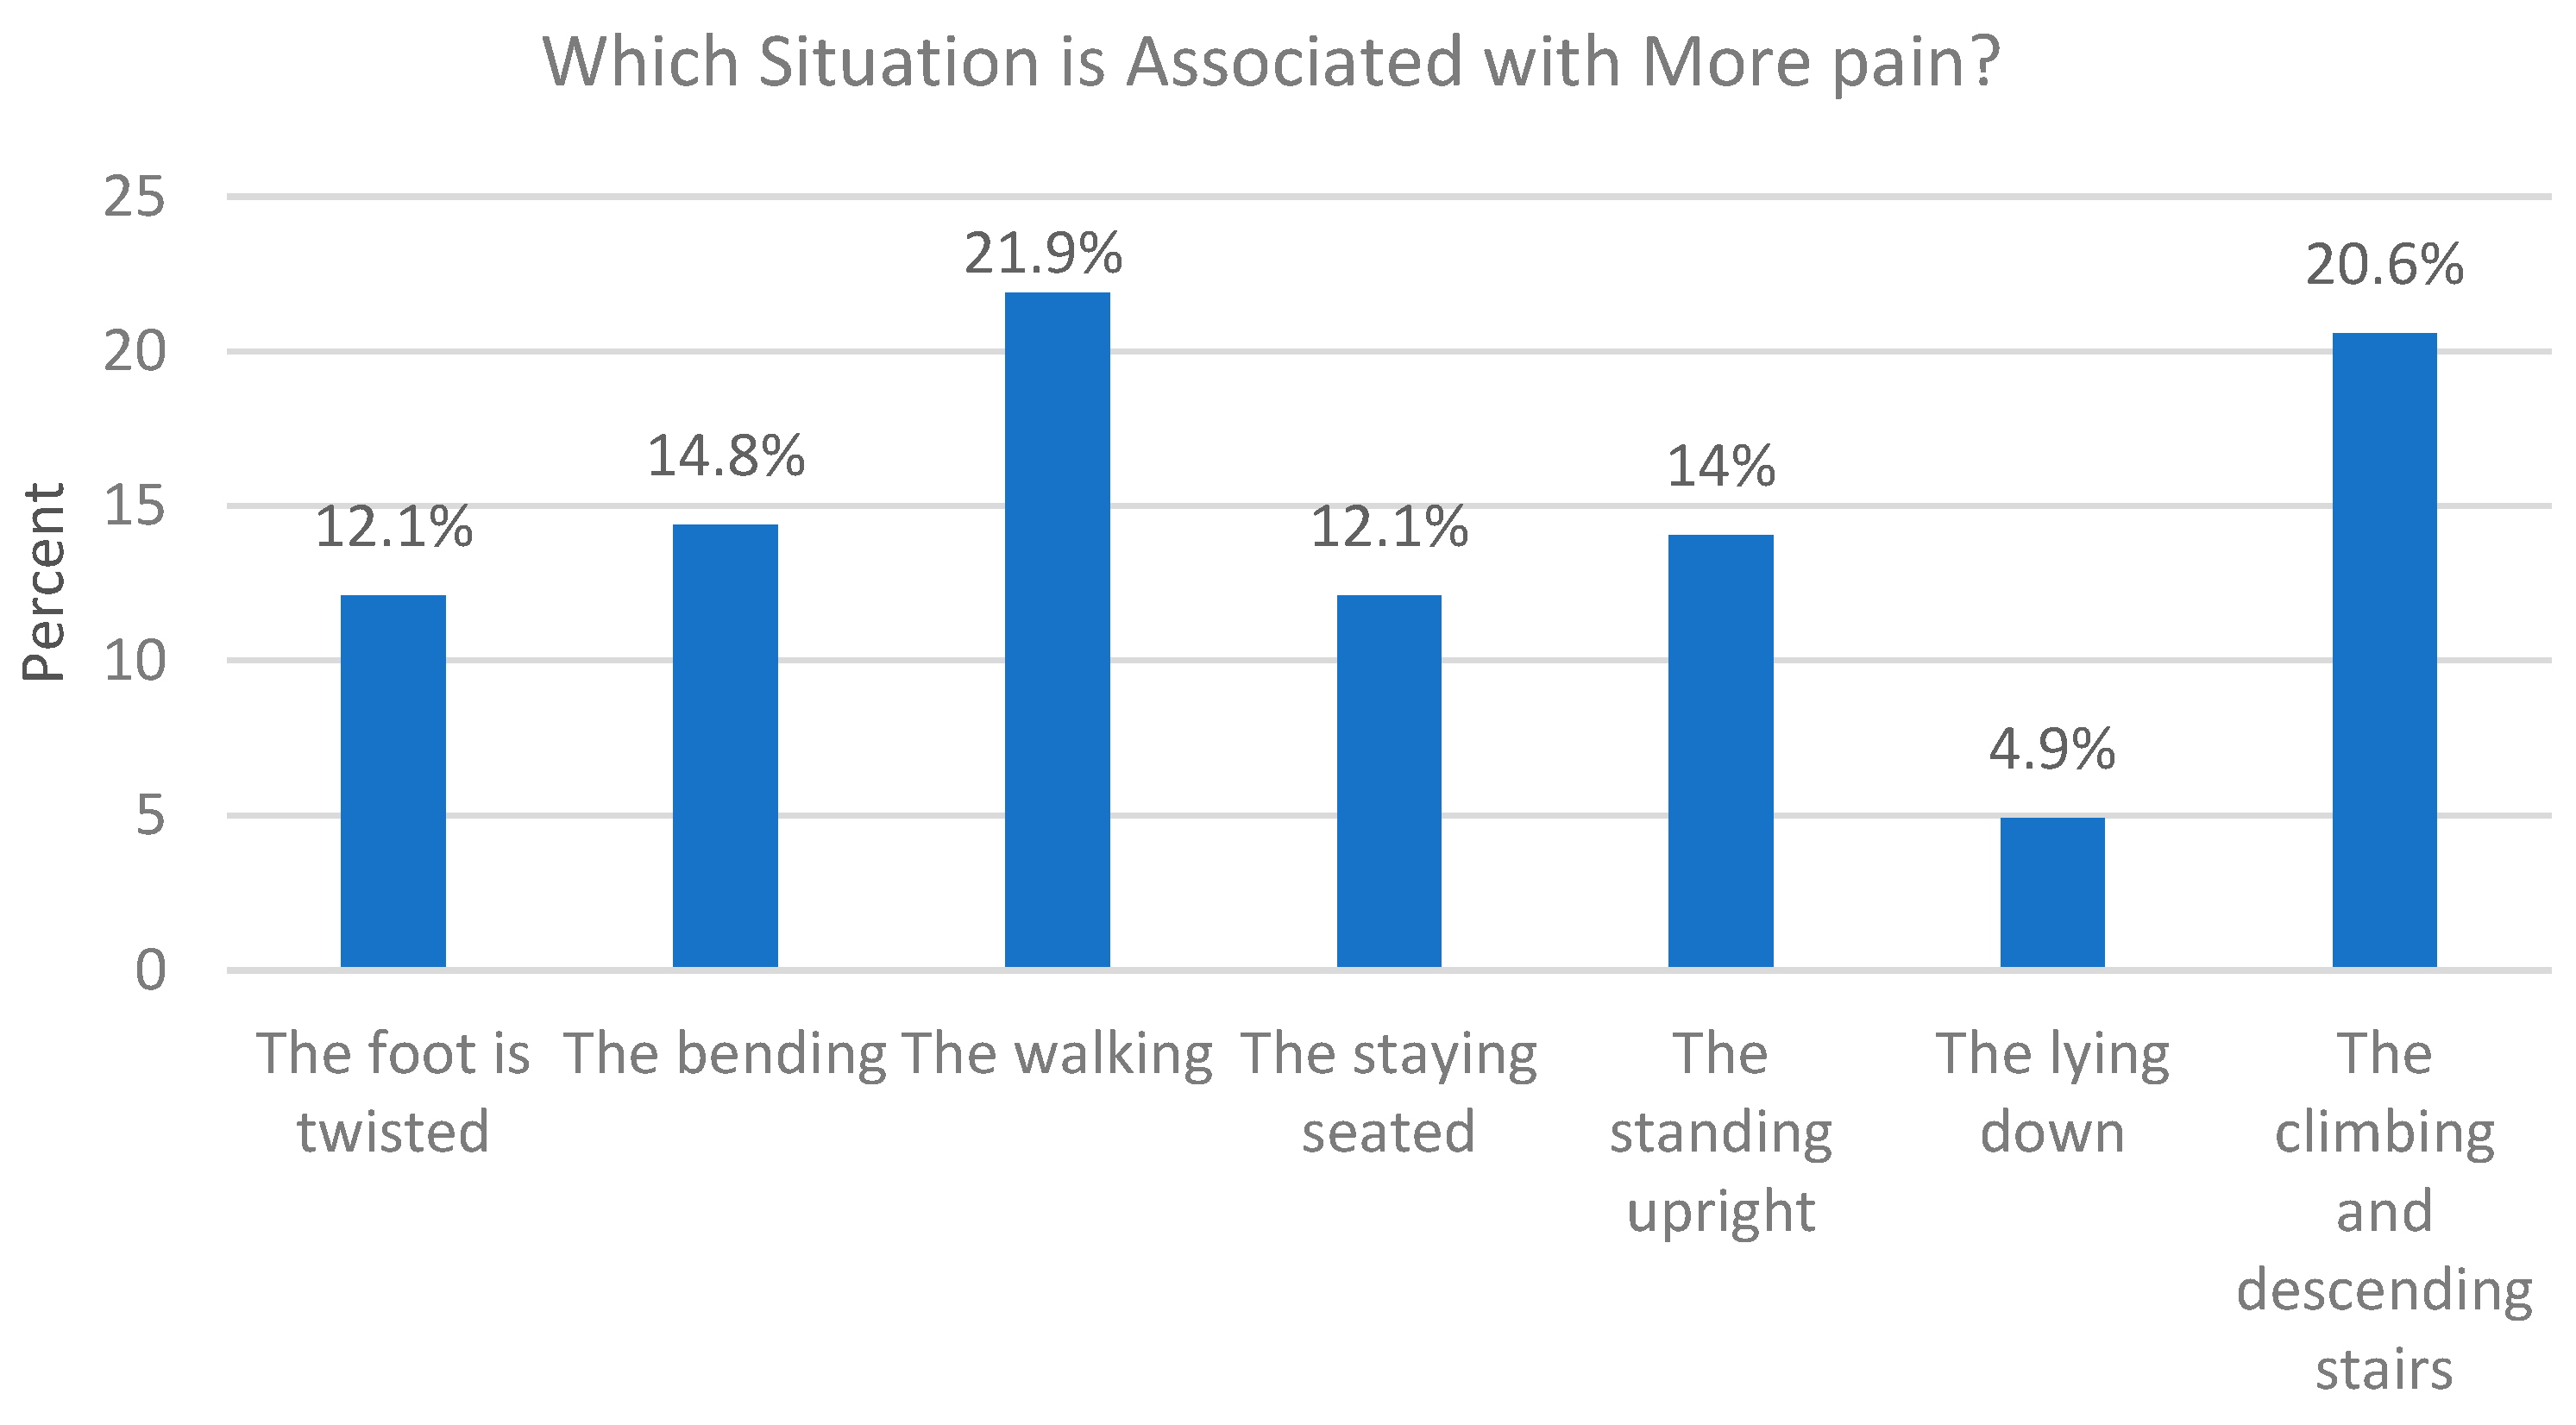

Table 1.
Socio-demographic characteristics of the participants N = 676.
| Variable | N | % |
|---|---|---|
| Gender | ||
| Male | 287 | 42.5% |
| Female | 389 | 57.5% |
| Age | ||
| 10–11 | 43 | 6.4% |
| 12–14 | 168 | 24.9% |
| 15–18 | 465 | 68.8% |
| Place of residence | ||
| The north region | 179 | 26.5% |
| The eastern region | 64 | 9.5% |
| The central region | 141 | 20.9% |
| The western region | 127 | 18.8% |
| The south region | 165 | 24.4% |
| BMI | ||
| Underweight | 64 | 9.5% |
| Normal | 444 | 65.7% |
| Overweight | 118 | 17.5% |
| Obese | 50 | 7.4% |
| Physical education at school | ||
| Yes | 337 | 49.9% |
| No | 339 | 50.1% |
| Physical activity in leisure time | ||
| Less than 6 h | 218 | 32.2% |
| More than 6 h | 79 | 11.7% |
| Insufficiently active | 379 | 56.1% |
| Backpack weight | ||
| >10% body weight | 198 | 29.3% |
| ≤10% body weight | 478 | 70.7% |
| Form of carrying the backpack | ||
| Back | 503 | 74.4% |
| Arms/hands | 173 | 25.4% |
Table 2.
Binary logistic regression analysis for the frequency of knee pain with several predictor variables.
Table 2.
Binary logistic regression analysis for the frequency of knee pain with several predictor variables.
| Knee Pain Frequency , Crude and Adjusted Analysis of the Association between the Outcome and Selected Variables among Adolescents (n = 676) | |||||||||
|---|---|---|---|---|---|---|---|---|---|
| Predictor Variable | Knee pain & | Crude analysisOR (95% CI) | p-value * | Adjusted analysisOR (95% CI) # | p-value * | ||||
| Yes | No | ||||||||
| n = 306 | 45.3% | n = 370 | 54.7% | ||||||
| Gender | |||||||||
| Male (ref) | 130 | 19.2 | 157 | 23.2 | 1 | 1 | |||
| Female | 176 | 26 | 213 | 31.5 | 1.002 (0.738–1.3610) | 0.989 | 1.146 (0.792–1.658) | 0.468 | |
| Age | |||||||||
| 10–11 (years) (ref) | 13 | 1.9 | 30 | 4.4 | 1 | 1 | |||
| 12–14 (years) | 64 | 9.5 | 104 | 15.4 | 0.704 (0.342–1.449) | 0.341 | 0.848 (0.398–1.809) | 0.67 | |
| 15–18 (years) | 229 | 33.9 | 236 | 34.9 | 0.447 (0.227–0.878) | 0.019 * | 0.483 (0.212–0.903) | 0.025 * | |
| BMI | |||||||||
| Underweight (ref) | 35 | 5.2 | 29 | 4.3 | 1 | 1 | |||
| Normal | 170 | 25.1 | 274 | 40.5 | 1.945 (1.147–3.298) | 0.014 * | 1.759 (1.032–2.999) | 0.038 * | |
| Overweight | 69 | 10.2 | 49 | 7.2 | 0.857 (0.464–1.583) | 0.622 | 0.749 (0.400–1.402) | 0.366 | |
| Obese | 32 | 4.7 | 18 | 2.7 | 0.679 (0.318–1.450) | 0.317 | 0.567 (0.261–1.232) | 0.152 | |
| Physical education at school | |||||||||
| Yes (ref) | 141 | 20.9 | 196 | 29 | 1 | 1 | |||
| No | 165 | 24.4 | 174 | 25.7 | 0.759 (0.560–1.028) | 0.075 | 0.785 (0.539–1.144) | 0.208 | |
| Physical activity in leisure time | |||||||||
| Less than 6 h | 91 | 13.5 | 127 | 18.8 | 1.185 (0.846–1.028) | 0.324 | 1.143 (0.799–1.636) | 0.465 | |
| More than 6 h | 41 | 6.1 | 38 | 5.6 | 0.787 (0.484–1.278) | 0.333 | 0.741 (0.442–1.241) | 0.254 | |
| Insufficiently active (ref) | 174 | 25.7 | 205 | 30.3 | 1 | 1 | |||
| Backpack weight | |||||||||
| >10% body weight (ref) | 112 | 16.6 | 86 | 12.7 | 1 | 1 | |||
| ≤10% body weight | 194 | 28.7 | 284 | 42 | 1.906 (1.364–2.665) | <0.001 * | 2.131 (1.494–3.039) | <0.001 * | |
| Form of carrying the backpack | |||||||||
| Back (ref) | 218 | 32.2 | 284 | 42.2 | 1 | 1 | |||
| Arms/hands | 88 | 13 | 85 | 12.6 | 0.739 (0.523–1.045) | 0.087 | 0.790 (0.539) 4–1.16 | 0.239 | |
* p-value of 0.05 or less was considered to be a significant value; # Adjusted Odds Ratio (AOR) was calculated through adjustment with all cofounders (demographic data, and the rest of the predictor variables). & The predicted probability of membership was set by SPSS for NO pain.
Table 3.
One-way ANOVA and t-independent tests were run to estimate the significant association between the means of a dependent continuous variable (pain score) and independent (demographic) variables.
Table 3.
One-way ANOVA and t-independent tests were run to estimate the significant association between the means of a dependent continuous variable (pain score) and independent (demographic) variables.
| Pain Score | |||
|---|---|---|---|
| Variable | Mean | Standard Deviation | p Value * |
| Gender | |||
| Male | 42.38 | 20.75 | 0.003 * |
| Female | 49.48 | 20.59 | |
| Age | |||
| 10–11 | 41.53 | 16.25 | 0.068 |
| 12–14 | 41.71 | 23 | |
| 15–18 | 48 | 20.38 | |
| BMI | |||
| Underweight | 49.71 | 22.29 | 0.297 |
| Normal | 47.17 | 20.21 | |
| Overweight | 42.46 | 19.88 | |
| Obese | 47.81 | 24.84 | |
| Physical education at school | |||
| Yes | 45.53 | 21.36 | 0.46 |
| No | 47.28 | 20.58 | |
| Physical activity in leisure time | |||
| Less than 6 h | 45.16 | 20.4 | 0.70 |
| More than 6 h | 46.82 | 22.07 | |
| Insufficiently active | 47.06 | 21.01 | |
| Backpack weight | |||
| >10% body weight | 49.28 | 21.67 | 0.07 |
| ≤10% body weight | 44.84 | 20.36 | |
| Form of carrying the backpack | |||
| Back | 48.21 | 20.45 | 0.02 * |
| Arms/hands | 42.15 | 21.57 | |
* The alpha criterion was considered significant at 0.05 or less. # The maximum score was 100 and the minimum was 0.
Table 4.
Pearson chi-square and Fisher’s exact tests were used for measuring the statistically significant associations of difficulty bending, stiffness of the knees, everyday activities, and quality of life with socio-demographic features.
Table 4.
Pearson chi-square and Fisher’s exact tests were used for measuring the statistically significant associations of difficulty bending, stiffness of the knees, everyday activities, and quality of life with socio-demographic features.
| Variable | Difficulty in Bending | Stiffness of The Knees | Everyday Activity | Quality of Life | |||||||||||||
|---|---|---|---|---|---|---|---|---|---|---|---|---|---|---|---|---|---|
| Yes, More Affected n = 18, 100% |
Yes, Less Affected n = 154 |
No n = 134 |
p-Value * | Yes, More Affected n = 17, 100% |
Yes, Less Affected n = 113, 100% |
No n = 176, 100% |
p-Value * | Yes, More Affected n = 17, 100% |
Yes, Less Affected n = 136, 100% |
No n = 153, 100% |
p-Value * | Yes, More Affected n = 30, 100% |
Yes, Less Affected n = 147, 100% |
No n = 129, 100% |
p-Value * | ||
| Gender | Male | 9 (50%) | 67 (43.5%) | 54 (40.3%) | 0.68 | 9 (52.9%) | 52 (46%) | 69 (39.2%) | 0.34 | 10 (58.8%) | 56 (41.2%) | 64 (41.8%) | 0.37 | 12 (40%) | 64 (43.5%) | 54 (41.9%) | 0.9 |
| Female | 9 (50%) | 87 (56.5%) | 80 (59.7%) | 8 (47.1%) | 61 (54%) | 107 (60.8%) | 7 (41.2%) | 80 (58.8%) | 89 (58.2%) | 18 (60%) | 83 (56.5%) | 75 (58.1%) | |||||
| Age | 10 or 11 (years) | 0 (0.0%) | 8 (5.2%) | 5 (37%) | 0.78 | 3 (17.6%) | 3 (2.7%) | 7 (4%) | 0.013 * | 0 | 9 (6.6%) | 4 (2.6%) | 0.33 | 2 (6.7%) | 8 (5.4%) | 3 (2.3%) | 0.42 |
| 12–14 (years) | 3 (16.7%) | 34 (22.1%) | 27 (20.1%) | 7 (41.2%) | 23 (20.4%) | 34 (19.3%) | 3 (17.6%) | 31 (22.8%) | 30 (19.6%) | 5 (10.7%) | 35 (35%) | 24 (18.6%) | |||||
| 15–18 (years) | 15 (83.3%) | 112 ((73.7%) | 102 (76.1%) | 7 (41.2%) | 87 (77%) | 135 (76.7%) | 14 (82.4%) | 96 (70.6%) | 119 (77.8) | 23 (76.7%) | 104 (70.7%) | 102 (79.1%) | |||||
| BMI | Underweight | 2 (11.1%) | 17 (11%) | 16 (11.9) | 0.2 | 0 (0%) | 8 (7.1%) | 27 (15.3%) | 0.008 * | 1 (5.9%) | 16 (11.8%) | 18 (11.8%) | 0.049 * | 4 (13.3%) | 17 (11.6%) | 14 (10.9%) | 0.03 * |
| Normal | 8 (44.4%) | 79 (51.3%) | 83 (61.9%) | 6 (35.3%) | 62 (54.9%) | 102 (58%) | 7 (41.2%) | 66 (48.5%) | 97 (63.4%) | 13 (43.3%) | 70 (47.6%) | 87 (67.4%) | |||||
| Overweight | 4 (22.2%) | 38 (24.7%) | 27 (20.1%) | 6 (35.3%) | 31 (27.4%) | 32 (18.2%) | 5 (29.4%) | 37 (27.2%) | 27 (17.6%) | 6 (20%) | 45 (30.6%%) | 18 (14%) | |||||
| Obese | 4 (22.2%) | 20 (13%) | 8 (6%) | 5 (29.4%) | 12 (10.6%) | 15 (8.5) | 4 (23.5%) | 17 (12.5%) | 11 (7.2%) | 7 (23.3%) | 15 (10.2%) | 10 (7.8%) | |||||
| Physical wducation | Yes | 10( 55.6%) | 68 (44.2%) | 63 (47%) | 0.62 | 9 (52.9%) | 52 (46%) | 80 (45.5%) | 0.839 | 9 (52.9%) | 68 (50%) | 64 (41.8%) | 0.321 | 13 (43.3%) | 73 (49.7%) | 55 (42.6%) | 0.48 |
| No | 8( 44.4%) | 86 (55.8%) | 71 (53%) | 8 (47.1%) | 61 (54%) | 96 (54.5%) | 8 (47.1%) | 68 (50%) | 89 (58.2%) | 17 (56.7%) | 74 (50.3%) | 74 (57.4%) | |||||
| Physical activity in leisure time | Less than 6 h | 4 (22.2%) | 39 (25.3%) | 48 (35.8%) | 0.03 * | 4 (23.5%) | 29 (25.7%) | 58 (33%) | 0.01 * | 4 (23.5%) | 39 (28.7%) | 48 (31.4%) | 0.4 | 10 (33.3%) | 39 (26.5%) | 42 (32.6%) | 0.68 |
| More than 6 h | 6 (33.3%) | 20 (13%) | 15 (11.2%) | 6 (35.3%) | 20 (17.7%) | 15 (8.5%) | 3 (17.6%) | 23 (10.9%) | 15 (9.8%) | 4 (13.3%) | 23 (15.6%) | 14 (10.9%) | |||||
| Insufficient | 8 (44%) | 95 (61.7% | 71 (53%) | 7 (41.2%) | 64 (56.6%) | 103 (58.5%) | 10 (58.8%) | 74 (54.4%) | 90 (58.8%) | 16 (53.3%) | 85 (57.8%) | 73 (56.6%) | |||||
| Backpack weight |
>10% | 7 (38.9%) | 65 (42.2%) | 40 (29.9%) | 0.09 | 8 (47.1%) | 46 (40.7%) | 58 (33%) | 0.26 | 7 (41.2%) | 63 (46.3%) | 42 (27.5%) | 0.004 * | 11 (36.7%) | 65 (44.2%) | 36 (27.9%) | 0.019 * |
| ≤10% | 11 (61.1%) | 89 (57.8%) | 94 (70.9%) | 9 (52.9%) | 67 (59.3%) | 118 (67%) | 10 (58.8%) | 73 (53.7%) | 111 (72.5%) | 19 (63.3%) | 82 (55.8%8 | 93 (72.1%) | |||||
| Form of handling the backpack | Back | 12 (66.7%) | 123 (79.9%) | 83 (61.9%) | 0.03 * | 10 (58.8%) | 82 (72.6%) | 126 (71.6%) | 0.5 | 10 (58.8%) | 106 (77.9%) | 102 (66.7%) | 0.054 | 20 (66.7%) | 111 (75.5%) | 87 (67.4%) | 0.28 |
| Arm/Hands | 6 (33.3%) | 31 (20.1%) | 51 (38.1%) | 7 (41.2%) | 31 (27.4%) | 50 (28.4%) | 7 (41.2%) | 30 (22.1%) | 51 (33.3%) | 10 (33.3%) | 36 (24.5%) | 42 (32.6%) | |||||
* The alpha criterion was considered significant at 0.05 or less.
Disclaimer/Publisher’s Note: The statements, opinions and data contained in all publications are solely those of the individual author(s) and contributor(s) and not of MDPI and/or the editor(s). MDPI and/or the editor(s) disclaim responsibility for any injury to people or property resulting from any ideas, methods, instructions or products referred to in the content. |
© 2023 by the authors. Licensee MDPI, Basel, Switzerland. This article is an open access article distributed under the terms and conditions of the Creative Commons Attribution (CC BY) license (http://creativecommons.org/licenses/by/4.0/).
Copyright: This open access article is published under a Creative Commons CC BY 4.0 license, which permit the free download, distribution, and reuse, provided that the author and preprint are cited in any reuse.


