Submitted:
22 May 2023
Posted:
22 May 2023
You are already at the latest version
Abstract
Keywords:
1. Introduction
2. Geological Setting and Geochemical Data
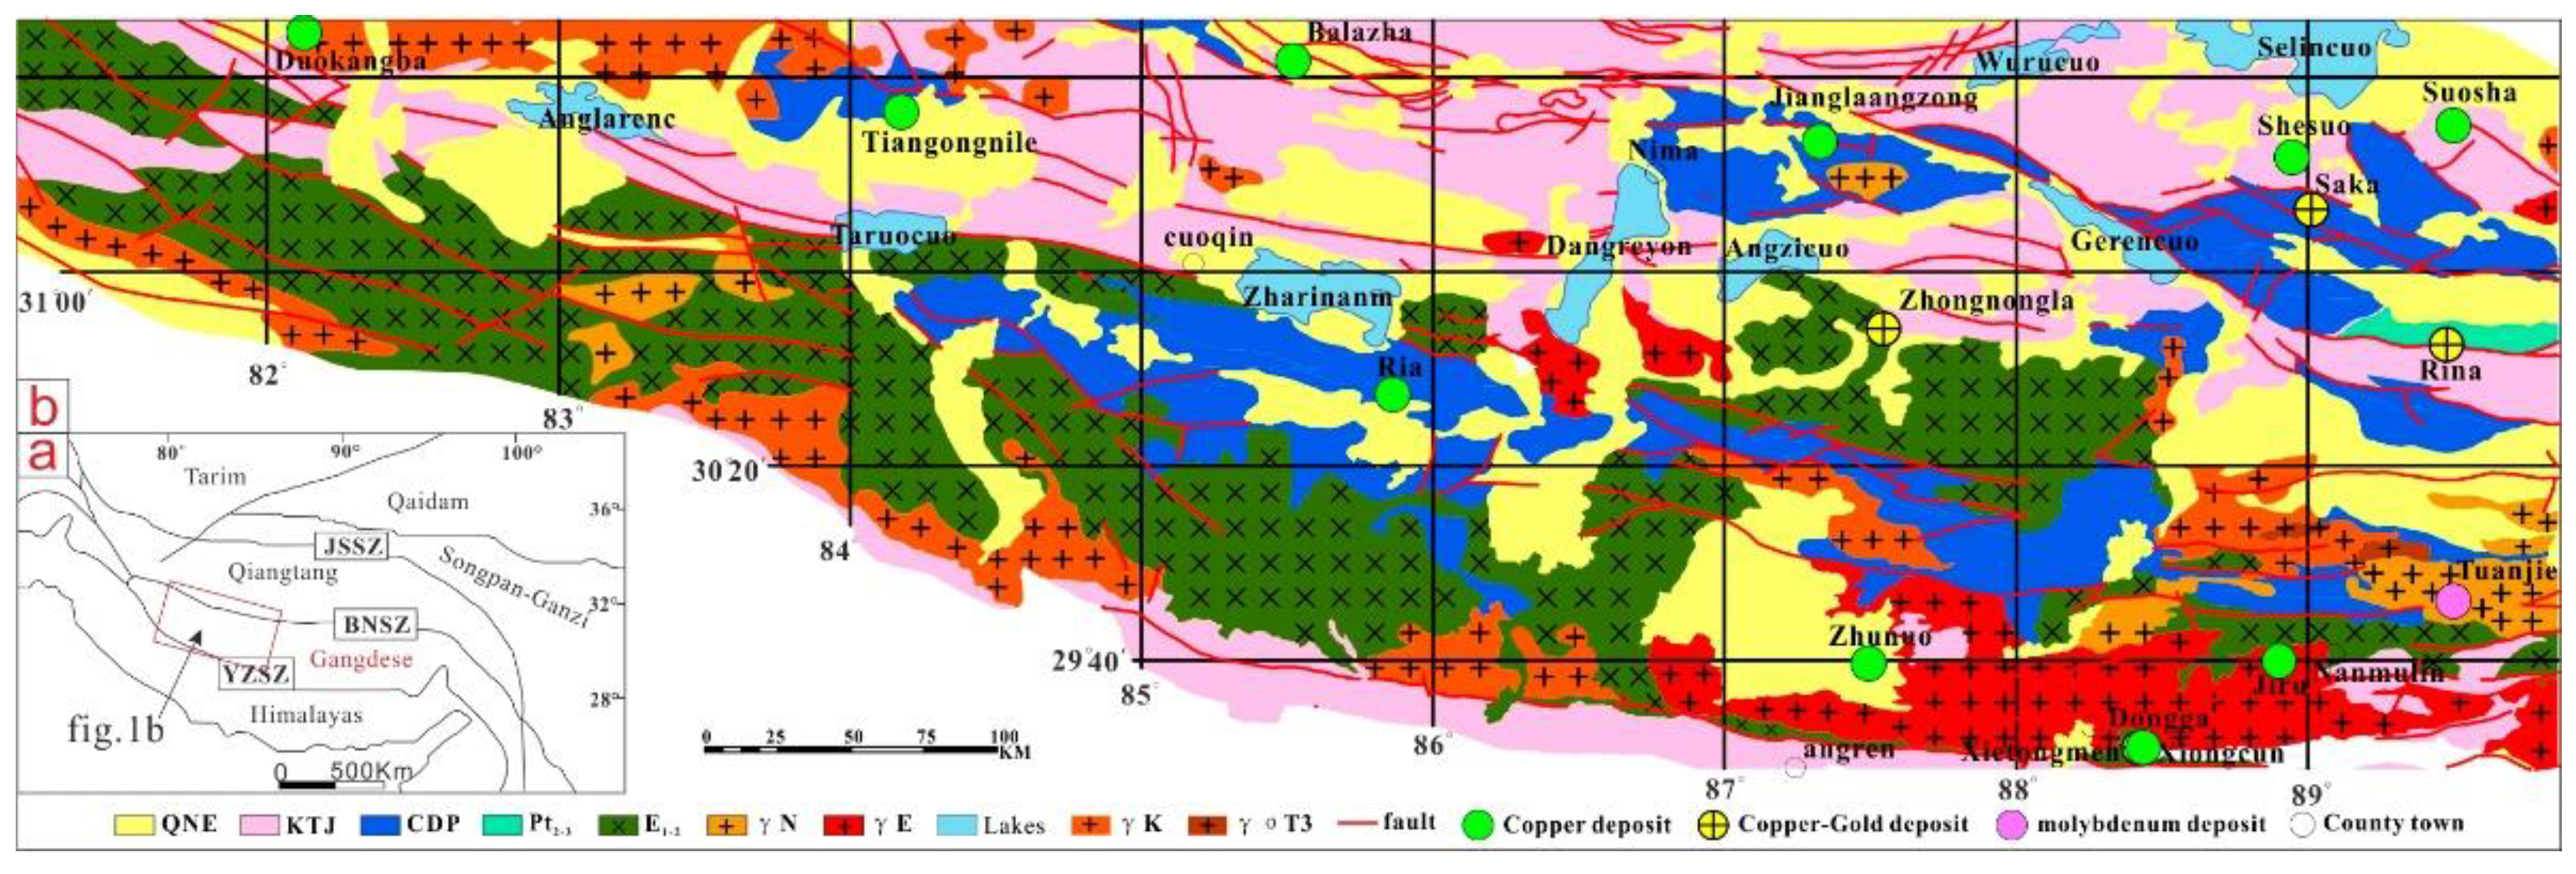
2.1. Regional Geological Background
2.2. Geochemical Data
3. Methods
3.1. Multifractal Inverse Distance Weighted (MIDW)
3.2. Local Singularity Spatial Overlay Analysis (α-value)
3.3. Concentration–Area Model(C-A)
4. Results and Discussion
4.1. The Question of ilr-RPCA-Back clr
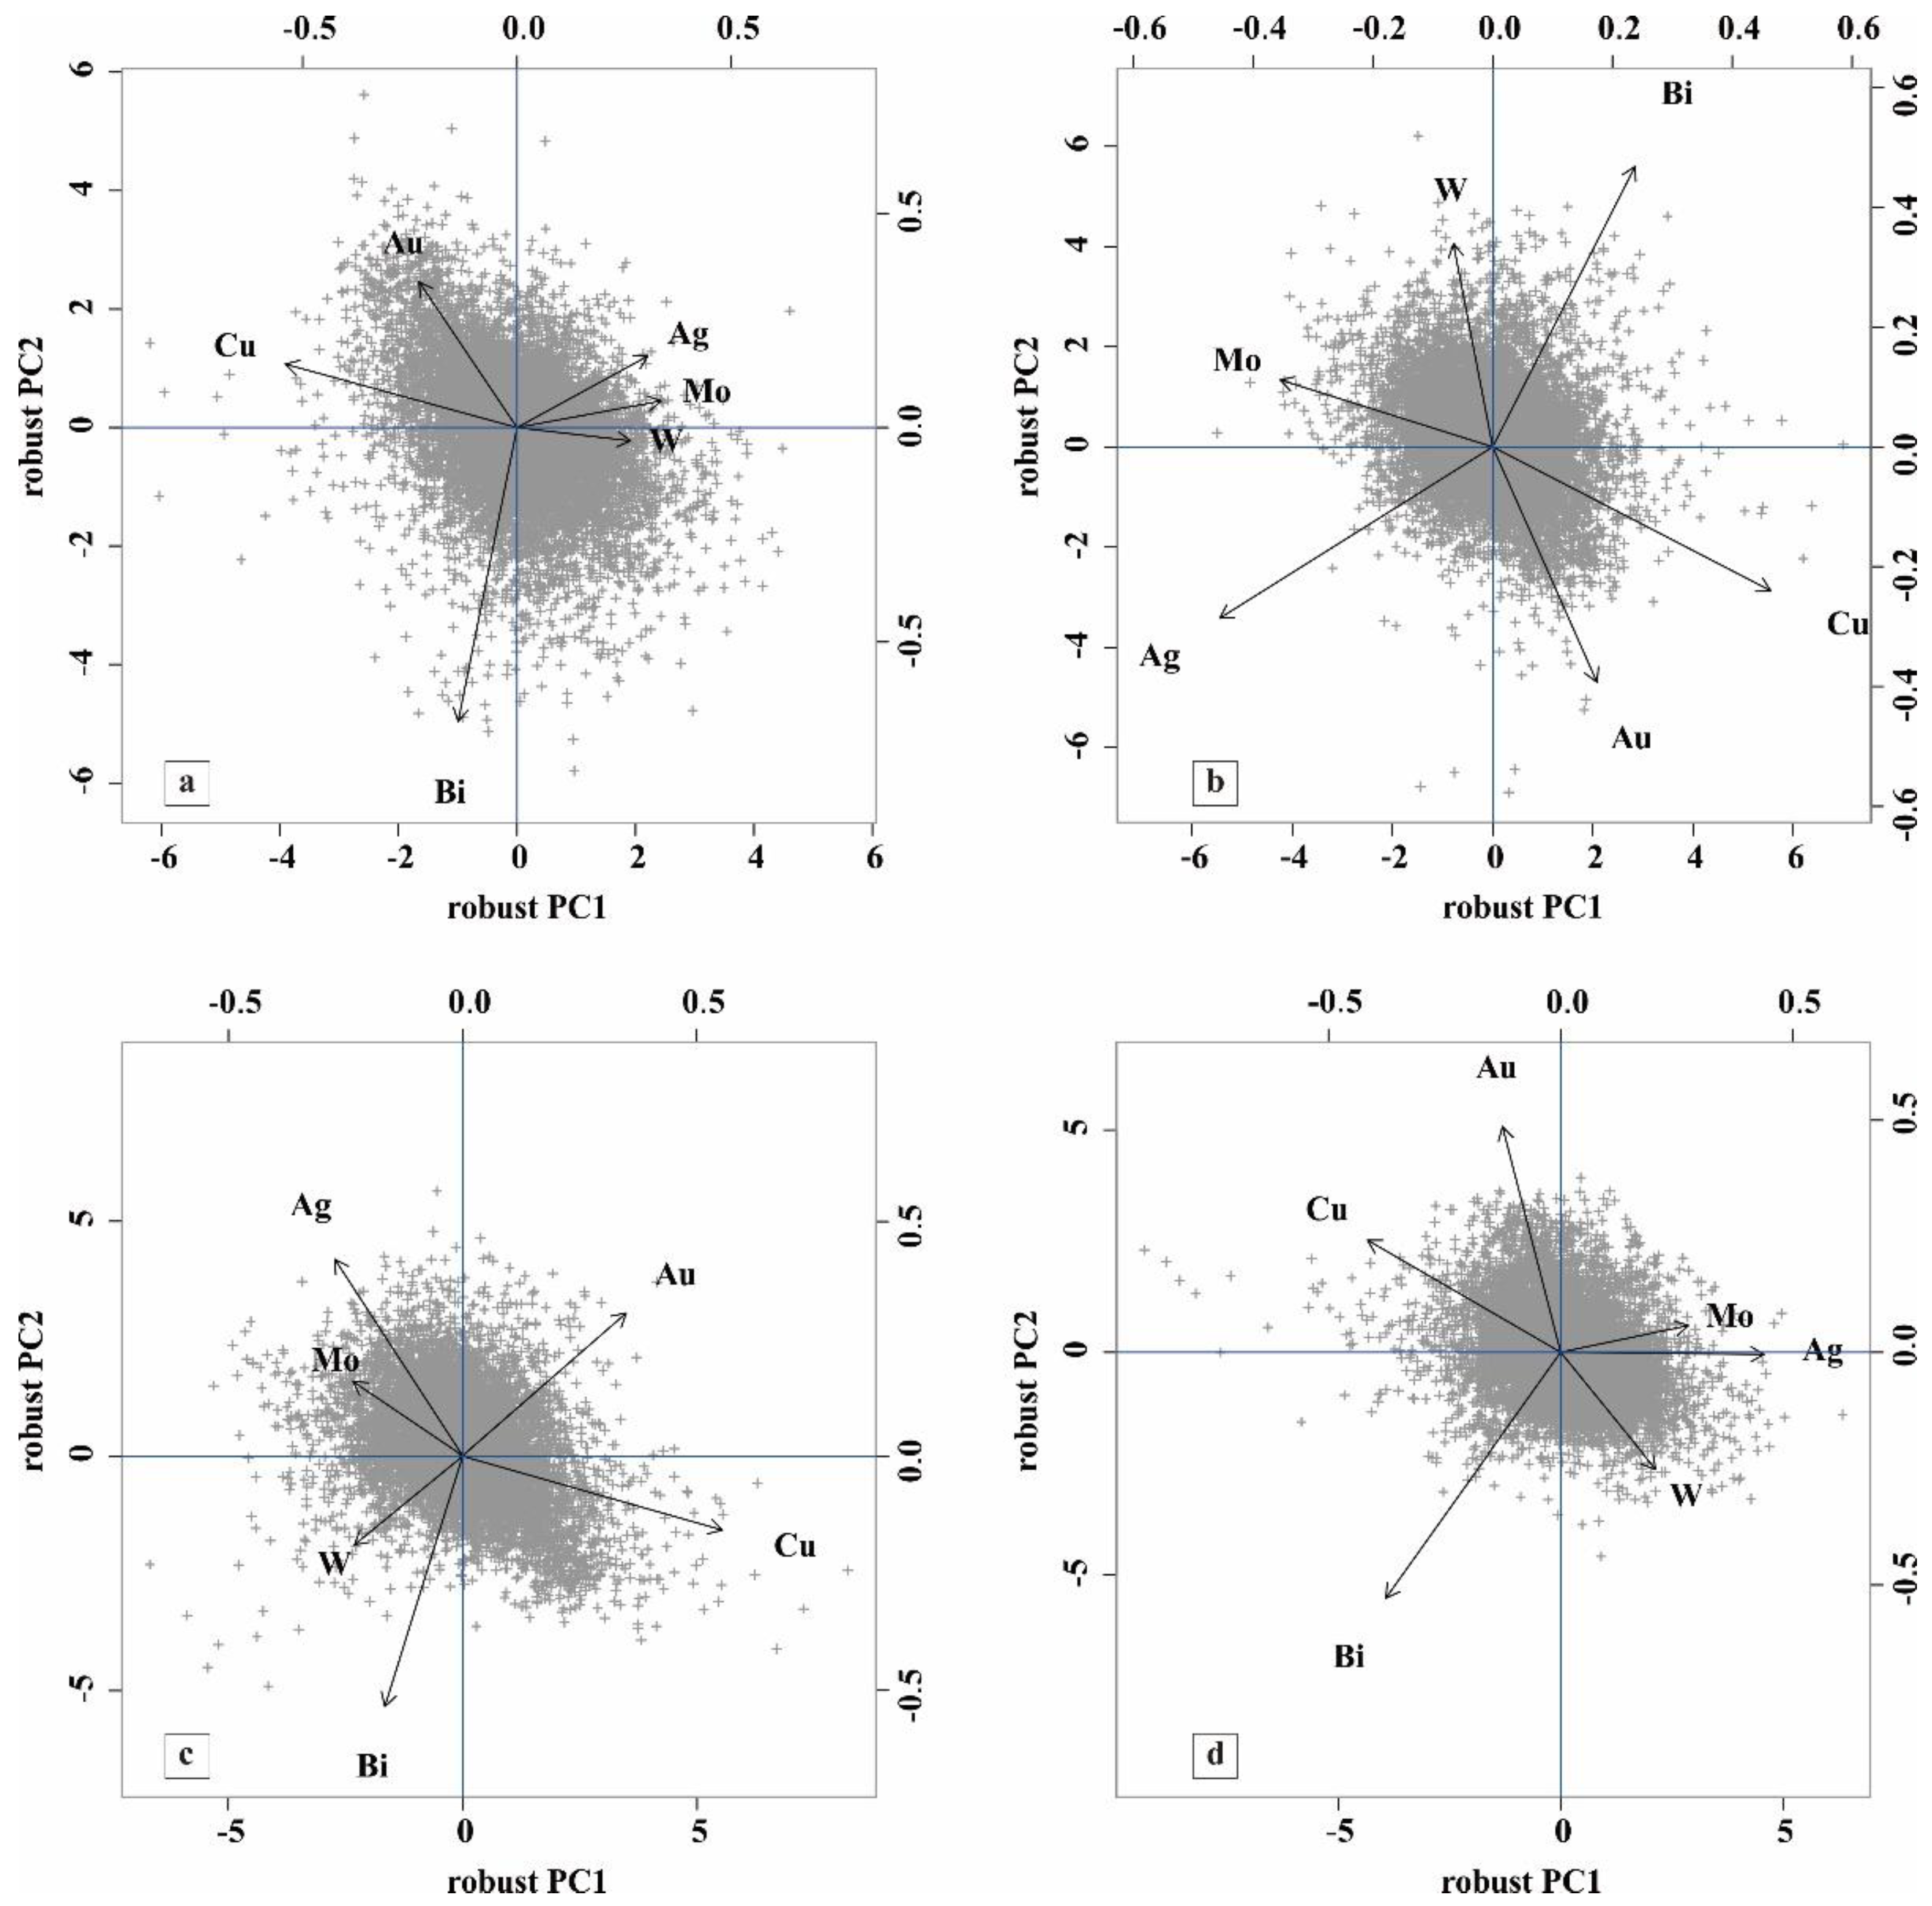
4.2. Selection of Element Association Associated with Porphyry Copper Mineralization
| Deposits and Metallogenic Belts | Geochemical Anomaly Element Combination | Sampling Mode | References |
|---|---|---|---|
| Xiong Cun | ` | regional geochemical anomalies | [36] |
| Xiong Cun | Cu, Au, Ag, Pb, Zn | soil anomaly | [37] |
| Ji Ru | Cu, Mo, W, Bi | regional geochemical anomalies | [36] |
| Zhu Nuo | Au, Cu, Mo, W | regional geochemical anomalies | [36] |
| Zhu Nuo | Cu, Mo, W, Au, Pb, Zn, Ag | stream sediment | [38] |
| Chong Jiang | Cu, Mo, Au, Ag, Pb, Zn, Hg, Sb | stream sediment | [38] |
| Chong Jiang | Cu, Mo, W, Bi, Pb, Ag | regional geochemical anomalies | [38] |
| Qu Long | Cu, Mo, W, Bi, Pb, Ag | stream sediment | [39] |
| Qu Long | Cu, Mo, W, Bi, Sn | regional geochemical anomalies | [5] |
| Jia Ma | Cu, Bi, Au, Ag, Pb, Zn | stream sediment | [40] |
| Jia Ma | Cu, Mo, Au, Ag, Bi, Sn | soil geochemistry | [40] |
| Gangdese polymetallic metallogenic belt | Cu, Mo, W, Au, Ag , Bi | geochemical anomaly | [41] |
| Gangdese polymetallic metallogenic belt | Cu-Mo, Au-Ag, Cu-Mo-Au, Cu-Au-Ag | combination geochemical anomaly | [41] |
| Gangdese porphyry copper deposit | Cu, Mo, Pb, Zn, Ag | [42] | |
| Gangdese copper polymetallic metallogenic belt | Cu, Au, Ag, W, Mo, Bi | geochemical anomaly | [43] |
| Gangdese copper polymetallic metallogenic belt | Cu-Mo, Cu, Cu-Mo-Au, Cu-Au | geochemical anomaly | [43] |
| statistical results | Cu(21), Mo(16), Au(14), Ag(12), W(8), Bi(8), Pb(7), Zn(5), Hg(1), Sb(1), Sn(1) | final choice | Cu(21), Mo(16), Au(14), Ag(12), W(8), Bi(8) |
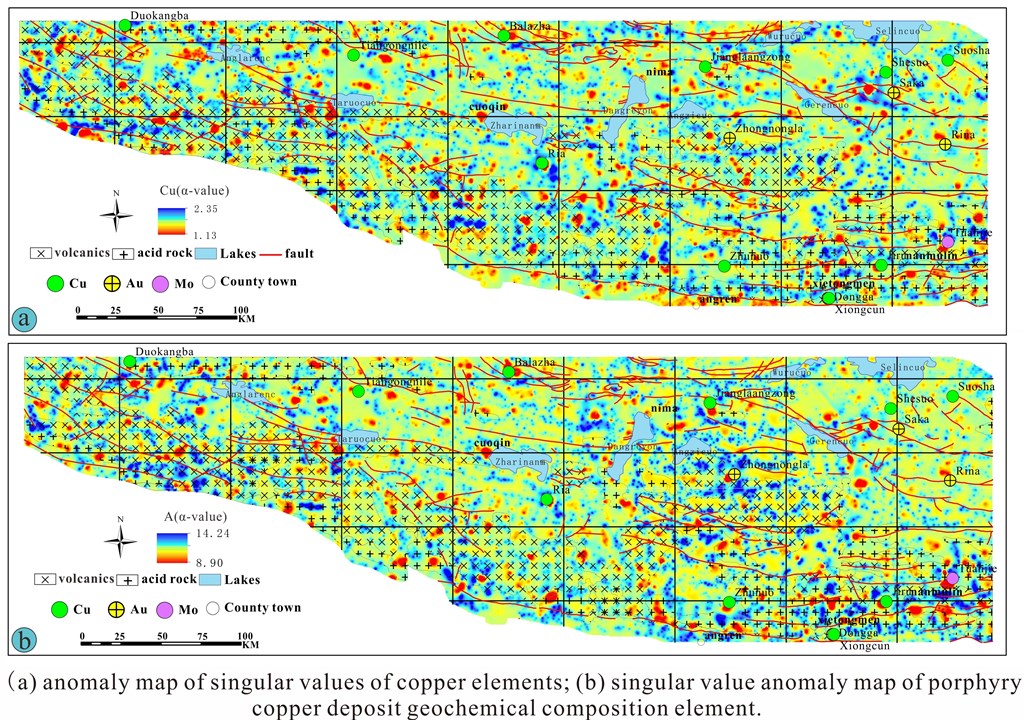
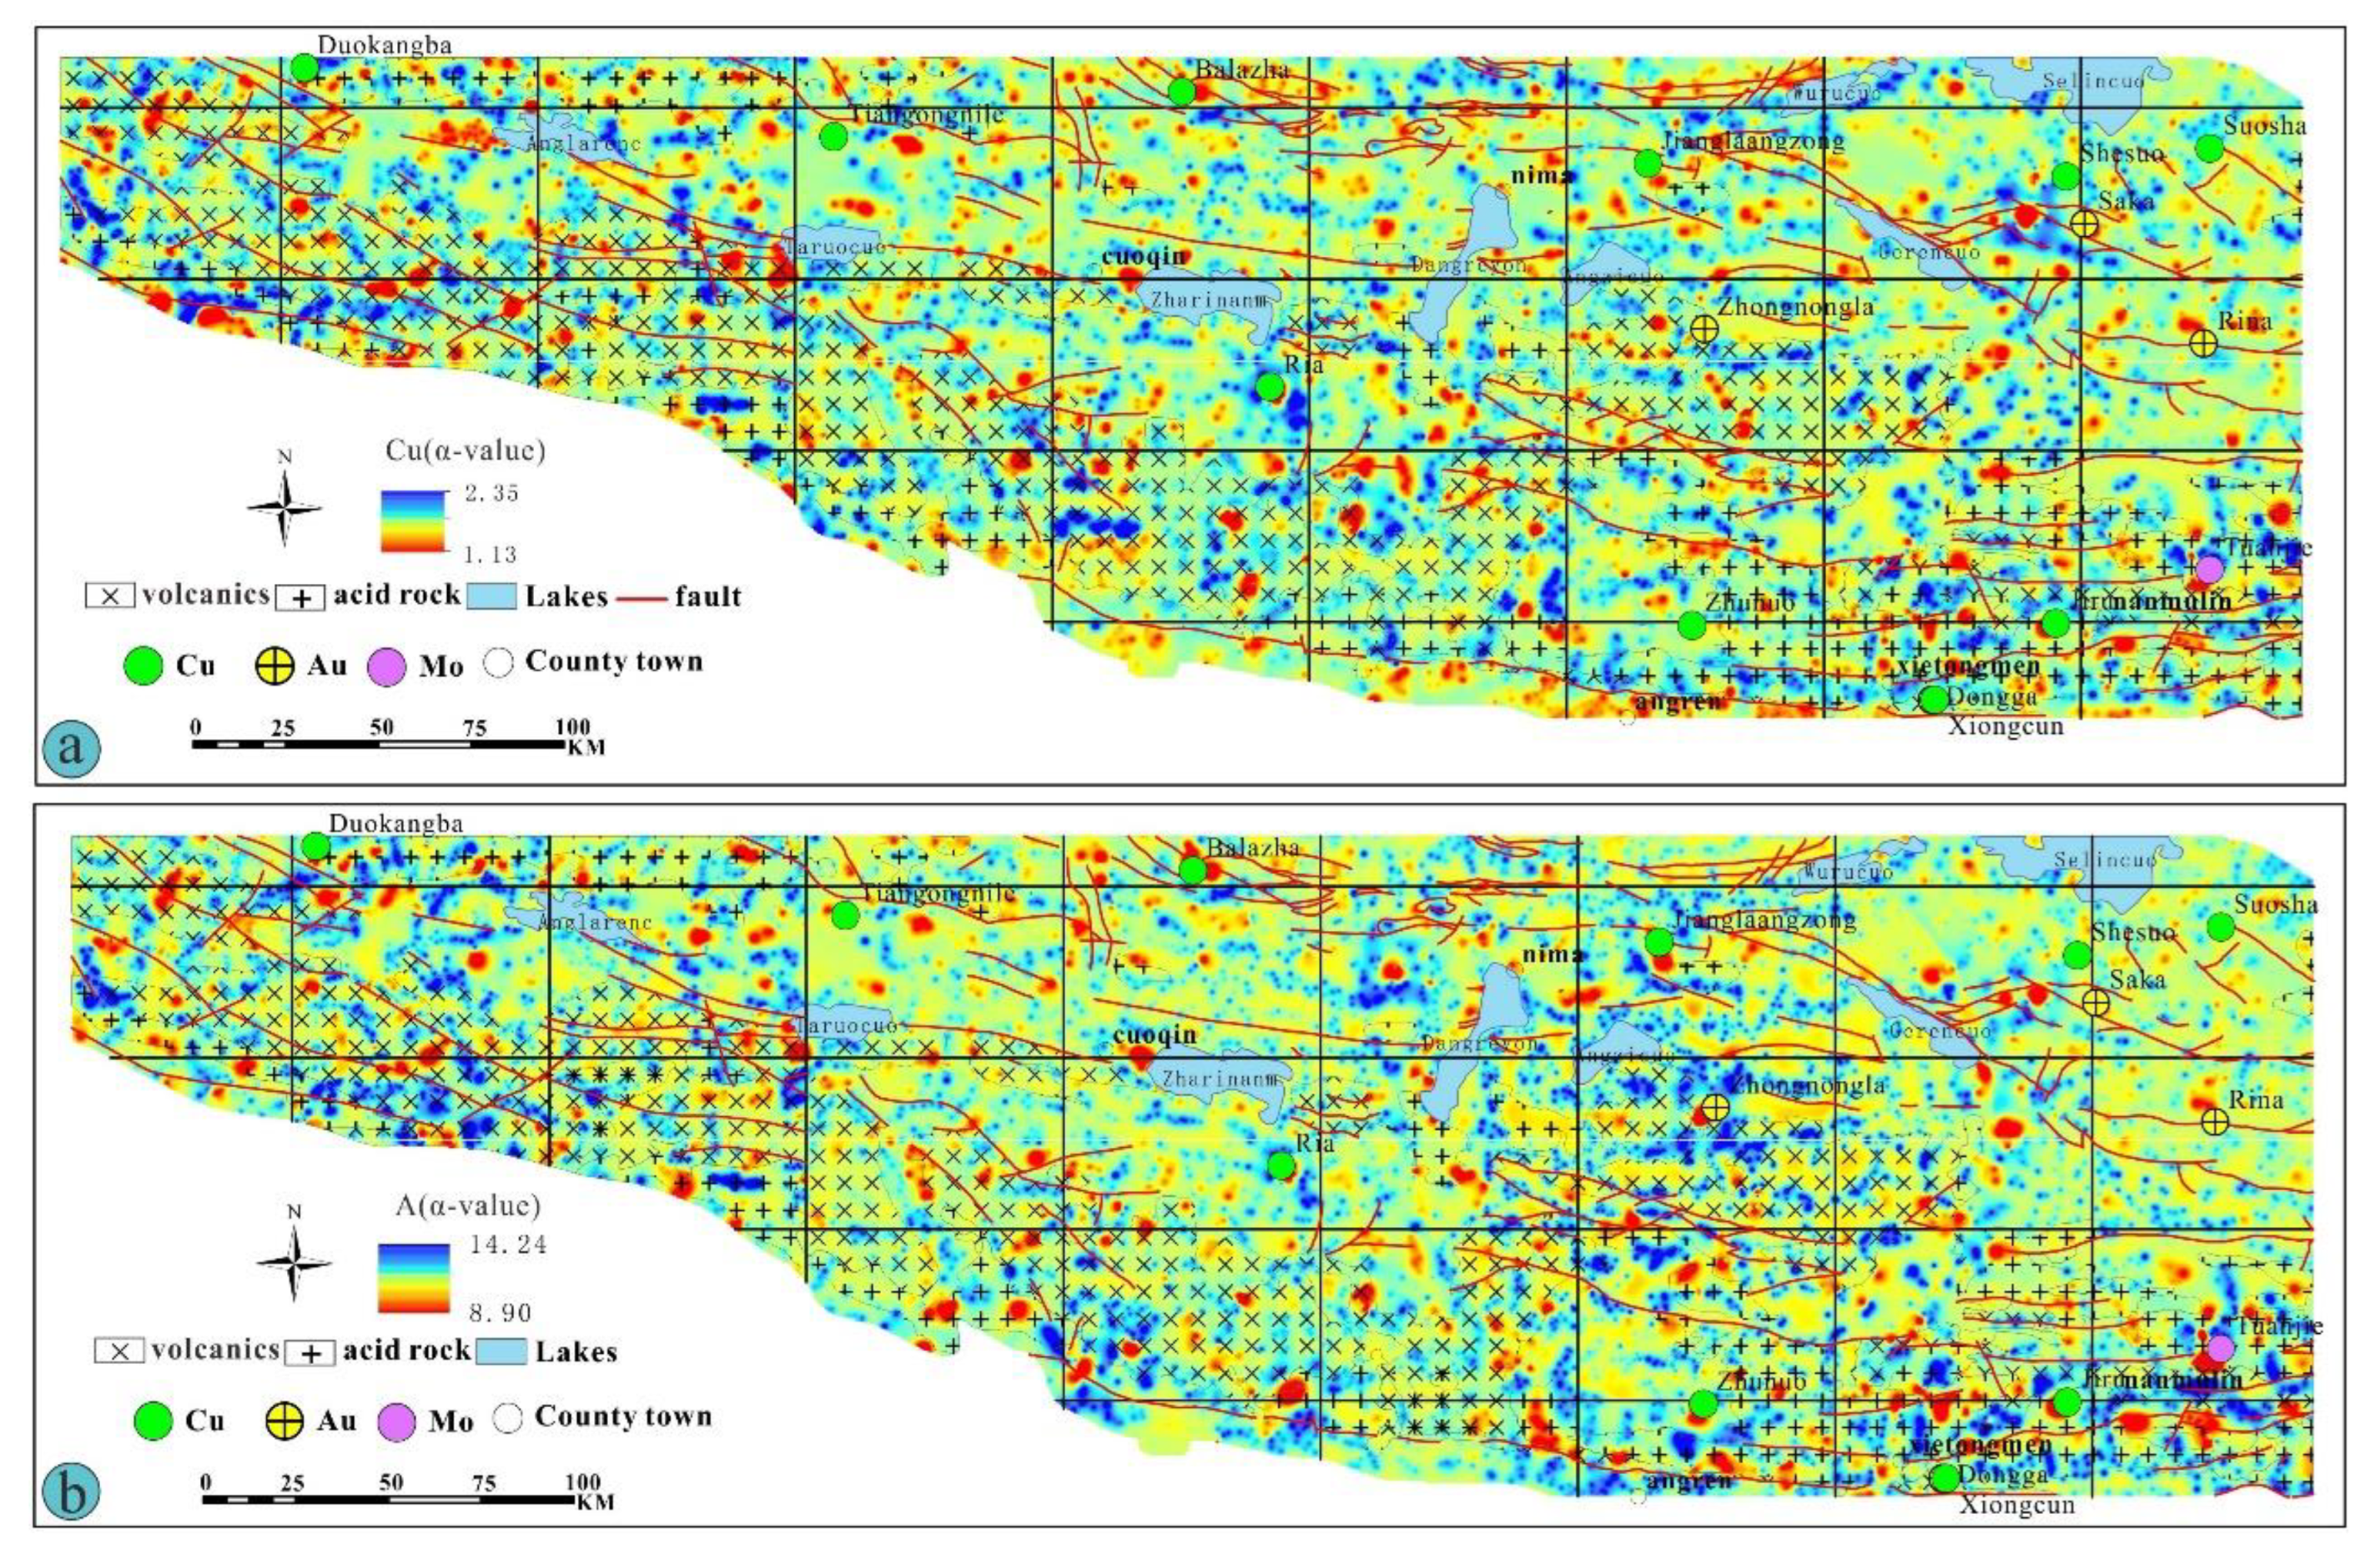
4.3. Spatial Overlay Analysis of Geochemical Singularity Index α-Value of Porphyry Copper Deposit
5. Conclusions
Author Contributions
Funding
Acknowledgments
Conflicts of Interest
References
- Rui, Z., Huang, C., Qi, G., Xu, J., Zhang, H. Porphyry copper (molybdenum) deposits of China. Bejing: Geological Phblishing House, 1984, 350.
- Wang, Z., Qin, K., Zhang, S. Geology and exploration of large copper deposits [Z]. Beijing: Metallurgical Industry Press. 1994.
- Qin, K., Sun, S., Li, J., Fang, T., Wang, S., Liu, W. Paleozoic epithermal Au and porphyry Cu deposits in North Xinjiang, China: epochs, features, tectonic linkage and exploration significance. Resource Geology, 2002, 52(4): 291-300. [CrossRef]
- Cooke, D.R. Giant Porphyry Deposits: Characteristics, Distribution, and Tectonic Controls. Economic Geology, 2005, 100(5): 801-18.
- Zheng Y., Xue Y., Cheng L., Fan Z., Gao S. Finding, Characteristics and Significances of Qulong Superlarge Porphyry Copper (Molybdenum)Deposit. Earth Sciences: Journal of China University of Geosciences, 2004, 29(1). (In Chinese).
- Cheng Q. Singularity Modeling of Geo-Anomalies and Recognition of Anomalies Caused by Buried Sources. Earth Science-Journal of University of Geosciences, 2011, 36(2). (In Chinese).
- Xie, Y. The study of the complexity of tectonic©\fluid©\mineralization system and its dynamic mechanism: A case study of Shuikoushan Pb©\Zn©\Au polymetallic ore field in Hunan province, China [Z]. Guangzhou: Guangzhou Institute of Geochemistry Chinese Academy of Science. 2004.
- Filzmoser, P., Hron, K., Reimann, C., Garrett, R. Robust factor analysis for compositional data. Computers & Geosciences, 2009, 35(9): 1854-61. [CrossRef]
- Grunsky, E.C., Mueller, U.A., Corrigan, D. A study of the lake sediment geochemistry of the Melville Peninsula using multivariate methods: Applications for predictive geological mapping. Journal of Geochemical Exploration, 2014, 141: 15-41. [CrossRef]
- Sadeghi, M., Billay, A., Carranza, E. Analysis and mapping of soil geochemical anomalies: Implications for bedrock mapping and gold exploration in Giyani area, South Africa. Journal of Geochemical Exploration, 2015, 154: 180-93. [CrossRef]
- Wang, H., Zuo, R. A comparative study of trend surface analysis and spectrum–area multifractal model to identify geochemical anomalies. Journal of Geochemical Exploration, 2015, 155: 84-90. [CrossRef]
- Zuo, R.G., Wang, J. Fractal/multifractal modeling of geochemical data: A review. Journal of Geochemical Exploration, 2016, 164: 33-41. [CrossRef]
- Chen, X., Xu, R.K., Zheng, Y.Y., Jiang, X.J., Du, W.Y. Identifying potential Au-Pb-Ag mineralization in SE Shuangkoushan, North Qaidam, Western China: Combined log-ratio approach and singularity mapping. Journal of Geochemical Exploration, 2018, 189: 109-21.
- Cheng, Q.M. Mapping singularities with stream sediment geochemical data for prediction of undiscovered mineral deposits in Gejiu, Yunnan Province, China - ScienceDirect. Ore Geology Reviews, 2007, 32(1–2): 314-24. [CrossRef]
- Bai, J., Porwal, A., Hart, C., Ford, A., Yu, L. Mapping geochemical singularity using multifractal analysis: application to anomaly definition on stream sediments data from Funin Sheet, Yunnan, China. Journal of Geochemical Exploration, 2010, 104(1-2): 1-11. [CrossRef]
- Sun, X., Gong, Q., Wang, Q., Yang, L., Wang, C., Wang, Z. Application of local singularity model to delineate geochemical anomalies in Xiong'ershan gold and molybdenum ore district, Western Henan province, China. Journal of Geochemical Exploration, 2010, 107(1): 21-9. [CrossRef]
- Agterberg, F.P. Multifractals and geostatistics. Journal of Geochemical Exploration, 2012, 122(none): 113-22.
- Cheng, Q.M. Singularity theory and methods for mapping geochemical anomalies caused by buried sources and for predicting undiscovered mineral deposits in covered areas. Journal of Geochemical Exploration, 2012, 122(none): 55-70. [CrossRef]
- Liu, Y., Cheng, Q., Xia, Q., Wang, X. Application of singularity analysis for mineral potential identification using geochemical data¡ªA case study: Nanling W¨CSn¨CMo polymetallic metallogenic belt, South China. Journal of Geochemical Exploration, 2013, 134: 61-72.
- Zuo, R., Wang, J., Chen, G., Yang, M. Identification of weak anomalies: A multifractal perspective. Journal of Geochemical Exploration, 2015, 148: 12-24. [CrossRef]
- Zuo, R.G., Carranza, E.J.M., Wang, J. Spatial analysis and visualization of exploration geochemical data. Earth-Science Reviews, 2016, 158: 9-18. [CrossRef]
- Gao S.B. Copper-Iron Polymetal Metallogenesis and Exploration Direction in the Western of Gangdese Metallogenic Belt, Tibet, China University of Geosciences, 2015. (In Chinese).
- Pan G., Mo X., Hou Z., Zhu D., Wang L., Li G., Zhao Z., Geng Q., Liao Z. Spatial-temporal framework of the Gangdese Orogenic Belt and its evolution. 2006, (03): 521-33. (In Chinese).
- Hou, Z., Duan, L., Yang, Z., pei, Y., Lu, Y., McCuaig, C.T., Zheng, Y., Zhu, D., Zhao, Z., Yang, Z., Wang, B. Lithospheric Architecture of the Lhasa Terrane and It's Control on Deposits in the Himalayan-Tibetan Orogen [Z]//Andre-Mayer A.S., Cathelineau M., Muchez P., Pirard E., Sindern S. Mineral Resources in a Sustainable World, Vols 1-5. ASGA-ASSOC SCIENTIFIQUE GEOLOGIE \& APPLICATIONS. 2015: 113-6.
- Wu, S., Zheng, Y., Wang, D., Chang, H., Tan, M. Variation of copper isotopes in chalcopyrite from Dabu porphyry Cu-Mo deposit in Tibet and implications for mineral exploration. Ore Geology Reviews, 2017, 90: 14-24. [CrossRef]
- Zheng, S., Wu, S., Zheng, Y., Chen, L., Wei, C., Huang, P., Jing, X., Yu, Z., He, C., Ren, H. Identifying potential porphyry copper mineralization at the Zhu’nuo ore-cluster district in western Gangdese, southern Tibet: Insights from shortwave infrared (SWIR) spectrometry and geochemical anomalies. Ore Geology Reviews, 2022, 151.
- Kaiser, H.F. The varimax criterion for analytic rotation in factor analysis. Educational and Psychological Measurement, 1958, 23: 770-3. doi:10.1007/bf02289233.
- Zuo, R.G. Decomposing of mixed pattern of arsenic using fractal model in Gangdese belt, Tibet, China. Applied Geochemistry, 2011, 26(supp-S): S271-S3. [CrossRef]
- Wang, X., Xie, X., Zhang, B., Hou, Q. Geochemical probe into China's continental crust. 2011.
- Cheng Q. Multifractal and geostatistic methods forcharacterizing local structure and singularityproperties of exploration geochemical anomalies. Earth Science (Journal of China University of Geosciences), 2001, 26(2): 161-6. (In Chinese).
- Cheng, Q.M. Spatial and scaling modelling for geochemical anomaly separation. Journal of Geochemical Exploration, 1999, 65(3): 175-94. [CrossRef]
- Zuo, R.G. Identifying geochemical anomalies associated with Cu and Pb-Zn skarn mineralization using principal component analysis and spectrum-area fractal modeling in the Gangdese Belt, Tibet (China). Journal of Geochemical Exploration, 2011, 111(1-2): 13-22. [CrossRef]
- Zuo, R.G., Xia, Q.L., Wang, H.C. Compositional data analysis in the study of integrated geochemical anomalies associated with mineralization. Applied Geochemistry, 2013, 28(Complete): 202-11. [CrossRef]
- Cheng, Q.M., Agterberg, F.P., Ballantyne, S.B. The Separation of Geochemical Anomalies from Background by Fractal Methods. Journal of Geochemical Exploration, 1994, 51(2): 109-30. [CrossRef]
- Carranza, E.J.M. Geochemical anomaly and mineral prospectivity mapping in GIS. Elsevier, 2008;
- Gao, Y., Zhang, Z.J., Xiong, Y.H., Zuo, R.G. Mapping mineral prospectivity for Cu polymetallic mineralization in southwest Fujian Province, China. Ore Geology Reviews, 2016, 75: 16-28. [CrossRef]
- Lang, X., Tang, J., Li, Z., Dong, S., Ding, F., Wang, Z., Zhang, L., Huang, Y. Geochemical evaluation of exploration prospect in the Xiongcun copper-gold district and peripheral areas, Xietongmen County, Tibet. Geology and Exploration, 2012, 48(1): 12-23.
- Sun, X., Zheng, Y., Li, M., Ouyang, H., Liu, Q., Jing, X., Sun, G., Song, Q. Genesis of Luobuzhen Pb–Zn veins: Implications for porphyry Cu systems and exploration targeting at Luobuzhen-Dongshibu in western Gangdese belt, southern Tibet. Ore Geology Reviews, 2017, 82: 252-67. [CrossRef]
- Yang, S.P., Zhang, H., Liu, Y.H., Kong, M., Liu, H.Z., Dong, G.F., Luo, Y.P. Geochemical Evaluation of Potential Ore in the Qulong Copper Deposit and Its Peripheral Region in Tibet. Acta Geologica Sinica, 2006, 10(1558-1565).
- Zheng W.B. The Study on Metallogenic Model and Prospecting Pattern for Jiama Polymetallic Copper Deposit, Tibet, Chengdu University of Technology, 2012. (In Chinese).
- She, H., Li, G., Dong, Y., Pan, G., Li, J., Zhang, D., Feng, C. Regional metallogenic prognosis and mineral reserves estimation for porphyry copper deposits in Gangdese polymetallic ore belt, Tibet. Mineral deposits, 2009, 28(6): 803-14.
- Zuo, R. Synthetic information prediction of porphyry copper in Tibet. Cent South Univ Technol, 2007, 38: 368-73.
- Guang-ming, L., Hong-quan, S., Li, Z., Bo, L., Yin-jun, D. Based on mineral resource assessment system (MRAS) for the metallogenic prognosis in Gangdese metallogenic belt, Tibet. Geology and Exploration, 2009, 45(6): 645-52.
- Sun, X., Zheng, Y., Wang, C., Zhao, Z., Geng, X. Identifying geochemical anomalies associated with Sb–Au–Pb–Zn–Ag mineralization in North Himalaya, southern Tibet. Ore Geology Reviews, 2016, 73: 1-12.
| No. | elements | Detection limit | No. | elements | Detection limit | No. | elements | Detection limit |
|---|---|---|---|---|---|---|---|---|
| 1 | Ag | 0.02 | 14 | La | 30 | 27 | U | 0.5 |
| 2 | As | 1 | 15 | Li | 5 | 28 | V | 20 |
| 3 | Au | 0.0003 | 16 | Mn | 30 | 29 | W | 0.5 |
| 4 | B | 5 | 17 | Mo | 0.4 | 30 | Y | 5 |
| 5 | Ba | 50 | 18 | Nb | 5 | 31 | Zn | 10 |
| 6 | Be | 0.5 | 19 | Ni | 2 | 32 | Zr | 10 |
| 7 | Bi | 0.1 | 20 | P | 100 | 33 | SiO2 | 0.10% |
| 8 | Cd | 0.05 | 21 | Pb | 2 | 34 | Al2O3 | 0.10% |
| 9 | Co | 1 | 22 | Sb | 0.1 | 35 | TFe2O3 | 0.05% |
| 10 | Cr | 15 | 23 | Sn | 1 | 36 | MgO | 0.05% |
| 11 | Cu | 1 | 24 | Sr | 5 | 37 | CaO | 0.05% |
| 12 | F | 100 | 25 | Th | 4 | 38 | Na2O | 0.05% |
| 13 | Hg | 0.0005 | 26 | Ti | 100 | 39 | K2O | 0.05% |
Disclaimer/Publisher’s Note: The statements, opinions and data contained in all publications are solely those of the individual author(s) and contributor(s) and not of MDPI and/or the editor(s). MDPI and/or the editor(s) disclaim responsibility for any injury to people or property resulting from any ideas, methods, instructions or products referred to in the content. |
© 2023 by the authors. Licensee MDPI, Basel, Switzerland. This article is an open access article distributed under the terms and conditions of the Creative Commons Attribution (CC BY) license (http://creativecommons.org/licenses/by/4.0/).
