Preprint
Article

Biorenewables from Horticulture Waste within the Biorefinery Concept

Altmetrics

Downloads

110

Views

39

Comments

0

A peer-reviewed article of this preprint also exists.

Submitted:

19 May 2023

Posted:

22 May 2023

You are already at the latest version

Alerts
Abstract
Biorefineries convert biomasses in bioproducts and they contribute to transition to the circular economy. In this way it will be avoiding the penalty associated with generating a lot of waste. The first step in the obtention chain of bioproducts consists of the high value added products extraction. The following steps are aimed at the utilisation of all by-products or waste generated. The kinetic anaerobic digestion of these residues are evaluated in this research to produce biogas/methane. Pepper waste have been employed in batch and semi-continuous anaerobic digestion assays trying the optimization of the yields adding, as catalysts, absorbent nanoparticles and/or using strategies of pretreatment.
Keywords: 
Subject: Engineering  -   Chemical Engineering

1. Introduction

Nowadays, the biorefinery concept is related with the optimum use of waste obtaining biofuels, energy and added value high subproducts. Through this concept is possible fight against the climate change. Concretely, European Comission has identified some priorities areas where the European Directive from Renewables Energies [1] must to incide. A total elimination of waste generated in industries and an introduction of the renewables energies in it processes change can be an appropriate measure to get some of the specific objetives against the climate change [2]. Particulary, in a region of Spain where this research have been developed, there are a Regional Plan of Research, Technological Development and Innovation [3]. This Plan is focusing their economic priorities in the agrofood sector and other two more sectors. For this reason, if waste from agrofood sector are evaluated to get an optimum use for them, it will be moving towards a more sustainable economy. According Statistics National Institute [4] there were 636116 t of vegetable waste in Spain in 2020 from food and drink manufacturing industries and tobacco factories. A production of 26 % in the production of fruits and vegetables belong to Spain of total European countries in 2021 [5]. Particulary, amount of exported pepper from Spain exceeded 800.000 t in 2021. Normally, waste produced from pepper around 50-60 % of the total processed biomass [6]. Waste generated are usually employed as animal feed or discharged into landfills, leading to environmental in the areas in which they are disposed of [7]. A strategic solution has to be developed to manage the large amount of pepper waste produced in the country. To apply a biorefinery concept to pepper waste will be an excellent way to optimizate the benefits. Different extration methods can be carried out to get a valorization of this waste. Added value high product can be obtained as poliphenolic and carotenoids compounds. A developed first step with extration methods offers an opportunity to get a pepper waste more degraded to use as feed from microorganisms that produce biofuels, concretly, biogas. The process to generate biogas is called anaerobic digestion (AD), it consist of degrading organic matter in the waste by specific microorganisms to produce biogas. Another product is generated in this process: digestate, it can be used as organic fertilizer. Digestate is a fertilizer containing odorless stabilized organic matter and NPK nutrients have changed to mineral forms that are available for plants [8]. In this process can be employed more than one waste, in this case the process is called Anaerobic Co-digestion (AC-D). There are large amount of studies about AC-D substrates employing vegetable waste with animal waste (slurry or cattle manure). A evaluation of pepper waste addition in a co-digestion process with swine manure was developed by Riaño et al [9]. In this study the highest specific methane yield obtained under batch conditions was 309 N L CH4 kg VS-1 with a percentage of pepper waste in the mixture of 50 % (on the VS basis). After AC-D under semicontinuous operation at different OLR values were studied, increasing the specific methane yield by up to 86 % compared to that obtained from a mono-digestion assay of swine manure (208 N L CH4 kg VS-1 at 1.26 g VS L-1d-1). An research about AC-D of wood waste with pig manure carried out by Li et al. [10] evaluated the methane production potential pretreating with NaOH the wood waste. Results obtained showed that the methane yield was increased by 75.8 % after NaOH pretreatment compared with the untreatted wood waste. To improve the kinetic of the AC-D different mechanisms can be employed, as nanoparticles use, bioelectrochemical application, nano-biochar use. Madondo et al. [11] researched the application of bioelectrochemical system and magnetite nanoparticles of sewage sludge for the improvement of organic content degradation. In this case an enhanced methane percentage was obtained versus the control developed (88 % versus 39%). A review [12] focused in the role of the nano-biochar addition in the AC-D kinetic shows evidence of nano-biochar as catalyst for enhancing biogas production. However, it refeers the development of continuous or semi-continuous operational modes using this kind of catalyst is not so studied. Kweinor and Rathilal [13] employed as catalyst magnetized nanoparticles (iron oxides and aluminum sulphate) to accelerate AC-D of wastewater. Kinetic parameters calculated showed than the presence of these nanoparticles shortens the lag phase of the control system with kinetics rate of 0.285 d-1 for control to 0.127 d-1 and 0.195 d-1 for iron oxides and aluminum sulphate nanoparticles, respectively.
Parameter essential to control pH buffer is the alkalinity mainly in semi-continuous regime. A high alkalinity measured by the equilibrium carbon dioxide-bicarbonate provides an excellent buffer capacity to avoid VFA accumulations and drops in pH values according Somridhivej and Boyd [14]. When the feed of substrates added to digester (Organic Load Rate (OLR)) is increasing in AC-D process, all of mentioned parameters must be controlled to avoid the inhibition of the process.
Due to the gap in research studies related to semi-continuous operational mode using diverse types of catalyst, the present study proposes to assess the performance and stability of assays employing pig manure and pepper waste in the AC-D, and including absorbent nanoparticles and/or strategies of waste pretreatment. Results obtained are compared through different kinetic parameters calculated according simulation models.

2. Results and discussion

2.1. Chemical characterization of raw materials

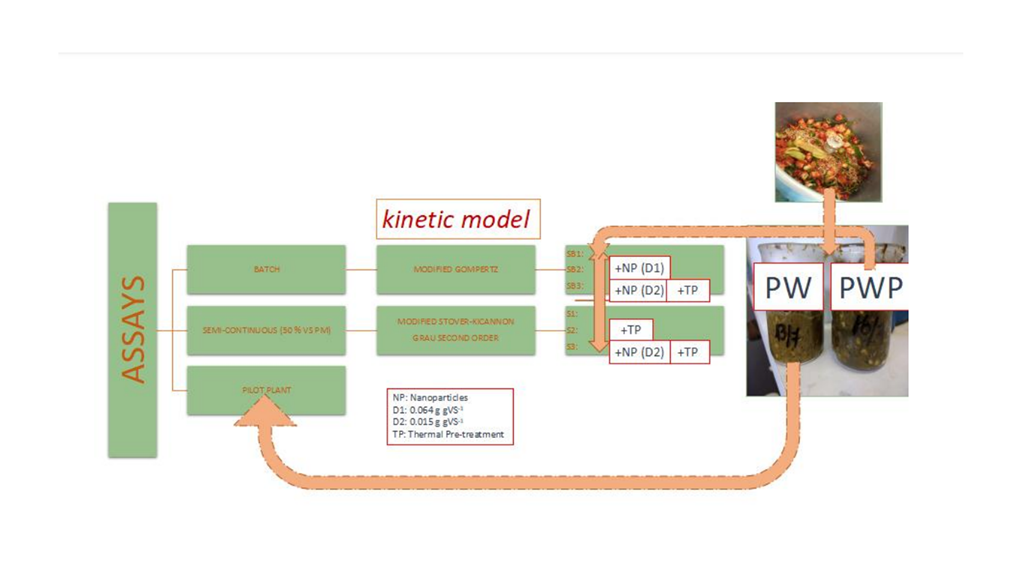
Raw materials employed were Pepper Waste Pretreatment (PWP) to carried out batch assays with different pretreatments or nanoparticles, Pig Manure (PM) with PWP to develop semi-continuous experiments in lab and PM with Pepper Waste (PW) to study the AC-D process in a pilot plant. PM, PW and PWP were characterized before to start the studies and results are shown in the Table 1.
As can be observed in the Table 1 low values pH from PW and PWP are presented. Alkalinity parameter from PM is high enough to buffer pH low values from peppers materials. If AC-D works with alkalinity values higher than 2000 mg CaCO3 L-1 according Flotats et al. [15] indicate an stability of the process. The C/N proportion used in the feed must to be close to 20-30 [16,17,18,19], PW and PWP have values approximates to these values. The TS values of PW and PWP are very similar and quite high. Also are observed total VS about 93 % of the TS. It indicates a high potential of organic transformation of PW and PWP, as it is happened in a research carried out by Arhoun et al. [20]. They developed AC-D of mixed sewage sludge and fruits and vegetable wholesale market waste.

2.2. Biochemical Methane Potential (BMP) of different strategies with PWP

Three assays were assess to find which was more productive: batch assay without pretreatment (SB1); batch assay with a determinated absorbent nanoparticles dose (SB2), and batch assay with another determinated absorbent nanoparticles dose and thermal pretreatment (SB3). As can be shown in the Table 2 the BMP and the kinetic parameters can be compared. These results evidence that methane yield from SB1 is the highest of the studies carried out. Also, a thermal pretreatment of the PWP can be a good method to increase the methane average concentration in the biogas obtained. Gallego L.M. et al. [21] evaluated the empirical BMP through different models from some horticultural waste as beet pulp and pear flesh, results obtained (249 NL kg VS-1 and 318 NL kg VS-1 for beet pulp and pear flesh, respectively) were lower than values obtained in this research. Kinetic parameters shows higher Rmax values for SB2 and SB3 than Rmax for SB1. It probably means nanoparticles in the medium supports quickly production methane rate.
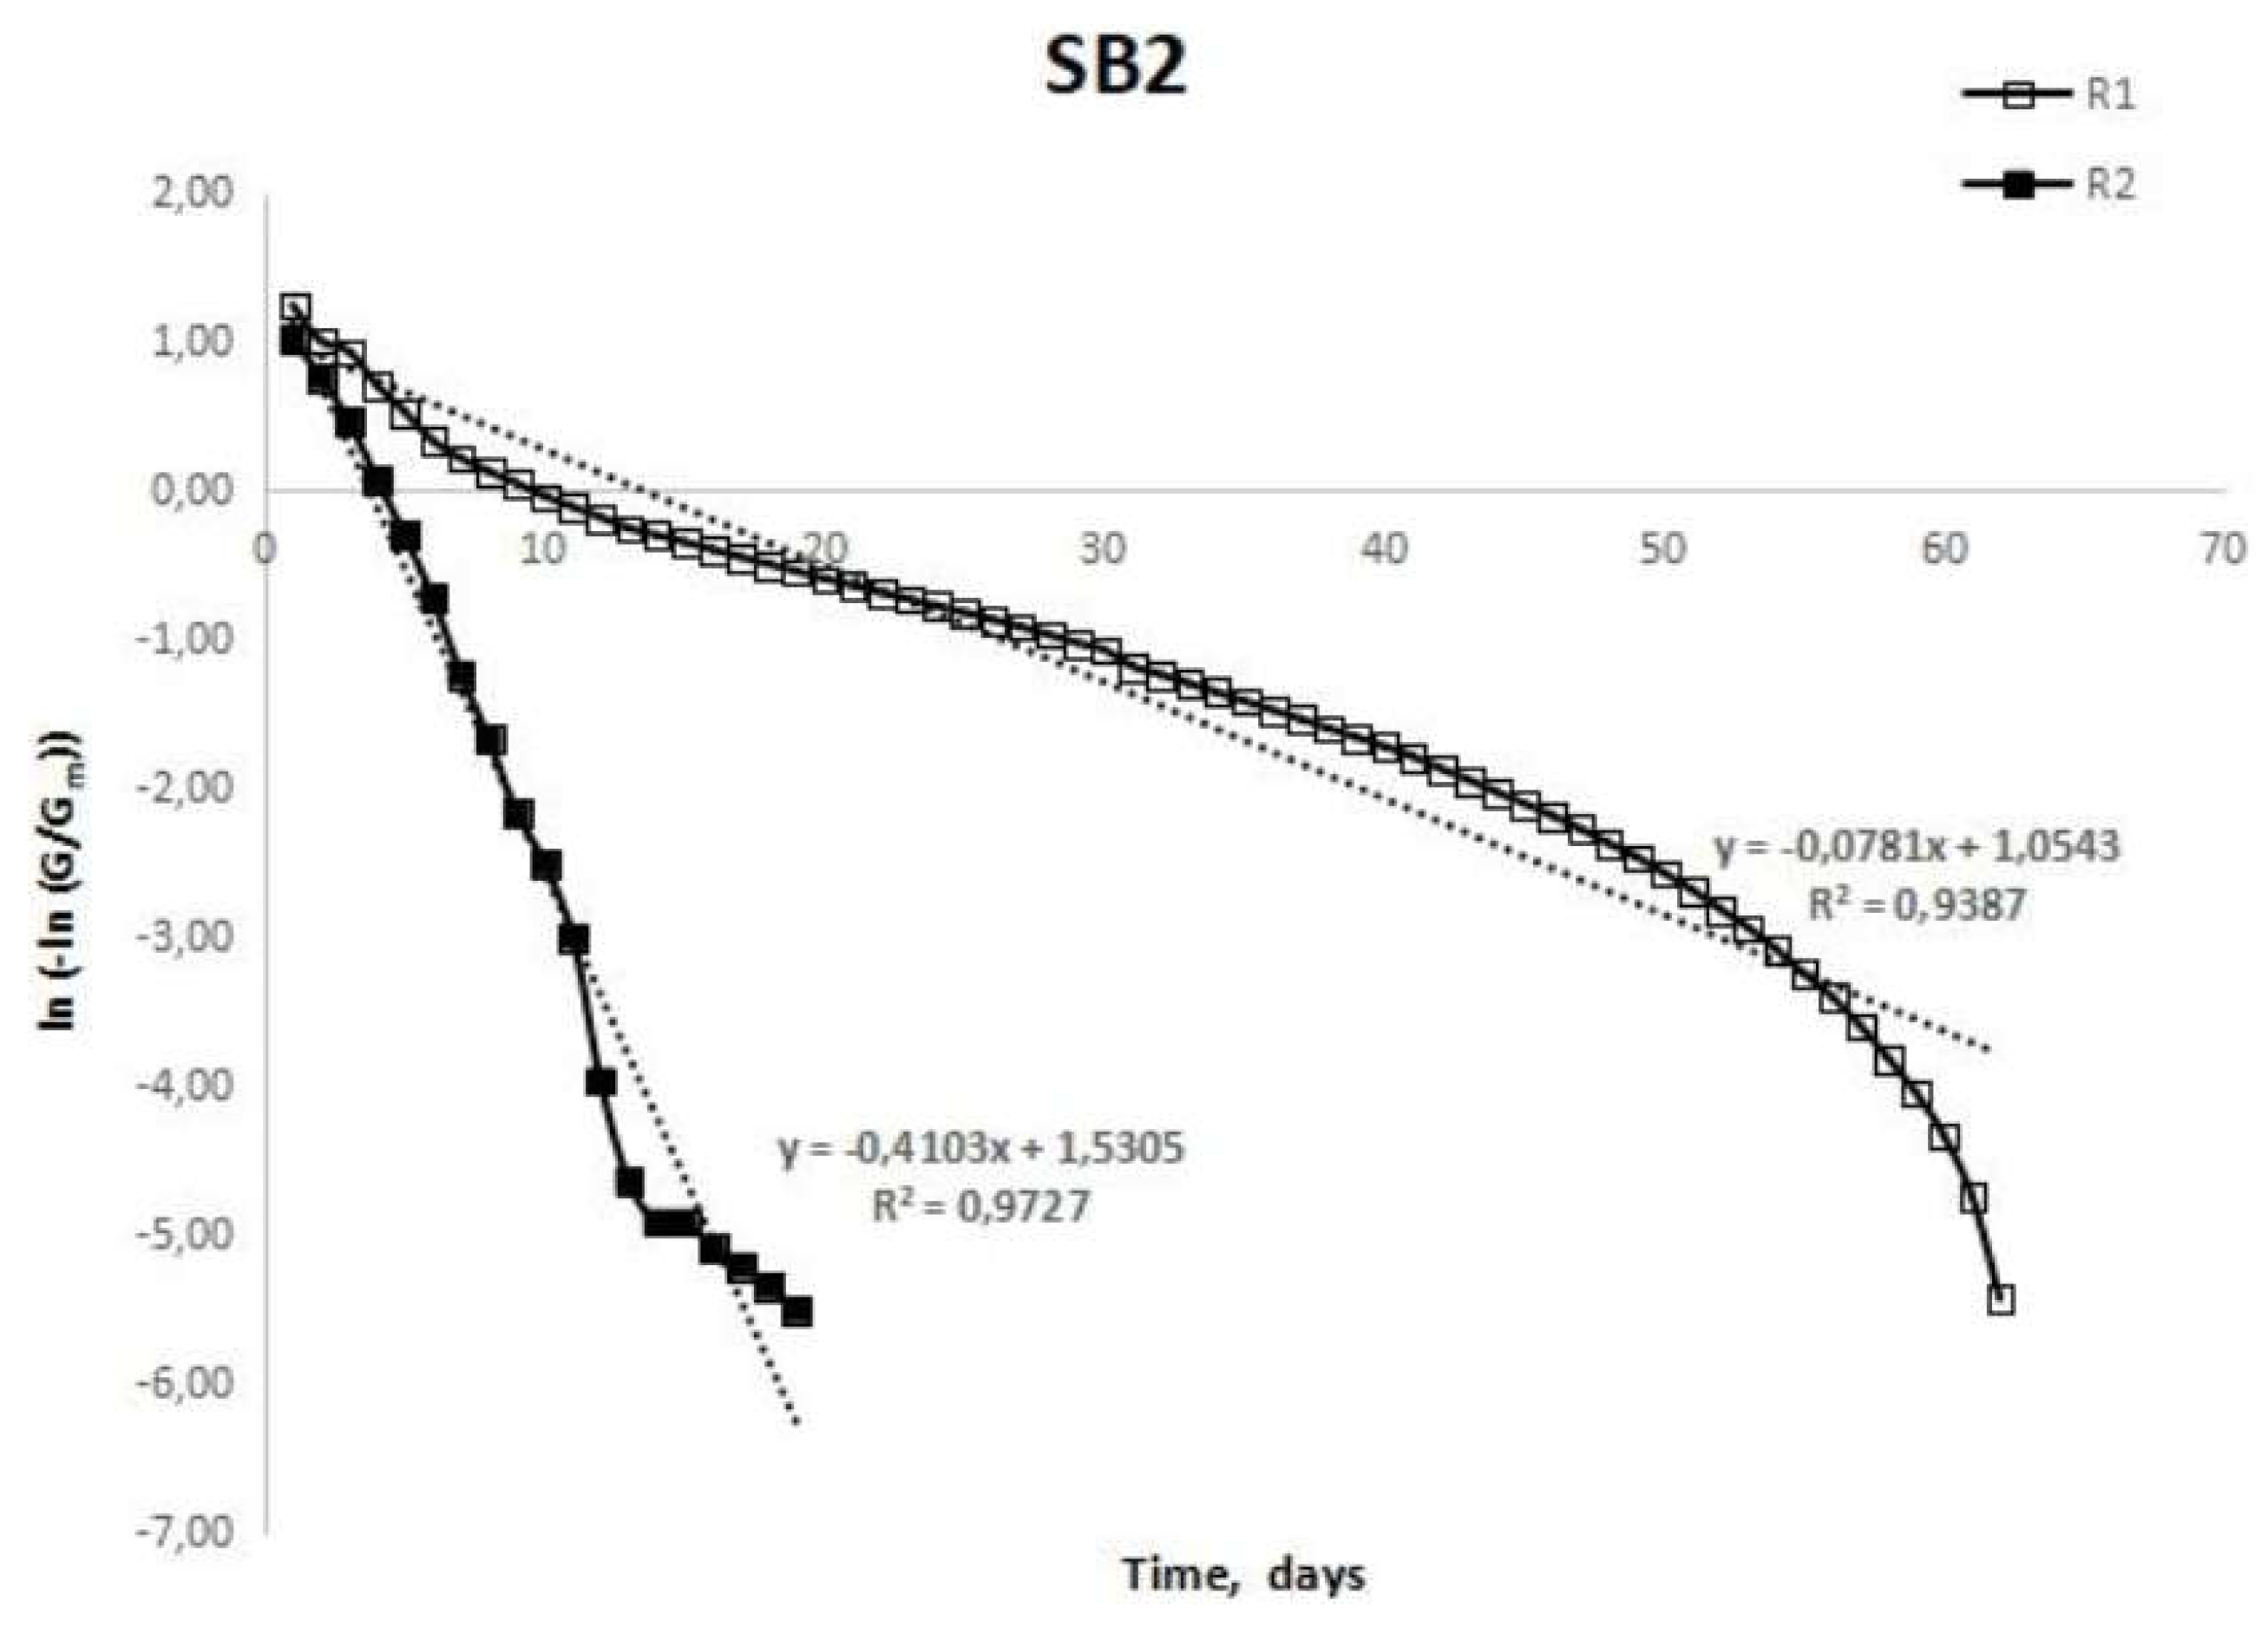
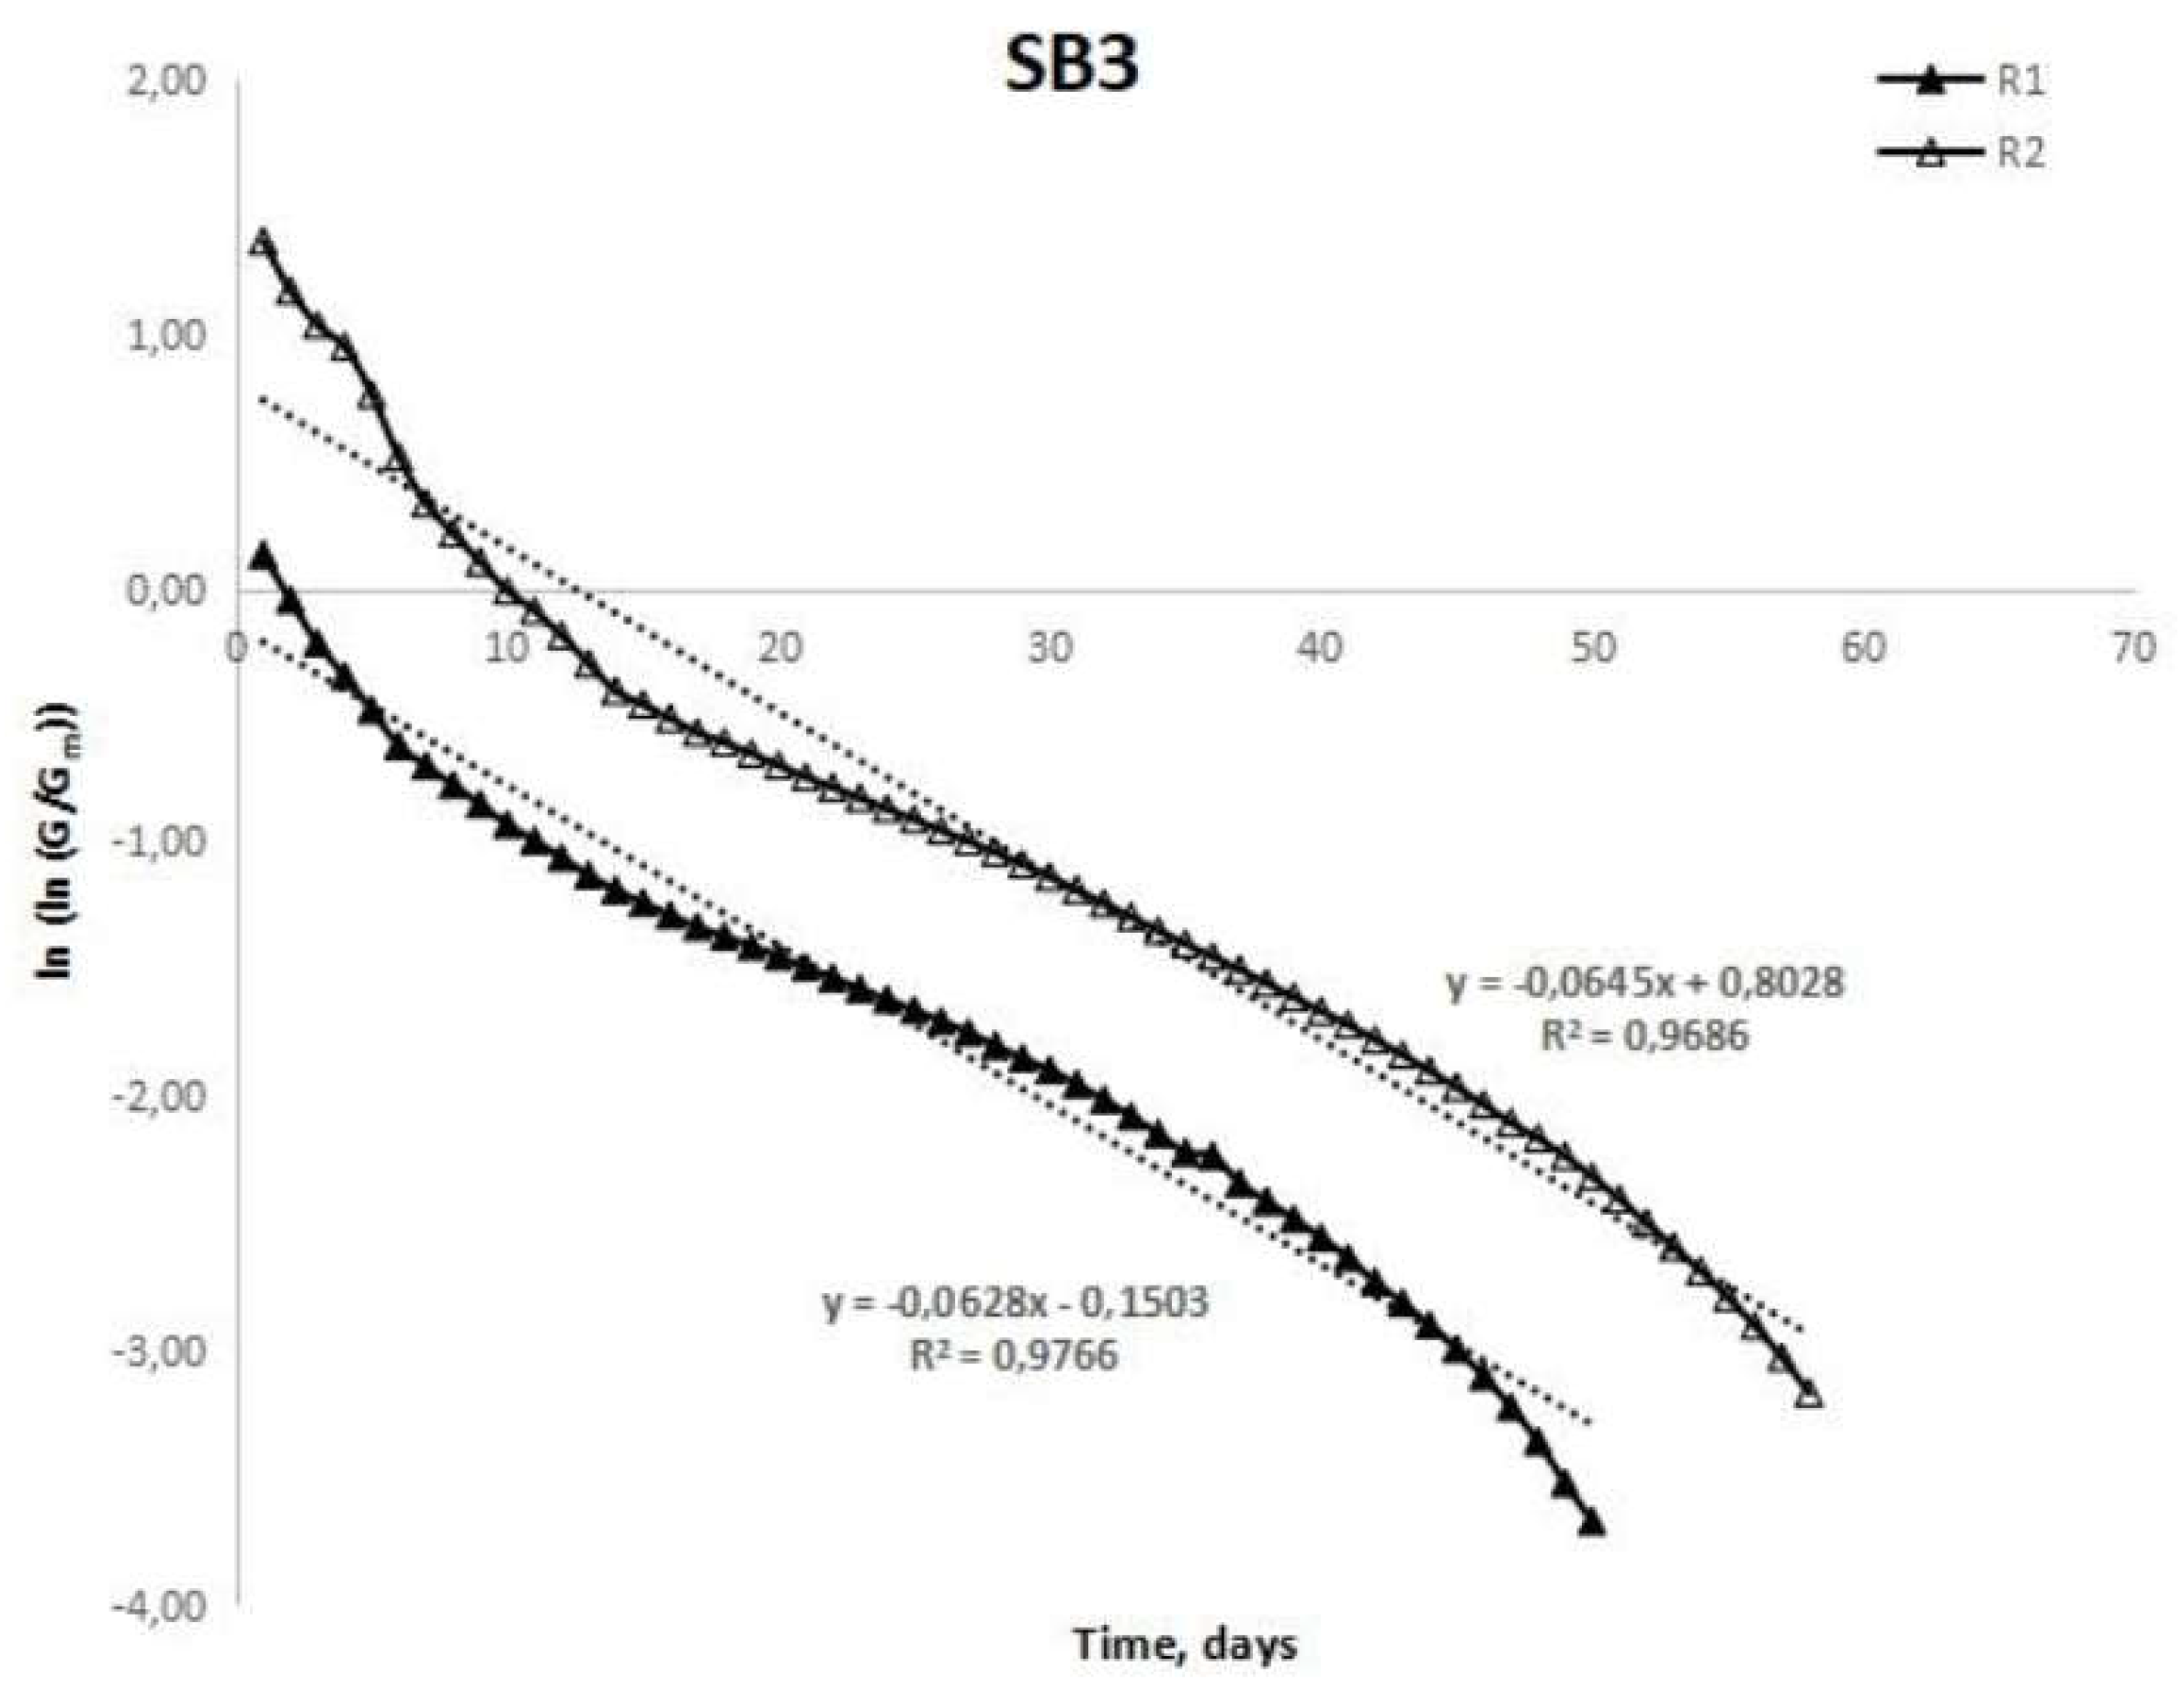
Figure 1, Figure 2 and Figure 3 ilustrate the kinetic model fitting for three studies. Two replicates were developed for each study. All of them are perfectly fitted to Modified Gompertz model because the regression coefficients were too elevated.
There is not lag phase (l) in SB3 because a previous pretreatment have been developed, and the experimental results fitted to kinetic model were taken after this pretreatment. Regarding lag phase from SB1 and SB2 values obtained present a methane volume lead time in SB1. This seems to indicate that the nanoparticles presence improve the methane production in the first stage. Lag phase average values of sorghum and corn stover (0.190 d and 2.648 d, respectively) obtained by González et al. [22] are the lowest in this research and there are very close experimental values of this work. Chiappero et al. [23] employed different biochars as catalysts during AD of mixed wastewater sludge, and the kinetic parameter Rmax for Modified Gompertz model ranged between 0.014-0.034 Nm3 kg VS-1 d-1, much lower values than results obtained in this work.

2.3. Different pretreatment for assays semi-continuous with PM and PWP

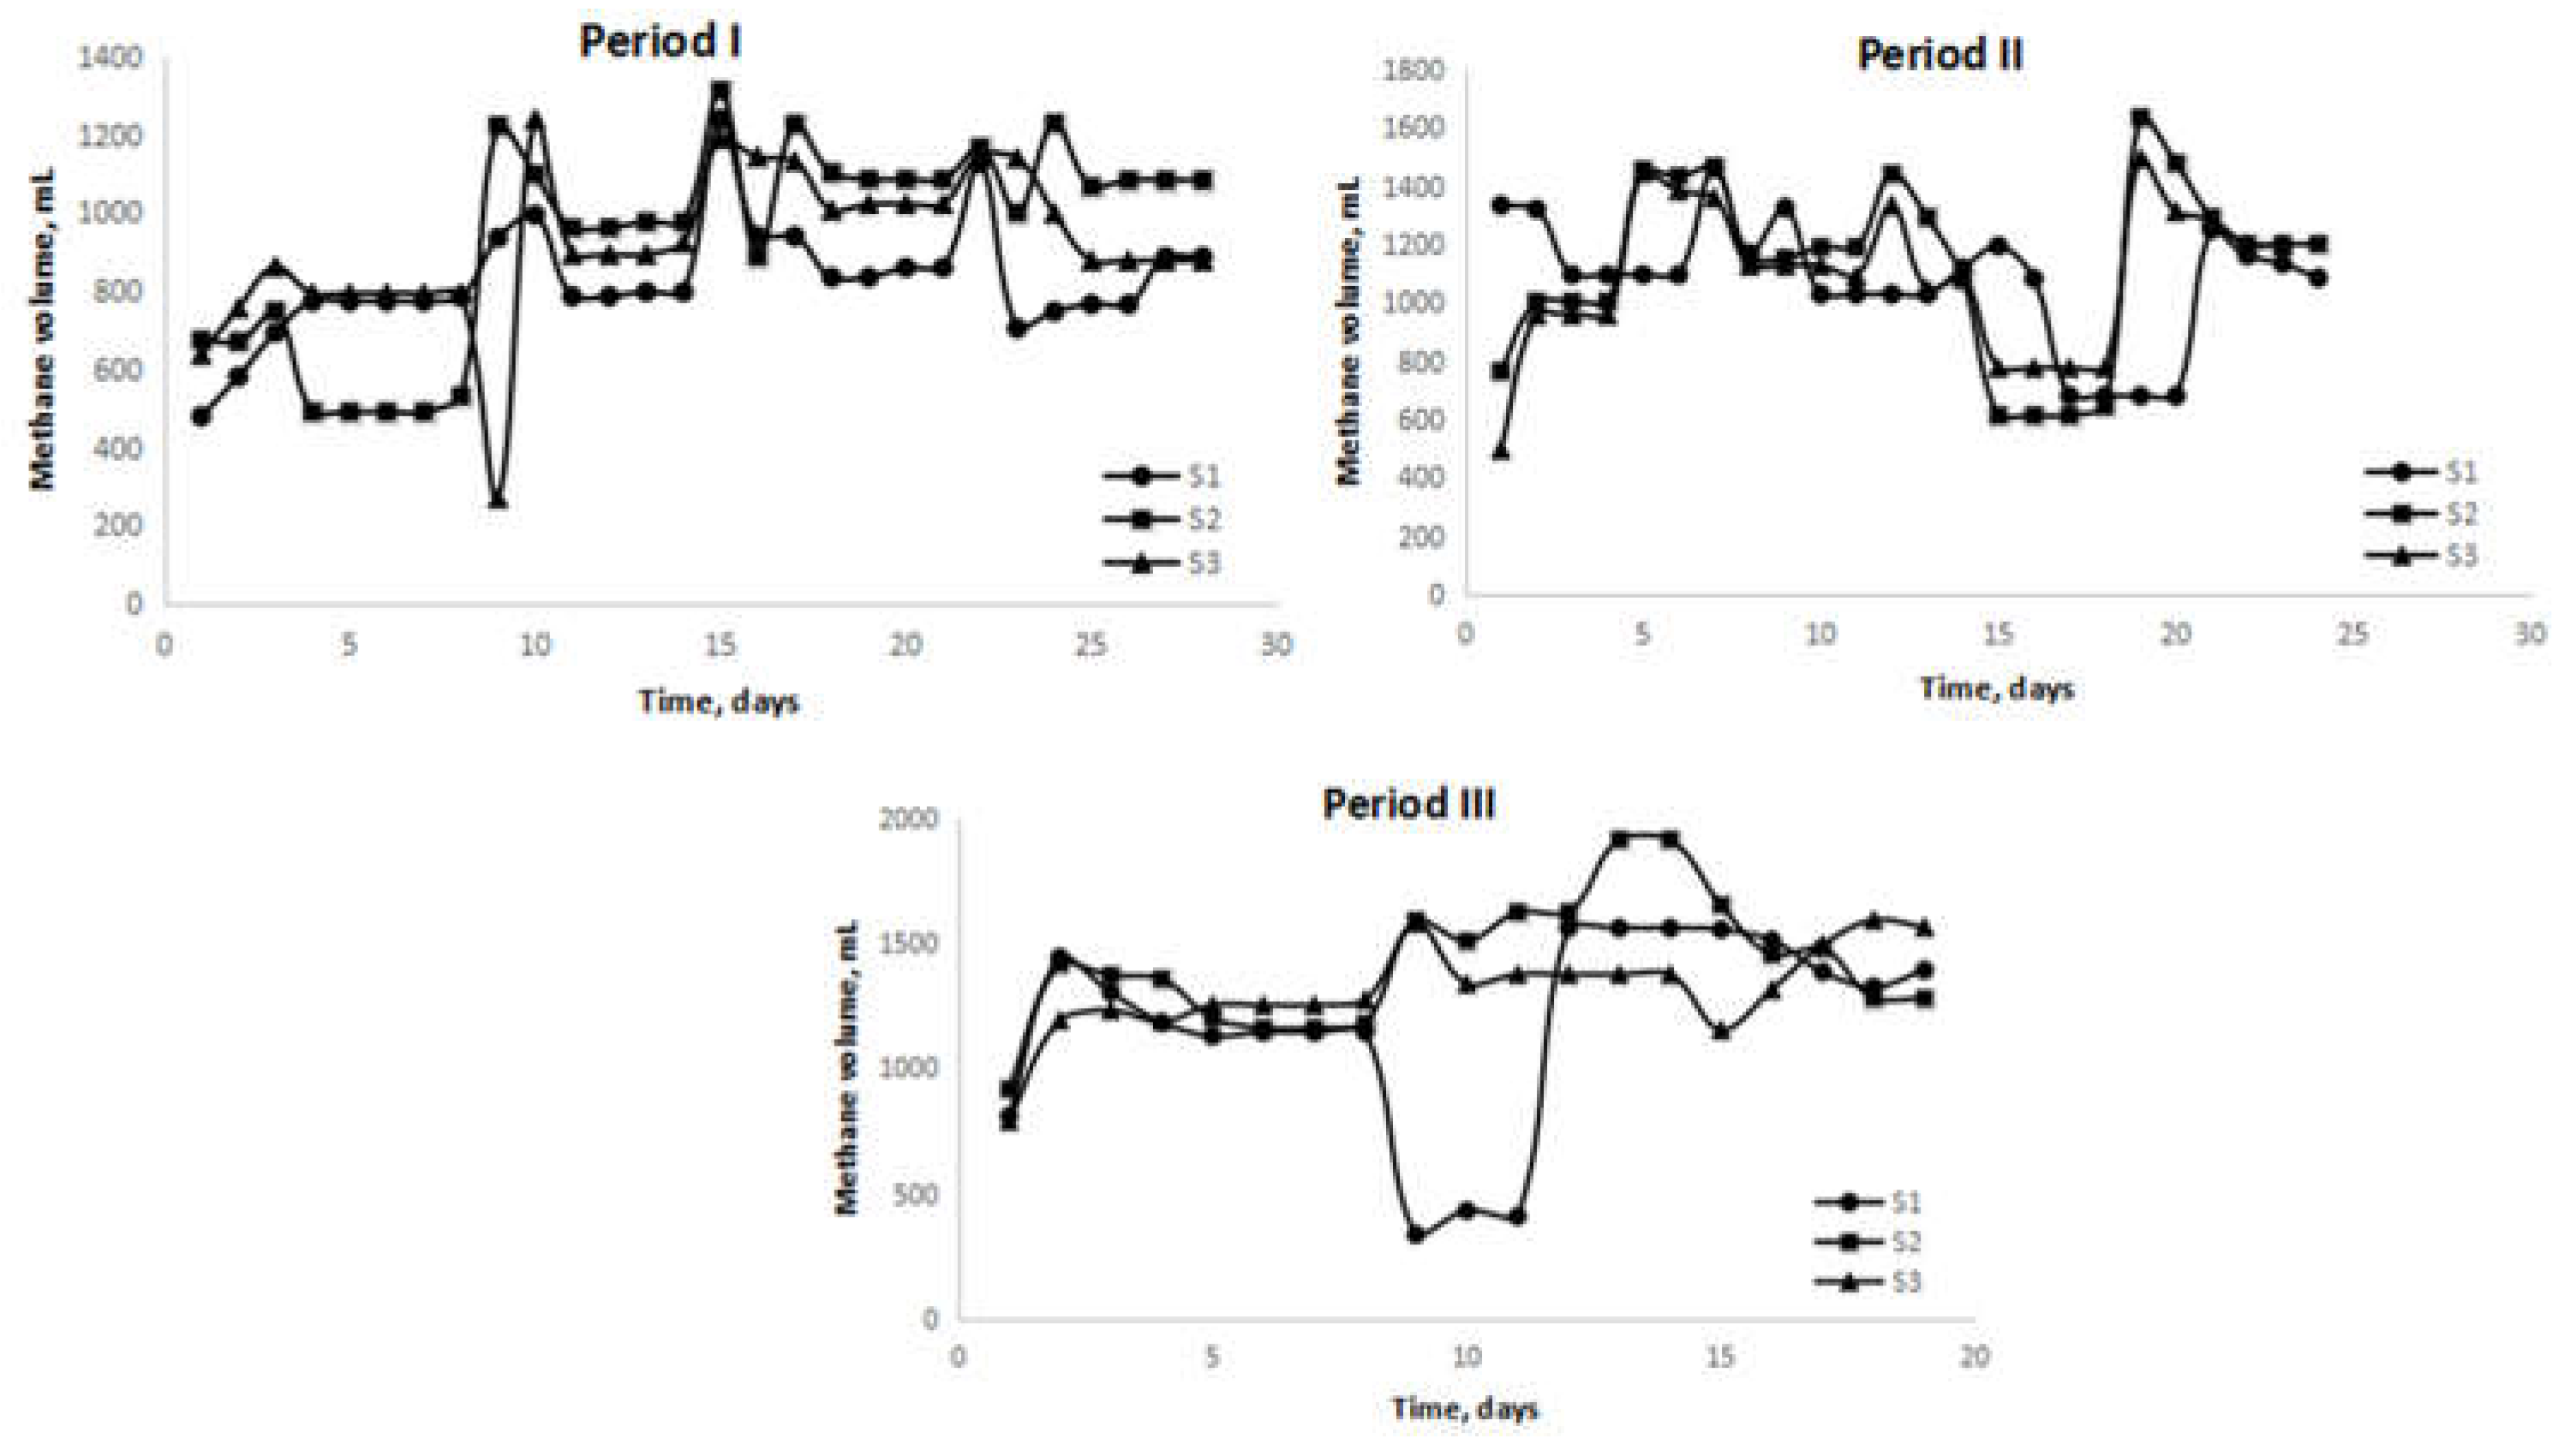
Each assays set were developed at different way: S1: PM with PWP; S2: PM with PWP developing thermal pretreatment and S3: PM with PWP developing thermal pretreatment and nanoparticles use (the employed dose (0.015 g/gVS) was the most productive for batch assay). In the Figure 4 can be observed the influence of the treatment carried out to increase the methane production for OLR evaluated (period I to III). Methane volume represented in Figure 4 along the time seems very similar for periods II and III. A light difference can be seen in period I obtaining the highest production for S2 and the lowest production for S1, this means the nanoparticles are not increasing the methane production in the AC-D for period I (in the Table 3 are not shown rises of methane production when nanoparticles are employed neither). Chen et al. [24] studied two types of magnetic nanoparticles (Ni ferrite nanoparticles and Ni Zn ferrite nanoparticles). They found an stimulation of the anaerobic digestion from synthetic municipal wastewater with a type of nanoparticles but an inhibition when the addition of the another type of nanoparticle was carried out to the anaerobic digestion medium. The values of methane yields and the diverse kinetic parameters obtained fitting experimental results to two kinetic models are represented in the Table 3.
According with the catalyst effect of the nanoparticles and the thermal pretreatment, kinetic parameters shown in the Table 2 reaction constants kB and k2 for each kinetic model fitted. The highest values of reaction constants belong to S2. This correspond to the assay with the most elevate methane yield, S2. Anyway reaction constants lower than obtained in this work have been obtained by other authors, 0.25 g COD g VS-1 d-1 has been reported by De la Lama D. et al. [25] for “alperujo” in semi-continuous anaerobic digestion of thermally-pretreated.
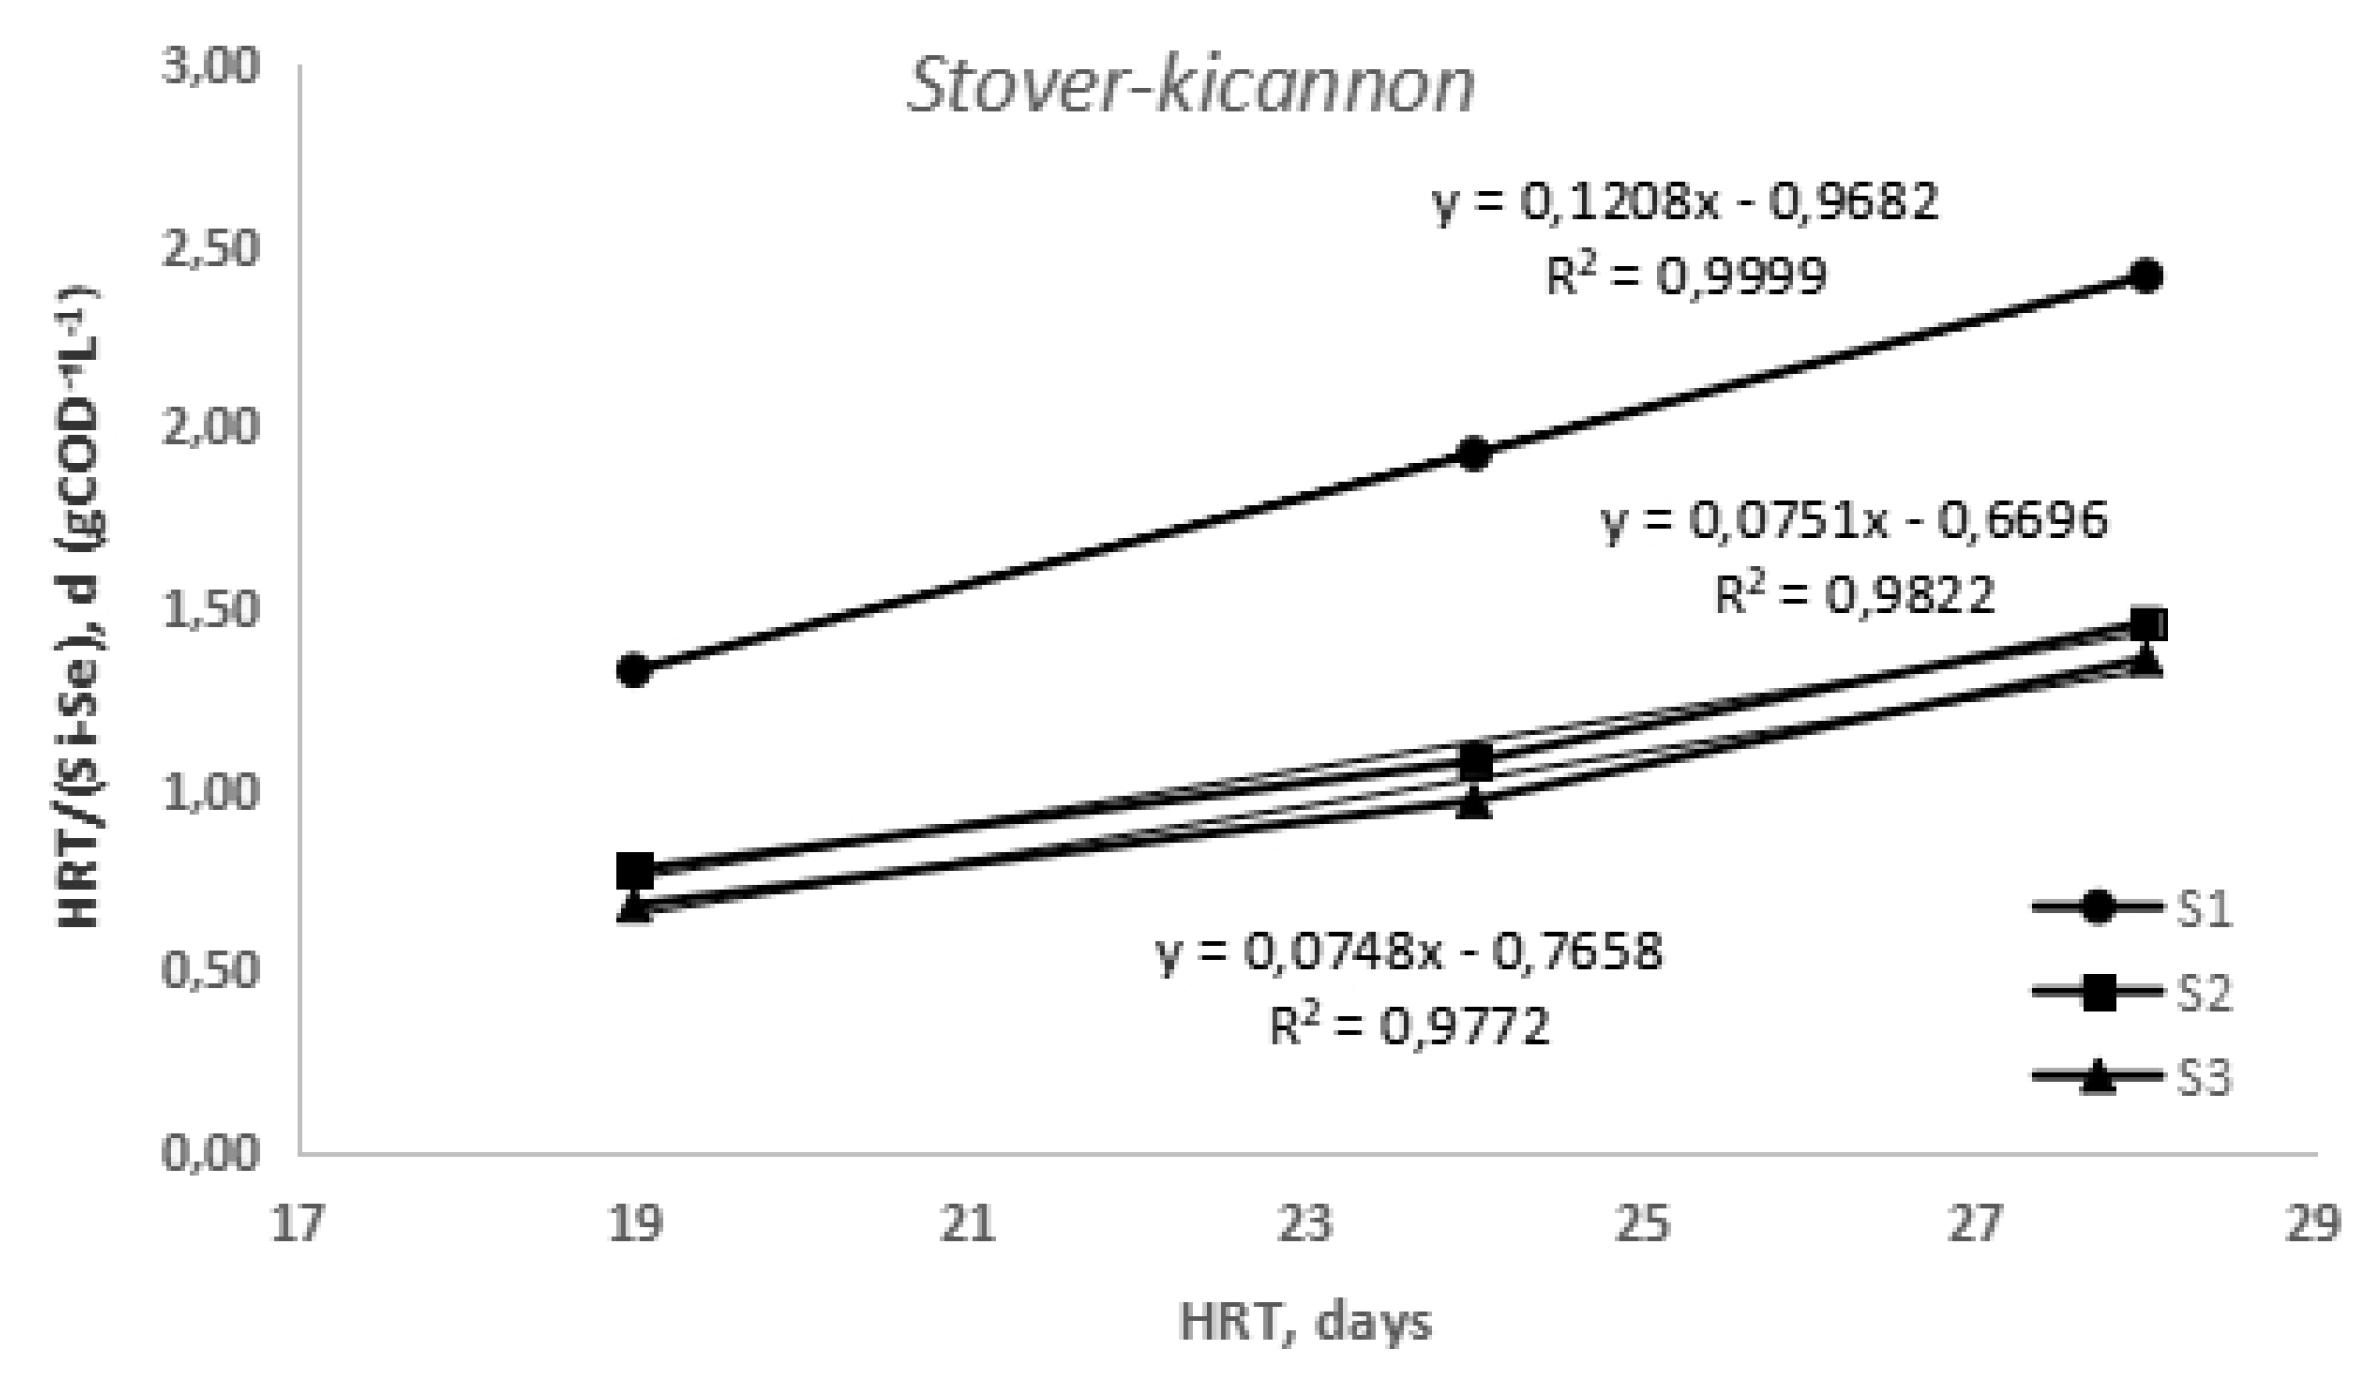
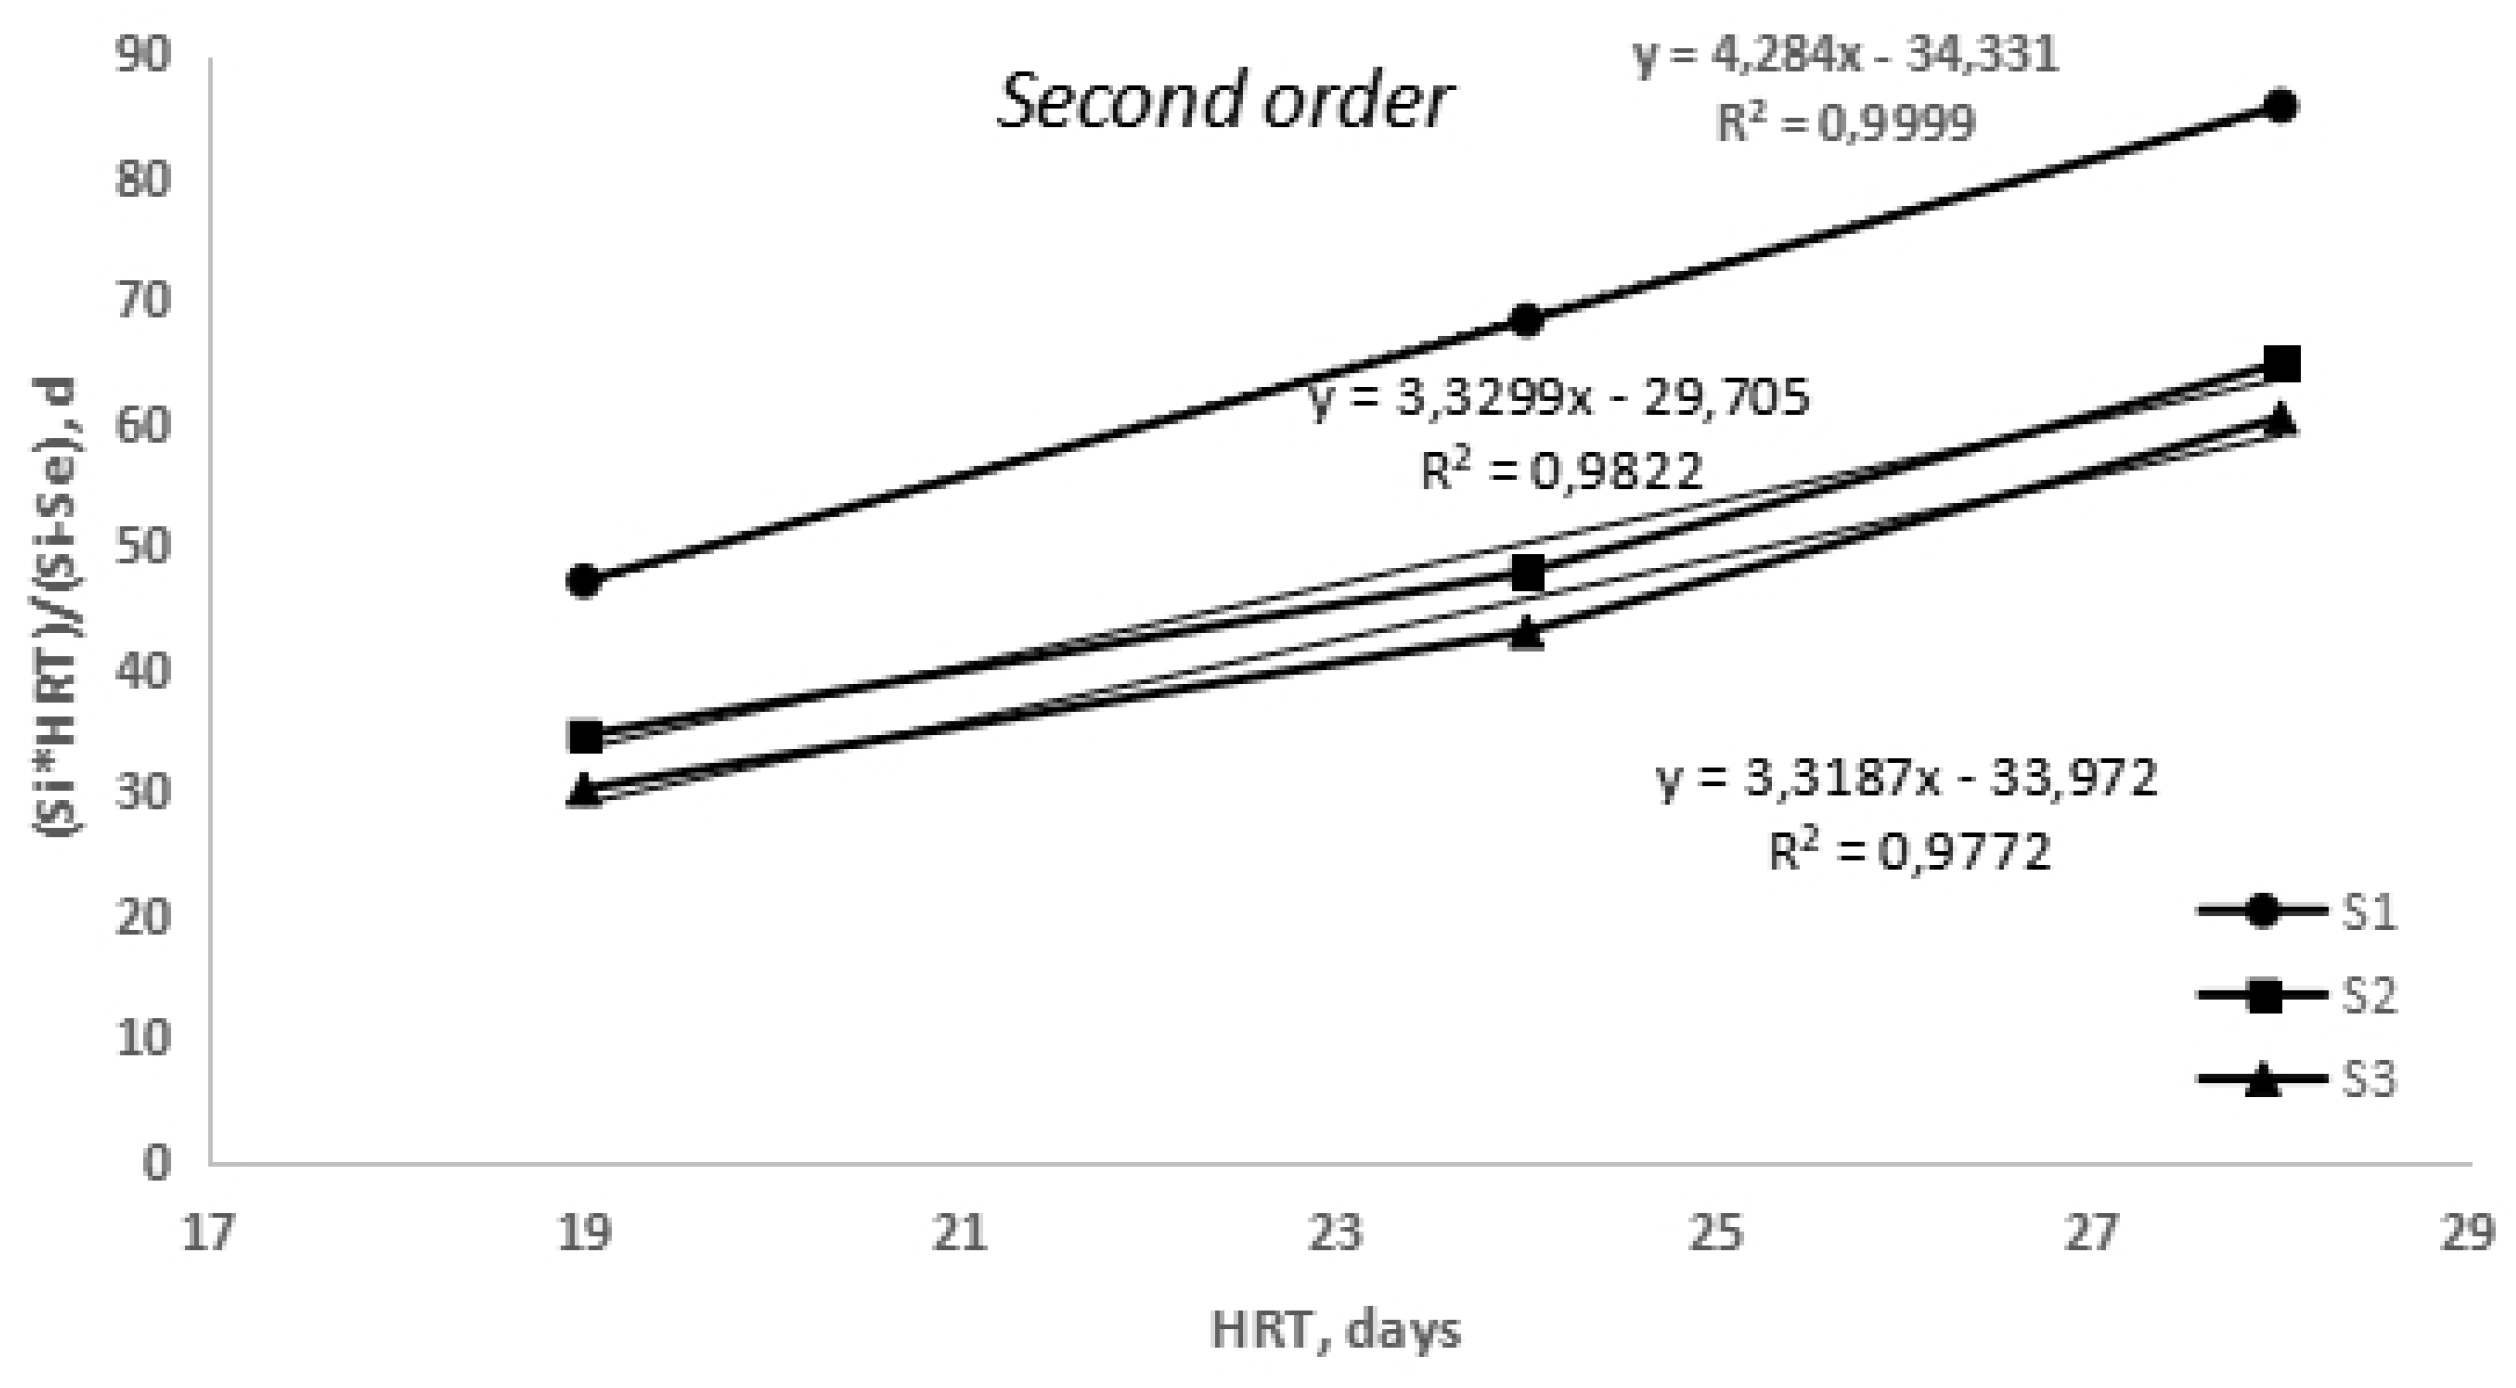
As can be shown in Figure 5 and Figure 6, experimental results from cumulative methane production from S1 and S2 experiments are perfectly fitted to Stover-Kicannon and second order models because their regression coefficients are elevated (0.9999, 0.9822 and 0.9772).

2.4. Effect of OLR on different parameter

Interactions study of parameters determined in the AC-D process and different values of OLR are represented in the Figure 7 and Figure 8. An expected direct interaction is presented in alkalinity when the OLR studied is increased. This means the process stability is increasing until 1.88 g VS LD-1 d-1 for three assays developed. This behaviour was found in a work carried out by Parralejo et al. [26] where the AC-D process in semi-continuous was evaluated for OLR ranged 1.2-1.8 g VS LD-1 d-1 for different mixtures with animal manure or nitrogen-rich biomass. However, VS parameter evolution with OLR shows a light decrease for the second period (small increases in methane yield (Table 3)). VFA and ammonia nitrogen parameters experiment direct interactions with the OLR evaluated in the most of the assays developed. This is a normal behaviour when the organic matter is enhanced. Nevertheless, values of VFA and ammonia nitrogen are below threshold values for stability of the processes (4000 mg L-1 and 5000 mg L-1 for ammonia nitrogen and VFA, respectively) [27].

2.5. Digestate pilot plant experiment

An experiment in a pilot plant was carried out for two OLR values (Period I and II). In this experiment was assessed a semi-continuous AC-D for PW and PM. Methane yield and digestate composition were evaluated for each OLR studied and results are shown in the Table 4.
Higher methane yield is obtained for period II (elevate OLR employed) than period I. In assays carried out in laboratory is not viewed this difference in S1. It can be due to the pepper substrate is pretreated previously and the organic matter can has been degraded in the pretreatment process. Completely all elements showed in the Table 4 are more elevate for period II than elements for period I. Anyway values for period II are right to the development of the AC-D process because the methane yield has a good value. If digestates obtained for two periods are evaluated as fertilizer, N, P and K nutrients are the most important. Normally P and K are often expressed as P2O5 and K2O, respectively. In the Table 5 nutrient composition assimilable by plants are exposed and a fertilizer classification for digestates according to a Spanish Standard [28].
In the classification of the Spanish Standard, fertilizers A are those that the lowest amount of Zn, Cu, Cr and Ni to have. The plant nutrient availability belong to 55 %, 64 % and 92 % for N, P2O5 and K2O, respectively [29].

3. Materials and Methods

3.1. Evaluated raw materials

This research employed as raw materials pig manure (PM) and pepper waste, without pretreatment (PW) and pretreated (PWP). PM was collected from a pig farm located in Guadajira (Badajoz, Spain) (+ 38 ° 51 '9.6768 ", - 6° 40' 15.5418"). PW was provided by a frozen vegetable factory. PW was composed by stem, peduncle and seeds so the heterogeneous waste were mixtured and chopped through a mechanical pre-treatment to get a homogeneous paste. Also, PWP was subjected to poliphenolic extraction method according to get a optimization in the waste valorization. Poliphenolic extraction employed water as solvent and ultrasound bath to be as close as possible to the most environmentally friendly techniques. PM was stored at room temperature, homogeneous paste PW was frozen and the extraction method of PW to get PWP was carried out weekly. An inoculum was employed to help the development of the specific microorganisms. The inoculum used in assays consisted of mixture of completely degraded organic material, with a high content of methanogenic microorganisms. Inoculum was composed by a mixture of prickly pear and pig manure.

3.2. Digester used and experimental design

Laboratory and pilot plant digesters were employed in this research, both of them made of stainless steel, with a central agitator electrically operated and adjustable by a potentiometer to get the mixture of substrates, and a thermostat to control the temperature inside the digesters. Laboratory digesters are coated of an outer jacket through which hot water circulates to maintain a constant temperature of the substrate and pilot plant digester has inner coil surrounding the walls for the hot water. The total volume of laboratory and pilot plant digesters are 6 L and 2000 L, respectively, but the used volumen for these experiments was 4.5 L and 1500 L, respectively. In this study mesophilic temperature range (38 ºC) was employed. At the beginning, three batch assays were developed (Table 6) to stablish the influence of the nanoparticles dose and the thermal pre-treatment presence: SB1 batch assay of PWP; SB2 batch assay of PWP with a determinated absorbent nanoparticles dose (0.064 g gVS-1); SB3 batch assay of PWP with another determinated absorbent nanoparticles dose (0.015 g gVS-1) and thermal pretreatment.
The ratio inoculum to PWP was 1:2 on VS basis. Nanoparticles used belong to a small factory (Smallops) located in Badajoz (Extremadura, Spain) that manufacture the product from organic waste. After were carried out the semi-continuous assays sets (S1 to S3). The studied fed was: S1: PM with PWP; S2: PM with PWP developing thermal pre-treatment; S3: PM with PWP developing thermal pre-treatment and nanoparticles use. The working procedure from semi-continuous regime assays consisted of a daily feeding of substrates mixture. A hopper on the top of the digesters with a ball valve was employed to introduce the substrates mixture and another valve located on the side of the digester was used to extract digestate. Three different OLR (1.26 g SV LD-1 d-1, 1.47 g SV LD-1 d-1and 1.88 g SV LD-1 d-1) were studied for each assays set. Each OLR evaluated was considered a study period. In the Table 6 is shown the experimental design. Finally, a pilot plant experiment was carried out studying a mixture of 50 % of PM and 50 % of PW (on VS basis).

3.3. Analytical methods

APHA standard methods [30] were employed to characterizate substrates used. Drying the sample to constant weight in an oven (JP Selecta Digitheat, USA) at 105 ° C for 48 h (2540 B method) and at 550 ° C for 2 h in a muffle oven (Hobersal 12PR300CCH, Spain) using an inert atmosphere (2540 E method) were the way to determinate Total Solid (TS) and Volatile Solid (VS) in the samples analyzed. Specific electrodes were employed to measure the pH and redox potential values of the digestion medium conected to pH meter (Crison Basic 20, Spain). To determinate the alkalinity of the medium the method 2320 was employed, the Chemical Oxygen Demand (COD) the method 410.4 [31], the ammonia nitrogen (N-NH4) by volumetric titration according to the E4500-NH3 B method and Total Volatile Fatty Acids (VFA) according to Buchauer's volumetric method [32]. The ratio between N and C nutrients was analyzed by a True-Spec CHN Leco 4084 elementary analyzer (USA), according to the UNE-EN 16948 standard for biomass analysis C, N, H [33]. A constant monitoring of biogas volume and it composition was carried out with an Awite System of Analysis Process series 9 analyzer (Bioenergie GmbH, Germany) (composed by different sensors to detected methane, carbon dioxide, hydrogen, hydrogen sulfide and oxygen concentration). The gas meter (Ritter model MGC-1 V3.2 PMMA, Germany) was employed to measure the biogas produced, which was stored in Tedlar bags. The biogas volume produced was corrected at standard conditions (0 ° C, 101,325 kPa). The digestate was featured by spectroscopy using an ICP-OES Varian 715 ES (Australia).

3.4. Evaluation of substrate removal kinetic models

For batch assays experimental results has been fitted to the kinetic model called Modified Gompertz [13]. For semi-continuous assays based on the substrate removal rate, Grau second-order multicomponent and Modified Stover-Kicannon models have been employed as kinetic models [25]. For the Grau second-order multicomponent model when multicomponent substrates are evaluated, the substrate removal rate can be expressed according to Eq. (1):
d S d t = k n ( s ) X ( S e S i ) n
where -dS/dt is the substrate removal rate, kn (s) is the reaction constant, X is the concentration of the microorganisms, which ca be assumed as constant, Se is the substrate concentration at any time and Si is the initial substrate concentration.
Integrating the Eq. (1) for n=2, and linearizing it after, the following linear expression is obtained, Eq. (2):
( S i H R T ) ( S i S e ) = H R T + S i k s X
The value of the second-order reaction constant can be obtained by the plot of the (Si·HRT)/(Si-Se) versus HRT. The term HRT is the Hidraulic Retention Time value for each set assay.
In Modified Stover-Kicannon model the substrate removal rate is expressed as function of the OLR as follow the Eqs. (3) (4):
d S d t = ( S i S e ) H R T
d S d t = U max ( S i H R T ) k B + ( S i H R T )
where dS/dt is the substrate removal rate, kB is the reaction constant, Umax is the maximum substrate removal rate, Si and Se are the substrate concentrations explained above, and HRT the Hidraulic Retention Time, as it has been specificated before. When Eqs. (3) and (4) are equalized and integrated, and the resulting expression is linearized after, the Eq. (5) is obtained, as it is followed:
H R T ( S i S e ) = k B U max H R T S i + 1 U max
Experimental results fitted to Eq. (5) give a linear expression where the reaction constant can be obtained from the slope.

4. Conclusions

A comparative batch and semi-continuous assays have been developed among AC-D processes of pig manure and pepper waste including absorbent nanoparticles and/or strategies of waste pretreatment as catalysts. For batch assays kinetic parameters specify the presence of nanoparticles in the medium supports quickly production methane rate (higher Rmax values for SB2 and SB3 than Rmax for SB1, and the lag phase lowest for SB2). The studied influence of the treatment carried out to in the methane production for OLRs evaluated (period I to III) for semi-continuous assays shows lightly more elevate values for thermal pretreatment assay. Effect of OLR on alkalinity, VS, ammonia nitrogen and VFA have been evaluated. As a general rule, a direct interaction among the parameters assessed and the OLR have been found. Finally, digestates from experiment pilot plant evaluated in two OLR values have been assessed and classificated according a Spanish Standard.

Acknowledgments

The authors are grateful to the funding support by the National Institute of Research and Agro-Food Technology (INIA) and co-financed with FEDER funds (PID2019-105039RR-C42)

References

  1. Directiva (UE) 2018/2001 del Parlamento Europeo y del Consejo de 11 de Diciembre de 2018 relativa al fomento del uso de energía procedente de fuentes renovables. Estrasburgo, Francia. 2018.
  2. Manual sobre las Biorrefinerías en España. Spain. 2017.
  3. VII Plan Regional de Investigación, Desarrollo Tecnológico e Investigación de Extremadura 2022-2025. Mérida, España. 2022.
  4. Instituto Nacional de Estadística. Available online: https://www.ine.es/jaxi/Datos.htm?path=/t26/p067/p02/residuos/serie/l0/&file=02001.px (accessed on 3 January 2023).
  5. Ministerio de Agricultura, Pesca y Alimentación: Cifras del sector de frutas y hortalizas. Madrid, España, 2022.
  6. Ros, M.; Pascual, JA.; Ayuso, M.; Morales, AB.; Miralles, JR.; Solera, C. Salidas valorizables de los residuos y subproductos orgánicos de la industria de los transformados de frutas y hortalizas: proyecto LIFE+Agrowaste. Residuos: Revista Técnica, 2012, 22, 28–35. [Google Scholar]
  7. Vulic, J.; Seregelj, V.; Kalusevic, A.; Levic, S.; Nedovic, V.; Saponjac, VT.; Canadanovic-Brunet, J.; Cetkovic, G. Bioavailability and bioactivity of encapsulated phenolics and carotenoids isolated from red pepper wastes. Molecules, 2019, 24, 2837. [Google Scholar] [CrossRef] [PubMed]
  8. Mórtola, N.; Romaniuk, R.; Consentino, V.; Eiza, M.; Carfagno, P.; Rizzo, P.; Bres, P.; Riera, N.; Roba, M.; Butti, M.; Sainz, D.; Brutti, L. Potential Use of a Poultry Manure Digestate as a Biofertiliser: Evaluation of Soil Properties and Lactuca sativa Growth, Pedosphere, 2019, 29, 60-69; [CrossRef]
  9. Riaño, B.; Molinuevo-Salcés, B.; Parralejo, A.; Royano, L.; González, J.; García-González, MC. Techno-economic evaluation of anaerobic co-digestion fo pepper waste and swine manure. Biomass Conversion and Biorefinery, 2021. [Google Scholar] [CrossRef]
  10. Li, R.; Tan, W.; Zhao, X.; Dang, Q.; Song, Q.; Xi, B.; Zhang, X. Evaluation on the Methane Production Potential of Wood Waste Pretreated with NaOH and Co-Digested with Pig Manure. Catalysts, 2019, 9, 539. [Google Scholar] [CrossRef]
  11. Madondo, N.I.; Tetteh, E.K.; Rathilal, S.; Femi Bakare, B. Application of Bioelectrochemical System and Magnetite Nanoparticles on the Anaerobic Digestion of Sewage Sludge: Effect of Electrode Configuration. Catalysts, 2022, 12, 642. [Google Scholar] [CrossRef]
  12. Goswami, L.; Kushwaha, A.; Singh, A.; Saha, P.; Choi, Y.; Maharana, M.; Patil, S.V.; Kim, B.S. Nano-Biochar as a Sustainable Catalyst for Anaerobic Digestion: A Synergetic Closed-Loop Approach. Catalysts, 2022, 12, 186. [Google Scholar] [CrossRef]
  13. Tetteh, E.K.; Rathilal, S. Kinetics and Nanoparticle Catalytic Enhancement of Biogas Production from Wastewater Using a Magnetized Biochemical Methane Potential (MBMP) System. Catalysts, 2020, 10, 1200. [Google Scholar] [CrossRef]
  14. Somridhivej, B.; Boyd, C.E. An assessment of factors affecting the reliability of total alkalinity measurements. Aquaculture, 2016, 459, 99–109. [Google Scholar] [CrossRef]
  15. Flotats, X.; Bonmatí, A.; Campos, E.; Antúnez, M. Ensayos en discontinuo de co-digestión anaerobia termofílica de purines de cerdo y lodos residuales. Información Tecnológica, 1999, 10, 79–85. [Google Scholar]
  16. Zhang, W.; Kong, T.; Xing, W.; Li, R.; Yang, T.; Yao, N.; Lv, D. Links between carbon/nitrogen ratio, synergy and microbial characteristics of long-term semi-continuous anaerobic co-digestion of food waste, cattle manure and corn straw. Bioresource Technology, 2022, 343, 126094. [Google Scholar] [CrossRef]
  17. Xiao, Y.; Zan, F.; Zhang, W.; Hao, T. Alleviating nutrient imbalance of low carbon-to-nitrogen ratio food waste in anaerobic digestion by controlling the inoculum-to-substrate ratio. Bioresource Technology, 2022, 346, 126342. [Google Scholar] [CrossRef]
  18. Slopiecka, K.; Liberti, F.; Massoli, S.; Bartocci, P.; Fantozzi, F. Chemical and physical characterization of food waste to improve its use in anaerobic digestion plants. Energy Nexus, 2022, 5, 100049. [Google Scholar] [CrossRef]
  19. Samoraj. M.; Mironiuk, M.; Izydorczyk, G.; Witek-Krowiak, A.; Szopa, D.; Moustakas, K.; Chojnacka, K. The challenges and perspectives for anaerobic digestion of animal waste and fertilizer application of the digestate. Chemosphere, 2022, 295, 133799. [Google Scholar] [CrossRef] [PubMed]
  20. Arhoun, B.; Villen-Guzman, M.; Gomez-Lahoz, C.; Rodriguez-Maroto, J.M.; Garcia-Herruzo, F.; Vereda-Alonso, C. Anaerobic co-digestion of mixed sewage sludge and fruits and vegetable wholesale market waste: Composition and seasonality effect. Journal of Water Process Engineering, 2019, 31, 100848. [Google Scholar] [CrossRef]
  21. Gallego, L.M.; Portillo, E.; Navarrete, B.; González, R. Estimation of methane production through the anaerobic digestion of greenhouse horticultural waste: A real case study for Almeria region. Science of the Total Environment, 2022, 807, 151012. [Google Scholar] [CrossRef] [PubMed]
  22. González, J.F.; Parralejo, A.I.; González, J.; Álvarez, A.; Sabio, E. Optimization of the production and quality of biogas in the anaerobic digestion of different types of biomass in a batch laboratory biodigester and pilot plant: Numerical modeling, kinetic study and hydrogen potential. International Journal of Hydrogen Energy,. 2022, 43 (93), 39386-39403.. [CrossRef]
  23. Chiappero, M.; Cillerai, F.; Berruti, F.; Masek, O.; Fiore, S. Addition of Different Biochars as Catalysts during the Mesophilic Anaerobic Digestion of Mixed Wastewater Sludge. Catalysts, 2021, 11, 1094. [Google Scholar] [CrossRef]
  24. Chen, J.L.; Steele, T.W.J.; Stuckey, D.C. The effect of Fe2NiO4 and Fe2NiO4Zn magnetic nanoparticles on anaerobic digestion activity. Science of the Total Environment. 2018, 276-284. [CrossRef]
  25. De la Lama, C.; Borja, R.; Rincón, B. Performance evaluation and substrate removal kinetics in the semi-continuous anaerobic digestion of thermally pretreated two phase olive pomace or “Alperujo”. Process Safety and Environmental Protection, 2017, 105, 288–296. [Google Scholar] [CrossRef]
  26. Parralejo, A.I.; Royano, L.; Cabanillas, J.; González, J. Biogas from Nitrogen-Rich Biomass as an Alternative to Animal Manure Co-Substrate in Anaerobic Co-Digestion Processes. Enegies, 2022, 15, 5978. [Google Scholar] [CrossRef]
  27. Drosg, B. Process monitoring in biogas plant.International Energy Agency (IEA) Bioenergy. Task 37 – Energy from Biogas and Landfill Gas, 2017.
  28. RD 535/2017 sobre productos fertilizantes de 26 de Mayo.
  29. Agriculture & Horticulture Development Board (AHDB). Nutrient Management Guide (RB209), Section 2: Organic materials, 2017, 35.
  30. APHA, Standard Methods for Examination of Water and Wastewater, 22 ed. American Public Health Association Washington, DC, 2012.
  31. EPA-600/4-79-020. Methods for Chemical Analysis of Water and Wastes, Environmental Protection Agency. Environmental Monitoring and Support Laboratory, U.S., 1983.
  32. Buchauer, K. Titrations verfahren in der Abwasserund Schlam-manalytik zur Bestimmung von flüchtigen organischen Säuren. Das Gas- und Wasserfach (gfw). Wasser Abwasser, 1997, 138, 313–320. [Google Scholar]
  33. Norma UNE-EN 16948. Biocombustibles sólidos, Determinación de contenido total de C, H y N. Método instrumental, 2015.
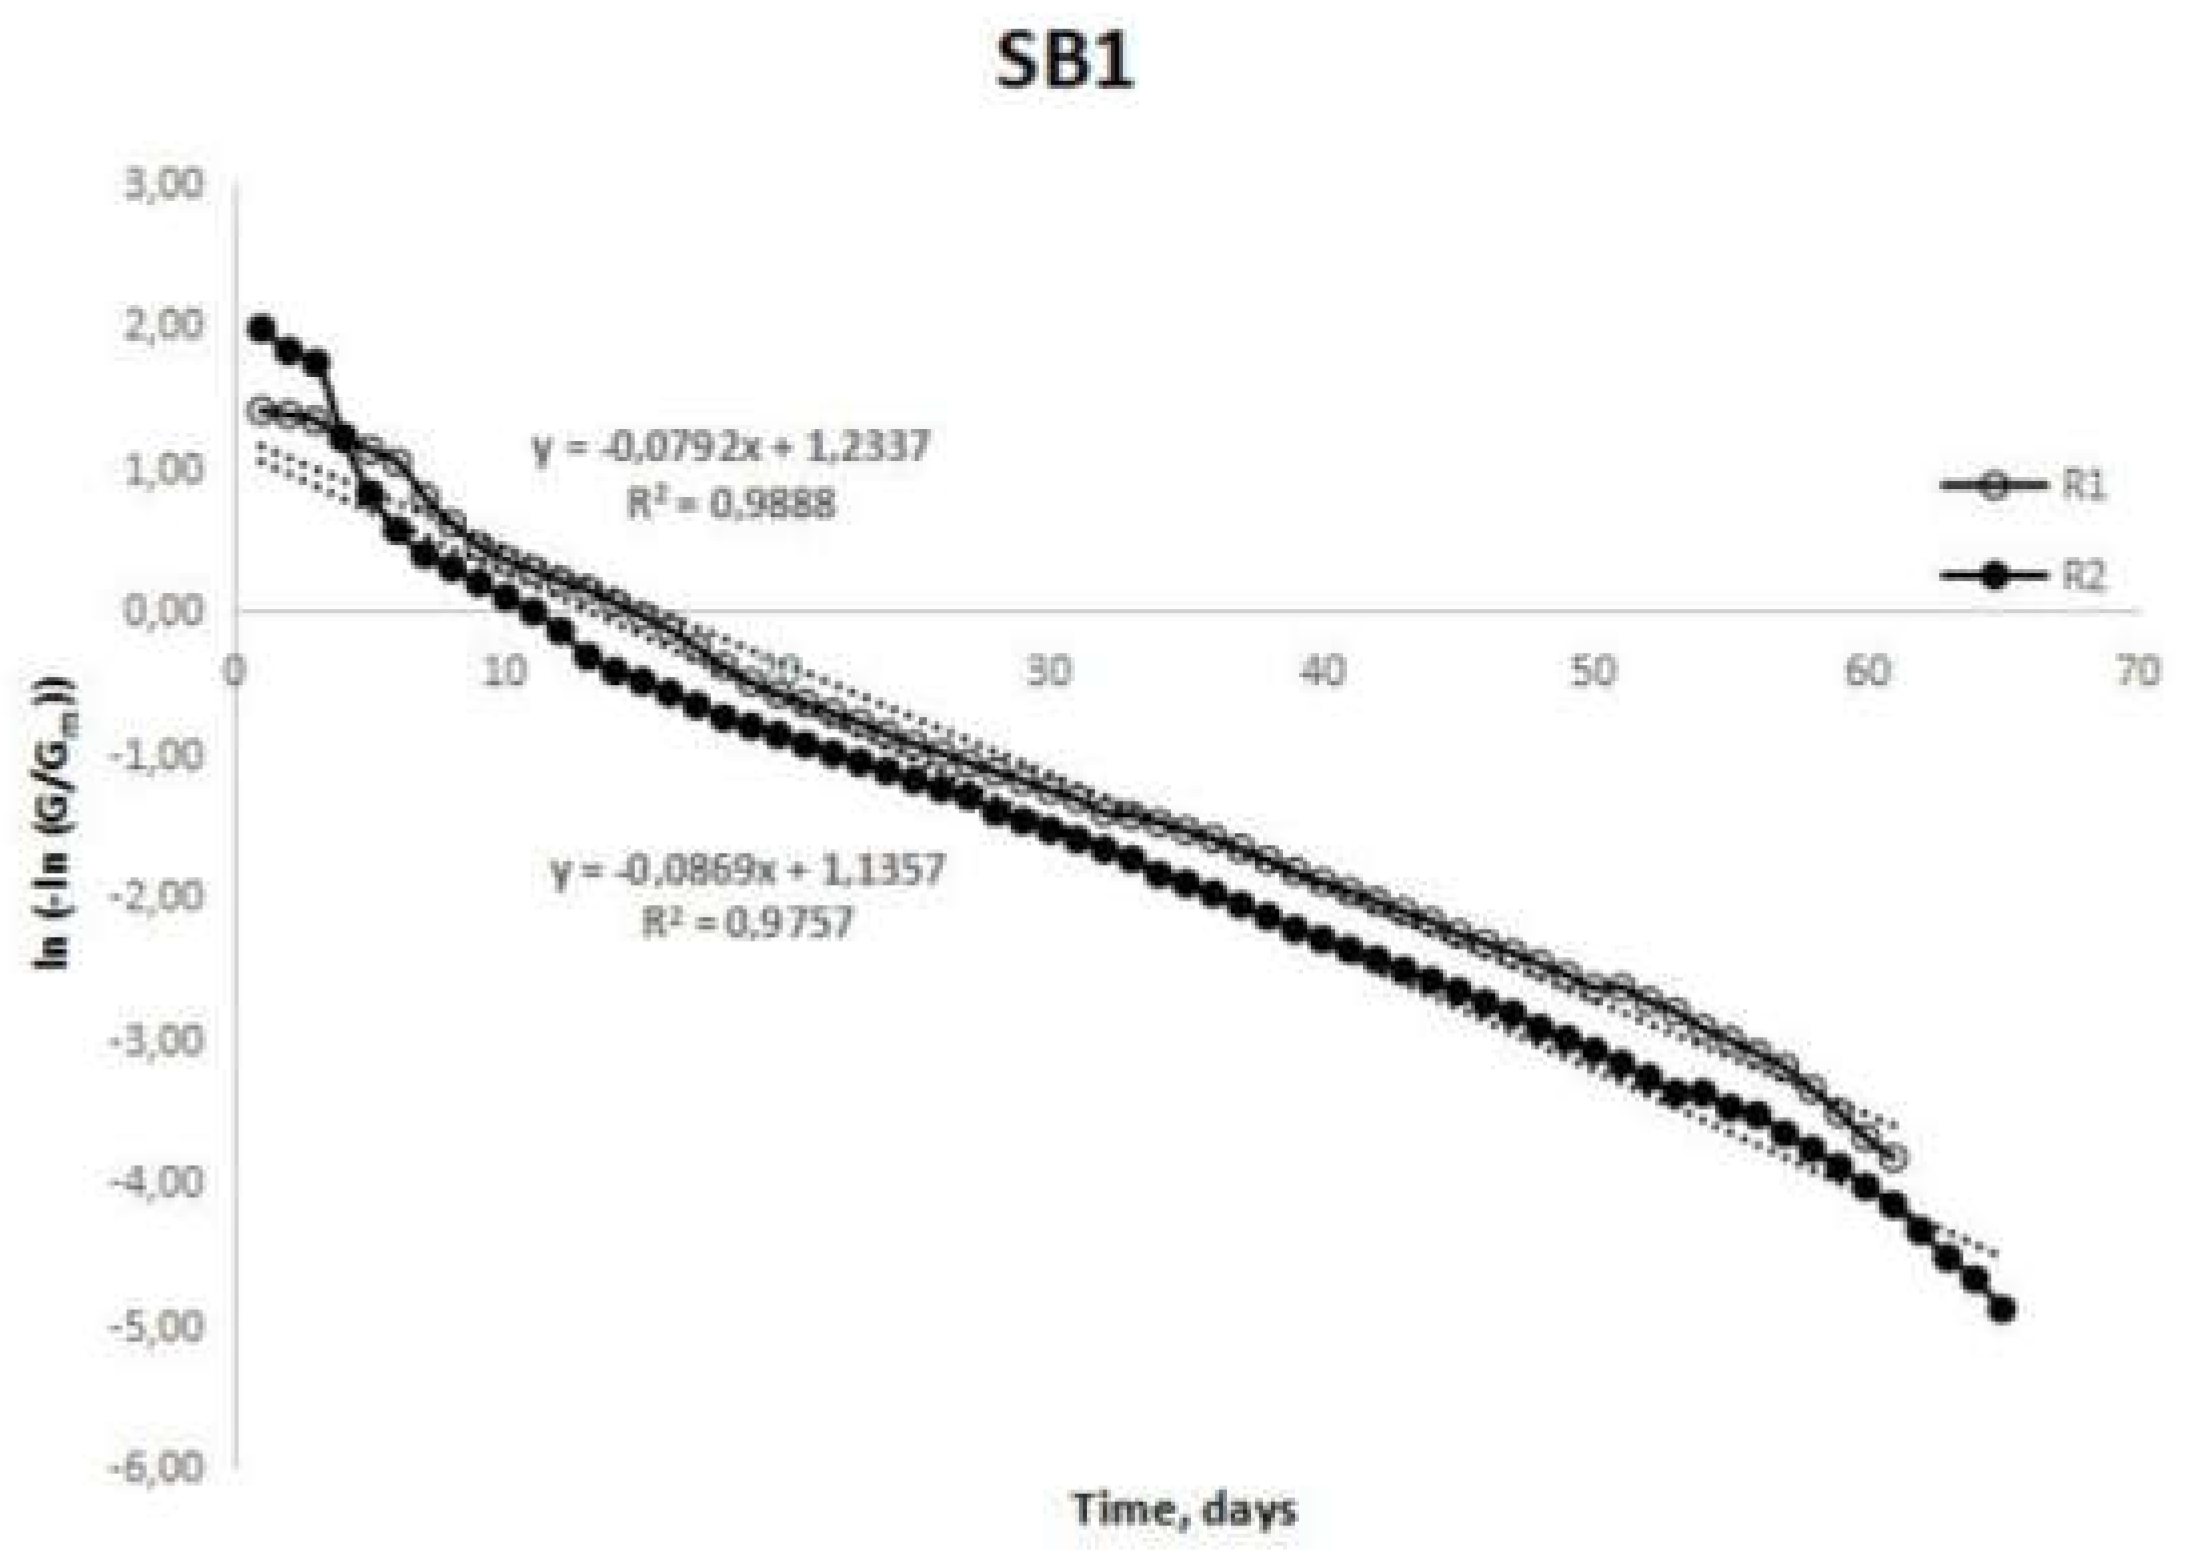
Figure 1. Experimental results fitted to the Modified Gompertz model for SB1.
Preprints 74174 g001
Figure 2. Experimental results fitted to the Modified Gompertz model for SB2.
Preprints 74174 g002
Figure 3. Experimental results fitted to the Modified Gompertz model for SB3.
Preprints 74174 g003
Figure 4. Methane volume evolution for different periods.
Preprints 74174 g004
Figure 5. Experimental results fitted to the Stover-Kicannon model for semi-continuous experiments.
Preprints 74174 g005
Figure 6. Experimental results fitted to the Second Order model for semi-continuous experiments.
Preprints 74174 g006
Figure 7. Alkalinity (left) and VS (right) effect on OLR developed at semi-continuous assays.
Preprints 74174 g007
Figure 8. VFA (left) and ammonia nitrogen (right) effect on OLR developed at semi-continuous assays.
Preprints 74174 g008
Table 1. Chemical parameters of raw materials determined.
Parameter PM PW PWP
pH 7.70±0.10 4.18±0.04 4.10±0.29
Redox potential, mV -362±23 -100±1 206±10
Alkalinity,
mg CaCO3 L-1
9379±75 - -
N-NH4, mg L-1 1860±85 870±30 390±80
C, % 2.23±0.30 7.12±0.19 7.63±1.85
N, % 0.30±0.03 0.36±0.01 0.42±0.09
C/N 7.32±0.36 18.04±1.37 18.71±2.17
TS, % 5.71±0.02 13.31±0.29 17.17±3.33
VS*, % 3.98±0.12 12.32±0.23 15.80±3.14
Ca, ppm 2663±48 1003±21 1965±18
Fe, ppm 209±2 76±1 120±2
K, ppm 240±30 2317±25 1953±4
Mg, ppm 1208±11 439±1 617±4
Na, ppm 913±2 64±1 262±3
P, ppm 1562±7 473±7 807±46
Al, ppm 152±7 81±1 95±5
*Total Volatile Solid.
Table 2. BMP and kinetic parameters for different studies developed with PWP.
Parameter SB1 SB2 SB3
Methane average yield, NL kg VS-1 464±25 331±57 364±49
Methane average concentration, % 59±2 56±6 60±1
Replicates R1 R2 R1 R2 R1 R2
Rmax, Nm3 kg VS-1 d-1 0.64 0.75 0.82 1.51 0.85 1.00
l, d 2.82 1.56 0.77 1.29 - -
R2 0.9888 0.9757 0.9387 0.9727 0.9686 0.9766
Table 3. Methane yield and kinetic parameters obtained in semi-continuous assays.
Period Period I Period II Period III
S1
Methane yield, NL kg VS-1 139 149 149
kB, g COD L-1 4.42
Umax, d-1 1.03
k2, d-1 0.73
S2
Methane yield, NL kg VS-1 158 160 156
kB, g COD L-1 4.98
Umax, d-1 1.49
k2, d-1 0.90
S3
Methane yield, NL kg VS-1 153 156 155
kB, g COD L-1 4.33
Umax, d-1 1.31
k2, d-1 0.64
Table 4. Methane yield and digestate composition for experiment carried out in pilot plant.
Parameter Period I Period II
pH 7.91±0.10 7.95±0.05
Redox potential, mV -388±12 -409±9
Alkalinity,
mg CaCO3 L-1
10892±2 10340±37
Methane yield, NL kg VS-1 173±45 264±55
C, % 1.06±0.03 2.20±0.20
N, % 0.21±0.01 0.37±0.02
C/N 4.98±0.15 6.02±1.14
Ca, ppm 779±4 2259±9
Fe, ppm 75±2 230±2
K, ppm 1317±28 2467±29
Mg, ppm 526±2 1121±3
Na, ppm 669±2 596±6
P, ppm 359±10 1052±15
Al, ppm 40±2 157±2
Zn, ppm 34±1 141±1
Cu, ppm 10±1 38±1
Cr, ppm <5 <5
Ni, ppm <5 <5
Table 5. Methane yield and digestate composition for experiment carried out in pilot plant.
Parameter Period I Period II
Assimilable N content, % 0.12 0.20
Assimilable P2O5 content, % 0.80 2.33
Assimilable K2O content, % 1.01 1.89
Fertilizer classification [28] A A
Table 6. Experimental design in assays sets evaluated.
ASSAY OLR,
G VS LD-1 D-1
MIXTURE
COMPOSITION/FEED
HIDRAULIC RETENTION TIME (HRT), D
SB1 - Ratio 1:2 inoculum:PWP -
SB2 - Ratio 1:2 inoculum:PWP with nanoparticles (0.064 g g VS-1) -
SB3 - Ratio 1:2 inoculum:PWP with nanoparticles (0.015 g g VS-1) and thermal pre-treatment -
S1 Period I: 1.26 50 % PM and 50 % PWP (on VS basis) 28
Period II: 1.47 24
Period III: 1.88 19
S2 Period I: 1.26 50 % PM and 50 % PWP (on VS basis) with thermal pre-treatment 28
Period II: 1.47 24
Period III: 1.88 19
S3 Period I: 1.26 50 % PM and 50 % PWP (on VS basis) with thermal pre-treatment and nanoparticles (0.015 g g VS-1) 28
Period II: 1.47 24
Period III: 1.88 19
Disclaimer/Publisher’s Note: The statements, opinions and data contained in all publications are solely those of the individual author(s) and contributor(s) and not of MDPI and/or the editor(s). MDPI and/or the editor(s) disclaim responsibility for any injury to people or property resulting from any ideas, methods, instructions or products referred to in the content.
Copyright: This open access article is published under a Creative Commons CC BY 4.0 license, which permit the free download, distribution, and reuse, provided that the author and preprint are cited in any reuse.
Prerpints.org logo

Preprints.org is a free preprint server supported by MDPI in Basel, Switzerland.

Subscribe

© 2024 MDPI (Basel, Switzerland) unless otherwise stated