
Submitted:
16 May 2023
Posted:
17 May 2023
You are already at the latest version
Abstract
Introduction: Previous studies have suggested that the tyrosine kinase receptor RET plays a sig-nificant role in the hematopoietic potential in mice and could also be used to expand cord-blood derived hematopoietic stem cells (HSCs). The role of RET in the human iPSC-derived hematopoi-esis has not been tested so far. Methods: To test the implication of RET on the hematopoietic potential of iPSCs, we activated its pathway with the lentiviral overexpression of RETWT or RETC634Y mutation in normal iPSCs. An iPSC derived from a patient harboring the RETC634Y mutation (iRETC634Y) and its CRISPR-corrected isogenic control iPSC (iRETCTRL) were also used. Hematopoietic potential was tested using 2D cul-tures and evaluated regarding the phenotype and the clonogenic potential of generated cells. Results: Hematopoietic differentiation from iPSCs with RET overexpression (WT or C634Y) led to a significant reduction in the number and in the clonogenic potential of HSCs (CD34+/CD38-/CD49f+) as compared to control iPSCs. Similarly, the hematopoietic potential of iRETC634Y was reduced as compared to iRETCTRL. Transcriptomic analyses revealed a specific ac-tivated expression profile for iRETC634Y compared to its control with evidence of overexpression of genes which are part of the MAPK network with negative hematopoietic regulator activities. Conclusion: RET activation in iPSCs is associated with an inhibitory activity in iPSC-derived hematopoiesis, potentially related with MAPK activation.
Keywords:
iPSCs
; HSCs
; RET
; Hematopoietic differentiation
; CD34
1. Introduction
Hematopoietic stem cells (HSCs) are multipotent stem cells that give rise to all blood cells [1]. They are located in the bone marrow (BM) niche where they maintain blood and immune cell homeostasis through a balance of self-renewal and differentiation [2]. Alterations of HSCs or bone marrow homeostasis are a major cause of blood diseases such as leukemia, lymphoma or myeloma [3,4,5]. Hematopoietic stem cell transplantation (HSCT) remains the mainstay of the therapies of acute leukemias in allogeneic settings, and that of other hematopoietic malignancies in autologous settings in high-risk multiple myeloma [6,7] and aggressive refractory/relapses lymphomas [8].
Several attempts have been made in the past to expand true HSCs using in vitro established techniques in the presence of cytokines and starting with bone marrow, umbilical cord blood (UBC) or mobilized peripheral blood cells [9,10,11,12,13]. These attempts have not generated so far a methodology to manufacture transplantable true HSCs in clinically applicable settings. The use of double cord blood transplantation, especially in adults, has been used to circumvent these difficulties [14].
Generation of functional and engraftable HSCs from induced pluripotent stem cells (iPSC) would represent a step forward for improving bone marrow transplantation. Indeed, the self-renewable capacity of iPSCs combined with the HLA gene editing would provide a renewal and universal stock of material for HSCT. However, current protocols do not enable the generation of mature and engraftable HSCs [15]. With the current protocols, iPSC-derived HSCs can produce matured blood cells in a process resembling primitive hematopoiesis [16,17] but they lack engraftment and repopulation capacities. However, BM and UCB derived HSCs are mature which confers them the engrafting potential [18].
A better knowledge of the mechanisms of iPSCs hematopoietic differentiation and the improvement of the current protocols to generate more BM/UCB HSCs-like cells from iPSCs are needed for developing HSCs generation from iPSCs.
Previous studies have shown the implications of receptor tyrosine kinases (RTKs) in hematopoietic stemness potential and maintenance [19,20]. RET (rearranged during transfection) protooncogene is a RTK which transmits a proliferative signal in the presence of its co-receptor GFR-alpha (GFRα1) and in response to GDNF-ligands families (GLF). RET is known to be expressed in intermediate mature myeloid cells and in acute myeloid leukemia [21,22]. Previous studies have suggested that RET plays a key role in the emergence of hematopoietic potential in mice [23]. Others showed the improvement of cord blood HSCs survival and expansion when RET pathway is activated by the addition of its ligand/coreceptor GDNF/GFRα1 [24]. Moreover, HSCs frequency is four-fold higher in the RET-positive compartment compared to RET-negative cells. However, its effect during iPSCs hematopoietic differentiation has yet to be characterized.
In order to test the effect of RET activation during iPSC-derived hematopoietic differentiation, we generated different iPSC models of RET activation with the lentiviral overexpression of wild-type receptor RET (RETWT) or a mutated RET (RETC634Y) which was overexpressed in normal IPSCs. In addition, we have used a patient-derived iPSC containing the mutated RET (RETC634Y) or its CRISPR-corrected isogenic control. With the use of these tools, we have tested the hematopoietic potential of iPSCs using in vitro assays. Interestingly, we show that RET activation during iPSCs hematopoietic differentiation reduces the HSCs stemness potential by the activation of the MAPK pathway and we identify, using a transcriptomic approach some regulatory factors, such as DLK1, that could be involved in hematopoietic inhibition. This work provides a better understanding of the effects of RET activation during iPSCs hematopoietic differentiation.
2. Materials and Methods
2.1. Generation of iPSCs
PB33-WT and PB68-WT were both generated from peripheral blood mononuclear cells (PBMCs) from healthy donors with the informed consents according to the Declaration of Helsinki. PBMCs were reprogrammed by non-integrative Sendai viral transduction. Pluripotency was characterized by FACS and teratoma assays. Generation of RET mutated iPSC iRETC634Y and its isogenic CRIPSR corrected control iRETCTRL have been previously described [25,26].
2.2. iPSC cultures
iPSCs were cultured in feeder-free condition on Geltrex coated dishes (A1413201; ThermoFisher Scientific, France) and fed daily with Essential 8 flex Medium (A2858501; ThermoFisher Scientific, France). iPSCs were passaged twice a week with EDTA dissociation (0.5 mM).
2.3. Hematopoietic differentiation from iPSCs
Hematopoietic differentiation of iPSCs has been performed using a STEMDiff hematopoietic kit (05310; STEMCELL Technologies, France) according to the manufacturer’s recommendations. Briefly, iPSCs have been dissociated in aggregates of 50-100 μm by using EDTA (0.5 mM). 50 aggregates have been seeded per well in a 12-well cell culture plate (Corning, France) coated with Geltrex (A1413202; Gibco, France). The medium was changed according to the manufacturer’s instruction and floating cells were harvested on day +13 of hematopoietic differentiation. For GDNF/GFRα1 experiment, 100 ng/mL of GDNF & GFRα1 mixed 1:1; (212-GD-010, 714-GR-100; R&D Systems, France) were added to the media.
2.4. Flow cytometry
The viability of the cells collected from day +13 of hematopoietic differentiation was evaluated with Trypan blue and living cells were stained with the following antibodies (Table 1) in PBS at 4°C for 20 minutes.
Cells were thereafter washed and resuspended in PBS. Stained cells were analyzed with a BD LSRFortessaTM (BD Biosciences, USA) flow cytometer and FlowJo analysis software.
2.5. Clonogenic assays
Non-adherent cells collected at day +13 of hematopoietic differentiation were counted and plated in methylcellulose-based medium (MethoCultTM H4434; STEMCELL Technologies, France) at the concentration of 5000 cells/dish and incubated for 14 days in a 37°C incubator with 5% CO2. After 14 days in methylcellulose, colonies were enumerated.
2.6. RNA extraction, reverse transcription, and quantitative qRT-PCR
Total intracellular RNA was extracted using RNeasy Mini Kit (74104; Qiagen, Germany) and 1 µg was reverse transcribed using a reverse transcription (RT)-PCR kit (Superscript III 18080-44; ThermoFisher Scientific, France). An aliquot of cDNA was used as a template for qRT-PCR analysis using a fluorescence thermocycler (ThermoFisher Scientific QuantStudio 3TM) with FastStart Universal SYBR Green (04913914001, Roche, Lithuania) DNA dye. The primer sequences used for qRT-PCR are shown in Supplementary Materials Table S1. Relative expression was normalized to the geometric mean of housekeeping gene expression and was calculated using the 2-ΔΔCt method.
2.7. Western blots
Cells were lysed in ice with RIPA buffer. Separation of proteins was done by electrophoretic migration on a NuPAGE™ 4-12 % Bis-Tris gel (NP0323BOX; ThermoFisher, France) under denaturing conditions. The proteins were transferred onto a PVDF membrane pre-activated with methanol. After saturation with TBS-Tween 5% BSA for 1h and hybridization of the membranes with primary antibody overnight (1:500, Ret #132507, R&D System, USA; 1:1000, Phospho-p44/42 MAPK (Erk1/2) (Thr202/Tyr204) (E10) #9106, CellSignaling, USA; 1:200, p-Ret (Tyr 1062)-R: sc-20252-R, SantaCruz, USA; p63 [EPR5701] #ab124762, Abcam, USA; 1:60000, B-Actin-Peroxidase #A3854, Sigma, France) and secondary antibodies coupled to HRP. Membranes were revealed by chemiluminescence with SuperSignal West Dura or Femto reagents and data were acquired using G:BOX iChemi Chemiluminescence Image Capture system.
2.8. Production of lentiviruses and viral transduction
To produce RET-expressing lentiviruses, we used Lenti-X 293T as a packaging cell line and psPAX2.2, and pMD2.G as packaging vector and envelope vector, respectively. Briefly, the Lentix-293T cell line was cultured on a T150 mm in Dulbecco’s Modified Eagle’s Medium (DMEM) supplemented with 10% fetal bovine serum (FBS) (11560636; Gibco, France) and 100 U/mL of penicillin-streptomycin (PenStrep) solution (11548876; Gibco, France) and co-transfected with Lipofectamine 3000 reagent (L3000015; ThermoFisher, France) with 20 μg of packaging vector ps-PAX2.2 (Addgene, USA), 10 μg envelope vector of pMD2.G (Addgene, USA) and 30 μg transfer vector. The supernatant was collected at 24h and 48h. RETWT overexpression plasmid was a gift from Gordon Mills & Kenneth Scott (Addgene plasmid # 116787; http://n2t.net/addgene:116787; RRID:Addgene 116787). The plasmid RETC634Y was purchased from VectorBuilder (Guangzhou, China).
Transduction of iPSC with RET lentiviruses was performed by using freshly passaged iPSC. Puromycin selection was performed by using 1 μg/mL of Puromycin (12122530; Fisher Scientific, France).
2.9. Transcriptomic experiments
Total RNA from hematopoietic cells derived from iRETC634Y and from its CRISPR correction iRETCTRL were treated in duplicates to performed Clarium S Assay human microarray (902927; ThermoFisher Scientific, USA). Robust microarray analysis (RMA) [27] normalization was applied to the resulting transcriptome matrix with Transcriptome Analysis Console (TAC) version 4.0.1.36 (ThermoFisher Scientific, USA).
2.10. Bioinformatics analysis
Bioinformatics analyses were performed in R software environment version 4.1.0. Supervised differential expression analysis between RET-mutated cells and their CRISPR corrected counterparts was performed LIMMA R bioconductor package version 3.48.3 [28]. Expression heatmap up regulated genes by RET mutation was drawn with pheatmap R-package version 1.0.12. Heatmap classification was performed with Euclidean distances and Ward.D2 method. Functional enrichment was performed with Toppgene web site on Gene Ontology Biological Function and DisGeNET diseases databases [29]. Functional molecular networks were drawn with Cytoscape standalone software version 3.6.0 [30].
3. Results
3.1. Endogenous RET activation with GDNF/GFRα1 during iPSCs hematopoietic differentiation does not affect the hematopoietic potential of HSCs.
We started by studying the effect of the activation of endogenous RET by adding the RET primary ligand/coreceptor combination GDNF/GFRα1 during hematopoietic differentiation of iPSCs. We induced hematopoietic differentiation of two normal wild-type (WT) iPS cell lines (PB33-WT and PB68-WT) using the STEMdiff hematopoietic kit. This protocol allows the generation of non-adherent, round, hematopoietic cells from iPSCs after day +10-13 of culture (Figure 1A). The May-Grünwald and Giemsa (MGG) coloration showed a normal hematopoietic phenotype for the cells generated (Figure 1B) and the colony-forming cell (CFC) assay displayed normal morphological colonies (Figure 1C).
On day +3 of differentiation, we added 100 ng/mL of GDNF/GFRα1 at each medium change for the test groups. We collected the non-adherent cells at the end of the culture procedure on day +13 and characterized them. Western blot analysis showed an increase of the expression of phosphoRET (pRET) in the conditions where GDNF/GFRα1 was added, strongly suggesting the activation of the RET pathway (Supplementary Figure S1A). On day +13 of differentiation, we also analyzed hematopoietic cells by flow cytometry using surface markers representative of HSC (CD34, CD45, CD38, and CD49f).
As it can be seen in Figure 1, for both iPS cell lines, the addition of GDNF/GFRα1 did not modify significantly the percentage of the total CD34+ cell population (Figure 1D) nor the percentage of the CD34+/CD38- cell fraction, which are highly enriched in the primitive hematopoietic stem and progenitor cells (Figure 1E). Similarly, no significant change in the HSC fraction (CD34+ CD38- CD49f+) was observed after the addition of GDNF/GFRα1 (Figure 1F). Finally, RET activation with GDNF did not show a significant effect on the total percentage of hematopoietic cells (CD45+) (Figure 1G). HSCs were tested for their clonogenic cell potential using CFC assays. Non-adherent cells from day +13 of hematopoietic differentiation, were plated in methylcellulose, and colonies were enumerated 14 days after. As it is shown in Figure 1H, for both PB33-WT and PB68-WT no significant differences were observed in the number of colonies (Figure 1H). Interestingly, the phenotypic characteristics of the progenitors have been found to be different between the two iPS cell lines. Indeed, with or without GDNF, PB33-WT HSCs gave rise to BFU-E and CFU-E whereas PB68-WT colonies gave almost only CFU-GM (n=6 experiments) (Figure 1I).
3.2. Lentiviral-vector mediated overexpression of RET decreases the clonogenic potential of iPSCs during hematopoietic differentiation.
Since we observed no significant effect of endogenous RET activation with GDNF on HSC potential derived from iPSC hematopoiesis, we hypothesized that RET activation with GDNF may not be sufficient. Therefore, we overexpressed the RETWT gene with a lentiviral system inside both iPSCs (PB33-RETWT and PB68-RETWT). Expression of the RETWT protein was verified by qRT-PCR quantification (Supplementary Figure S1B) and Western blot analysis (Supplementary Figure S1C) for both iPSCs. Then the same hematopoietic differentiation technology was performed using the same protocol as described above. On day +13 of hematopoietic differentiation, cells were collected and analyzed by flow cytometry. The overexpression of RETWT in PB33 led to a significant decrease in the percentage of the CD34+ population as compared to the control (PB33-WT) whereas for the PB68 no differences were observed between PB68-WT and PB68-RETWT overexpression (Figure 2A).
In PB33-RETWT, the effect of RET overexpression was even stronger on the HSC fraction. Indeed, the production of CD34+/CD38- and CD49f+ positive cells was reduced by a third as compared to HSC derived from PB33-WT iPSC (Figure 2B,C). Then we tested whether we could potentialize the effect of the RET pathway activation by the addition of GDNF/GFRα1 and whether it would increase the inhibitory effect of RET on HSC potential. Indeed, the percentage of CD34+/CD38-/CD49f+ was even lower and the number of CD45+ cells was reduced by 60% after the combination of RET overexpression and GDNF/GFRα1 activation (Figure 2C,D).
On the other hand, no statistically significant effects were observed for the PB68-RETWT after the overexpression of RET in none of the cell populations despite a decreasing tendency (Figure 2A–D). However, the addition of GDNF/GFRα1, led to a significant decrease of CD34+/CD38- and CD49f+ positive cells as compared to PB68-WT (Figure 2B,C). The percentage of hematopoietic cells (CD45+) also decreased by half after the activation of the RET pathway (Figure 2D).
The clonogenic potential of the hematopoietic-derived cells was evaluated by CFC assays. RET overexpression in PB33-RETWT condition results in more than 30% decrease in the total number of colonies, which is coherent with the results obtained by cytometry, whereas no significant differences were observed between PB68-RETWT and PB68-WT (Figure 2E). CFU-GM is the main class of colony affected by the decrease in PB33-RETWT while almost no BFU-E or CFU-E can be found in PB68-RETWT condition (Figure 2F).
3.3. Overexpression of the RETC634Y mutation amplifies the inhibitory phenotype of the iPSC-derived hematopoietic differentiation.
Since the addition of GDNF/GFRα1 induces a potentializing effect of RETWT overexpression, we tested the effect of a constitutively active RET mutation on the hematopoietic differentiation of iPSCs. The RETC634Y mutation is known to be involved in medullary thyroid cancer patients with MEN2A syndrome [31]. This mutation located in the extracellular domain of the protein, leads to the dimerization of RET and its activation independently from its ligand/coreceptor GDNF/GFRα1. We overexpressed RETC634Y mutation with a lentiviral construction in both PB33 and PB68 (PB33-RETC634Y and PB68-RETC634Y). After the evaluation of the RET overexpression in iPSCs (Supplementary Figure S1B), we performed hematopoietic differentiation using the same protocol as above.
After 13 days of hematopoietic differentiation, we observed a drastic reduction in the number of CD34+ and CD38- cells in the PB33-RETC634Y condition as compared to PB33-WT (Figure 2A,B). The percentages of CD34+/CD38-/CD49f+ and CD45+ were decreased in a similar range to the one observed after the addition of GDNF/GFRα1 on PB33-RETWT (Figure 2C,D). Comparable results were observed with the second iPS cell line PB68-RETC634Y (Figure 2A–D). The number of colonies was also evaluated by CFC assay. A striking decrease in the number of CFC was observed in both RETC634Y iPSCs as compared to their respective control (Figure 2E). These results are consistent with an inhibition of the hematopoietic potential by RETC634Y overexpression. We next wished to test these findings using a RETC634Y patient-derived iPSC, which expresses RETC634Y at levels observed in patients and could be considered as a more accurate model. To this end we have used an iPSC line generated from a patient with hereditary medullary thyroid cancer (MTC).
3.4. The inhibitory effect of the constitutive RETC634Y mutation on HSC potential correlates with MAPK2/3 activity
In previous works, we reprogrammed iPSCs from a patient with a RET mutation at the codon 634 (RETC634Y) who developed pheochromocytoma and MTC [25]. RETC634Y-mutated cells were reprogrammed by non-integrative viral transduction. As described previously, these iPSCs (iRETC634Y) had normal karyotype, harbored the RETC634Y mutation and expressed pluripotency hallmarks as well as RET protein [25]. We have also generated a CRISPR Cas9-corrected version of this iPS cell line, allowing to evaluate the hematopoietic potential of RET-mutated iPSC as compared to its isogenic RET corrected iPS cell line (iRETCTRL) [26].
iRETCTRL and iRETC634Y were induced to hematopoietic differentiation as described above. No differences were observed in the percentage of CD34+ total population between iRETCTRL and iRETC634Y (Figure 3A). Interestingly, the progenitors and stem cell-enriched fraction (CD34+/CD38-) was significantly lower in the iRETC634Y as compared to the iRETCTRL (Figure 3B). We observed an even more important decrease when we restricted the analysis to the cells with HSC phenotype (Figure 3C). Finally, no significant changes were observed for the total hematopoietic cell fraction (CD45+) (Figure 3D). CFC assays showed a significantly lower number of colonies in the iRETC634Y condition, thus indicating a lower hematopoietic potential (Figure 3E). These results are consistent with what we observed with the RETWT and RETC634Y overexpression in healthy iPSCs.
Western blots were performed with protein extracts collected at iPSC stage or after 13 days of hematopoietic differentiation. As it can be seen in Figure 3F, pMAPK1/2, RET and pRET expression has been found to be increased during iRETC634Y differentiation whereas they were reduced in hematopoietic cells derived from iRETCTRL (Figure 3F). We have estimated that pRET and RET proteins were enriched by 120% and 230% respectively during iRETC634Y hematopoietic differentiation (Figure 3G) Phospho-p44 MAPK expression is increased by more than 5 times while pMAPK p42 quantity is up by 110%. On the other hand, the quantity of all these proteins was decreased during the differentiation of iRETCTRL (Figure 3G). MAPKs are known to be phosphorylated by RET [32] therefore, we hypothesized that they could play a role in the inhibition of the RET-mediated hematopoietic potential.
3.5. RETC634Y mutation activates a specific transcriptional program in hematopoietic cells generated from iPSCs.
To evaluate the effect of the hereditary RETC634Y mutation on transcriptional regulation during iPSC-derived hematopoietic differentiation, RET-mutated cells iRETC634Y and its isogenic corrected control iRETCTRL cells were collected at day +13 of hematopoietic differentiation to perform whole transcriptomic experiments in duplicates. Unsupervised principal component analysis performed at the whole transcriptome level allowed a good stratification of sample groups (Figure 4A) suggesting a major impact of RET mutation on the transcriptional regulation. Differential expression analysis performed with LIMMA algorithm between iRETC634Y cells and iRETCTRL allowed the identification of a specific transcriptional program between these two experimental conditions with a higher impact on upregulated genes (Figure 4B). Expression Heatmap performed with 109 genes upregulated by RETC634Y mutation during hematopoietic differentiation of iPSCs allowed to well discriminate two experimental groups: samples from iRETC634Y versus their CRISPR controls (Figure 4C). These results suggest that RETC634Y mutation could impact hematopoietic differentiation of human iPSCs even at endogenous levels of expression.
3.6. RETC634Y mutation activates a hematopoietic molecular network that overlaps with MAPK cascade.
With 109 genes upregulated by RETC634Y mutation during iPSCs hematopoietic differentiation, a functional enrichment was performed with the Gene Ontology Biological Process database (Figure 5A). This analysis highlighted best-ranking enrichment with several gene sets implicated in the MAPK cascade, followed by enrichment with gene set implicated in the immune system and hemopoiesis (Figure 5A). Overlap between these enrichments (Figure 5B) shows that 4 genes belonging to the 3 enriched functions including SRFP1, FCGR2B, HLA-DRB1, JUN. Similarly, 6 genes were both implicated in immune system and hemopoietic regulations including NR4A3, DLK1, TMEM17B, JAG1, TCTA and TMEM176A (Figure 5B). DLK1 is known to be a negative regulator of emerging hematopoietic stem and progenitor cells [33] and NR4A3 is known to restrict HSC proliferation via reciprocal regulation of C/EBPα and inflammatory signaling [34]. All together, these results suggest that MAPK cascade could potentially be activated downstream to RETC634Y mutation and promote the regulation of HSCs potential during iPSC-derived hematopoietic differentiation. The action of RETC634Y mutation could occur at a primitive stage of hematopoiesis because both hemopoiesis and lymphopoiesis are affected by these regulations (Figure 5C). This idea was confirmed by the fact that after functional enrichment on disease, with DisGeNET database, a larger functional enrichment network could be built with molecules implicated both in lymphoid (Chronic lymphoid leukemia, multiple myeloma) and myeloid (acute promyelocytic leukemia, myelodysplastic syndrome) disorders (Supplemental Figure S2A,B).
Finally, the expressions of a set of genes found up regulated by RET in the transcriptomics data were quantified by qRT-PCR in WT, RETWT or RETC634Y iPS cell lines at iPSCs stage (Supplemental Figure S2C) or after 13 days of hematopoietic differentiation (Figure 5D). The results show a significant overexpression of GFRα1 and DLK1 correlating with the increased activity of RET at both iPSC and day 13 hematopoietic stages. This highlights a correlation between RET and DLK1 expression. Depending on the iPS cell line, JUN, NR4A3, and C/EBPα were also found to be up regulated by RET activation and therefore validating the transcriptomic data.
4. Discussion
Generation of HSC with long-term repopulation potential from iPSCs is a major goal of research which could circumvent the unmet need of new sources for HSCT. However, iPSC-derived hematopoiesis resembles the first wave of hematopoiesis because it produces mature blood cells only and not long-term engraftable HSCs [16,17]. Several studies show the possibility for iPSC-derived HSCs from human teratoma to migrate and repopulate the BM [35,36]. Other studies generate short-term engraftable HSC from iPSC by the ectopic expression of transcriptional factors such as HOXA9, ERG, RORA, SOX4, and MYB [37,38]. Nevertheless, no engraftable HSCs were generated without ectopic transcription factor expression or teratoma formation. Therefore, protocols for hematopoietic differentiation must be optimized, or mechanisms of differentiation must be better understood to develop iPSCs derived HSCs for clinical applications.
Human HSCs are characterized by several surface markers. The historical marker of human HSC is the CD34. CD34+ population is heterogenous but all the stem cells in the BM express this marker [39]. Most of the CD34+ cells co-express CD38 but only the CD38- fraction can generate multi-lineage colonies in immune-deficient mice [40,41]. In addition to well established HSC markers [39,40,41], CD49f has been shown to be a specific marker of HSC and a demarcation between HSCs and multipotent progenitors. Moreover, CD49f+ cells were highly efficient in generating long-term multilineage grafts [42].
Previous studies have shown that RET could be important for HSC generation and expansion. Indeed, RET has been identified as a crucial player in the development of hematopoietic potential in mice [23]. RET neurotrophic factor partners are produced in the HSCs environment and stimulate survival, expansion, and function of HSCs. Null mutation of RET leads to the loss of Bcl2 and Bcl2l1 surviving cues. Another study has also demonstrated that the activation of the RET pathway by the addition of its ligand/coreceptor GDNF/GFRα1 improves cord blood HSCs survival and expansion [24]. However, the impact of RET during iPSCs hematopoietic differentiation remains to be characterized. Here, we observed no effect of RET activation by GDNF/GFRα1 addition during hematopoietic differentiation of WT iPSCs (Figure 1). Then we generated iPSC overexpressing the gene RETWT and the mutant RETC634Y. Our results show that RET activation decreases the number of hematopoietic cells with HSC phenotype as well as that of hematopoietic progenitors. (Figure 2). The hematopoietic potential of iPSCs is also altered by the activation of exogenous RET because their capacity to form hematopoietic colonies is also reduced. This inhibitory effect is enhanced with the level of RET activation as shown by the addition of GDNF in the RETWT conditions. (Figure 2). We have observed that constitutive activation of the RETC634Y mutant is associated with the most severe inhibitory effect in both iPSCs. These results strongly suggest a relationship between RET constitutive phosphorylation and hematopoietic differentiation.
We have evaluated the effect of RET activation in two different iPS cell lines (PB33-WT and PB68-WT) by overexpression of RET. Interestingly, hematopoietic differentiation gave rise to different outcomes in these two cell lines. In Figure 1 we can notice that the percentage of HSC (CD38- CD34+ CD49f+) and hematopoietic cells (CD45+) are different between the two WT conditions. The number and the type of colonies were found to be different as well. Indeed, there were almost no CFU-Es and BFU-Es observed for PB68-WT whereas in PB33-WT almost fifty percent of the colonies formed erythroid colonies. The effect of RETWT overexpression is also different between the two cell lines where a much stronger activation of RET is needed to observe an effect in PB68 Figure 2). These differences could be explained by the genotypic background of the donors. Indeed, a study shows that 5-46% of the variation in different iPSC phenotypes arises from differences between individuals [43].
We next tested the effect of an endogenous RETC634Y mutation from a patient-derived iPSC and we compared the results with its CRISPR corrected isogenic control. This model is derived from a patient and therefore is more suitable to study the endogenous effect of RETC634Y (Figure 3). Interestingly, we found the same inhibitory effect than with the overexpression of the mutation in WT background iPSCs. It indicates that our RETC634Y lentiviral overexpression model is relevant to mimic the in vivo effect of the RET mutation and therefore it could serve as a drug screening model. There are several RET inhibitors available in the market and under evaluation for clinical treatment such as Pralsetinib, a RET specific inhibitor currently tested for NSCLC treatment [44,45,46]. It would be interesting to evaluate the effect of this drug in our hematopoietic differentiation model.
To get a better understanding of RET activation effect on iPSC derived hematopoiesis, we performed transcriptomic analysis on iRETC634Y and its isogenic counterpart iRETCTRL in hematopoietic cells collected at day +13 of differentiation. The data reveals a specific activated expression profile of iRETC634Y compared to iRETCTRL (Figure 4). Genes up regulated in iRETC64Y are functionally enriched for MAPK, immune system, and hematopoiesis regulation gene sets. Inside this network, we identified some relevant hematopoietic regulatory genes up regulated by RET mutation (Figure 5). DLK1 and NR4A3 are both known to be involved in the restriction of HSC proliferation and emerging hematopoiesis [33,34]. C/EBPα is downstream of NR4A3 and its conditional knockout in adult HSC leads to the expansion of functional HSCs [47]. Moreover, upon its activation by the MAPK, JNK1 can act as a positive regulator of C/EBPα [48]. Implication of the MAPK pathway was also hinted by western blot analysis showing an increase of pMAPK1/2 protein quantity during iRETC634Y hematopoietic differentiation. qRT-PCR performed at both iPSC stage and at day-13 of differentiation show a correlation between RET activation and the overexpression of DLK1, NR4A3, GFRA1, JUN, CEPBA and DLK1. Therefore, the inhibitory effect of RET activation on HSC during hematopoietic differentiation could be mediated by MAPK/JNK and the transcriptional regulation of HSC inhibitory genes. Conditional KO of these candidate genes with siRNA during iPSC derived hematopoiesis could provide useful information on their role and on the mechanism of RET HSC inhibition.
Activation of the RET pathway by GDNF promotes the growth and survival of f UCB-derived HSCs [24]. This activation induces an anti-apoptotic and anti-inflammatory response while reducing the accumulation of reactive oxygen species (ROS) in UCB HSCs. In vivo, the RET signal is likely provided by GDNF/GFRα1 from the bone marrow environment, playing a crucial role in maintaining HSC potential. However, our study reveals an inhibitory effect of RET activation during iPSC-derived hematopoiesis. Specifically, we observed a decrease in the number of HSC-positive cells and their clonogenic potential in various models of RET activation. It is interesting that the same regulatory pathway can exhibit opposing effects depending on the timing of its activation. In the context of hematopoietic differentiation, premature activation of a proliferative signal may impede the emergence of HSCs. Moreover, it is essential to verify the findings from other models specifically during iPSC differentiation, as outcomes may differ. iPSC-derived hematopoiesis closely resembles embryonic hematopoiesis and differs from what is known about adult hematopoiesis. This consideration is crucial for the development and optimization of new strategies for iPSC differentiation.
We demonstrate with this work a model of RET increasing induction within different iPS cell lines. RET is known to be mutated and overexpressed in non-small cell lung cancer (NSCLC) and in multiple endocrine neoplasia type 2 (MEN2A) [32]. These iPSCs could be used to generate cancerous tissues, get better understanding of the mechanisms activated by RET and could be used as potential target discovery tools.
Supplementary Materials
The following supporting information can be downloaded at the website of this paper posted on Preprints.org. Supplementary Figure 1, Supplementary Figure 2 and Supplementary Material Table 1.
Author Contributions
Conceptualization, P.M., J.I., C.D., A.T.; methodology, P.M., J.I., C.D., A.T.; software, C.D.; validation, P.M., A.B-G, A.T.; formal analysis, P.M., C.D.; investigation, P.M., J.I.; resources, T.L., D.C., P.H.; data curation, P.M., J.I., A.T.; writing—original draft preparation, P.M. J.I., A.T.; writing—review and editing, P.M, J.I., C.D., A.T.; visualization, P.M., A.T.; supervision, P.M., A.T.; project administration, P.M.; funding acquisition, A.B-G., A.T. All authors have read and agreed to the published version of the manuscript.
Funding
This research received no external funding.
Institutional Review Board Statement
This study was conducted in accordance with the Declaration of Helsinki and approved by IRB from INSERM.
Informed Consent Statement
Not applicable.
Data Availability Statement
Not applicable.
Acknowledgments
We would like to acknowledge Vaincre le Cancer for funding the fellowships of PM and JI. Thanks to GENOM’IC Research facility from Institut Cochin (Paris) for the sequencing (bulk RNA).
Conflicts of Interest
The authors declare no conflict of interest.
References
- Bryder, D.; Rossi, D.J.; Weissman, I.L. Hematopoietic Stem Cells: The Paradigmatic Tissue-Specific Stem Cell. Am J Pathol 2006, 169, 338–346. [CrossRef]
- Weissman, I.L. Stem Cells: Units of Development, Units of Regeneration, and Units in Evolution. Cell 2000, 100, 157–168. [CrossRef]
- Li, X.-L.; Xue, Y.; Yang, Y.-J.; Zhang, C.-X.; Wang, Y.; Duan, Y.-Y.; Meng, Y.-N.; Fu, J. Hematopoietic Stem Cells: Cancer Involvement and Myeloid Leukemia. Eur Rev Med Pharmacol Sci 2015, 19, 1829–1836.
- Maswabi, B.C.L.; Molinsky, J.; Savvulidi, F.; Zikmund, T.; Prukova, D.; Tuskova, D.; Klanova, M.; Vockova, P.; Lateckova, L.; Sefc, L.; et al. Hematopoiesis in Patients with Mature B-Cell Malignancies Is Deregulated Even in Patients with Undetectable Bone Marrow Involvement. Haematologica 2017, 102, e152–e155. [CrossRef]
- Toscani, D.; Bolzoni, M.; Accardi, F.; Aversa, F.; Giuliani, N. The Osteoblastic Niche in the Context of Multiple Myeloma. Ann N Y Acad Sci 2015, 1335, 45–62. [CrossRef]
- Ntanasis-Stathopoulos, I.; Gavriatopoulou, M.; Kastritis, E.; Terpos, E.; Dimopoulos, M.A. Multiple Myeloma: Role of Autologous Transplantation. Cancer Treat Rev 2020, 82, 101929. [CrossRef]
- Cowan, A.J.; Green, D.J.; Kwok, M.; Lee, S.; Coffey, D.G.; Holmberg, L.A.; Tuazon, S.; Gopal, A.K.; Libby, E.N. Diagnosis and Management of Multiple Myeloma: A Review. JAMA 2022, 327, 464–477. [CrossRef]
- Zahid, U.; Akbar, F.; Amaraneni, A.; Husnain, M.; Chan, O.; Riaz, I.B.; McBride, A.; Iftikhar, A.; Anwer, F. A Review of Autologous Stem Cell Transplantation in Lymphoma. Curr Hematol Malig Rep 2017, 12, 217–226. [CrossRef]
- Boitano, A.E.; Wang, J.; Romeo, R.; Bouchez, L.C.; Parker, A.E.; Sutton, S.E.; Walker, J.R.; Flaveny, C.A.; Perdew, G.H.; Denison, M.S.; et al. Aryl Hydrocarbon Receptor Antagonists Promote the Expansion of Human Hematopoietic Stem Cells. Science 2010, 329, 1345–1348. [CrossRef]
- Fares, I.; Chagraoui, J.; Gareau, Y.; Gingras, S.; Ruel, R.; Mayotte, N.; Csaszar, E.; Knapp, D.J.H.F.; Miller, P.; Ngom, M.; et al. Cord Blood Expansion. Pyrimidoindole Derivatives Are Agonists of Human Hematopoietic Stem Cell Self-Renewal. Science 2014, 345, 1509–1512. [CrossRef]
- Wagner, J.E.; Brunstein, C.G.; Boitano, A.E.; DeFor, T.E.; McKenna, D.; Sumstad, D.; Blazar, B.R.; Tolar, J.; Le, C.; Jones, J.; et al. Phase I/II Trial of StemRegenin-1 Expanded Umbilical Cord Blood Hematopoietic Stem Cells Supports Testing as a Stand-Alone Graft. Cell Stem Cell 2016, 18, 144–155. [CrossRef]
- Papa, L.; Djedaini, M.; Hoffman, R. Ex Vivo HSC Expansion Challenges the Paradigm of Unidirectional Human Hematopoiesis. Ann N Y Acad Sci 2020, 1466, 39–50. [CrossRef]
- Mayer, I.M.; Hoelbl-Kovacic, A.; Sexl, V.; Doma, E. Isolation, Maintenance and Expansion of Adult Hematopoietic Stem/Progenitor Cells and Leukemic Stem Cells. Cancers (Basel) 2022, 14, 1723. [CrossRef]
- Gutman, J.A.; Riddell, S.R.; McGoldrick, S.; Delaney, C. Double Unit Cord Blood Transplantation. Chimerism 2010, 1, 21–22. [CrossRef]
- Demirci, S.; Leonard, A.; Tisdale, J.F. Hematopoietic Stem Cells from Pluripotent Stem Cells: Clinical Potential, Challenges, and Future Perspectives. STEM CELLS Translational Medicine 2020, 9, 1549–1557. [CrossRef]
- Lapillonne, H.; Kobari, L.; Mazurier, C.; Tropel, P.; Giarratana, M.-C.; Zanella-Cleon, I.; Kiger, L.; Wattenhofer-Donzé, M.; Puccio, H.; Hebert, N.; et al. Red Blood Cell Generation from Human Induced Pluripotent Stem Cells: Perspectives for Transfusion Medicine. Haematologica 2010, 95, 1651–1659. [CrossRef]
- Slukvin, I.I. Generation of Mature Blood Cells from Pluripotent Stem Cells. Haematologica 2010, 95, 1621–1623. [CrossRef]
- Berglund, S.; Magalhaes, I.; Gaballa, A.; Vanherberghen, B.; Uhlin, M. Advances in Umbilical Cord Blood Cell Therapy: The Present and the Future. Expert Opin Biol Ther 2017, 17, 691–699. [CrossRef]
- Reilly, J.T. Receptor Tyrosine Kinases in Normal and Malignant Haematopoiesis. Blood Reviews 2003, 17, 241–248. [CrossRef]
- Fares, I.; Calvanese, V.; Mikkola, H.K.A. Decoding Human Hematopoietic Stem Cell Self-Renewal. Curr Stem Cell Rep 2022, 8, 93–106. [CrossRef]
- Gattei, V.; Celetti, A.; Cerrato, A.; Degan, M.; De Iuliis, A.; Rossi, F.M.; Chiappetta, G.; Consales, C.; Improta, S.; Zagonel, V.; et al. Expression of the RET Receptor Tyrosine Kinase and GDNFR-Alpha in Normal and Leukemic Human Hematopoietic Cells and Stromal Cells of the Bone Marrow Microenvironment. Blood 1997, 89, 2925–2937.
- Nakayama, S.; Iida, K.; Tsuzuki, T.; Iwashita, T.; Murakami, H.; Asai, N.; Iwata, Y.; Ichihara, M.; Ito, S.; Kawai, K.; et al. Implication of Expression of GDNF/Ret Signalling Components in Differentiation of Bone Marrow Haemopoietic Cells. British Journal of Haematology 1999, 105, 50–57. [CrossRef]
- Fonseca-Pereira, D.; Arroz-Madeira, S.; Rodrigues-Campos, M.; Barbosa, I.A.M.; Domingues, R.G.; Bento, T.; Almeida, A.R.M.; Ribeiro, H.; Potocnik, A.J.; Enomoto, H.; et al. The Neurotrophic Factor Receptor RET Drives Haematopoietic Stem Cell Survival and Function. Nature 2014, 514, 98–101. [CrossRef]
- Grey, W.; Chauhan, R.; Piganeau, M.; Huerga Encabo, H.; Garcia-Albornoz, M.; McDonald, N.Q.; Bonnet, D. Activation of the Receptor Tyrosine Kinase RET Improves Long-Term Hematopoietic Stem Cell Outgrowth and Potency. Blood 2020, 136, 2535–2547. [CrossRef]
- Hadoux, J.; Féraud, O.; Griscelli, F.; Opolon, P.; Divers, D.; Gobbo, E.; Schlumberger, M.; Bennaceur-Griscelli, A.; Turhan, A.G. Generation of an Induced Pluripotent Stem Cell Line from a Patient with Hereditary Multiple Endocrine Neoplasia 2A (MEN2A) Syndrome with RET Mutation. Stem Cell Res 2016, 17, 154–157. [CrossRef]
- Hadoux, J.; Desterke, C.; Féraud, O.; Guibert, M.; De Rose, R.F.; Opolon, P.; Divers, D.; Gobbo, E.; Griscelli, F.; Schlumberger, M.; et al. Transcriptional Landscape of a RETC634Y-Mutated IPSC and Its CRISPR-Corrected Isogenic Control Reveals the Putative Role of EGR1 Transcriptional Program in the Development of Multiple Endocrine Neoplasia Type 2A-Associated Cancers. Stem Cell Res 2018, 26, 8–16. [CrossRef]
- Irizarry, R.A.; Bolstad, B.M.; Collin, F.; Cope, L.M.; Hobbs, B.; Speed, T.P. Summaries of Affymetrix GeneChip Probe Level Data. Nucleic Acids Res. 2003, 31, e15.
- Ritchie, M.E.; Phipson, B.; Wu, D.; Hu, Y.; Law, C.W.; Shi, W.; Smyth, G.K. Limma Powers Differential Expression Analyses for RNA-Sequencing and Microarray Studies. Nucleic Acids Res. 2015, 43, e47. [CrossRef]
- Chen, J.; Bardes, E.E.; Aronow, B.J.; Jegga, A.G. ToppGene Suite for Gene List Enrichment Analysis and Candidate Gene Prioritization. Nucleic Acids Res. 2009, 37, W305-311. [CrossRef]
- Cline, M.S.; Smoot, M.; Cerami, E.; Kuchinsky, A.; Landys, N.; Workman, C.; Christmas, R.; Avila-Campilo, I.; Creech, M.; Gross, B.; et al. Integration of Biological Networks and Gene Expression Data Using Cytoscape. Nat Protoc 2007, 2, 2366–2382. [CrossRef]
- Sánchez, B.; Robledo, M.; Biarnes, J.; Sáez, M.E.; Volpini, V.; Benítez, J.; Navarro, E.; Ruiz, A.; Antiñolo, G.; Borrego, S. High Prevalence of the C634Y Mutation in the RET Proto-Oncogene in MEN 2A Families in Spain. J Med Genet 1999, 36, 68–70.
- Regua, A.T.; Najjar, M.; Lo, H.-W. RET Signaling Pathway and RET Inhibitors in Human Cancer. Front Oncol 2022, 12, 932353. [CrossRef]
- Mirshekar-Syahkal, B.; Haak, E.; Kimber, G.M.; Leusden, K. van; Harvey, K.; O’Rourke, J.; Laborda, J.; Bauer, S.R.; Bruijn, M.F.T.R. de; Ferguson-Smith, A.C.; et al. Dlk1 Is a Negative Regulator of Emerging Hematopoietic Stem and Progenitor Cells. Haematologica 2013, 98, 163–171. [CrossRef]
- Freire, P.R.; Conneely, O.M. NR4A1 and NR4A3 Restrict HSC Proliferation via Reciprocal Regulation of C/EBPα and Inflammatory Signaling. Blood 2018, 131, 1081–1093. [CrossRef]
- Suzuki, N.; Yamazaki, S.; Yamaguchi, T.; Okabe, M.; Masaki, H.; Takaki, S.; Otsu, M.; Nakauchi, H. Generation of Engraftable Hematopoietic Stem Cells From Induced Pluripotent Stem Cells by Way of Teratoma Formation. Molecular Therapy 2013, 21, 1424–1431. [CrossRef]
- Amabile, G.; Welner, R.S.; Nombela-Arrieta, C.; D’Alise, A.M.; Di Ruscio, A.; Ebralidze, A.K.; Kraytsberg, Y.; Ye, M.; Kocher, O.; Neuberg, D.S.; et al. In Vivo Generation of Transplantable Human Hematopoietic Cells from Induced Pluripotent Stem Cells. Blood 2013, 121, 1255–1264. [CrossRef]
- Doulatov, S.; Vo, L.T.; Chou, S.S.; Kim, P.G.; Arora, N.; Li, H.; Hadland, B.K.; Bernstein, I.D.; Collins, J.J.; Zon, L.I.; et al. Induction of Multipotential Hematopoietic Progenitors from Human Pluripotent Stem Cells via Respecification of Lineage-Restricted Precursors. Cell Stem Cell 2013, 13, 459–470. [CrossRef]
- Sugimura, R.; Jha, D.K.; Han, A.; Soria-Valles, C.; da Rocha, E.L.; Lu, Y.-F.; Goettel, J.A.; Serrao, E.; Rowe, R.G.; Malleshaiah, M.; et al. Haematopoietic Stem and Progenitor Cells from Human Pluripotent Stem Cells. Nature 2017, 545, 432–438. [CrossRef]
- DiGiusto, D.; Chen, S.; Combs, J.; Webb, S.; Namikawa, R.; Tsukamoto, A.; Chen, B.P.; Galy, A.H. Human Fetal Bone Marrow Early Progenitors for T, B, and Myeloid Cells Are Found Exclusively in the Population Expressing High Levels of CD34. Blood 1994, 84, 421–432.
- Huang, S.; Terstappen, L.W. Lymphoid and Myeloid Differentiation of Single Human CD34+, HLA-DR+, CD38- Hematopoietic Stem Cells. Blood 1994, 83, 1515–1526.
- Bhatia, M.; Bonnet, D.; Kapp, U.; Wang, J.C.; Murdoch, B.; Dick, J.E. Quantitative Analysis Reveals Expansion of Human Hematopoietic Repopulating Cells after Short-Term Ex Vivo Culture. J Exp Med 1997, 186, 619–624. [CrossRef]
- Notta, F.; Doulatov, S.; Laurenti, E.; Poeppl, A.; Jurisica, I.; Dick, J.E. Isolation of Single Human Hematopoietic Stem Cells Capable of Long-Term Multilineage Engraftment. Science 2011, 333, 218–221. [CrossRef]
- Kilpinen, H.; Goncalves, A.; Leha, A.; Afzal, V.; Alasoo, K.; Ashford, S.; Bala, S.; Bensaddek, D.; Casale, F.P.; Culley, O.J.; et al. Common Genetic Variation Drives Molecular Heterogeneity in Human IPSCs. Nature 2017, 546, 370–375. [CrossRef]
- Subbiah, V.; Gainor, J.F.; Rahal, R.; Brubaker, J.D.; Kim, J.L.; Maynard, M.; Hu, W.; Cao, Q.; Sheets, M.P.; Wilson, D.; et al. Precision Targeted Therapy with BLU-667 for RET-Driven Cancers. Cancer Discov 2018, 8, 836–849. [CrossRef]
- Subbiah, V.; Cassier, P.A.; Siena, S.; Garralda, E.; Paz-Ares, L.; Garrido, P.; Nadal, E.; Vuky, J.; Lopes, G.; Kalemkerian, G.P.; et al. Pan-Cancer Efficacy of Pralsetinib in Patients with RET Fusion–Positive Solid Tumors from the Phase 1/2 ARROW Trial. Nat Med 2022, 28, 1640–1645. [CrossRef]
- Popat, S.; Liu, S.V.; Scheuer, N.; Hsu, G.G.; Lockhart, A.; Ramagopalan, S.V.; Griesinger, F.; Subbiah, V. Addressing Challenges with Real-World Synthetic Control Arms to Demonstrate the Comparative Effectiveness of Pralsetinib in Non-Small Cell Lung Cancer. Nat Commun 2022, 13, 3500. [CrossRef]
- Ye, M.; Zhang, H.; Amabile, G.; Yang, H.; Staber, P.B.; Zhang, P.; Levantini, E.; Alberich-Jordà, M.; Zhang, J.; Kawasaki, A.; et al. C/EBPa Controls Acquisition and Maintenance of Adult Haematopoietic Stem Cell Quiescence. Nat Cell Biol 2013, 15, 385–394. [CrossRef]
- Geest, C.R.; Coffer, P.J. MAPK Signaling Pathways in the Regulation of Hematopoiesis. Journal of Leukocyte Biology 2009, 86, 237–250. [CrossRef]
Figure 1.
RET activation with GDNF/GFRα1 has no effect on HSC potential at D13 of hematopoietic differentiation. (A) Morphology of non-adherent, round, hematopoietic cells derived from PB33-WT iPSC at D13 of differentiation (B) Microscope pictures (magnification 10x) of May-Grunwald and Giemsa (MGG) staining at day 13 of floating hematopoietic cells differentiated from PB33-WT. (C) Microscope picture of CFU assay at D14 of culture displaying a Colony derived from CFU-GM (white) and colony derived from BFU-E (Red) (D-G) FACS phenotypic panel gated on live cells. Proportion of CD34 total (D), primitive hematopoietic stem and progenitor cells (CD34+/CD38-) (E), HSCs (CD34+CD38- CD49f+) (F), or hematopoietic cells (CD45+) (G) at day 13 of hematopoietic differentiation with or without GDNF for two different iPSC cell lines (PB33-WT and PB68-WT). (H) CFC assays for PB33-WT and PB68-WT with or without GDNF showing the number of colonies per 5000 cells (Means and SD are represented) and the type of colonies (I). All experiments have been performed six times. P-values were calculated using a two-tailed Student’s t-test. ns, not significant.
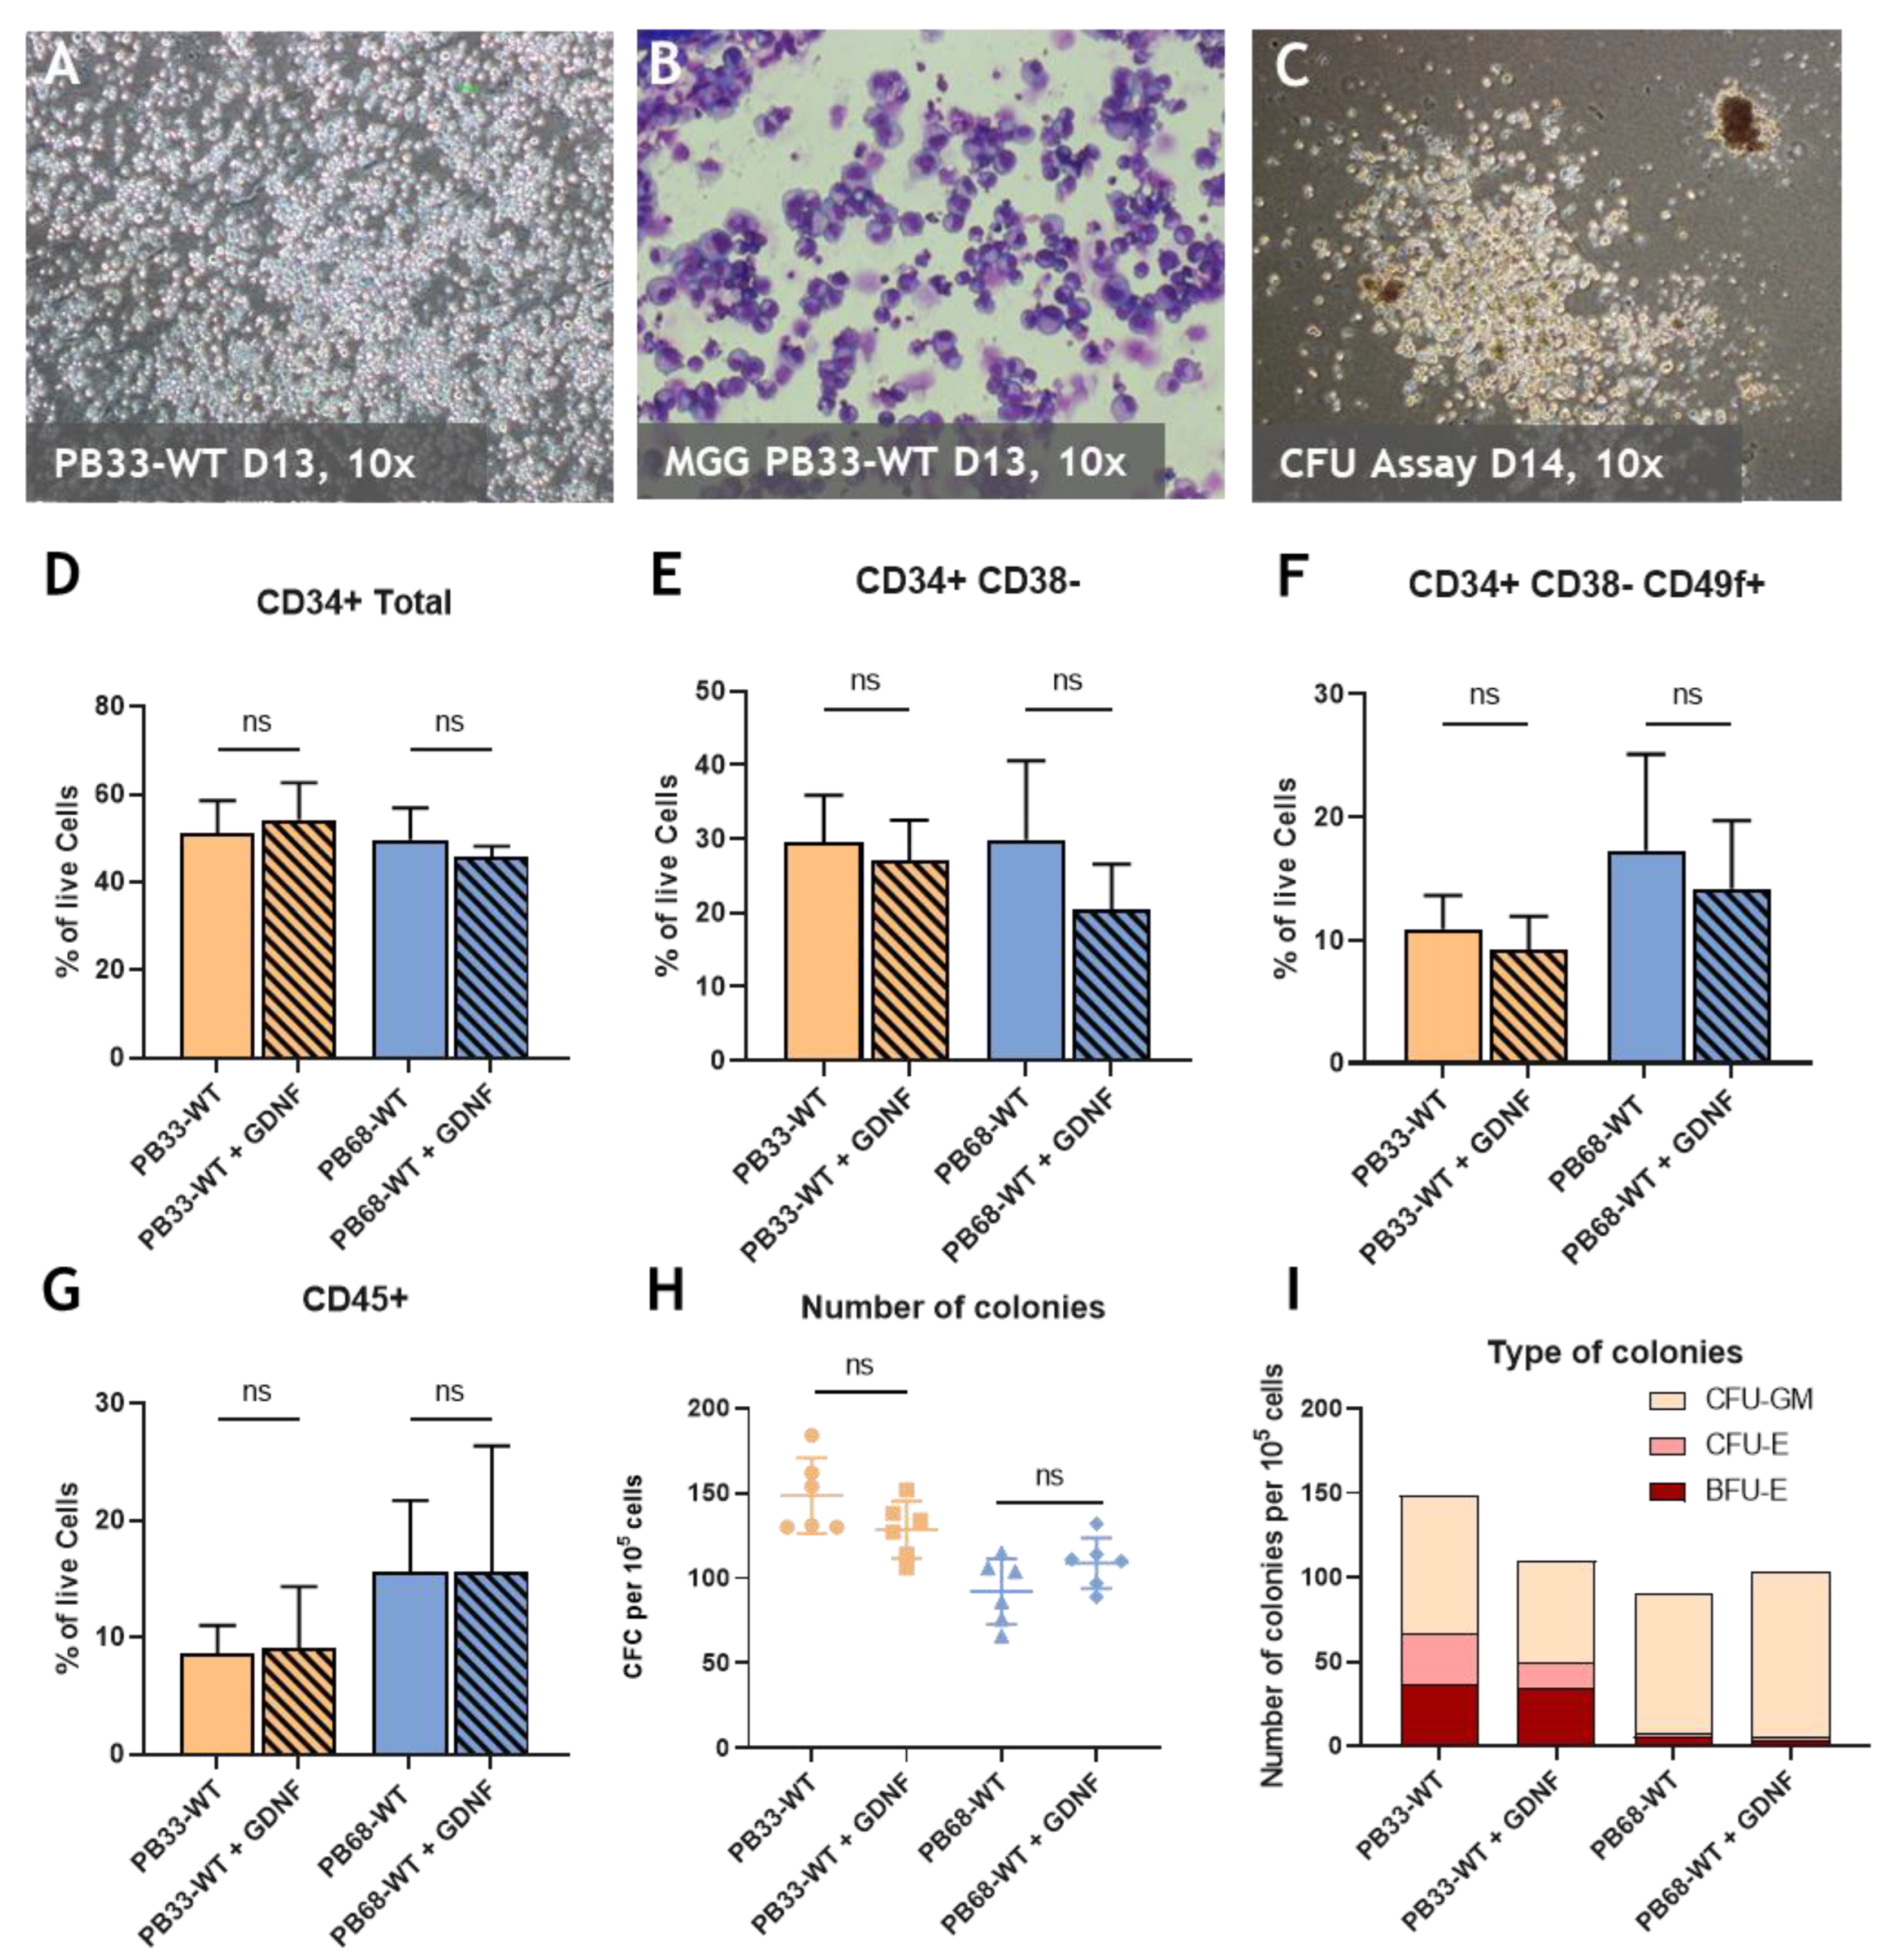
Figure 2.
Overexpression of RETWT and RETC634Y during iPSCs-derived hematopoiesis decreases the percentage of HSCs and their capability. (A-D) FACS phenotypic panel gated on live cells. Proportion of CD34 total (A), primitive hematopoietic stem and progenitor cells (CD34+/CD38-) (B), HSCs (CD34+CD38- CD49f+) (C), or hematopoietic cells (CD45+) (D) at day 13 of hematopoietic differentiation for WT iPSC cell lines (PB33-WT and PB68-WT), with RETWT overexpression with or without GDNF or with RETC634Y overexpression. (E) CFC assays for PB33-WT/PB33-RETWT/PB33-RETC34Y and for PB68-WT/PB68-RETWT/PB68-RETC634Y showing the number of colonies per 5000 cells and the type of colonies (F) (Means and SD are represented). All experiments have been performed six times. P-values were calculated using a two-tailed Student’s t-test. ns, not significant; *, P<0.05; **, P< 0.01; ***, P<0.001; ****, P<0.0001.
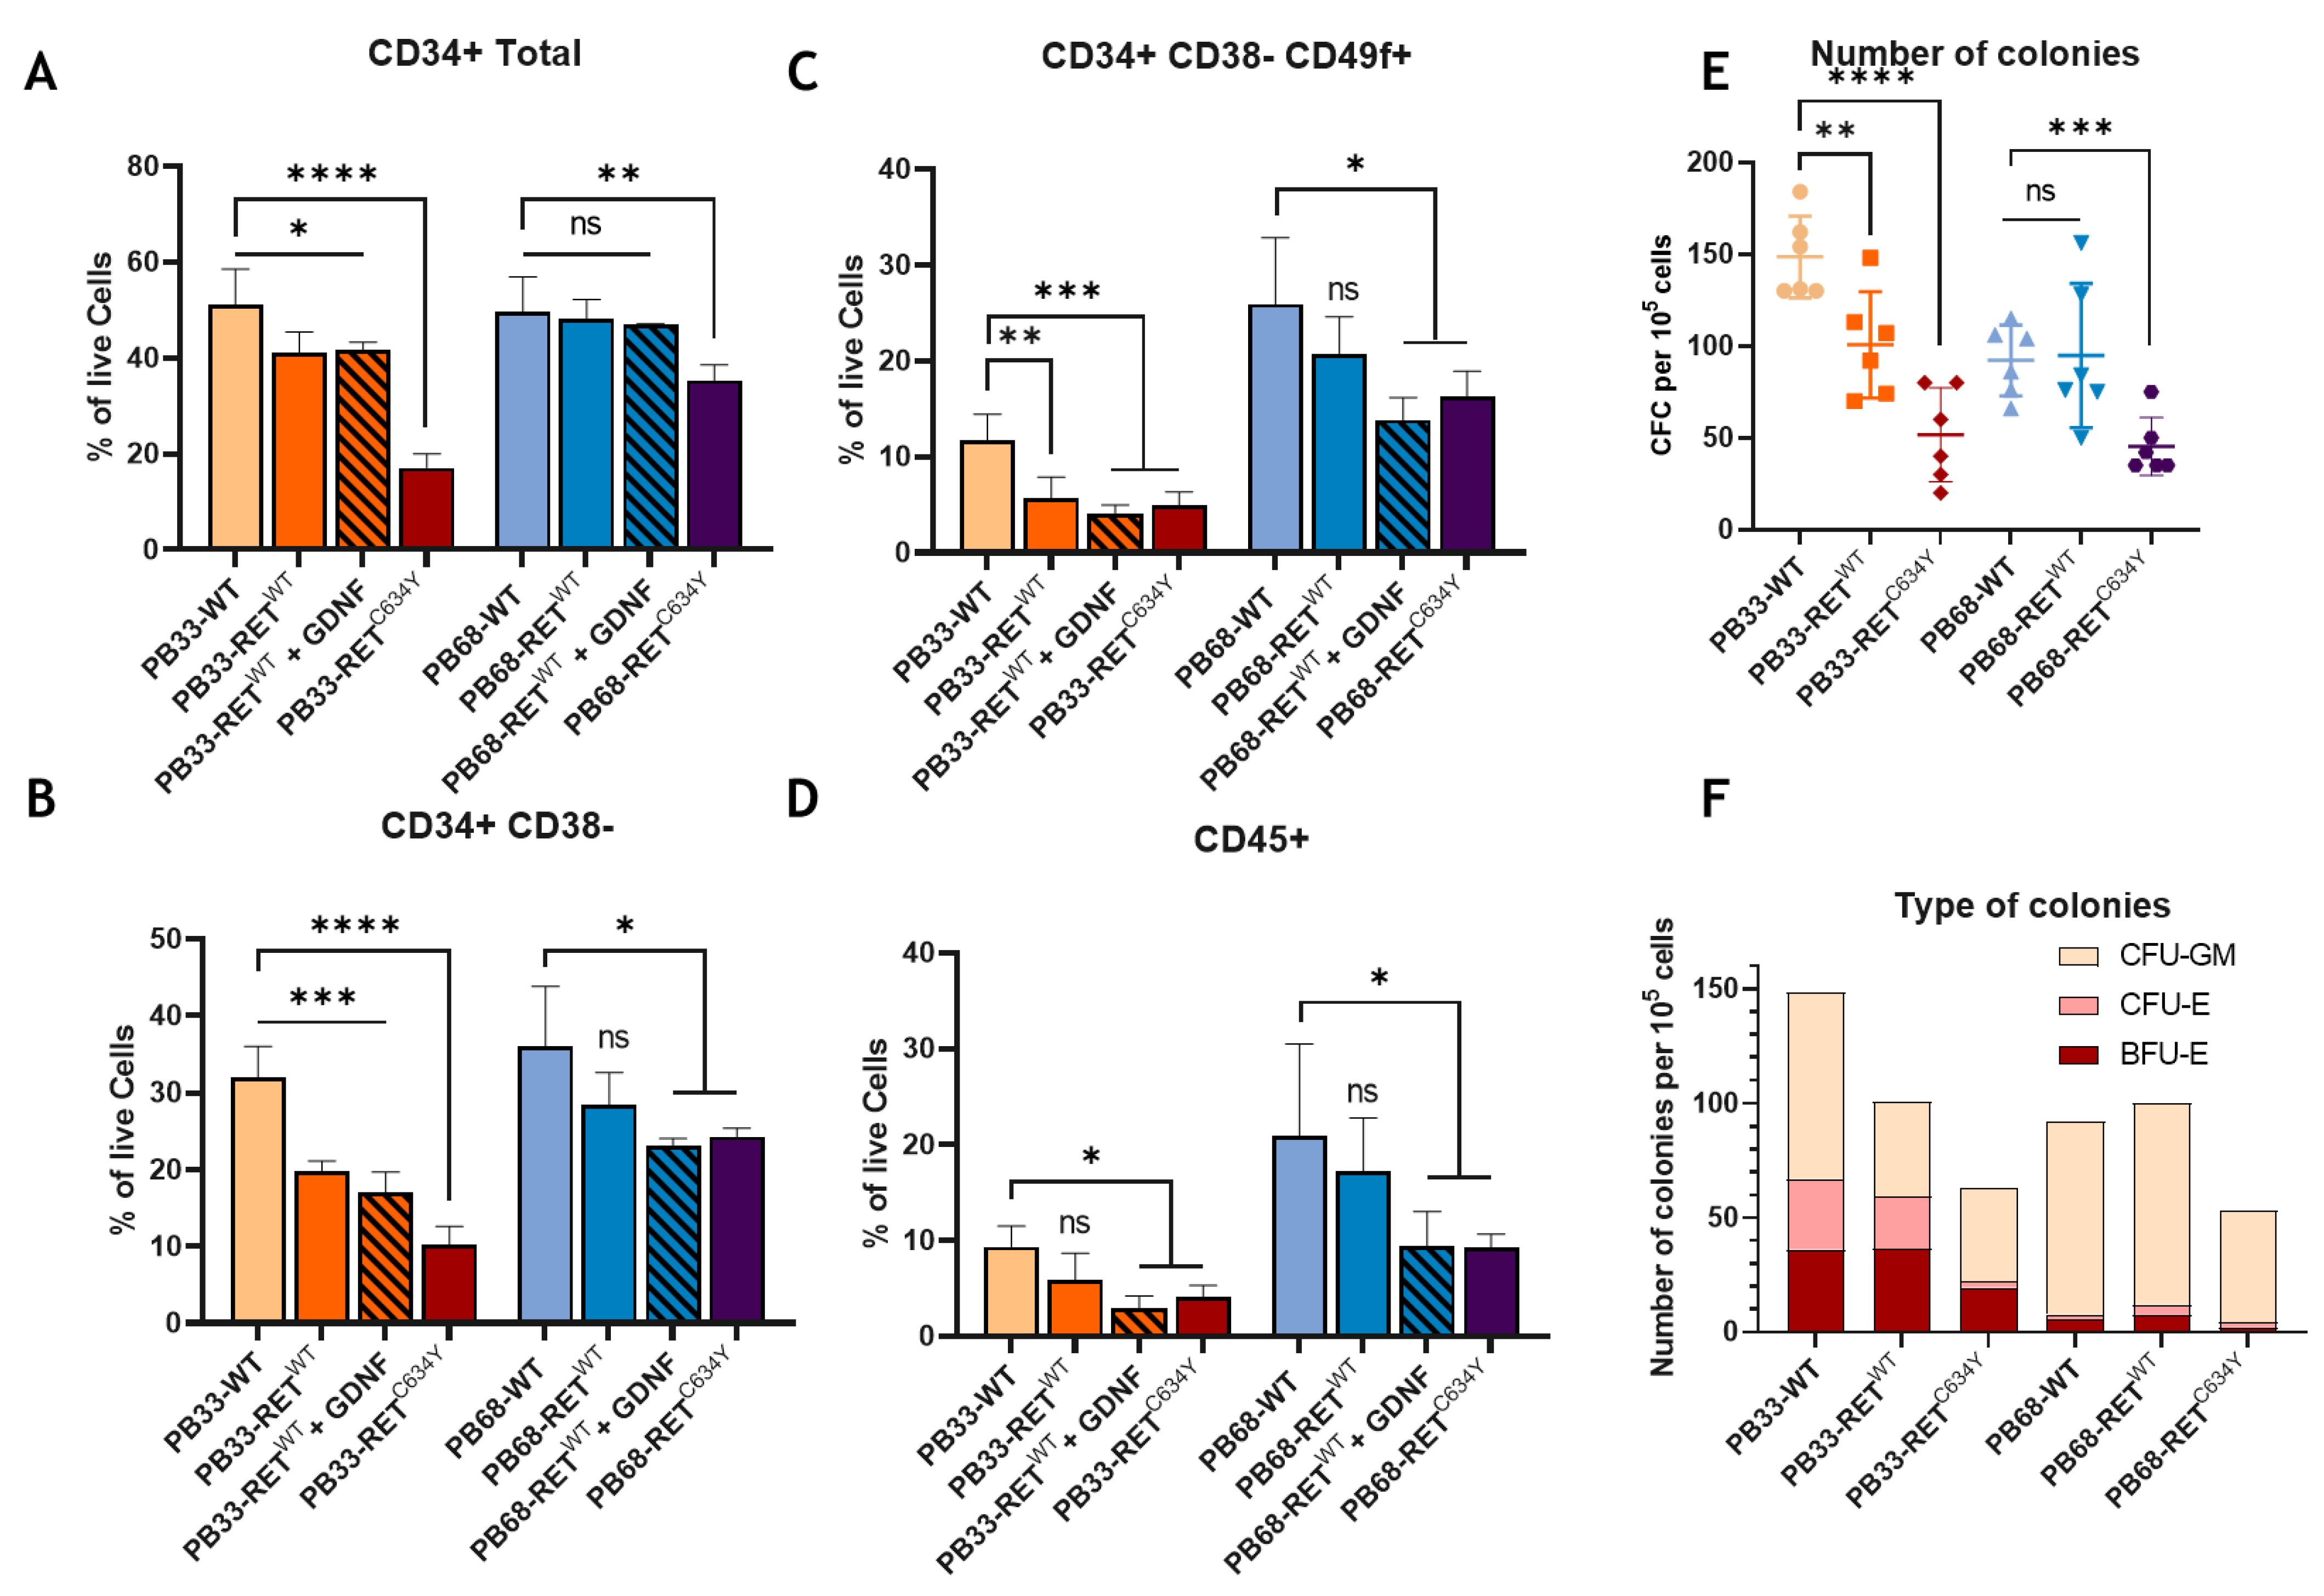
Figure 3.
RETC634Y mutation from a patient has an inhibitory effect of the HSCs potential correlated with MAPK1/2 activity. (A-D) FACS phenotypic panel gated on live cells. Proportion of CD34 total (A), primitive hematopoietic stem and progenitor cells (CD34+/CD38-) (B), HSCs (CD34+CD38- CD49f+) (C), or hematopoietic cells (CD45+) (D) at day +13 of hematopoietic differentiation for RETC634Y mutated iPSC (iRETC634Y) and its isogenic CRISPR control (iRETCTRL). (E) CFC assays showing the number of colonies per 5000 cells. (F) Western blot showing iRETC634Y and iRETCTRL at iPSC stage or after 13 days of hematopoietic differentiation. (G-H) Relative change of the phospho-p44/42 MAPK (G) and pRET/RET (H) quantity during hematopoietic differentiation. All experiments have been performed three times. P-values were calculated using a two-tailed Student’s t-test. ns, not significant; *, P<0.05; **.
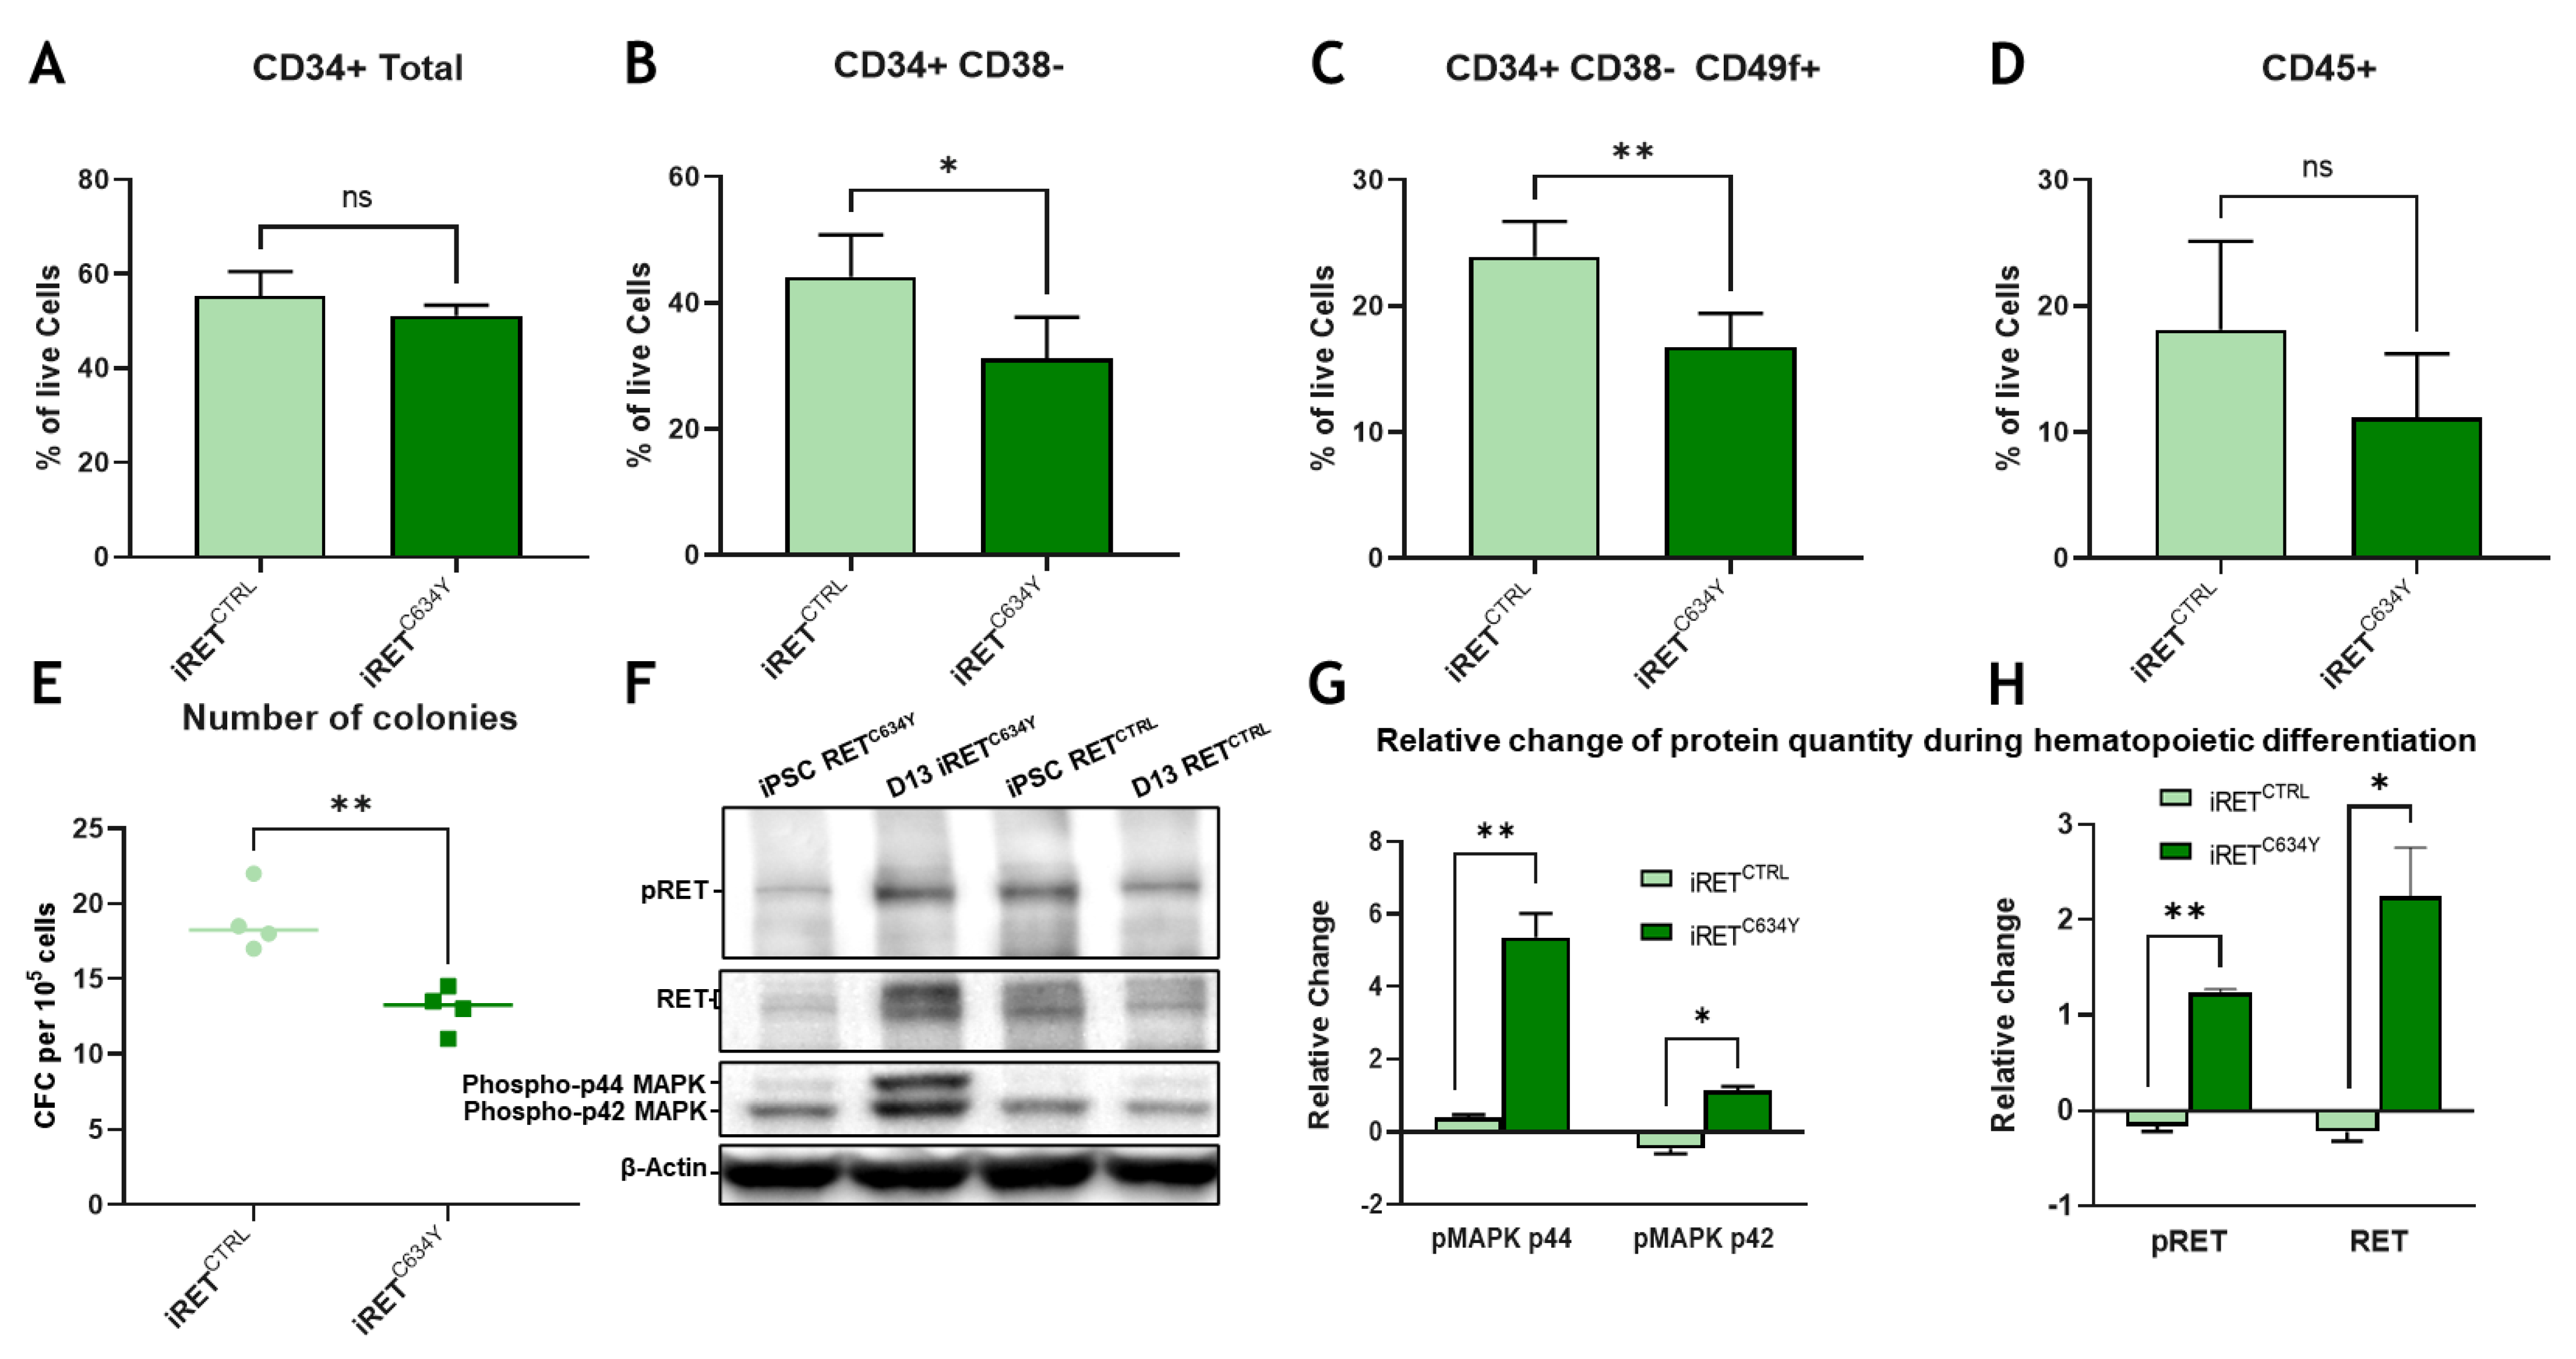
Figure 4.
iRETC634Y mutated hematopoietic cells derived from iPSCs harbored a specific activated expression profile as compared to iRETCTRL (A) Whole transcriptomic principal component analysis stratified on group of samples. (B) Volcano plot of differential expressed between iRETC634Y mutated cells and its isogenic CRISPR correction iRETCTRL. (C) Expression heatmap of 109 genes up regulated in iRETC634Y cells as compared to its CRISPR corrected control iRETCTRL.
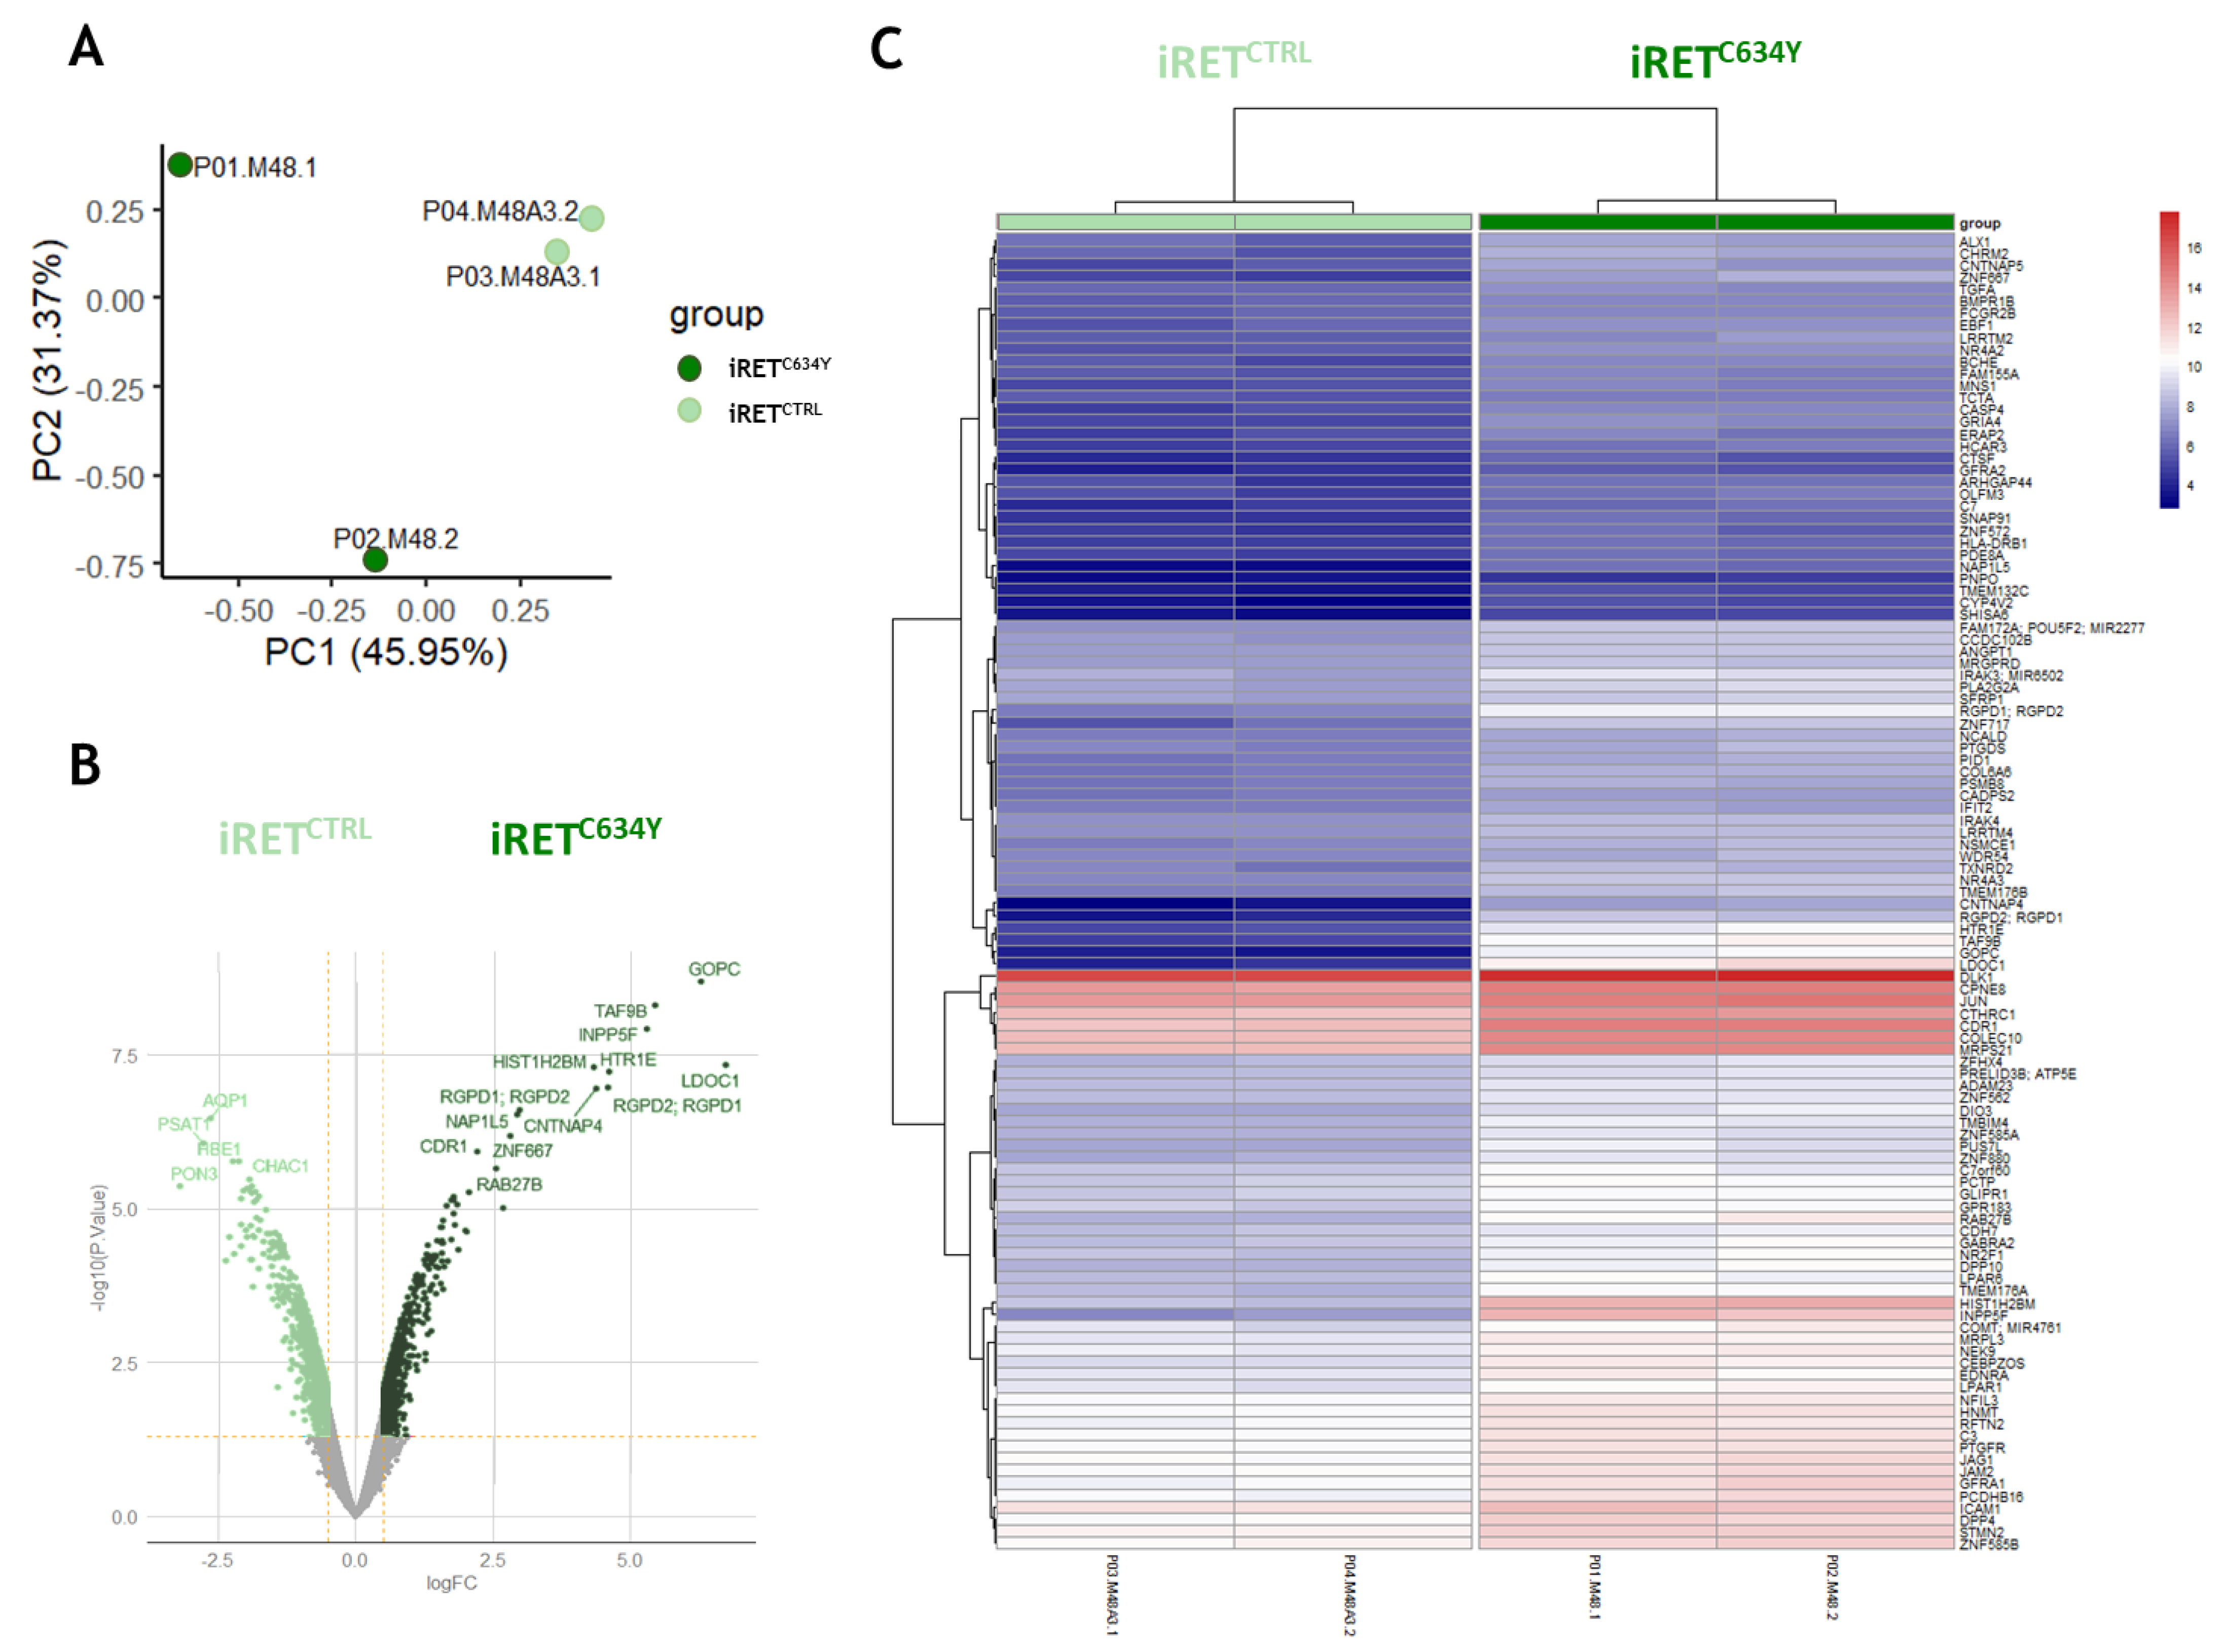
Figure 5.
MAPK cascade overlaps immune system and hemopoiesis network induced by RETC634Y mutation in hematopoietic cells derived from iPSCs: (A) Bar plot of functional enrichment performed on GO-BP database with 109 coding genes up-regulated by RET mutation. (B) Venn diagram for overlapping of MAPK, immune system, hemopoiesis gene sets up regulated by RETC634Y mutation. (C) MAPK and hematopoiesis regulation molecular network activated by RET mutation. (D) Expression of RET regulated candidate genes quantified by qRT-PCR in iPSCs-derived hematopoietic cells after 13 days of differentiation. Experiments have been performed three times. P-values were calculated using a two-tailed Student’s t-test. ns, not significant; *, P<0.05; **, P< 0.01; ***, P<0.001; ****, P<0.0001.
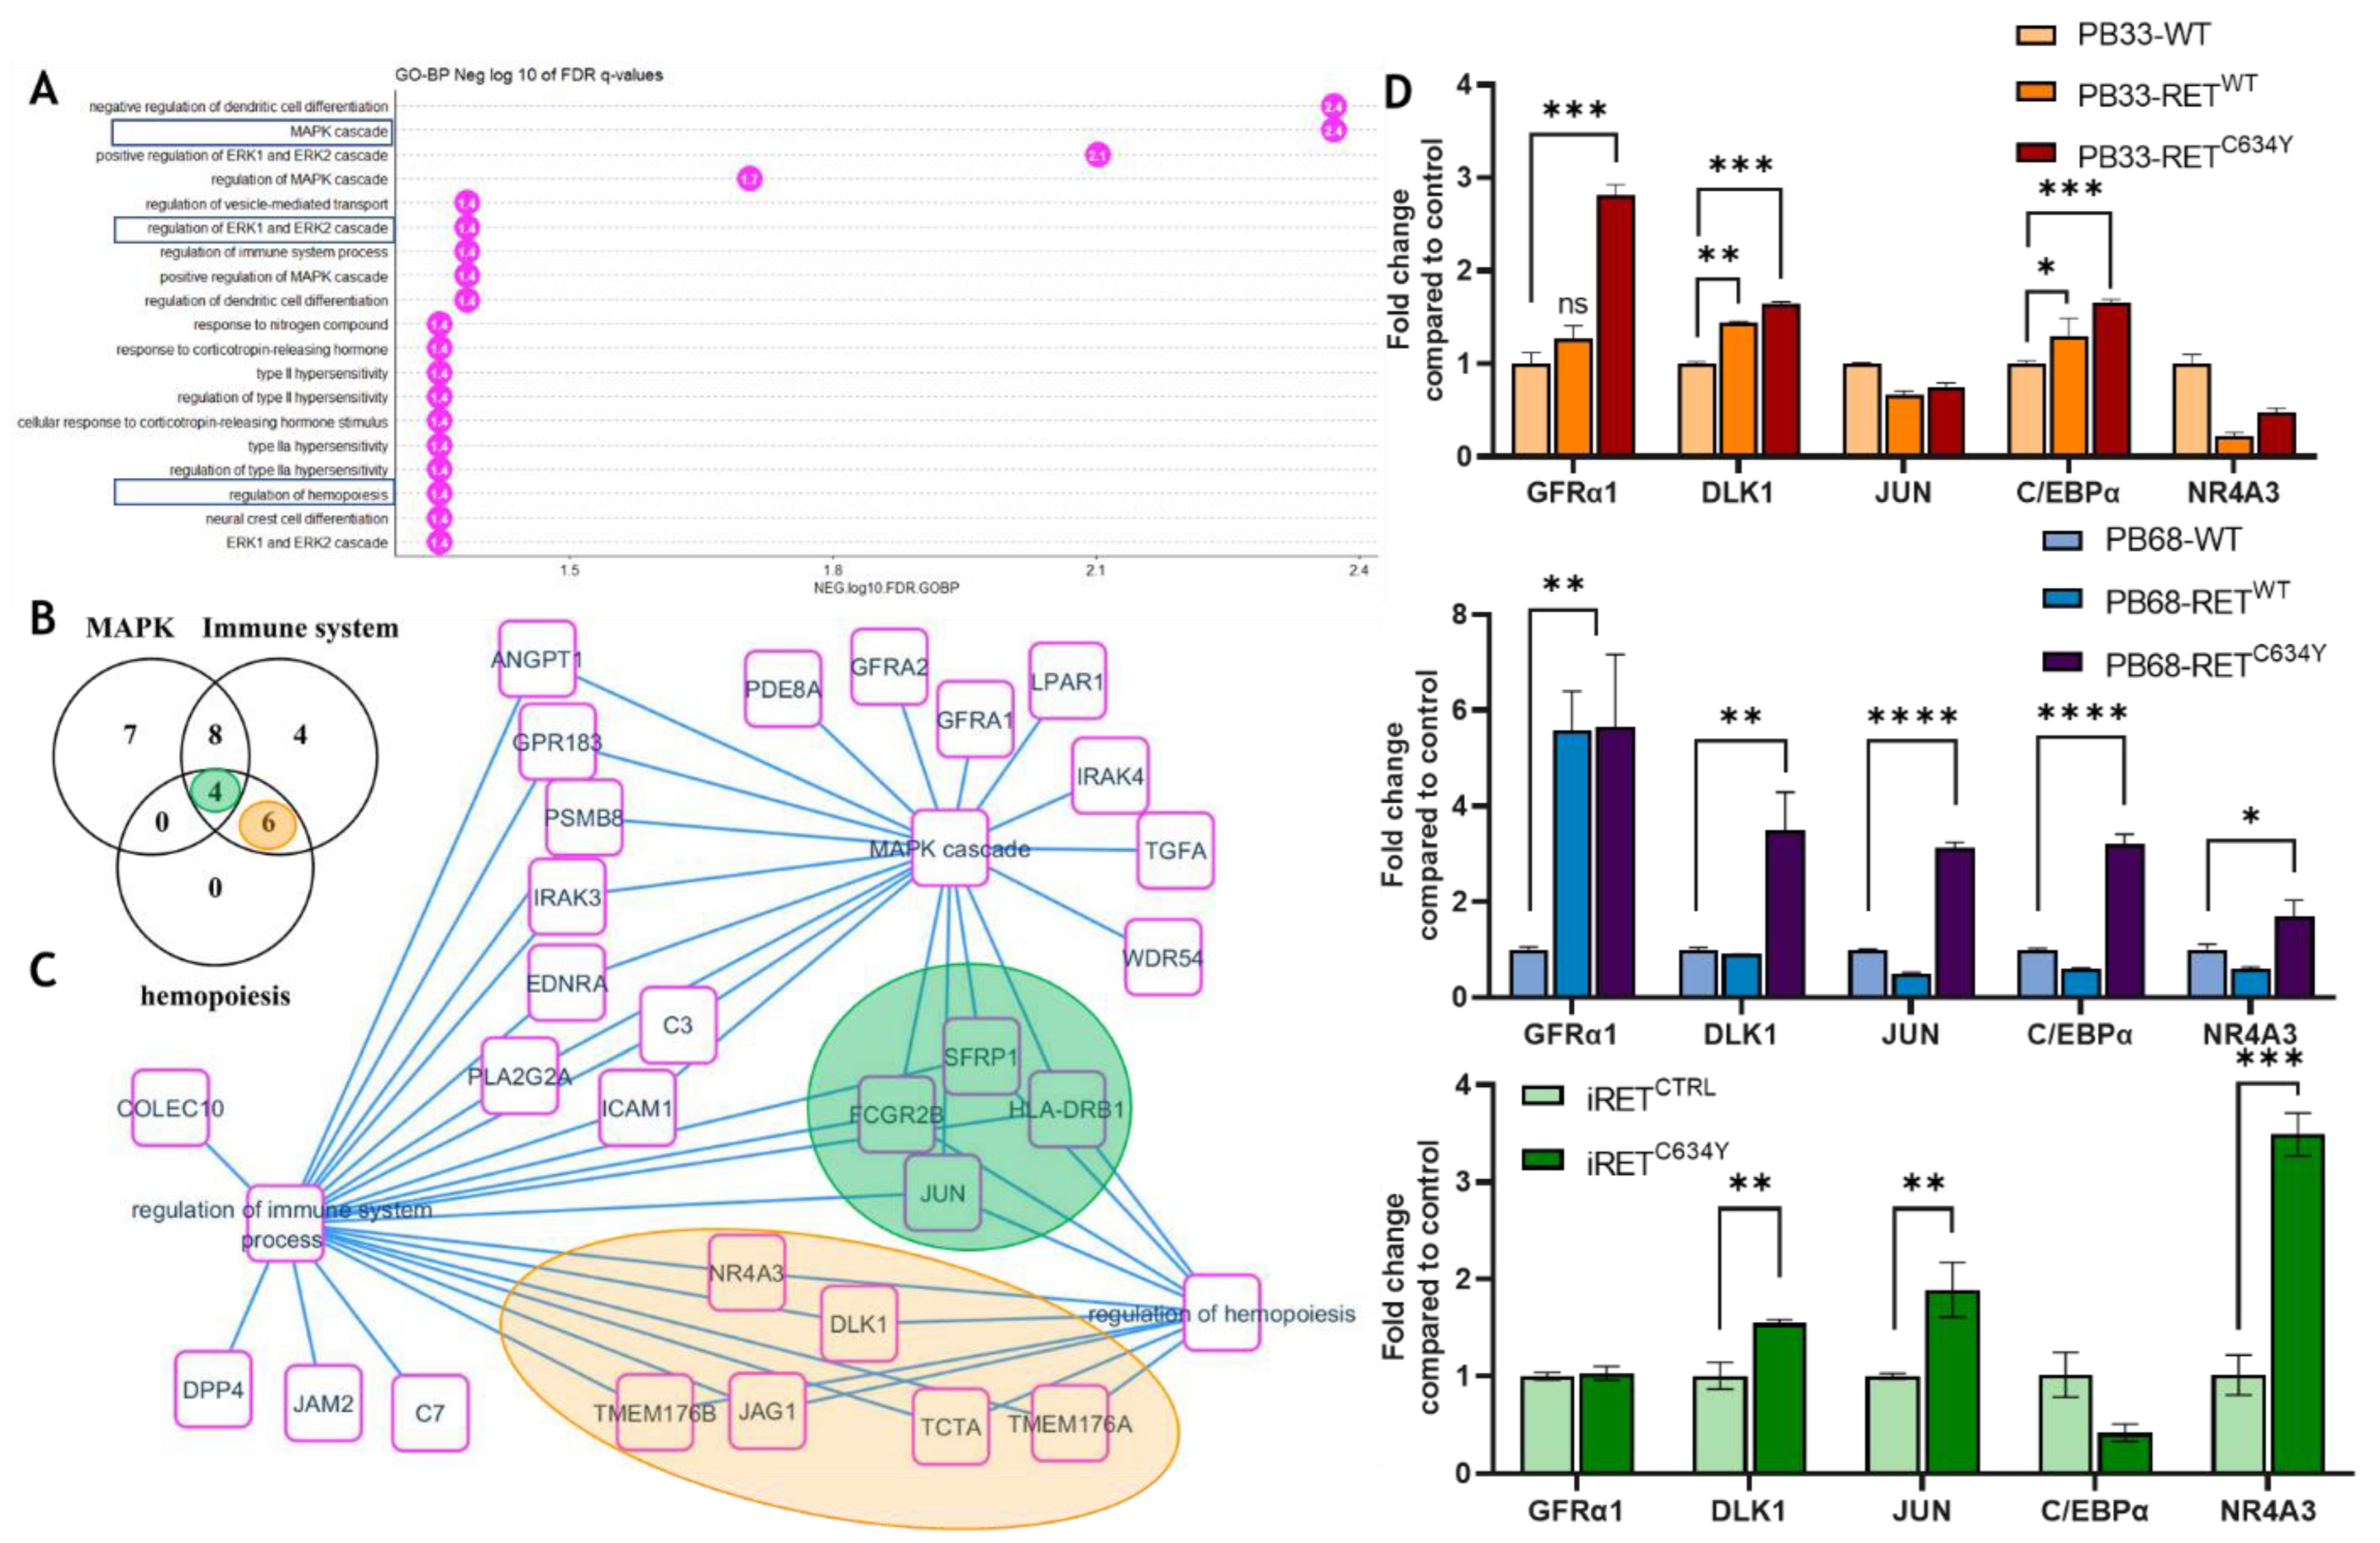

Table 1.
Antibody fluorophores and references.
| Antibody | Fluorophore | Reference |
|---|---|---|
| CD34 | APC | BD 555824 |
| CD38 | PE-Cy7 | BD 560677 |
| CD45 | FITC | BD 555482 |
| CD49f | PE | BD 555736 |
| CD201 | BV421 | BD 743552 |
Disclaimer/Publisher’s Note: The statements, opinions and data contained in all publications are solely those of the individual author(s) and contributor(s) and not of MDPI and/or the editor(s). MDPI and/or the editor(s) disclaim responsibility for any injury to people or property resulting from any ideas, methods, instructions or products referred to in the content. |
© 2023 by the authors. Licensee MDPI, Basel, Switzerland. This article is an open access article distributed under the terms and conditions of the Creative Commons Attribution (CC BY) license (http://creativecommons.org/licenses/by/4.0/).
Copyright: This open access article is published under a Creative Commons CC BY 4.0 license, which permit the free download, distribution, and reuse, provided that the author and preprint are cited in any reuse.


