
Submitted:
10 May 2023
Posted:
10 May 2023
You are already at the latest version
Abstract
This study examines whether and how carbon trading policy impacts the financialization of non-financial firms, using China emission trading scheme as a natural experiment. We show that the carbon trading policy has effectively long-term inhibitory effect on corporate financialization. Our findings are robust to possible result bias and more precise control group. In addition, we explore potential channels through which carbon trading policy can affect financialization, and find that it contributes to curb financialization by reducing financing constraints. Finally, we show that the relationship between carbon trading policy and financialization of non-financial companies is moderated by company’s ownership, region and industry competition.
Keywords:
carbon emissions trading
; corporate financialization
; financing constraints
; difference-in-differences model
1. Introduction
Threats over global warming linked to carbon dioxide (CO2) emissions from human activity have recently become salient [1], which are received growing attentions by academics, media, and politicians [2]. Countries are actively adopting carbon reduction action and may introduce significant limits on CO2 emissions within the next decade to accomplish the 2°C or even 1.5°C control in the Paris climate agreement [1,3]. Previous research has documented that the carbon emissions trading has significant effects on firm-level outcomes (e.g. innovation, performance and stock returns) [4,5,6,7]. However, the literature widely neglects its influence on corporate financialization.
This study aims to explore how carbon emissions trading affects the financialization of non-financial companies (NFC). Corporate financialization can be defined as NFC increase investment in financial assets while reducing productive investment [8]. The financialization of NFC has become a common phenomenon in emerging markets. Taking China as an example, the disproportionately high growth beyond real economic needs of China’s financial sector has enabled financial assets to bring substantial profits to enterprises [9], which exacerbates the profitability gap between the financial sector and the non-financial sector, leading NFC are forced to invest in more profitable financial assets due to the downturn in entities. However, existing research showed that financialization makes the surplus capital of NFC increasingly used for speculation and arbitrage instead of their main businesses [8], such as innovation or production improvement, thereby reducing the company’s core business potential future profitability [10,11], which may cause a vicious circle of “low profit - financialization - lower future profitability”.
At the same time, the possible impact of carbon emissions trading on corporate financialization is inconclusive. As a typical environmental regulation, carbon emissions trading can not only further damage NFC’s profits through compliance costs, but also reduce the return on entities investment thereby weakening investor confidence in polluting companies, leading to underperformance of company stocks [12,13]. In this case, carbon emissions trading may exacerbate the financialization of NFC. However, the emissions trading may also reduce the financialization of NFC because, on the one hand, companies can directly obtain economic benefits by selling carbon emission rights. On the other hand, it can stimulate firms to disclose carbon information [14], thus sending green signals to the market, which can attract more investors and ease the financial pressure of NFC. Therefore, it is necessary to assess the relationship between carbon emissions trading and the financialization of NFC.
To conduct the examinations, we use China as a laboratory since it provides an ideal research context. First, as the world’s largest carbon emitters and emerging economies, China approved carbon emissions trading pilots in 7 provinces and cities since 2011 to promote the low-carbon economy transition, all of which launched trading in 2014. The implementation of carbon emissions trading pilots can be seen as a quasi-natural experiment for identifying the causal relationships between carbon emissions trading and financialization, whose strictly exogenous characteristic can prevent the possibly reverse shaping of carbon emissions trading by financialization. Second, the financialization of NFC and low-carbon development is a prominent social issue in China. China not only needs low-carbon economic transformation, but also rapid economic development. However, if carbon policies intensify the financialization of NFC, it will have a negative impact on the real economy in the future. Hence, studying the impact of carbon emissions trading on NFC financialization based on China context has practical significance.
Based on the differences between covered companies and non-covered ones before and after the carbon emissions trading pilots, we construct a difference-in-differences (DID) model and link it with the financialization index [11,15] to explore the impact of carbon emissions trading on the financialization of NFC. Using a sample of China listed NFC over the period of 2008 to 2020, we find that the financialization degree of NFC located in pilot areas significantly decreases, which still exists when we validate the robustness of the research. Hence, carbon emissions trading effectively inhibits the financialization of NFC.
Then, we explore the influence channel of carbon emissions trading. We find that carbon emissions trading can inhibit corporate financialization by reducing corporate financing constraints. The possible reason for this result is that, companies can gain direct economic benefits by selling carbon emissions rights. Li et al. [14] also pointed out that carbon trading can improve enterprises’ transparency of carbon information, which can reduce information asymmetry and create an environmentally friendly corporate image, thereby alleviating financing distress.
Finally, we conduct several cross-sectional tests in terms of company ownership, company location and the degree of industry competition. We find that non-state-owned ownership, eastern location and high level of industry competition promotes the inhibitory effect of carbon emissions trading on financialization. Non-state-owned enterprises turn to holding more financial assets in order to survive in the context of the downturn in the entities economy leading they are more significantly affected by carbon trading policies. Whereas firms in eastern regions and highly competitive industries have to holding more financial assets under the combined pressure of competition and shrinking markets makes them very sensitive to the alleviation of financing constraints brought by carbon emissions trading.
Our research makes several contributions to the existing literature. First, to our best knowledge, we are the first to explore the relationship between carbon emissions trading and the financialization of non-financial companies. As one of the effective means to curb climate change, carbon emissions trading has attracted the attention of all countries. Previous research has proved carbon emissions trading has real effects on firms [4,5,6,7], but neglected its influence on corporate financialization. Our study extends the consequences of carbon emissions trading at the company level. Second, our results provide clear policy implications for low-carbon transitions in emerging markets. Nowadays, more than half of the world’s top 10 carbon dioxide emitters are emerging and developing countries [16]. For them, non-financial firms not only are the main carbon emissions source, but also the key driver of economic development. Therefore, it is important to assess the impact of carbon emissions trading on the financialization of non-financial companies in emerging markets, because financialization is one of the obstacles to the corporate development. Taking the typical emerging market China as the background, we find that carbon emissions trading can reduce the financialization of non-financial companies, thereby promoting the low-carbon economy development, which can be referenced by other emerging markets.
The rest of this paper is organized as follows. Section 2 discusses the institutional background and hypothesis development. Section 3 introduces the sample construction and research design. Section 4 reports the empirical results, and Section 5 presents the influence channels of carbon trading policies. Then, section 6 presents the further tests conducted. Section 7 concludes.
2. Institutional Background and Hypothesis Development
2.1. Institutional Background
In order to effectively curb greenhouse gas emissions for achieving a carbon peak by 2030 and carbon neutrality by 2060, the Chinese government has taken several measures. One of the most effective policies is the carbon emissions trading pilots [17]. In 2011, China’s National Development and Reform Commission (NDRC) designated Beijing, Shanghai, Tianjin, Hubei, Guangdong, Shenzhen and Chongqing as the first batch of pilot areas for the emissions trading. The pilot area spans from the eastern coastal area to the central and western regions. In 2014, all carbon trading markets in the seven pilot provinces and cities were in operation, including more than 20 industries such as steel, electricity, cement, etc. The specific pilot areas and covered industries are shown in Figure 1. From 2013 to 2019, the total amount of carbon trading in the pilot market increased from 445,500 tons to 31 million tons with the transaction volume raising from RMB 25 million to RMB 952 million, which brought significant economic impact [6].
Given that the characteristics and behaviors of firms cannot influence the formulation and promulgation of carbon emissions trading pilots, they can be regarded as a strictly exogenous quasi-natural experiment. Hence, the pilots provide an ideal context without endogeneity to examine the impact of carbon trading on the financialization of NFC due to the post-policy differences among companies caused by their external shock. Specifically, the carbon emissions trading pilots bring two significant differences, one is that the carbon emission allowances can be traded after the pilots and the other is that carbon trading can only be carried out by covered industries in pilot areas. Therefore, based on the two-dimensional changes brought by the pilots, we construct the difference-in-differences model to identify the causal influence of carbon trading on the financialization of NFC.
2.2. Hypothesis Development
Given that environmental regulations are able to influence corporate behavior, carbon trading policies can affect corporate financial decisions [18]. Existing research pointed out that the main motivations for non-financial companies to hold financial assets are liquidity reserves and operating losses compensation [19,20]. Therefore, we analyze the possible impact of carbon trading policies from these two motivations.
2.2.1. Liquidity Reserves Motivation
The reservoir theory believes that companies hold financial assets to prevent future cash flow uncertainties [21,22], while environmental regulations can increase the indeterminacy of an expected cash flow of business entities.
On the one hand, the compliance costs caused by environmental regulations,such as emission fees and equipment upgrade cost, can directly damage corporate profits and thus reducing cash flow [23]. On the other hand, financial institutions may choose to reduce the scale of loans or increase borrowing costs for enterprises, especially those with heavy pollution, to avoid potential credit risks derived from environmental issues under strict environmental regulations, which makes loan financing more difficult [24]. At the same time, the policy risks of environmental regulations will weaken investors' confidence of polluting companies when transmitting to the capital market. It can increase difficulty in corporate equity financing through resulting in poor performance of company stock [13].
In addition, information asymmetry and environmental regulations' strict exogenous characteristics make firms only can predict the changing trend of future environmental regulations based on the current intensity. At this stage, increasingly stringent environmental regulations may lead to companies' expected cash flow intensified volatility, which make firms raise financial assets investment to reduce future financing constraints and survival risks. Hence, non-financial companies will increase financial assets holding to store liquidity in the face of environmental regulations.
2.2.2. Losses Compensation Motivation
Neoclassical economics believes that environmental policies can alleviate environmental pollution by internalizing negative externality costs [25]. However, the additional costs caused by environmental regulations need to be borne by companies in most cases, rather than state subsidies [26]. Therefore, companies need to invest revenue to reduce pollution emissions, which will hurt profits [12,27]. Based on the principal-agent theory, managers pay more attention to short-term interests rather than risk, especially while facing earning pressure [28]. Therefore, high-return and financial assets with high-risk may become a life-saving straw for managers to compensate the compliance costs of environmental regulation.
On the basis of the above analysis, we formulate the following hypothesis.
Hypothesis: Carbon trading policy intensifies the degree of financialization of Chinese non-financial companies.
3. Data and Variables
3.1. Data and Sample Selection
In order to evaluate how carbon trading policy impacts the financialization of non-financial companies, we collect firm data from China Research Data Services Platform (CNRDS) and China Security Market and Accounting Research (CSMAR).
This study takes all listed enterprises in China from 2008, which is the sixth year before ETS implementation, to 2020 as the initial sample because the available post-ETS firm-year data ends in in 2020, the sixth year after promulgation, and use the following selection criteria. First, we exclude financial, insurance and real estate listed companies. Second, we eliminate the items with missing data. Third, we exclude the enterprises (marked as ST or *ST) that suffered serious losses in the sample period according to Tian, Xu and Zhang [29]. Moreover, we winsorize continuous variables at the 1% and 99% percentiles to control the effect of extreme value. After processing the data, the final sample contains 28,600 observations.
3.2. Measuring Corporate Financialization
Following the views of Xu and Xuan [11] and Akkemik and Özen [15], we propose of using the ratio of financial assets to total assets to measure the financialization of enterprises, can present the inclination of firms’ investment choices, that is, the willingness to financialize. The specific indicators are constructed as follows: the sum of transactional financial assets, derivative financial assets, the amount of loans and advances issued, the net amount of financial assets available for sale, net investments held to maturity and net investment real estate divided by the year-end total assets. Since the rapid development of China’s real estate at this stage, the real estate investment of many firms has changed from the self-use purpose to profit-seeking, which is consistent with the definition of financial assets in this paper. Hence, we include net investment real estate in financial assets. However, we exclude cash from financial assets because the purpose of holding currency funds by companies is mostly used in the daily production and operation of the company, which cannot bring capital appreciation to the company [30].
3.3. Research Design
We identify the impact of carbon trading policy on corporate financialization by difference-in-differences (DID) model. The basic logic of the DID model is to observe the treatment group and the control group before and after the policy shock. Changes in external policies only affect the treatment group, which leads to the difference between the treatment group and the control group after the policy shock is the result of external influences. Therefore, the two-dimensional changes of ETS pilot on intercompany (belonging affected industry or not) and time (before and after the implementation) can be used as a laboratory to identify the causal impact of carbon trading policy on financialization through DID model.
The DID model has several advantages. First, the DID model compares the differences between the treatment group and the control group under exogenous shocks to exclude non-policy-related influence and identify the net effect of the policy and thus reduce endogeneity [31]. Second, Tang et al. [32] stated that the results of the DID model are more reliable than traditional methods that use dummy variables to evaluate policy effects. Finally, it is widely used in causality identification of carbon trading policy and company reaction in context of China [4,6,33]. Hence, we build the following model (1):
where the subscript i and t means company i and year t, respectively. Fin i,t represents degree of corporate financialization, which is measured by the ratio of financial assets to total assets, of company i in year t. Higher Fin i,t represent companies are more inclined to invest in financial assets. We connect the enterprises in ETS pilot area covering industries with the year of all pilot carbon markets starting transaction to construct Treati × Postt as an explanatory variable according to Qi et al. [6] and Zhang and Duan [34]. For Treati, it equals 1 if the firm is in in the industries actually covered by the ETS pilots area, and 0 otherwise. Postt equals 1 if year is greater or equal to 2014, which is the starting year of trading in all ETS pilot, and 0 otherwise.
Fini,t = β0 + β1Treati × Postt + β2Controlsi + μj + γc + θt + εi,t,j,c
We also include several widely used control variables in the model based on Duchin [35] and Feng et al. [36], which relate with financialization. These variables include Lev (a proxy for enterprise leverage), LnSize (a control for firm size), SS and Rid (a control for corporate governance), LnAge (a proxy for enterprise maturity), ROA (a control for company performance) and Growth (a control for company growth ability). The specific definitions of the variables are detailed in the Appendix 1.
In addition, according to Chen et al. [4] and Qi et al. [6], we add θt (year fixed effects) and μj (industry fixed effect) to control the potential impact of time-varying economic cycle and the unobserved time-invariant characteristics across industries on financialization. In addition, to further account the unobservable time-invariant differences across cities that may affect firms’ financial assets holding, we refer Liu et al. [33] to add γc (cities fixed effects). The main coefficient of interest in model (1) is β1. If the coefficient of β1 is positive, then the carbon trading policy intensifies the degree of financialization of Chinese non-financial companies, vice versa.
3.4. Descriptive Statistics
Table 1 shows the descriptive statistics of the main variables. The minimum value of Fin is 0.000, and the maximum value is 0.981, which show that there are significant differences in the degree of financialization of Chinese non-financial companies. The mean and standard deviation of Fin are respectively 0.036 and 0.080, which are consistent with the existing literature [36] thereby proving that the sample selection without deviation.
4. Carbon Trading Policy and Corporate Financialization
4.1. Baseline Regression Results
We employ the OLS estimation to model (1) for exploring the impact of carbon trading policy on the financialization of non-financial firms. Table 2 presents the regression results. Column (2) adds control variables to column (1).
From column (1), we find that the coefficient of Treati × Postt is negatively significant at the level of 1%, which shows that carbon trading policy effectively prevents the intensification of corporate financialization. After adding control variables, the coefficients of Treati × Postt is still negatively significant.
Surprisingly, the regression results are contrary to our hypothesis that carbon trading policy curbs the financialization of non-financial firms. Specifically, the carbon trading policy with compliance cost does not make managers invest in more financial products for liquidity reserving and losses compensation. On the contrary, companies in the pilot covered industries cut down the financial assets investment after carbon trading launching.
For the control variables, LnSize and Lev are both negatively related to Fini,t showing that large company scale and adequate financing can reduce enterprises’ willingness of financialization. SS also presents negatively significant. Hence, strict internal management can prevent companies from investing in high-risk financial assets. However, LnAge is positively correlated with financialization, thus indicating that old non-financial companies may have to hold more financial assets to obtain liquidity and prevent profits from being squeezed by the financial industry.
4.2. Parallel Trend Test
The key logic of the DID model (1) is that the difference between the treatment group and the control group is caused by the ETS pilot instead of other factors. Specifically, the firms in treatment group and the control group should maintain the parallel financialization trend before the ETS pilot, but present significant differences after it. For proving the parallel trend, we reference Qi et al. [6] to examine the dynamic effects of the enactment of the ETS pilot on financialization of non-financial firms through construct new independent variable, which is the product of the dummy variable Treati and the dummy variable of corresponding year (the value is 1 in the corresponding year, and 0 otherwise), and build the following model (2):
where the subscript i and t means company i and year t, respectively. Fin i,t represents degree of financialization, which is measured by the ratio of financial assets to total assets, of company i in year t. pre3plusi,t, pre3i,t, pre2i,t, pre1i,t, imi,t, post1i,t, post2i,t, post3i,t and post3plusi,t are is the product of the dummy variable Treati and the dummy variable of corresponding year. All other variables in model (2) are consistent with the model (1), whose explanation is not repeated for brief.
Fini,t = β0 + β1pre3plusi,t + β2pre3i,t + β3pre2i,t + β4pre1i,t + β5imi,t + β6post1i,t + β7post2i,t + β8post3i,t + β9post3plusi,t + β10Controlsi + μj + γc + θt + εi,t,j,c
Table 3 shows result of parallel trend test. Column (2) adds control variables to column (1). We find that the coefficients prior to ETS pilot is insignificant thus verifying the parallel financialization trend between treatment group and control group. After pilot, the results signify that carbon trading policy curb the degree of financialization of treatment group enterprises whose inhibition effect still exists more than three years after the pilot. Hence, the carbon trading policy effectively and long-term deceases the tendency of Chinese non-financial companies to invest in financial assets.
4.3. Placebo Test
To verify whether there is possible results bias, we conduct a placebo test by randomly selecting 15% of the 3,367 companies in full sample as the dummy treatment group while the remaining firms setting as the control group. Then, we do the random sampling with replacement three times to generate Dummy treat1, Dummy treat2 and Dummy treat3 to replace the variable Treati in model (1) and repeat the regression. If the estimated coefficient of Dummy treat1, Dummy treat2 and Dummy treat3 are still significant, it will show that our original estimation result is likely to be biased, that is the change of financialization is affected by other policy changes or random factors, and vice versa.
Table 4 presents the results of the placebo test whose dependent variable is Fin i,t. Column (1), (2) and (3) show the results of Dummy treat1, Dummy treat2 and Dummy treat3, respectively. We find that the all dummy treat is not significant. As a result, the decreasing of the financialization of non-financial firms brought by the carbon trading policy.
4.4. PSM-DID Estimate
We also extend the DID model to a DID model linking propensity score matching (PSM) method in order to improve the reliability of the research results. The control group still is firms, which are not covered by ETS pilot, but through propensity score matching based on companies’ characteristics, we can get a more suitable control group than randomly selecting [38]. According to Qi et al. [6], we use nearest-neighbour matching to estimate PSM-DID whose results of the propensity score matching balance test are shown in Appendix 2. To ensure a sufficient number of observations, we match each processing group company with three control group companies. Table 5 shows the estimation results of PSM-DID. Column (2) adds control variables to the column (1). From the results, we find that the test results are all same as the original results, which prove that our research results are reliable.
5. Influence Channels of Carbon Trading Policy
The analysis in Section 4 presents that the carbon trading policy effectively suppress the financialization of non-financial firms in China. What is the influencing channel of this policy curbs corporate financialization? On the one hand, enterprises can obtain economic benefits by selling carbon emission rights. On the other hand, carbon trading policies can stimulate companies to disclose more carbon emission information [14]. Based on the theory of information asymmetry, carbon information disclosure improves corporate transparency and reduces information asymmetry while transmitting to outside investors a green signal that the company attaches importance to environmental protection, which can attract more investors thereby obtaining external financial support. Through the above two analysis, it can be seen that the carbon trading policy may alleviate the financing constraints, who are precisely the important reasons for companies to expand financial asset holdings. Hence, we explore whether carbon trading policies can reduce the degree of corporate financialization by decreasing corporate financing constraints through model (3) and (4):
where model (3) is a benchmark DID model whose explained variable SAi,t is the measurement of corporate financing constraints (Hadlock and Pierce, 2010). A higher SAi,t indicates firms with higher financing constraints. Model (5) adds SAi,t based on model (1). All other variables in model (3) and (4) are consistent with the model (1), whose explanation is not repeated for brief. The basic idea of the exploration of influence channels is that if β1 in model (3) is significant, carbon trading policies can affect corporate financing constraints, and vice versa. In the case where β1 in model (3) is significant, if α1 and α2 in model (4) are significant, and α1 is significantly closer to 0 than β1 in model (1), then the financing constraint is the channel through which carbon trading policy affects the company financialization, and vice versa.
SAi,t = β0 + β1Treati × Postt + β2Controlsi + μj + γc + θt + εi,t,j,c
Fini,t = α0 + α1Treati × Postt +α2SA + α3Controlsi + μj + γc + θt + εi,t,j,c
The regression results are shown in Table 6. All columns include control variables and fixed effects. Column (1), (2) and (3) show the results of model (1), (3) and (4), respectively. The significant negative coefficient of Treati × Postt in column (2) indicates that the carbon trading policy eases the level of corporate financing constraints. The coefficient of SAi,t in column (3) is significantly positive while Treati × Postt is significantly negative and lower than the coefficient in the column (1), showing that carbon trading policies curb financialization of non-financial firms by alleviating corporate financing constraints.
6. Heterogeneity Analysis
Given that we find that carbon trading policy reduces the financialization of non-financial companies by easing financing constraints in the previous sections, do carbon trading policies have the same impact on companies with different characteristics? To address this issue, we explore the influence of heterogeneity on the inhibitory effect of carbon trading policy on enterprises with differences between the ownership structure, geographical locations and industry characteristics.
6.1. Ownership Heterogeneity
Company ownership has an impact on the financialization degree of the companies [36]. Therefore, we explore the ownership heterogeneity impact on the inhibition effect of carbon trading policy.
We divide the full sample into state-owned enterprises (SOE) and non-state-owned enterprises (non SOE), which respectively include 11,194 observations and 17,406 observations, and reproduce the regression of model (1). Table 7 shows the results of ownership heterogeneity. The results of SOE and non SOE are presented in column (1) and (2), respectively. From the results, the carbon trading policy only decrease the financialization of non-state non-financial enterprises.
The reasons of state-owned enterprises and non-state-owned enterprises choosing different financial asset holding strategies while facing carbon trading policies may be as follows. First, the natural political connection between state-owned enterprises and the government makes the it become the guarantor of state-owned enterprises. When non-financial state-owned enterprises are in financial distress due to lower profits, the government can help them get out of it by granting subsidies. Moreover, the connection between the government and the bank reduces the difficulty of financing for state-owned enterprises. Second, preventing major financial risks is one of the main strategies of the Chinese government. As a stable of area economic development and employment, state-owned enterprises may not be allowed to hold large amounts financial assets with high risks by government. Both of the above points may cause state-owned enterprises to maintain a low level of financialization before the carbon trading policies, thereby being not sensitive to the inhibitory effects of it. However, non-state-owned enterprises turn to holding more financial assets in order to survive in the context of the downturn in the entities economy leading they are more significantly affected by carbon trading policies.
6.2. Regional Heterogeneity
China is a large country with varying development levels of regional economic. Differences in regional macroeconomic factors can affect the company’s operating conditions, thereby changing their financial investment decisions [39]. Hence, we verify whether regional heterogeneity affects the effectiveness of carbon trading policies.
Based on the location of the company, we divide the total sample into two sub-samples of companies located in the east and central and western regions’ companies, and perform model (1) on them. Table 8 shows the results of regional heterogeneity. Column (1) and (2) show the results of Eastern region firms and central and western regions ones, respectively. From the results, the carbon trading policy only decrease the financialization of eastern region non-financial firms.
The reasons for this situation may be that, the rapid economic development in the eastern China results in a high-density distribution of firms, which increases the pressure of competition and financing difficulties in the east region. As a result, non-financial companies in the eastern region have to hold more financial assets under the dual pressure of competition and market shrinkage before the carbon trading policy, which makes they be sensitive to reduced financing constraints and additional benefits brought about by the carbon trading policy. However, for central and western regions’ companies, on the one hand, the low level of firms overlap makes the companies less competition pressure. On the other hand, the Chinese government has given more support policies to the central and western regions in order to achieve the strategic goal of common prosperity, which can reduce the difficulty of financing for enterprises in the central and western regions. Hence, low competition and relatively sufficient funds make companies in the central and western regions are not sensitive to direct or indirect benefit from carbon trading policies.
6.3. Industry Competition Heterogeneity
In this section, we verify the impact of industry competition on the effect of carbon trading policies. According the view of Rhoades [40] and Tingvall and Poldahl [41], this paper use Herfindahl index to measure the level of industry competition. We compute the average Herfindahl index of each industry from the sample start to ETS pilots trading launching based on total assets, and classifies the industries whose average Herfindahl index below the median as highly competitive industries, others are set as industries with less competition. Referring to the 2012 edition of the China Securities Regulatory Commission industry classification, we the divide the total sample into two sub-samples of companies in highly competitive industries and firms in non-high competition industries. Table 9 shows the results of industry competition heterogeneity. Column (1) and (2) show the results of high competition industry firms and non-high competition industry firms, respectively.
Through the results, we find that the carbon trading policy only decrease the financialization of high competition non-financial firms. The plausible explanation is that in industries with low market competition, most companies have a certain degree of monopoly, which may make them have sufficient market control thereby reducing the pressures of financing and operating. In addition, industries with low market competition are mostly occupied by state-owned enterprises, whose close relationship with the government lead them not sensitive to the extra benefits caused by carbon trading policy. However, for companies in industries with a high degree of market competition, their investment decisions react more strongly to the extra benefits.
7. Conclusion
Reducing carbon emission plays an important role in alleviating global warming. At the same time, the trend of financialization of China's non-financial enterprises intensified. Nevertheless, the neglecting of the contradictions between environmental regulations and financialization in existing research leads the impact of carbon trading policy on financialization of non-financial firms unclear. Therefore, taking China emission trading scheme pilots as a quasi-natural experiment, we use the difference-in-differences model to study the impact of carbon trading policy on financialization of non-financial companies, which can effectively identify the causal relationship between carbon trading policies and corporate financialization and eliminate the influence of non-result related factors. In doing so, we expand the research of carbon trading policy influence on micro-company level and the influence factor of corporate financialization. In addition, our research results provide a policy reference for reduce the corporate financialization in emerging markets under low-carbon transition.
According to our results, carbon trading policy can effectively restrain the financialization of non-financial enterprises through reducing firms’ financing constraints. In parallel trend test, we find that the inhibition effect of ETS pilot on corporate financialization consistently remains significant. Our findings show robust validity even when (1) extending the DID model to a PSM-DID model to get a more appropriate control group and (2) using the placebo test to verify possible results bias. Finally, we conduct a cross-sectional test in terms of company ownership, company location and industry competition and find that carbon trading policy have a more significant mitigation on the financialization of (1) non-state-owned enterprise (2) eastern region companies (3) highly competitive industry firms.
In summary, emerging economies can achieve a win-win situation for low-carbon transition and stable economic development through carbon trading policies.
Author Contributions
Conceptualization, W.M. and X.Y.; methodology, W.M.; software, W.M. and X.Y.; validation, X.Y.; formal analysis, X.Y.; resources, W.M.; data curation, W.M.; writing—original draft preparation, W.M. and X.Y.; writing—review and editing, X.Y.; visualization, W.M. and X.Y.; supervision, X.Y. All authors have read and agreed to the published version of the manuscript.
Funding
This research received no external funding.
Institutional Review Board Statement
Not applicable.
Informed Consent Statement
Not applicable.
Data Availability Statement
The datasets used and/or analyzed during the current study are available from the corresponding author upon reasonable request.
Acknowledgments
We appreciate the insightful comments and suggestions of seminar participants at Wuhan University and Zhongnan University of Economics and Law. All errors and omissions are our own.
Conflicts of Interest
The authors declare no conflict of interest.
Appendix A

Table A1.
Variable definitions.
| Variable | Definitions |
|---|---|
| Fin | The degree of corporate financialization measured by the ratio of financial assets to total assets, higher of which means that companies are more inclined to invest in financial assets |
| Treat | Dummy variable, Treat equals 1 if the firm is in the industries actually covered by the ETS pilots area, and 0 otherwise |
| Post | Dummy variable, Post equals 1 if year is greater or equal to 2014, which is the starting year of trading in all ETS pilot, and 0 otherwise. |
| Growth | The growth rate of the company’s main business |
| LnAge | The natural logarithm of company age |
| Rid | The ratio of the number of independent directors to the board directors |
| SS | The number of the supervisory board |
| ROA | Return on assets equals to net profits divided by total assets |
| Lev | Total debt divided by total assets |
| LnSize | The natural logarithm of total assets |
Table A2.
Test of covariate balancing in nearest-neighbour matching method.
| Mean | T-test | ||||||
|---|---|---|---|---|---|---|---|
| Variable | Treated | Control | %bias | %reduct bias |
t | p > t | |
| ROA | Unmatched | 0.038 | 0.035 | 3.9 | 68.3 | 2.08 | 0.037 |
| matched | 0.038 | 0.037 | 1.2 | 0.52 | 0.605 | ||
| LnSize | Unmatched | 22.290 | 22.021 | 19.9 | 94.0 | 11.84 | 0.000 |
| matched | 22.279 | 22.295 | -1.2 | -0.48 | 0.634 | ||
| Lev | Unmatched | 0.422 | 0.428 | -3.0 | -20.3 | -1.62 | 0.106 |
| matched | 0.422 | 0.429 | -3.6 | -1.48 | 0.139 | ||
| LnAge | Unmatched | 2.696 | 2.761 | -16.2 | 97.8 | -9.28 | 0.000 |
| matched | 2.701 | 2.699 | 0.4 | 0.14 | 0.888 | ||
| SS | Unmatched | 4.383 | 4.473 | -4.3 | 83.7 | -2.30 | 0.021 |
| matched | 4.388 | 4.402 | -0.7 | -0.30 | 0.766 | ||
| Rid | Unmatched | 0.394 | 0.387 | 6.3 | 92.9 | 3.47 | 0.001 |
| matched | 0.393 | 0.394 | -0.4 | -0.19 | 0.851 | ||
| Growth | Unmatched | 0.177 | 0.172 | 1.1 | -18.4 | 0.60 | 0.547 |
| matched | 0.177 | 0.171 | 1.3 | 0.56 | 0.575 | ||
References
- Bolton, P.; Kacperczyk, M. Do investors care about carbon risk? J. Financ. Econ. 2021, 142, 517–549. [Google Scholar] [CrossRef]
- Ilhan, E.; Sautner, Z.; Vilkov, G. Carbon tail risk. Rev. Financ. Stud. 2021, 34, 1540–1571. [Google Scholar] [CrossRef]
- Rogelj, J.; Den Elzen, M.; Höhne, N.; Fransen, T.; Fekete, H.; Winkler, H.; Schaeffer, R.; Sha, F.; Riahi, K.; Meinshausen, M. Paris Agreement climate proposals need a boost to keep warming well below 2 °C. Nature. 2016, 534, 631–639. [Google Scholar] [CrossRef] [PubMed]
- Chen, Z.; Zhang, X.; Chen, F. Do carbon emission trading schemes stimulate green innovation in enterprises? Evidence from China. Technol. Forecast. Soc. Change. 2021, 168, 120744. [Google Scholar] [CrossRef]
- Gao, S.; Wang, C. How to design emission trading scheme to promote corporate low-carbon technological innovation: Evidence from China. J. Clean. Prod. 2021, 298, 126712. [Google Scholar] [CrossRef]
- Qi, SZ.; Zhou, CB.; Li, K.; Tang, S.Y. Influence of a pilot carbon trading policy on enterprises’ low-carbon innovation in China. Clim. Policy. 2021, 21, 318–336. [Google Scholar] [CrossRef]
- Wen, F.; Wu, N.; Gong, X. China's carbon emissions trading and stock returns. Energy Econ. 2020, 86, 104627. [Google Scholar] [CrossRef]
- Orhangazi, Ö. Financialisation and capital accumulation in the non-financial corporate sector: A theoretical and empirical investigation on the US economy: 1973–2003. Cambridge J. Reg. Econ. Soc. 2008, 32, 863–886. [Google Scholar] [CrossRef]
- Wang, J.; Mao, N. Does Financialization of Non-Financial Corporations Promote or Prohibit Corporate Risk-Taking? Emerg. Mark. Finance Trade. 2022, 58, 1913–1924. [Google Scholar] [CrossRef]
- Tobin, J. Money and economic growth. Econom J. 1965, 671–684. [Google Scholar] [CrossRef]
- Xu, X.; Xuan, C. A study on the motivation of financialization in emerging markets: The case of Chinese nonfinancial corporations. Int. Rev. Econ. Finance. 2021, 72, 606–623. [Google Scholar] [CrossRef]
- Palmer, K.; Oates, W.E.; Portney, P.R. Tightening environmental standards: the benefit-cost or the no-cost paradigm? J Econ Perspect. 1995, 9, 119–132. [Google Scholar] [CrossRef]
- Liu, F.; Kang, Y.; Guo, K.; Sun, X. The relationship between air pollution, investor attention and stock prices: evidence from new energy and polluting sectors. Energy Policy. 2021, 156, 112430. [Google Scholar] [CrossRef]
- Li, D.; Huang, M.; Ren, S.; Chen, X.; Ning, L. Environmental legitimacy, green innovation, and corporate carbon disclosure: Evidence from CDP China 100. J. Bus. Ethics. 2018, 150, 1089–1104. [Google Scholar] [CrossRef]
- Akkemik, K.A.; Özen, Ş. Macroeconomic and institutional determinants of financialisation of non-financial firms: Case study of Turkey. Socioecon Rev. 2014, 12, 71–98. [Google Scholar] [CrossRef]
- Crippa, M.; Guizzardi, D.; Muntean, M.; Schaaf, E.; Monforti-Ferrario, F.; Banja, M.; Oliver, JG.; Grassi, G.; Rossi, S.; Vignati, E. GHG emissions of all world countries–2021 Report, Publications Office of the European Union, LU.
- Jiang, J.; Xie, D.; Ye, B.; Shen, B.; Chen, Z. Research on China’s cap-and-trade carbon emission trading scheme: Overview and outlook. Appl. Energy. 2016, 178, 902–917. [Google Scholar] [CrossRef]
- Zhao, X.; Zhao, Y.; Zeng, S.; Zhang, S. Corporate behavior and competitiveness: impact of environmental regulation on Chinese firms. J. Clean. Prod. 2015, 86, 311–322. [Google Scholar] [CrossRef]
- Stulz, R. M. Rethinking risk management. J. Applied. Corp. Finance, 1996, 9, 8–25. [Google Scholar] [CrossRef]
- Tang, H.; Zhang, C. Investment risk, return gap, and financialization of non-listed non-financial firms in China⁎. Pacific Basin Finance J. 2019, 58, 101213. [Google Scholar] [CrossRef]
- Crotty, J. The neoliberal paradox: The impact of destructive product market competition and impatient finance on nonfinancial corporations in the neoliberal era. Rev Radic Polit Econ. 2003, 35, 271–9. [Google Scholar] [CrossRef]
- Duménil, G.; Lévy, D. The real and financial components of profitability (United States, 1952–2000). Rev Radic Polit Econ. 2004, 36, 82–110. [Google Scholar] [CrossRef]
- Cai, W.; Ye, P. How does environmental regulation influence enterprises’ total factor productivity? A quasi-natural experiment based on China’s new environmental protection law. J. Clean. Prod. 2020, 276, 124105. [Google Scholar] [CrossRef]
- Liu, X.; Wang, E.; Cai, D. Environmental regulation and corporate financing—quasi-natural experiment evidence from China. Sustainability. 2018, 10, 4028. [Google Scholar] [CrossRef]
- Iraldo, F.; Testa, F.; Melis, M.; Frey, M. A literature review on the links between environmental regulation and competitiveness. Environ. Policy Gov. 2011, 21, 210–22. [Google Scholar] [CrossRef]
- Jiang, Z.; Wang, Z.; Li, Z. The effect of mandatory environmental regulation on innovation performance: Evidence from China. J. Clean. Prod. 2018, 203, 482–91. [Google Scholar] [CrossRef]
- Ford, J.A.; Steen, J.; Verreynne, M.L. How environmental regulations affect innovation in the Australian oil and gas industry: going beyond the Porter Hypothesis. J. Clean. Prod. 2014, 84, 204–13. [Google Scholar] [CrossRef]
- Garen, J.E. Executive compensation and principal-agent theory. J. Political Econ. 1994, 102, 1175–99. [Google Scholar] [CrossRef]
- Tian, M.; Xu, G.; Zhang, L. Does environmental inspection led by central government undermine Chinese heavy-polluting firms’ stock value? The buffer role of political connection. J. Clean. Prod. 2019, 236, 117695. [Google Scholar] [CrossRef]
- Thakur, B.P.; Kannadhasan, M. Corruption and cash holdings: Evidence from emerging market economies. Emerg. Mark. Rev. 2019, 38, 1–7. [Google Scholar] [CrossRef]
- Li, H.; Graham, D.J.; Majumdar, A. The effects of congestion charging on road traffic casualties: A causal analysis using difference-in-difference estimation. Accid Anal Prev. 2012, 49, 366–77. [Google Scholar] [CrossRef]
- Tang, K.; Qiu, Y.; Zhou, D. Does command-and-control regulation promote green innovation performance? Evidence from China's industrial enterprises. Sci. Total Environ. 2020, 712, 136362. [Google Scholar] [CrossRef] [PubMed]
- Liu, B. , Sun, Z., Li, H. Can carbon trading policies promote regional green innovation efficiency? Empirical data from pilot regions in China. Sustainability. 2021, 13, 2891. [Google Scholar] [CrossRef]
- Zhang, H.; Duan, M. China's pilot emissions trading schemes and competitiveness: an empirical analysis of the provincial industrial sub-sectors. J. Environ. Manage. 2020, 258, 109997. [Google Scholar] [CrossRef] [PubMed]
- Duchin, R. Cash holdings and corporate diversification. J Finance. 2010, 65, 955–92. [Google Scholar] [CrossRef]
- Feng, Y.; Yao, S; Wang, C. ; Liao, J.; Cheng, F. Diversification and financialization of non-financial corporations: Evidence from China. Emerg. Mark. Rev. 2022, 50, 100834. [Google Scholar] [CrossRef]
- Liu, C.; Kong, D. Business strategy and sustainable development: Evidence from China. Bus Strategy Environ. 2021, 30, 657–70. [Google Scholar] [CrossRef]
- Caliendo, M.; Kopeinig, S. Some practical guidance for the implementation of propensity score matching. J Econ Surv. 2008, 22, 31–72. [Google Scholar] [CrossRef]
- Gulen, H.; Ion, M. Policy uncertainty and corporate investment. Rev Financ Stud. 2016, 29, 523–564. [Google Scholar] [CrossRef]
- Rhoades, S. A. The herfindahl-hirschman index. Fed. Res. Bull., 1993, 79, 188. [Google Scholar]
- Tingvall, P.G. , Poldahl, A. Is there really an inverted U-shaped relation between competition and R&D? Econ. Inn. New Tech. 2006, 15, 101–18. [Google Scholar]
Figure 1.
The pilot areas and covered industries. Note. Figure 1 shows China emission trading scheme (ETS) pilots in 7 provinces and cities with industries covered by each pilot.
Figure 1.
The pilot areas and covered industries. Note. Figure 1 shows China emission trading scheme (ETS) pilots in 7 provinces and cities with industries covered by each pilot.
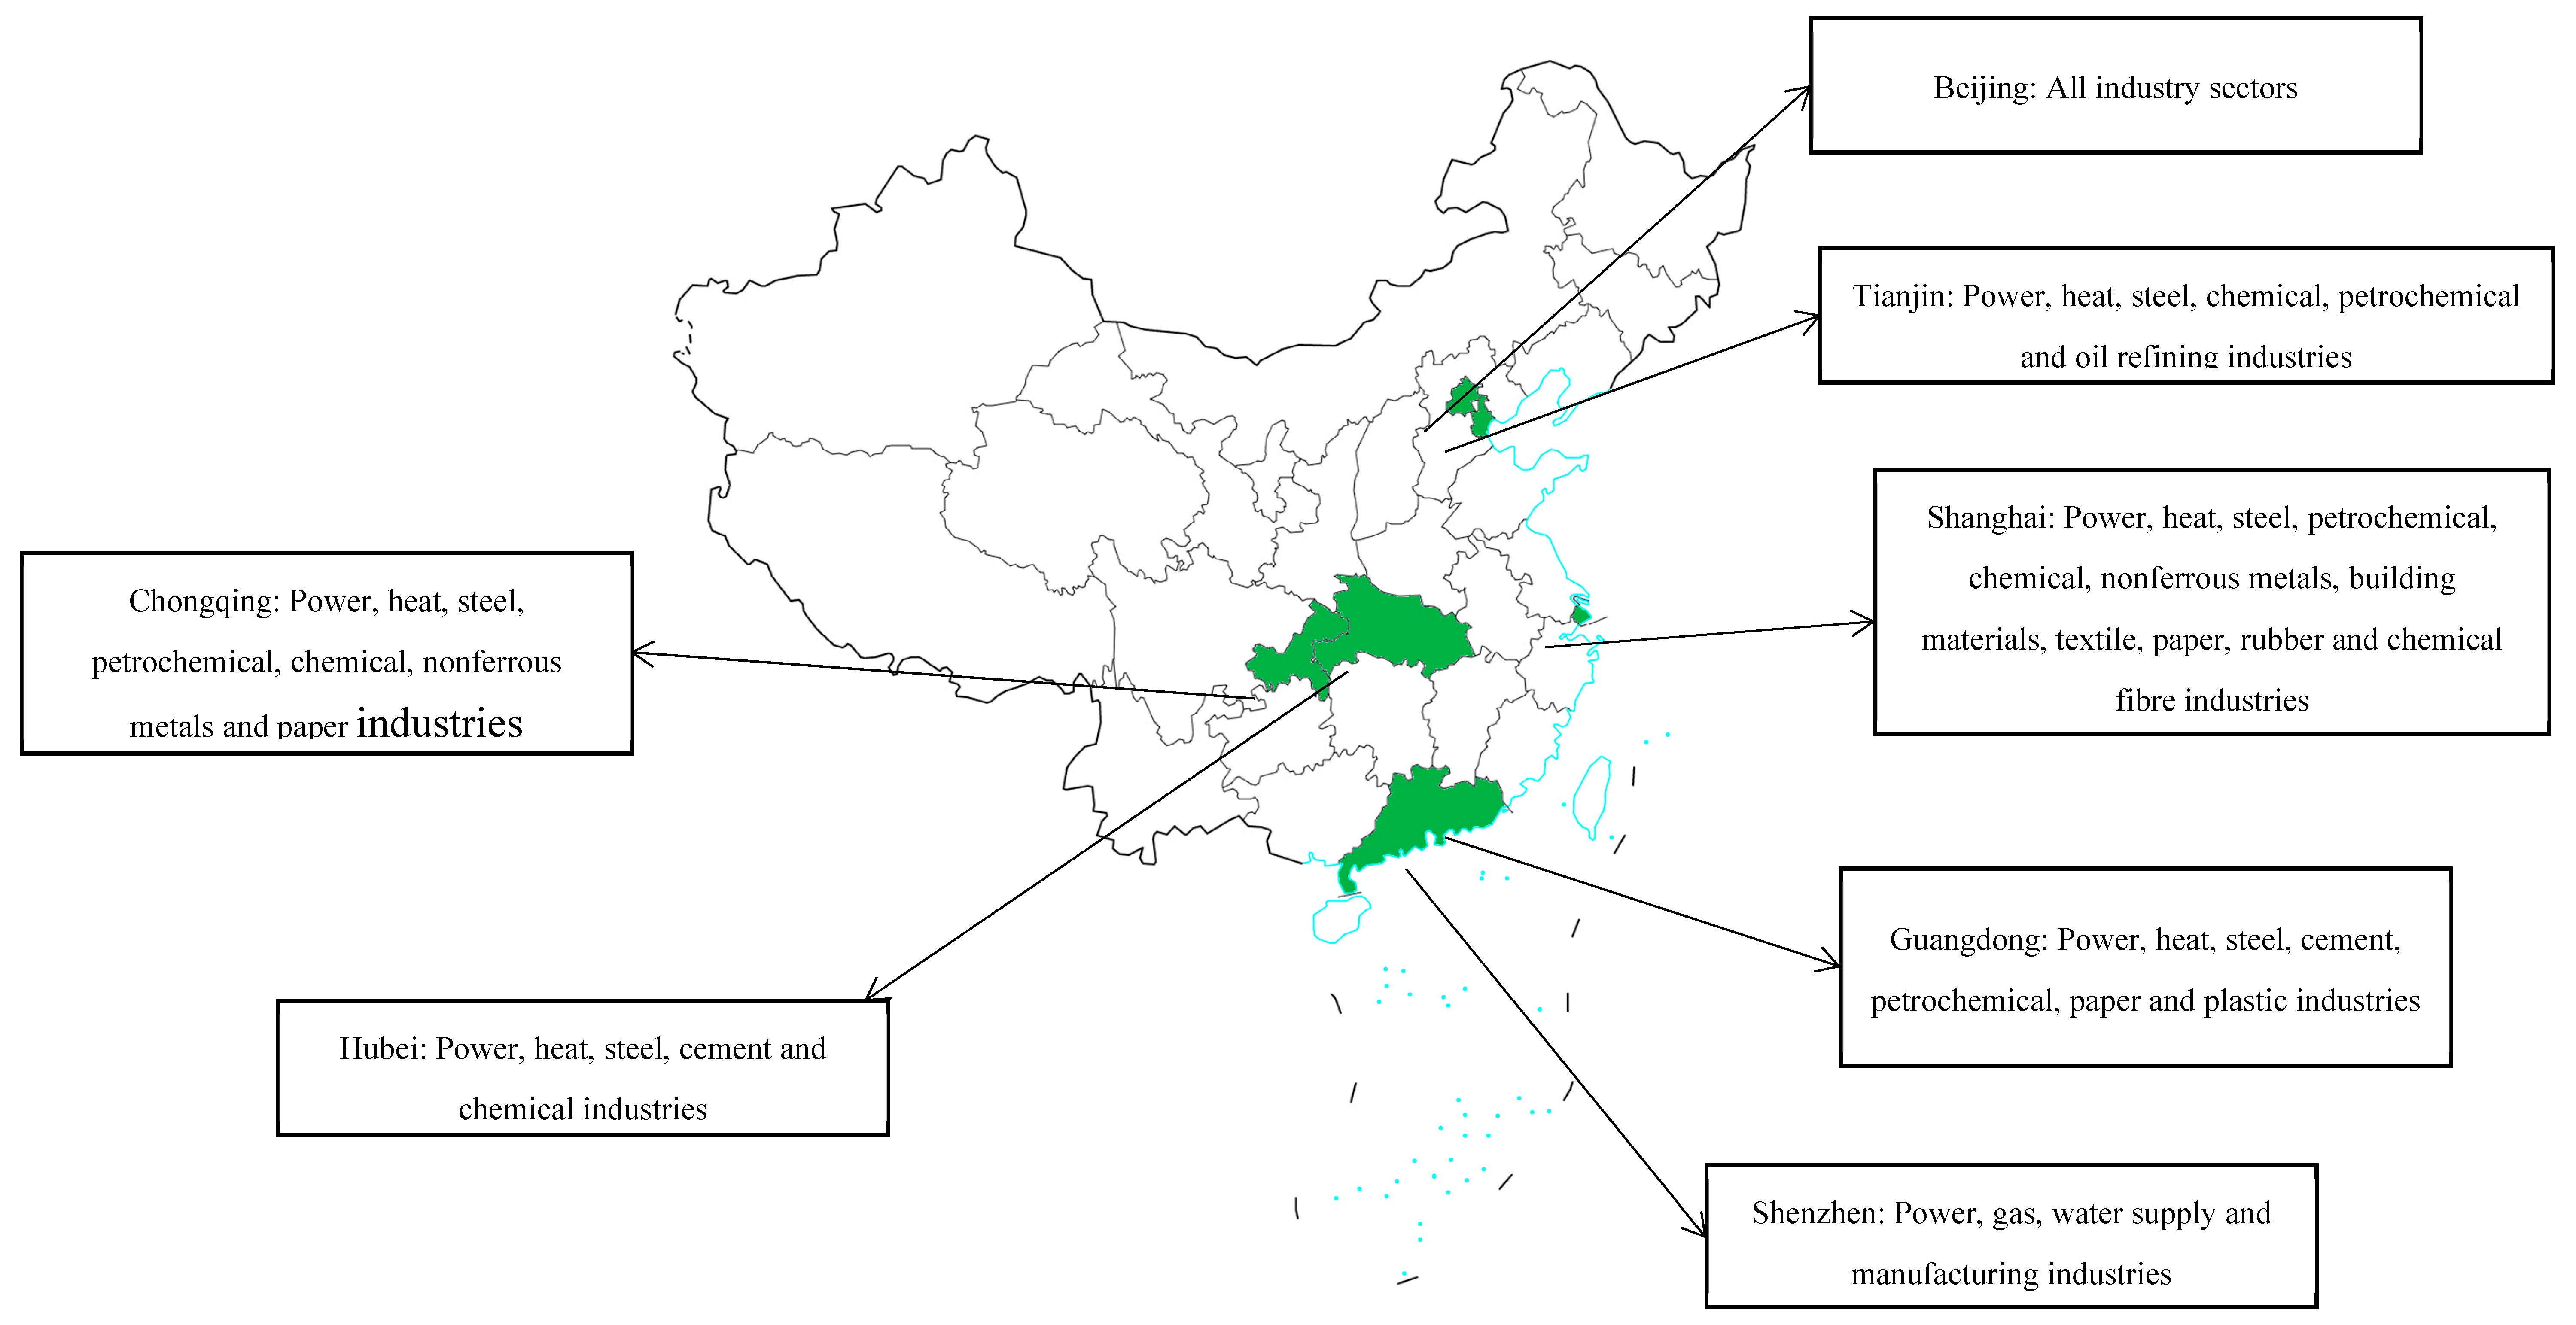
Table 1.
Descriptive statistics.
| Variables | Mean | Std. Dev. | Min. | Q1 | Median | Q3 | Max. | N |
|---|---|---|---|---|---|---|---|---|
| Fin | 0.036 | 0.080 | 0.000 | 0.000 | 0.006 | 0.034 | 0.981 | 28,600 |
| Treat | 0.120 | 0.325 | 0.000 | 0.000 | 0.000 | 0.000 | 1.000 | 28,600 |
| Post | 0.661 | 0.473 | 0.000 | 0.000 | 1.000 | 1.000 | 1.000 | 28,600 |
| ROA | 0.036 | 0.069 | -0.316 | 0.013 | 0.037 | 0.067 | 0.206 | 28,600 |
| LnSize | 22.053 | 1.254 | 19.482 | 21.154 | 21.900 | 22.782 | 25.805 | 28,600 |
| Lev | 0.427 | 0.207 | 0.053 | 0.265 | 0.419 | 0.578 | 0.978 | 28,600 |
| LnAge | 2.754 | 0.386 | 1.386 | 2.565 | 2.833 | 3.045 | 3.434 | 28,600 |
| SS | 4.462 | 2.145 | 2.000 | 3.000 | 4.000 | 5.000 | 15.000 | 28,600 |
| Rid | 0.388 | 0.100 | 0.000 | 0.333 | 0.375 | 0.444 | 0.667 | 28,600 |
| Growth | 0.172 | 0.446 | -0.597 | -0.029 | 0.103 | 0.262 | 2.967 | 28,600 |
Table 2.
Pilot carbon trading policy and corporate financialization.
| Variables | (1) | (2) |
|---|---|---|
| Fin | Fin | |
| Treat × Post |
-0.006*** | -0.005** |
| (0.002) | (0.002) | |
| ROA |
-0.003 | |
| (0.007) | ||
| LnSize |
-0.001** | |
| (0.000) | ||
| Lev |
-0.042*** | |
| (0.003) | ||
| LnAge |
0.024*** | |
| (0.001) | ||
| SS |
-0.001** | |
| (0.000) | ||
| Rid |
0.003 | |
| (0.005) | ||
| Growth | -0.001 | |
| (0.001) | ||
| Year fixed effect | Yes | Yes |
| Industry fixed effect | Yes | Yes |
| City fixed effect | Yes | Yes |
| Adj.R2 | 0.138 | 0.154 |
| Observations | 28,600 | 28,600 |
Note. This table shows the impact of pilot carbon trading policy on corporate financialization. Column (2) adds control variables to the column (1). Fin represents degree of corporate financialization, higher of which means that companies are more inclined to invest in financial assets. Treat is a dummy variable, which equals 1 if the firm is in in the industries actually covered by the ETS pilots area, and 0 otherwise. Post is a dummy variable, which equals 1 if year is greater or equal to 2014, which is the starting year of trading in all ETS pilot, and 0 otherwise. Control variable: (1) LnAge represents the natural logarithm of company age. (2) Rid represents the ratio of the number of independent directors to the board directors. (3) SS is the number of the supervisory board. (4) ROA is the return on assets, which equals to net profits divided by total assets. (5) Lev represents the total debt divided by total assets. (6) LnSize represents the natural logarithm of total assets. (7) Growth represents the growth rate of the company's main business. Cluster robust standard errors are in parentheses. *, **, *** indicates significant at 10%, 5%, 1% level, respectively.
Table 3.
Pilot carbon trading policy and corporate financialization: parallel trend test.
| Variables | (1) | (2) |
|---|---|---|
| Fin | Fin | |
| Pre3+ |
-0.003 | -0.002 |
| (0.004) | (0.004) | |
| Pre3 |
-0.007 | -0.005 |
| (0.006) | (0.006) | |
| Pre2 |
-0.007 | -0.006 |
| (0.005) | (0.005) | |
| Pre1 |
-0.008 | -0.007 |
| (0.005) | (0.005) | |
| Implementation |
-0.009* | -0.008 |
| (0.005) | (0.005) | |
| Post1 |
-0.010* | -0.009* |
| (0.005) | (0.005) | |
| Post2 |
-0.011** | -0.010** |
| (0.005) | (0.005) | |
| Post3 |
-0.009* | -0.008* |
| (0.005) | (0.005) | |
| Post3+ | -0.006* | -0.005* |
| (0.003) | (0.003) | |
| Controls | No | Yes |
| Year fixed effect | Yes | Yes |
| Industry fixed effect | Yes | Yes |
| City fixed effect | Yes | Yes |
| Adj.R2 | 0.138 | 0.154 |
| Observations | 28,600 | 28,600 |
Note. This table shows the parallel trend test on the impact of pilot carbon trading policy on corporate financialization. Column (2) adds control variables to the column (1). Fin represents degree of corporate financialization, higher of which means that companies are more inclined to invest in financial assets. Pre3+, Pre2, Pre1, Implementation, Post1, Post2, Post3+ are the multiplying item of the dummy variable Treat and the dummy variable of the corresponding year. Control variable: (1) LnAge represents the natural logarithm of company age. (2) Rid represents the ratio of the number of independent directors to the board directors. (3) SS is the number of the supervisory board. (4) ROA is the return on assets, which equals to net profits divided by total assets. (5) Lev represents the total debt divided by total assets. (6) LnSize represents the natural logarithm of total assets. (7) Growth represents the growth rate of the company's main business. Cluster robust standard errors are in parentheses. *, **, *** indicates significant at 10%, 5%, 1% level, respectively.
Table 4.
Pilot carbon trading policy and corporate financialization: placebo test.
| Variables | (1) | (2) | (3) |
|---|---|---|---|
| Fin | Fin | Fin | |
| Dummy treat1 × Post |
0.001 | ||
| (0.002) | |||
| Dummy treat2 × Post |
0.002 | ||
| (0.002) | |||
| Dummy treat3 × Post |
-0.001 | ||
| (0.002) | |||
| Controls | Yes | Yes | Yes |
| Year fixed effect | Yes | Yes | Yes |
| Industry fixed effect | Yes | Yes | Yes |
| City fixed effect | Yes | Yes | Yes |
| Adj.R2 | 0.154 | 0.154 | 0.154 |
| Observations | 28,600 | 28,600 | 28,600 |
Note. This table shows the placebo test on impact of pilot carbon trading policy on corporate financialization. Column (1), (2) and (3) show the results of Dummy treat1, Dummy treat2 and Dummy treat3, respectively. Fin represents degree of corporate financialization, higher of which means that companies are more inclined to invest in financial assets. Dummy treat is a dummy variable, which equals 1 if companies belong to the experimental group obtained by random sampling, and 0 otherwise. Post is a dummy variable, which equals 1 if year is greater or equal to 2014, which is the starting year of trading in all ETS pilot, and 0 otherwise. Control variable: (1) LnAge represents the natural logarithm of company age. (2) Rid represents the ratio of the number of independent directors to the board directors. (3) SS is the number of the supervisory board. (4) ROA is the return on assets, which equals to net profits divided by total assets. (5) Lev represents the total debt divided by total assets. (6) LnSize represents the natural logarithm of total assets. (7) Growth represents the growth rate of the company's main business. Cluster robust standard errors are in parentheses. *, **, *** indicates significant at 10%, 5%, 1% level, respectively.
Table 5.
Pilot carbon trading policy and corporate financialization: PSM-DID.
| Variables | (1) | (2) |
|---|---|---|
| Fin | Fin | |
| Treat × Post |
-0.005** | -0.006** |
| (0.002) | (0.002) | |
| Controls | No | Yes |
| Year fixed effect | Yes | Yes |
| Industry fixed effect | Yes | Yes |
| City fixed effect | Yes | Yes |
| Adj.R2 | 0.126 | 0.137 |
| Observations | 13,519 | 13,519 |
Note. This table shows the impact of pilot carbon trading policy on corporate financialization by PSM-DID. Column (2) adds control variables to the column (1). Fin represents degree of corporate financialization, higher of which means that companies are more inclined to invest in financial assets. Treat is a dummy variable, which equals 1 if the firm is in in the industries actually covered by the ETS pilots area, and 0 otherwise. Post is a dummy variable, which equals 1 if year is greater or equal to 2014, which is the starting year of trading in all ETS pilot, and 0 otherwise. Control variable: (1) LnAge represents the natural logarithm of company age. (2) Rid represents the ratio of the number of independent directors to the board directors. (3) SS is the number of the supervisory board. (4) ROA is the return on assets, which equals to net profits divided by total assets. (5) Lev represents the total debt divided by total assets. (6) LnSize represents the natural logarithm of total assets. (7) Growth represents the growth rate of the company's main business. Cluster robust standard errors are in parentheses. *, **, *** indicates significant at 10%, 5%, 1% level, respectively.
Table 6.
Influence channel of pilot carbon trading policy.
| Variables | (1) | (2) | (3) |
|---|---|---|---|
| Fin | SA | Fin | |
| SA index |
0.0320*** | ||
| (0.0020) | |||
| Treat × Post |
-0.0053** | -0.0114* | -0.0049** |
| (0.0021) | (0.0064) | (0.0021) | |
| Controls | Yes | Yes | Yes |
| Year fixed effect | Yes | Yes | Yes |
| Industry fixed effect | Yes | Yes | Yes |
| City fixed effect | Yes | Yes | Yes |
| Adj.R2 | 0.1543 | 0.4517 | 0.1622 |
| Observations | 28,600 | 28,600 | 28,600 |
Note. This table shows the influence channel of pilot carbon trading policy on corporate financialization. Column (1) show the influence of pilot carbon trading policy on financialization. Column (2) show the impact of pilot carbon trading policy on firm financing constraints. Column (3) show the effect of pilot carbon trading policy and firm financing constraints on corporate financialization. Fin represents degree of corporate financialization, higher of which means that companies are more inclined to invest in financial assets. SA index shows the degree of corporate financing constraints. Treat is a dummy variable, which equals 1 if the firm is in in the industries actually covered by the ETS pilots area, and 0 otherwise. Post is a dummy variable, which equals 1 if year is greater or equal to 2014, which is the starting year of trading in all ETS pilot, and 0 otherwise. Control variable: (1) LnAge represents the natural logarithm of company age. (2) Rid represents the ratio of the number of independent directors to the board directors. (3) SS is the number of the supervisory board. (4) ROA is the return on assets, which equals to net profits divided by total assets. (5) Lev represents the total debt divided by total assets. (6) LnSize represents the natural logarithm of total assets. (7) Growth represents the growth rate of the company's main business. Cluster robust standard errors are in parentheses. *, **, *** indicates significant at 10%, 5%, 1% level, respectively.
Table 7.
Pilot carbon trading policy and corporate financialization: ownership heterogeneity.
| Variables | (1) | (2) |
|---|---|---|
| SOE | Non-SOE | |
| Fin | Fin | |
| Treat × Post | -0.001 | -0.007** |
| (0.003) | (0.003) | |
| Controls | Yes | Yes |
| Year fixed effect | Yes | Yes |
| Industry fixed effect | Yes | Yes |
| City fixed effect | Yes | Yes |
| Adj.R2 | 0.340 | 0.139 |
| Observations | 11,194 | 17,406 |
Note. This table shows the ownership heterogeneity of pilot carbon trading policy on corporate financialization. Column (1) and (2) show the results of state-owned enterprise and non-state-owned enterprise, respectively. Fin represents degree of corporate financialization, higher of which means that companies are more inclined to invest in financial assets. Treat is a dummy variable, which equals 1 if the firm is in in the industries actually covered by the ETS pilots area, and 0 otherwise. Post is a dummy variable, which equals 1 if year is greater or equal to 2014, which is the starting year of trading in all ETS pilot, and 0 otherwise. Control variable: (1) LnAge represents the natural logarithm of company age. (2) Rid represents the ratio of the number of independent directors to the board directors. (3) SS is the number of the supervisory board. (4) ROA is the return on assets, which equals to net profits divided by total assets. (5) Lev represents the total debt divided by total assets. (6) LnSize represents the natural logarithm of total assets. (7) Growth represents the growth rate of the company's main business. Cluster robust standard errors are in parentheses. *, **, *** indicates significant at 10%, 5%, 1% level, respectively.
Table 8.
Pilot carbon trading policy and corporate financialization: regional heterogeneity.
| Variables | (1) | (2) |
|---|---|---|
| Eastern region | Central and western regions | |
| Fin | Fin | |
| Treat × Post | -0.004* | -0.007 |
| (0.002) | (0.006) | |
| Controls | Yes | Yes |
| Year fixed effect | Yes | Yes |
| Industry fixed effect | Yes | Yes |
| City fixed effect | Yes | Yes |
| Adj.R2 | 0.162 | 0.154 |
| Observations | 19,773 | 8,827 |
Note. This table shows the regional heterogeneity of pilot carbon trading policy on corporate financialization. Column (1) and (2) show the results of eastern region and central and western regions, respectively. Fin represents degree of corporate financialization, higher of which means that companies are more inclined to invest in financial assets. Treat is a dummy variable, which equals 1 if the firm is in in the industries actually covered by the ETS pilots area, and 0 otherwise. Post is a dummy variable, which equals 1 if year is greater or equal to 2014, which is the starting year of trading in all ETS pilot, and 0 otherwise. Control variable: (1) LnAge represents the natural logarithm of company age. (2) Rid represents the ratio of the number of independent directors to the board directors. (3) SS is the number of the supervisory board. (4) ROA is the return on assets, which equals to net profits divided by total assets. (5) Lev represents the total debt divided by total assets. (6) LnSize represents the natural logarithm of total assets. (7) Growth represents the growth rate of the company's main business. Cluster robust standard errors are in parentheses. *, **, *** indicates significant at 10%, 5%, 1% level, respectively.
Table 9.
Pilot carbon trading policy and corporate financialization: industry competition heterogeneity.
Table 9.
Pilot carbon trading policy and corporate financialization: industry competition heterogeneity.
| Variables | (1) | (2) |
|---|---|---|
| High competition | Non-high competition | |
| Fin | Fin | |
| Treat × Post | -0.004* | -0.017 |
| (0.002) | (0.010) | |
| Controls | Yes | Yes |
| Year fixed effect | Yes | Yes |
| Industry fixed effect | Yes | Yes |
| City fixed effect | Yes | Yes |
| Adj.R2 | 0.139 | 0.255 |
| Observations | 24,911 | 3,617 |
Note. his table shows the industry heterogeneity of pilot carbon trading policy on corporate financialization. Column (1) and (2) show the results of high competition industry and non-high competition industry, respectively. Fin represents degree of corporate financialization, higher of which means that companies are more inclined to invest in financial assets. Treat is a dummy variable, which equals 1 if the firm is in in the industries actually covered by the ETS pilots area, and 0 otherwise. Post is a dummy variable, which equals 1 if year is greater or equal to 2014, which is the starting year of trading in all ETS pilot, and 0 otherwise. Control variable: (1) LnAge represents the natural logarithm of company age. (2) Rid represents the ratio of the number of independent directors to the board directors. (3) SS is the number of the supervisory board. (4) ROA is the return on assets, which equals to net profits divided by total assets. (5) Lev represents the total debt divided by total assets. (6) LnSize represents the natural logarithm of total assets. (7) Growth represents the growth rate of the company's main business. Cluster robust standard errors are in parentheses. *, **, *** indicates significant at 10%, 5%, 1% level, respectively.
Disclaimer/Publisher’s Note: The statements, opinions and data contained in all publications are solely those of the individual author(s) and contributor(s) and not of MDPI and/or the editor(s). MDPI and/or the editor(s) disclaim responsibility for any injury to people or property resulting from any ideas, methods, instructions or products referred to in the content. |
© 2023 by the authors. Licensee MDPI, Basel, Switzerland. This article is an open access article distributed under the terms and conditions of the Creative Commons Attribution (CC BY) license (http://creativecommons.org/licenses/by/4.0/).
Copyright: This open access article is published under a Creative Commons CC BY 4.0 license, which permit the free download, distribution, and reuse, provided that the author and preprint are cited in any reuse.


