
Submitted:
08 May 2023
Posted:
09 May 2023
You are already at the latest version
Abstract
This study investigated the impact of boron and copper on the microstructure and mechanical properties of Spheroidal graphite Cast Iron (SCI). The addition of boron increased the ferrite content, while copper increased the stability of pearlite. The interaction between boron and copper significantly increased the ferrite content. Differential Scanning Calorimetry (DSC) revealed that boron decreased the enthalpy change of the α + Fe3C -> γ transformation and increased the enthalpy change of the α -> γ transformation. The addition of boron and copper reduced the tensile and yield strength but increased elongation and impact energy. The findings provide valuable insights into the effect of boron and copper on SCI, facilitating the design and development of high-performance SCI materials.
Keywords:
Spheroidal graphite Cast Iron
; Boron
; Pearlite
; Mechanical properties
; Microstructure
1. Introduction
Casting is still widely used in various fields today. Metals are difficult to shape into desired shapes due to their high deformation resistance. By using casting, metals can be melted into a low-deformation liquid state and solidified in the desired shape, making it possible to create complex shapes all at once. In addition, compared to other manufacturing techniques, casting has simpler processes and requires less post-treatment, making it a viable option in the recent electric car market. Suitable metals for casting have the following characteristics:
- -
- Low melting point
- -
- Good fluidity when melted
- -
- Low shrinkage during solidification
Among many metals, cast iron satisfies the above conditions and allows for the relatively easy production of complex shapes. Compared to other metals, cast iron is relatively inexpensive and offers various mechanical properties. Spheroidal graphite cast iron is a type of cast iron that improves mechanical properties by forming graphite in a spheroidal shape instead of a flake shape, which concentrates stress on the graphite. Spheroidal graphite cast iron contains a large amount of added alloy elements, has a low melting point, excellent castability, and the mechanical properties can be controlled by adjusting the ratio of alloy elements. It is widely used in various fields, such as automobile parts, machine parts, and materials for rolling mills, as well as for parts requiring heat resistance [1,2].
The mechanical properties of spheroidal graphite cast iron are determined by the shape of graphite, the number of graphite nodules, and microstructure. In particular, the mechanical properties of spheroidal graphite cast iron can change significantly depending on the ratio of ferrite to pearlite, and to control these microstructural properties, it is necessary to control the cooling rate, the type and amount of alloy elements, and other process variables.
This study investigated the effect of B, an alloy element commonly added during casting of iron products, on the microstructure of cast iron. When casting, pig iron and steel scrap are mixed together, and various alloy elements are added to the steel scrap to improve the quality of iron products. Steel scrap from automobile steel plates is commonly used in casting. High-strength steel plates used for automobile panels contain B as an alloy element, which improves the hardenability of steel. By adding B, expensive alloy elements can be replaced, and high-strength steel can be produced at a lower cost. When B is added to cast iron, it affects the microstructure. Recent studies have reported that adding small amounts of B at the ppm level stabilizes ferrite in cast iron [3,4,5]. However, if this effect occurs in pearlitic cast iron, the microstructure of the casting will change, resulting in a decrease in product quality. Therefore, in this study, pearlitic spheroidal graphite cast iron, which is widely used in various fields such as automobiles and ships, was selected, and the Mn and Cu ratios were adjusted to control the pearlite ratio in the specimens. Mechanical property tests, microstructure analysis, and heat analysis were performed on the produced specimens. Based on the results, the effect of small amounts of B on spheroidal graphite cast iron was analyzed.
2. Experimental methods
2.1. Melting and Casting
The melting of the cast iron was achieved using high-frequency induction melting (350PT10, HanGuk Induction) to melt the alloying elements, and the composition of the target chemical components is shown in Table 1. The nodularization of graphite was achieved by adding Mg-Re nodularizing agent using the sandwich method and adding inoculant when ladling from the ladle. The amount of B was controlled by using Fe-B. The ladle tapping temperature from the furnace was 1450°C, and the pouring temperature of the Y-block from the ladle was 1300°C. After adding B to the molten iron, the molten iron was maintained for 6 minutes in the ladle before being tapped. Type 2 Y-block was used as specified in DIN EN 1563.
2.2. Mechanical Property Evaluation
Y-blocks were cast and used to produce tension and impact test specimens. The tension test specimen was made in the shape of a rod, which is one of the test specimens used in KS B 0801 metallic material tensile tests. The tensile strength, yield strength, and elongation were measured using a universal testing machine (Instron 5988) and an extensometer (AUTOX 750). The test was conducted at room temperature with a crosshead speed of 10mm/min. The gauge length was fixed at 50mm. The impact test was performed using a Charpy impact tester (Instron MPX-700) with V-notch impact specimens produced according to KS B 0809.
2.3. Chemical Composition Analysis
A small amount of molten metal was collected before injecting into the mold and injected into a mold for chemical composition analysis to make a cast specimen. The analysis surface of the solidified cast specimen was ground with a grinder and the chemical composition was analyzed using a Spark Optical Emission Spectrometer (OBLF GmbH QSN750-2).
2.4. Microstructure and Graphite Analysis
During the production of the tension test specimens, cylindrical specimens with a diameter of approximately 22mm were also made to observe the microstructure. The specimens were mechanically polished using an automatic polishing machine (Tegramin-25, Struers), followed by polishing with 1μm diamond suspension and ethanol on a buffer. The specimens were then etched in a 3% nital solution for about 15 seconds, and the microstructure was observed using an optical microscope (Axio Observer. A1m, Carl Zeiss Microscopy GmbH) and measured for the percentage of graphite, graphite size, and nodularity using image analysis software (IMT iSolution DT). Additionally, the distribution of elements and the surface morphology of graphite were analyzed using a field-emission scanning electron microscope (FE-SEM, JSM-7900F AZtec Live and AZtec HKL), depending on the presence or absence of B.
2.5. Thermal Analysis
The state change temperature and enthalpy of each specimen were measured to analyze the amount of reaction using differential thermal analysis (DTA). The heat flow difference between the reference pan and the specimen-containing pan was analyzed using a differential scanning calorimeter (TA Instruments SDT600) with an alumina 90ul crucible. The analysis was performed at a heating rate of 10°C /min from 50°C to 1300°C.
3. Results and Discussion
3.1. Microstructure Analysis
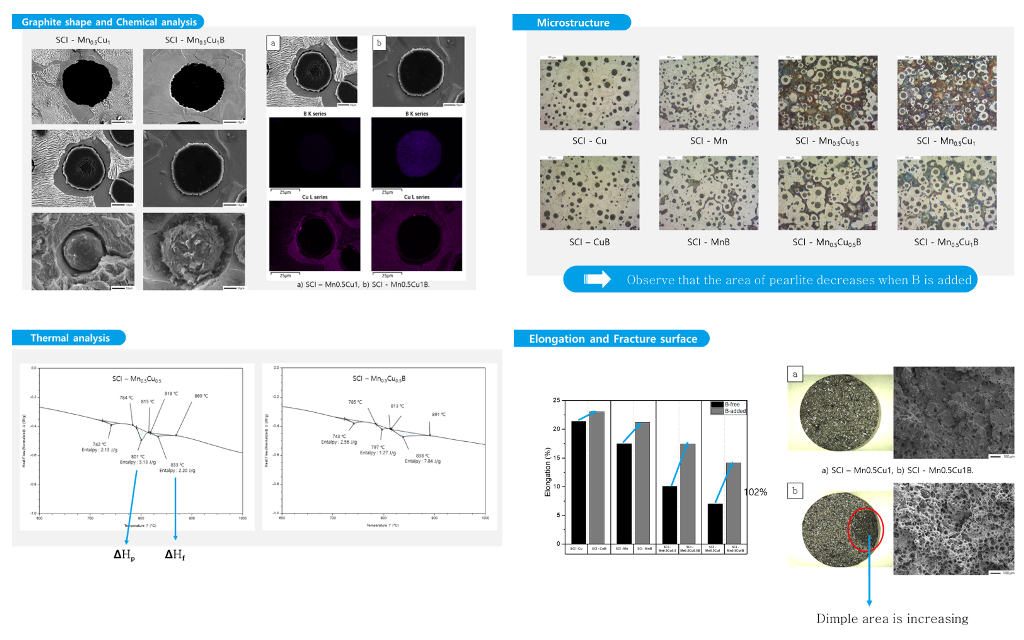
Figure 1 shows the microstructure images of each specimen before corrosion with and without the addition of B. Using these images, we measured the graphite size, graphite nodule count, and graphite area by image analysis program (IMT iSolution DT) and listed the results in Table 2. The graphite size of specimens with B addition tended to increase, and it increased up to 17% at maximum. In contrast, the graphite nodule count decreased up to 22% at maximum, which is contrary to the trend of the graphite size. Despite the decrease in the graphite nodule count and increase in the graphite size, the total graphite area increased, suggesting that carbon diffusion from austenite to graphite occurred.
Figure 2 shows the images of each specimen after corrosion, and we measured the ferrite area fraction of each specimen. Previous studies have shown that a small amount of Cu neutralizes the effect of other ferritic alloying elements and a certain amount of Cu is necessary to act as a strong ferrite-forming element [4,6,7,8]. In our experiment, specimens with both Cu and Mn added formed more ferrite than specimens with only Cu or Mn added, and the ferrite area of SCI-Cu specimen was almost negligible (6.5%). On the other hand, the ferrite area of SCI-Mn0.5Cu1 specimen increased about three times compared to that of specimens with only Cu or Mn added. We can observe that the ferrite area fraction of specimens with B addition increased from Figure 2 and Table 2.
3.2. Comparison of Graphite Shape
When comparing the microstructure of Mn0.5Cu0.5 and Mn0.5Cu1 specimens with a significant change in the ferrite fraction after being corroded in 3% Nital for 10 minutes, we found that there is a difference in the surface shape of graphite between before and after the addition of B, as shown in Figure 3a-d [9].
We observed the surface of graphite, which was not well visible in cross-section, by preparing a polished surface specimen in the same way as the microstructure specimen (Figure 4c-d). The surface area of graphite changed to increase due to B addition, and this is expected to reduce the effect of the Cu film generated by the graphite precipitation in the previous literature, requiring further experiments.
We judged that the increase in the surface area after B addition facilitated carbon diffusion between graphite and austenite, making ferrite formation easier and leading to an increase in the ferrite fraction in the B-added specimens.
3.3. Elemental Analysis and SEM/EDS Analysis
The concentration of B in the specimen was confirmed to be 25 ppm by using an inductively coupled plasma optical emission spectrometer (ICP-OES) to analyze the B-added specimen. The concentrations of other alloying elements are also shown in Table 3. To confirm the location of B, energy-dispersive X-ray spectroscopy (EDS) was used to confirm the presence of Cu around the graphite. However, the presence of B was detected at a very low level compared to other elements.
Additionally, Figure 5 shows the mapping analysis results for the area around the graphite in the Mn0.5Cu1B specimen, which qualitatively confirms the presence of B in the graphite region of the B-added specimen. As previously reported, it is expected that B in the graphite forms FeSiBCu, and it is assumed that Cu damages the membrane of the graphite, causing a change in the shape of the graphite [10]. Comparing the Cu distribution in the specimen without B addition (a) and the B-added specimen (b) in Figure 5, it can be seen that Cu is more concentrated around the graphite in (a), whereas the distribution of Cu is more evenly spread out in (b).
3.4. Thermal Property Analysis
Figure 6 represents a typical composition, and the results of differential scanning calorimetry (DSC) analysis for each composition are presented in Table 4, which includes the following parameters:
Tc: Curie temperature
Tp: α + Fe3C -> γ transformation temperature
Tf: α -> γ transformation temperature
ΔT: Tf – Tp
ΔHp: Heat of transformation for α + Fe3C -> γ transformation
ΔHf: Heat of transformation for α -> γ transformation
The spheroidized cast iron undergoes a eutectoid reaction and a eutectic transformation, producing a peak during the eutectic transformation, depending on whether the pearlite or ferrite phase is present.
When the peak is downward, it indicates a decrease in heat flow, which indicates an endothermic reaction. In the solidification process, pearlite and ferrite are formed due to carbon diffusion from austenite, resulting in the peak [11,12,13,14].
For SCI-Cu and SCI-CuB, which have a pearlite fraction of over 90%, the Tp peak is minimal, and the starting and ending temperatures of Tf are similar, but the ΔHf value differs.
For SCI-Mn and SCI-MnB specimens, unlike the previous specimens, three peak points appear, which correspond to the Curie temperature, Tf, and Tp. The ΔHf value of SCI-Mn and SCI-MnB increased due to B addition, while the ΔHp value decreased, resulting in an increase in the pearlite fraction.
Mn0.5Cu0.5 and Mn0.5Cu1, which had a high pearlite fraction before B addition, also showed an increase in ΔHf value and a decrease in ΔHp value due to B addition, resulting in an increase in the pearlite fraction, as shown in Table 4.
These results exhibit a similar trend to the microstructure results previously observed, indicating that the increased surface area of the graphite observed in the graphite shape makes the austenite-to-pearlite transformation peak ΔHf value increase, which makes it easier for austenite and carbon diffusion to occur.
3.5. Mechanical Properties Analysis
The mechanical properties measurement data, including tensile strength, yield strength, hardness, and elongation, of graphite-containing cast iron with and without B addition are presented in Table 5, and the numerical changes are shown in Figure 7, Figure 8 and Figure 9. Tensile strength shows a decreasing trend with B addition, and the effect is more significant when Mn and Cu are co-added, as the increased pearlite fraction due to the addition of these elements has a greater influence. Yield strength and hardness exhibit similar trends to tensile strength. Elongation, which is a property opposite to strength, shows an increasing trend with B addition, and, similar to other properties, the effect is more pronounced when Mn and Cu are co-added.
These mechanical properties were influenced by the microstructure, as B affected the morphology of graphite, leading to changes in the pearlite and ferrite fractions, which in turn affected the mechanical properties. It can be concluded that the microstructure of the matrix is a critical factor in determining the mechanical properties of graphite-containing cast iron.
The impact energy value showed higher pearlite fraction and elongation values for SCI-MnB than for SCI-Cu, but additional experiments considering the employment characteristics due to Si content will be necessary to explain why the impact energy is lower.
3.6. Fracture Surface Analysis
In SCI-Cu specimens, the fracture surfaces were predominantly ductile, as the effect of pearlite formation was minimal, with pearlite fraction being over 90% even before B addition. After B addition, the pearlite fraction increased, resulting in a further increase in ductile fracture.
SCI-Mn specimens generated more pearlite than SCI-Cu specimens, showing a more distinct B addition effect, resulting in a larger ductile area. In addition, the Dimple area increased more significantly in SEM measurements.
4. Conclusions
In this study, we investigated the effect of trace amounts of B contained in scrap iron on the properties of spheroidal graphite cast iron (SCI), specifically the changes in microstructure and mechanical properties of the commonly used pearlitic SCI with and without B addition.
(1) Copper (Cu) is known as a strong stabilizing element for pearlite, but a small amount of Cu can offset the effects of other pearlitic alloying elements. Addition of Cu with manganese (Mn) was found to be more effective.
(2) B addition increased the ferrite fraction in the base structure of SCI, and showed up to three times increase in maximum ferrite fraction. The effect was more pronounced in pearlitic SCI than in ferritic SCI.
(3) The graphite morphology changed to a surface-enlarging shape after B addition, with increased surface area. Carbon diffusion from austenite during solidification led to increased graphite size and decreased carbon content in austenite, resulting in increased ferrite area fraction.
(4) Thermal analysis revealed three peaks for the pearlitic SCI in the solidification reaction: the Curie temperature (Tc), the α+Fe3C→γ transformation temperature (Tp), and the α→γ transformation temperature (Tf). After B addition, ΔHp decreased while ΔHf increased, indicating an increase in ferrite area fraction.
(5) After B addition, the tensile strength, yield strength, and hardness decreased, while elongation increased.
(6) The fracture surface showed an increase in ductile fracture area due to the increased ferrite area fraction.
Overall, it can be concluded that the addition of B significantly influences the microstructure and mechanical properties of pearlitic spheroidal cast iron (SCI), where Cu and Mn exhibit distinct effects. Upon interaction with pearlite-forming elements, B addition leads to an increase in ferrite formation heat, resulting in a decrease in strength while simultaneously enhancing ductility. These insights can contribute to the development of high-performance SCI materials with optimized mechanical properties.
Author Contributions
Conceptualization and methodology, S.-H.Y. and Y.-J.C.; analysis, H.-J.S., J.-W.H., and S.-B.H.; experiment, C.-Y.C., D.-Y.K., and J.-W.K.; writing—original draft preparation, J.-S.H. and J.-S.J.; writing—review and editing, S.-H.Y., D.-C.K. and Y.-J.C. All authors have read and agreed to the published version of the manuscript.
Funding
This research was funded by the Korea Institute of Industrial Technology’s research project (KITECH, EH-23-0006) and the Korea Evaluation Institute of Industrial Technology (KEIT, No. 20015706).
Institutional Review Board Statement
Not applicable.
Informed Consent Statement
Not applicable.
Data Availability Statement
The data presented in this study are available on request from the corresponding author and the first author.
Acknowledgments
This study has been conducted with the support of KITECH (EH-23-0006) and KEIT (20015706).
Conflicts of Interest
The authors declare no conflict of interest.
References
- Mullins, J.D. Ductile Iron Data for Design Engineers; Rio Tinto Iron & Titanium Inc: Montreal, Canada, 1990; pp. 5.7–5.16. [Google Scholar]
- Gagné, M. The Sorelmetal book of ductile iron; Rio Tinto Iron & Titanium Inc: Montreal, Canada, 2004. [Google Scholar]
- Kanno, T.; Kang, I.-G. Neutralization or Elimination Treatment of Boron from Molten Cast Iron. Journal of Korea Foundry Society 2008, 28, 160–165. [Google Scholar]
- de Albuquerque Vicente, A.; Moreno, J. R. S.; de Abreu Santos, T. F.; Espinosa, D. C. R.; Tenório, J. A. S. Nucleation and growth of graphite particles in ductile cast iron. Journal of Alloys and Compounds 2019, 755, 1230–1234. [Google Scholar] [CrossRef]
- Izui, S.; Furumiya, N.; Horie, H.; Kowata, T.; Takahashi, T. Effect of small amount of boron on matrix structure of spheroidal graphite cast irons. Imono 1994, 66, 745–750. [Google Scholar]
- König, M.; Wessén, M. Influence of alloying elements on microstructure and mechanical properties of CGI. International Journal of cast Metals research 2010, 23, 97–110. [Google Scholar] [CrossRef]
- Tsujikawa, M.; Matsumoto, N.; Nakamoto, K.; Michiura, Y. Pearlite stabilisation by copper on ductile cast iron. Key Engineering Materials 2011, 457, 151–156. [Google Scholar] [CrossRef]
- Sertucha, J.; Larrañaga, P.; Lacaze, J.; Insausti, M. Experimental investigation on the effect of copper upon eutectoid transformation of as-cast and austenitized spheroidal graphite cast iron. International Journal of Metalcasting 2010, 4, 51–58. [Google Scholar] [CrossRef]
- Zou, Y.; Ogawa, M.; Nakae, H. Interaction of boron with copper and its influence on matrix of spheroidal graphite cast iron. ISIJ international 2012, 52, 505–509. [Google Scholar] [CrossRef]
- Igarashi, Y.; Akiyama, S.; Kanno, T.; Kang, I.; Nakae, H.; Horie, H.; Hiratsuka, S.; Fujikawa, T. Ferrite Formation Mechanism in Boron Contained Pearlitic Spheroidal Graphite Cast Iron. Journal of Japan Foundry Engineering Society 2010, 82, 16–22. [Google Scholar]
- Homa, M.; Sobczak, N.; Turalska, P.; Bruzda, G.; Bacior, M.; Warmuzek, M.; Polkowska, A. Thermophysical properties of selected vermicular graphite cast iron alloy. Prace Instytutu Odlewnictwa 2017, 57, 345–350. [Google Scholar]
- Przeliorz, R.; Piątkowski, J. Investigation of phase transformations in ductile cast iron of differential scanning calorimetry. IOP Conference Series: Materials Science and Engineering 2011, 22, 12–19. [Google Scholar] [CrossRef]
- Ivanova, R.; Sha, W.; Malinov, S. Differential Scanning Calorimetry and Microscopy Study of Transformations in Ductile Cast Irons: Part I. ISIJ international 2004, 44, 886–895. [Google Scholar] [CrossRef]
- Binczyk, F.; Tomaszewska, A.; Smoliński, A. Calorimetric analysis of heating and cooling process of nodular cast iron. Archives of Foundry Engineering 2007, 7, 25–30. [Google Scholar]
Figure 1.
Microstructures of as-polished spheroidal graphite cast iron observed by optical microscope: (a) SCI – Cu; (b) SCI – CuB; (c) SCI – Mn; (d) SCI – MnB; € SCI – Mn0.5Cu0.5; (f) SCI – Mn0.5Cu0.5B; (g) SCI – Mn0.5Cu1; (h) SCI – Mn0.5Cu1B.
Figure 1.
Microstructures of as-polished spheroidal graphite cast iron observed by optical microscope: (a) SCI – Cu; (b) SCI – CuB; (c) SCI – Mn; (d) SCI – MnB; € SCI – Mn0.5Cu0.5; (f) SCI – Mn0.5Cu0.5B; (g) SCI – Mn0.5Cu1; (h) SCI – Mn0.5Cu1B.
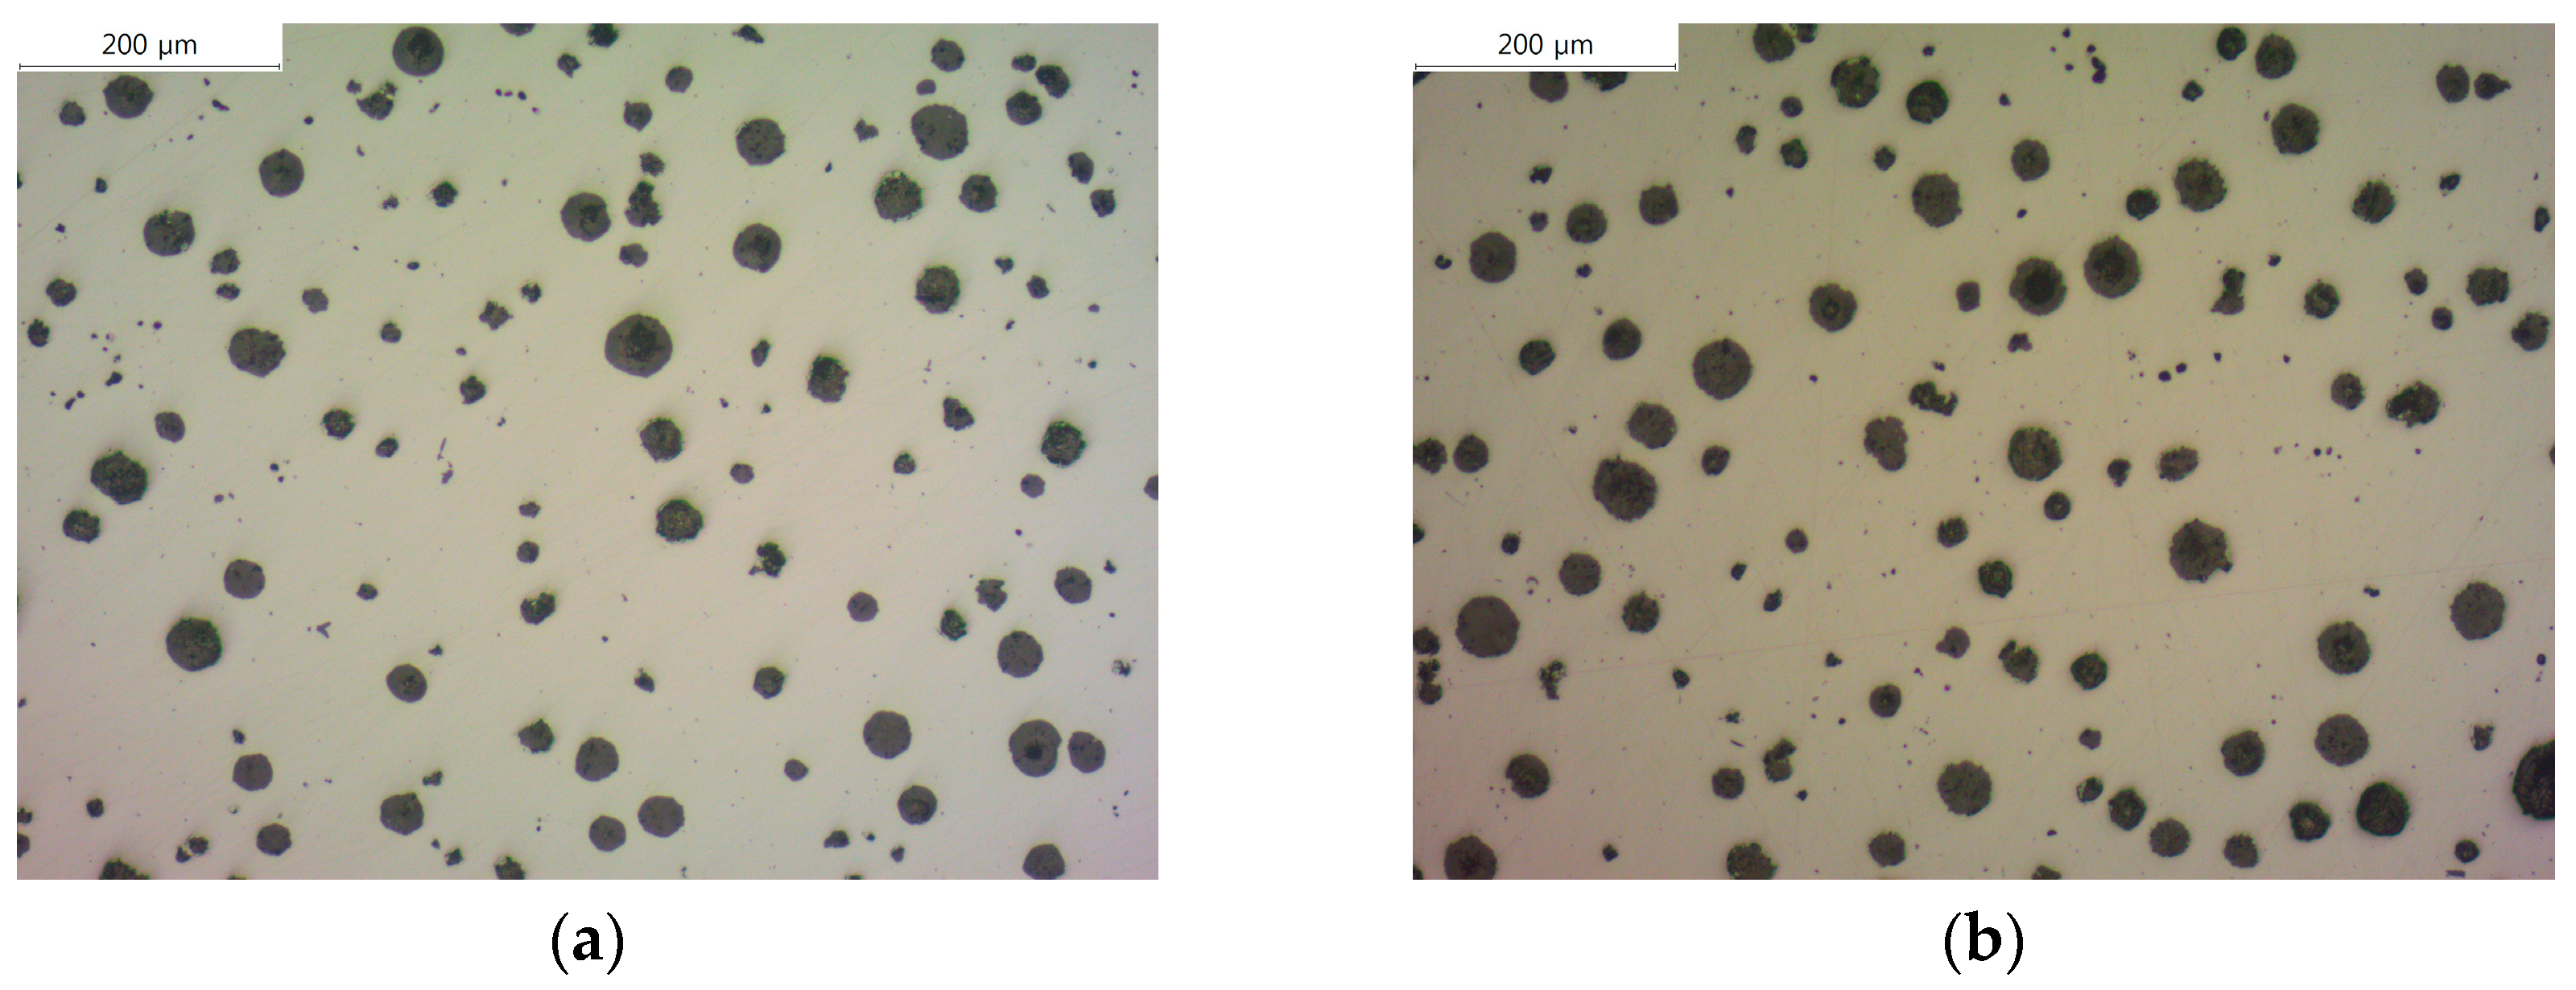
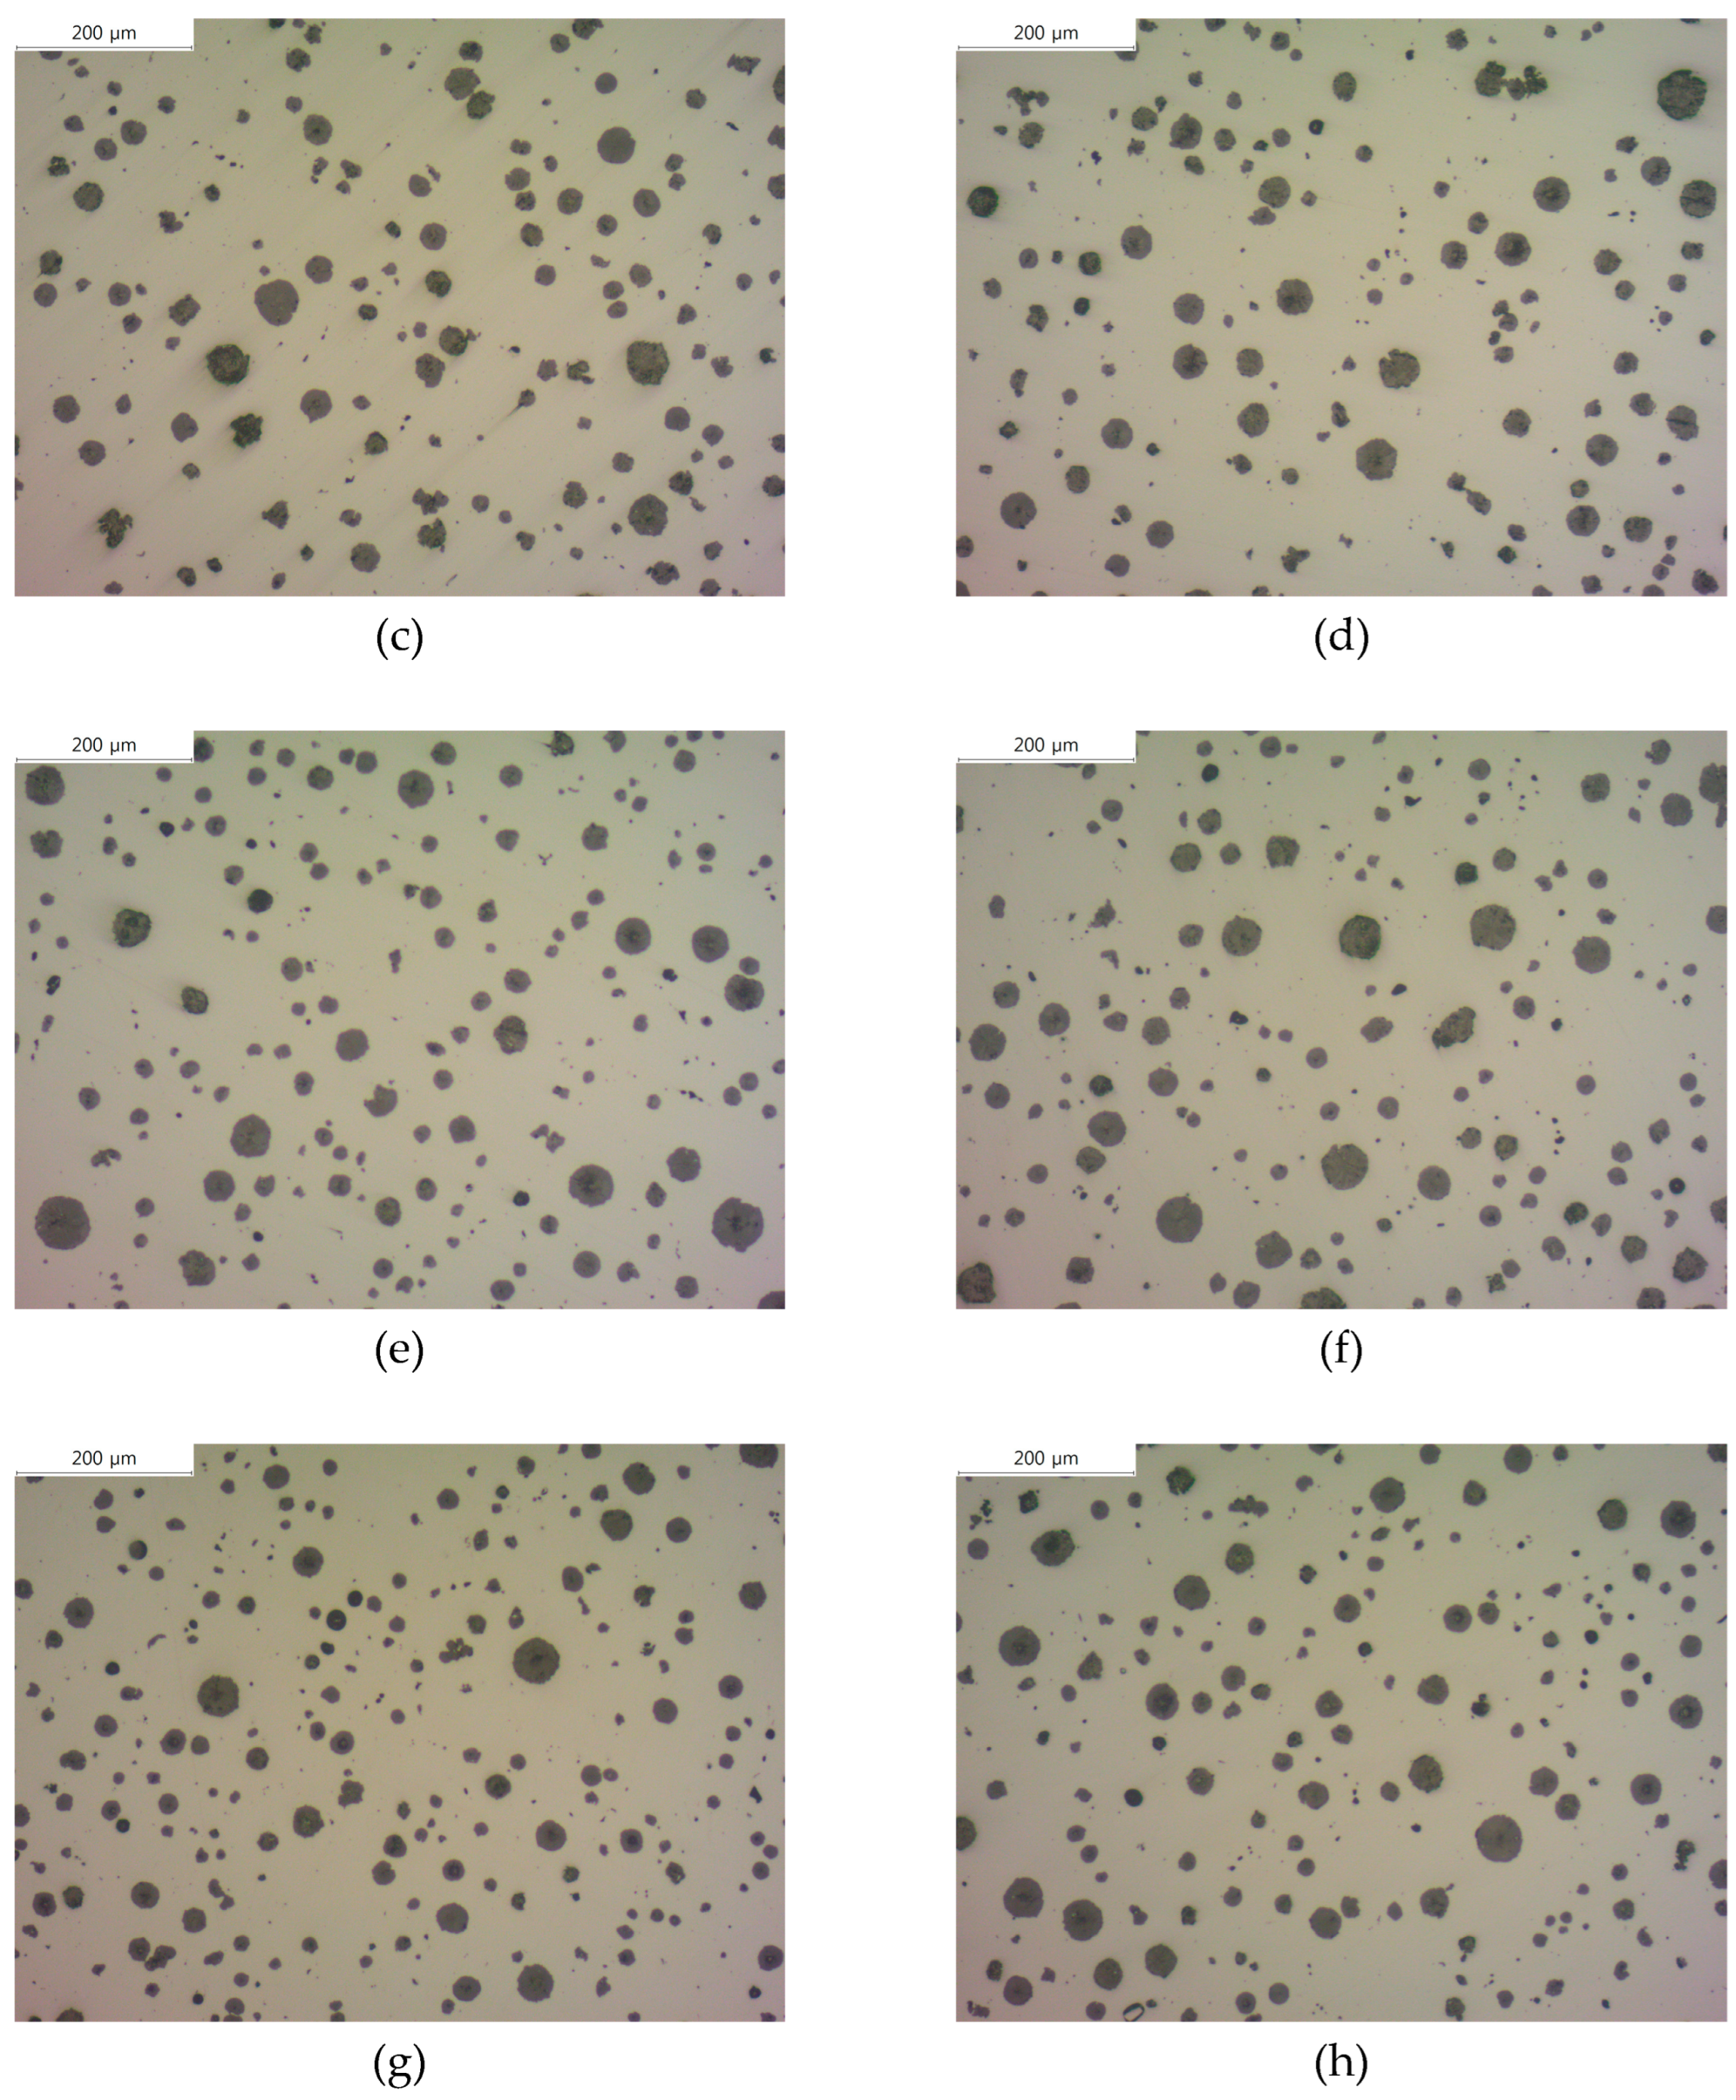
Figure 2.
Microstructures of etched spheroidal graphite cast iron observed by optical microscope: (a) SCI – Cu; (b) SCI – CuB; (c) SCI – Mn; (d) SCI – MnB; € SCI – Mn0.5Cu0.5; (f) SCI – Mn0.5Cu0.5B; (g) SCI – Mn0.5Cu1; (h) SCI – Mn0.5Cu1B.
Figure 2.
Microstructures of etched spheroidal graphite cast iron observed by optical microscope: (a) SCI – Cu; (b) SCI – CuB; (c) SCI – Mn; (d) SCI – MnB; € SCI – Mn0.5Cu0.5; (f) SCI – Mn0.5Cu0.5B; (g) SCI – Mn0.5Cu1; (h) SCI – Mn0.5Cu1B.
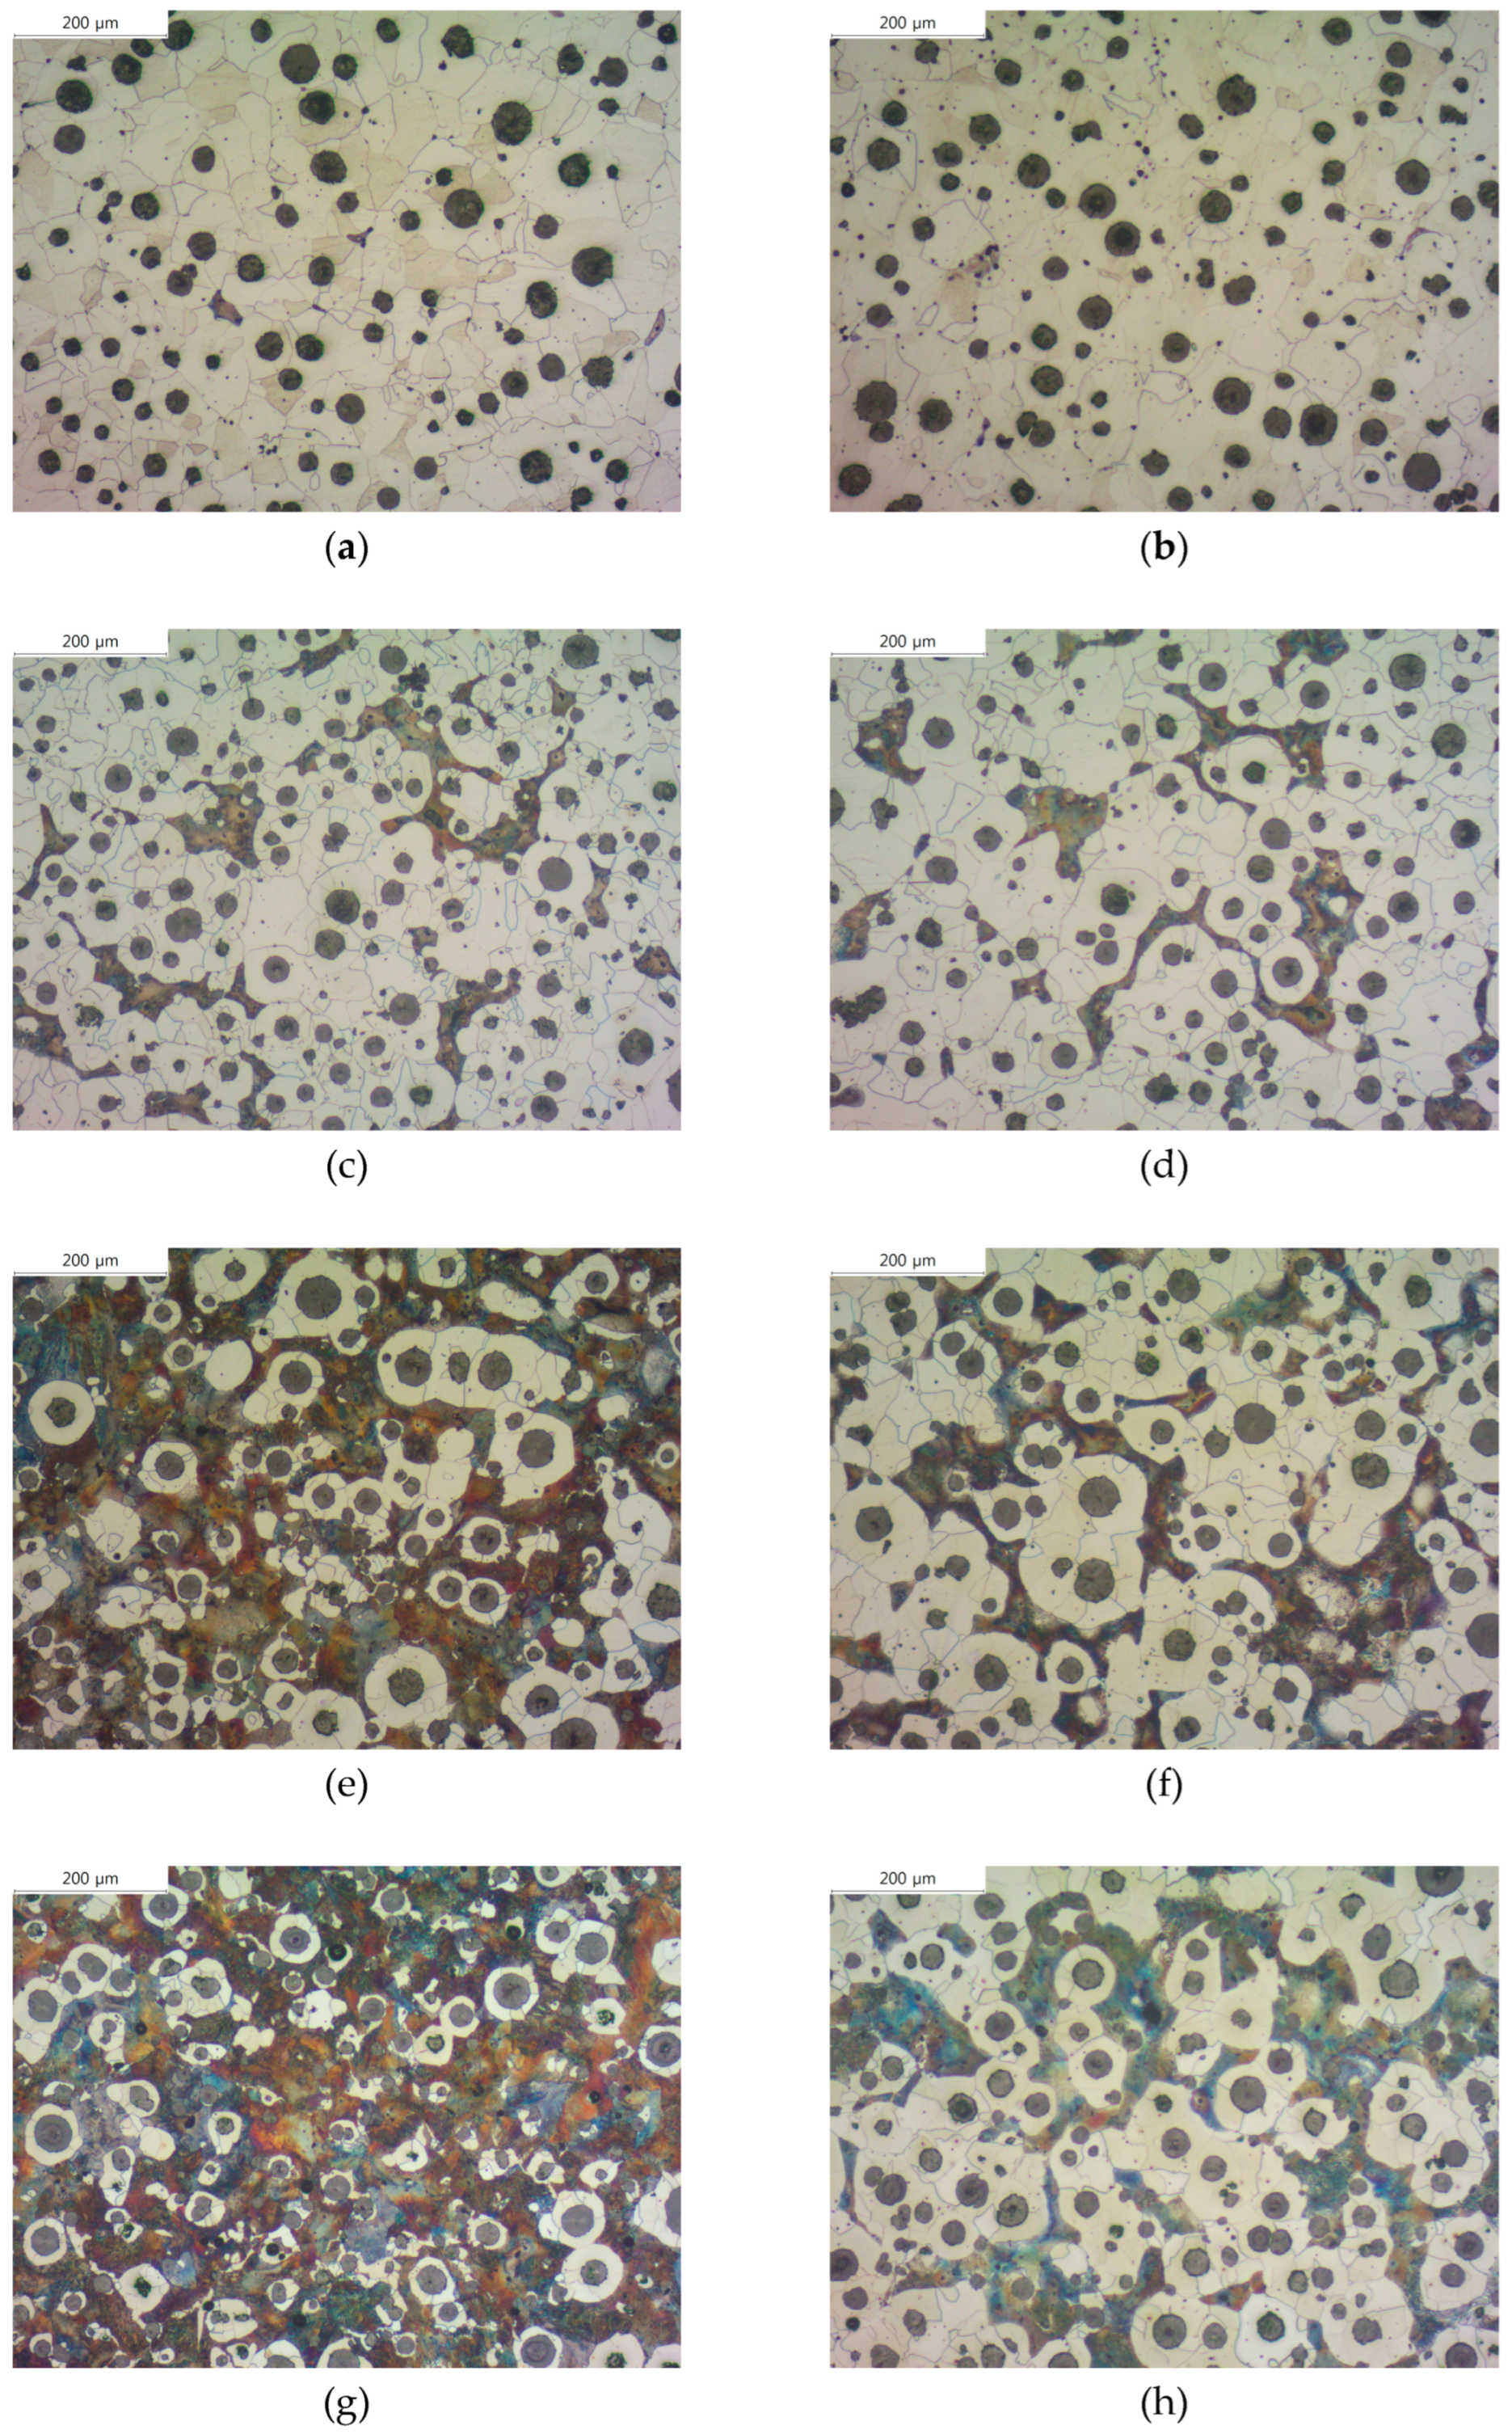
Figure 3.
Microstructures of samples etched with 3% nital observed by SEM: (a) SCI – Mn0.5Cu0.5; (b) SCI – Mn0.5Cu0.5B; (c) SCI – Mn0.5Cu1; (d) SCI – Mn0.5Cu1B.
Figure 3.
Microstructures of samples etched with 3% nital observed by SEM: (a) SCI – Mn0.5Cu0.5; (b) SCI – Mn0.5Cu0.5B; (c) SCI – Mn0.5Cu1; (d) SCI – Mn0.5Cu1B.
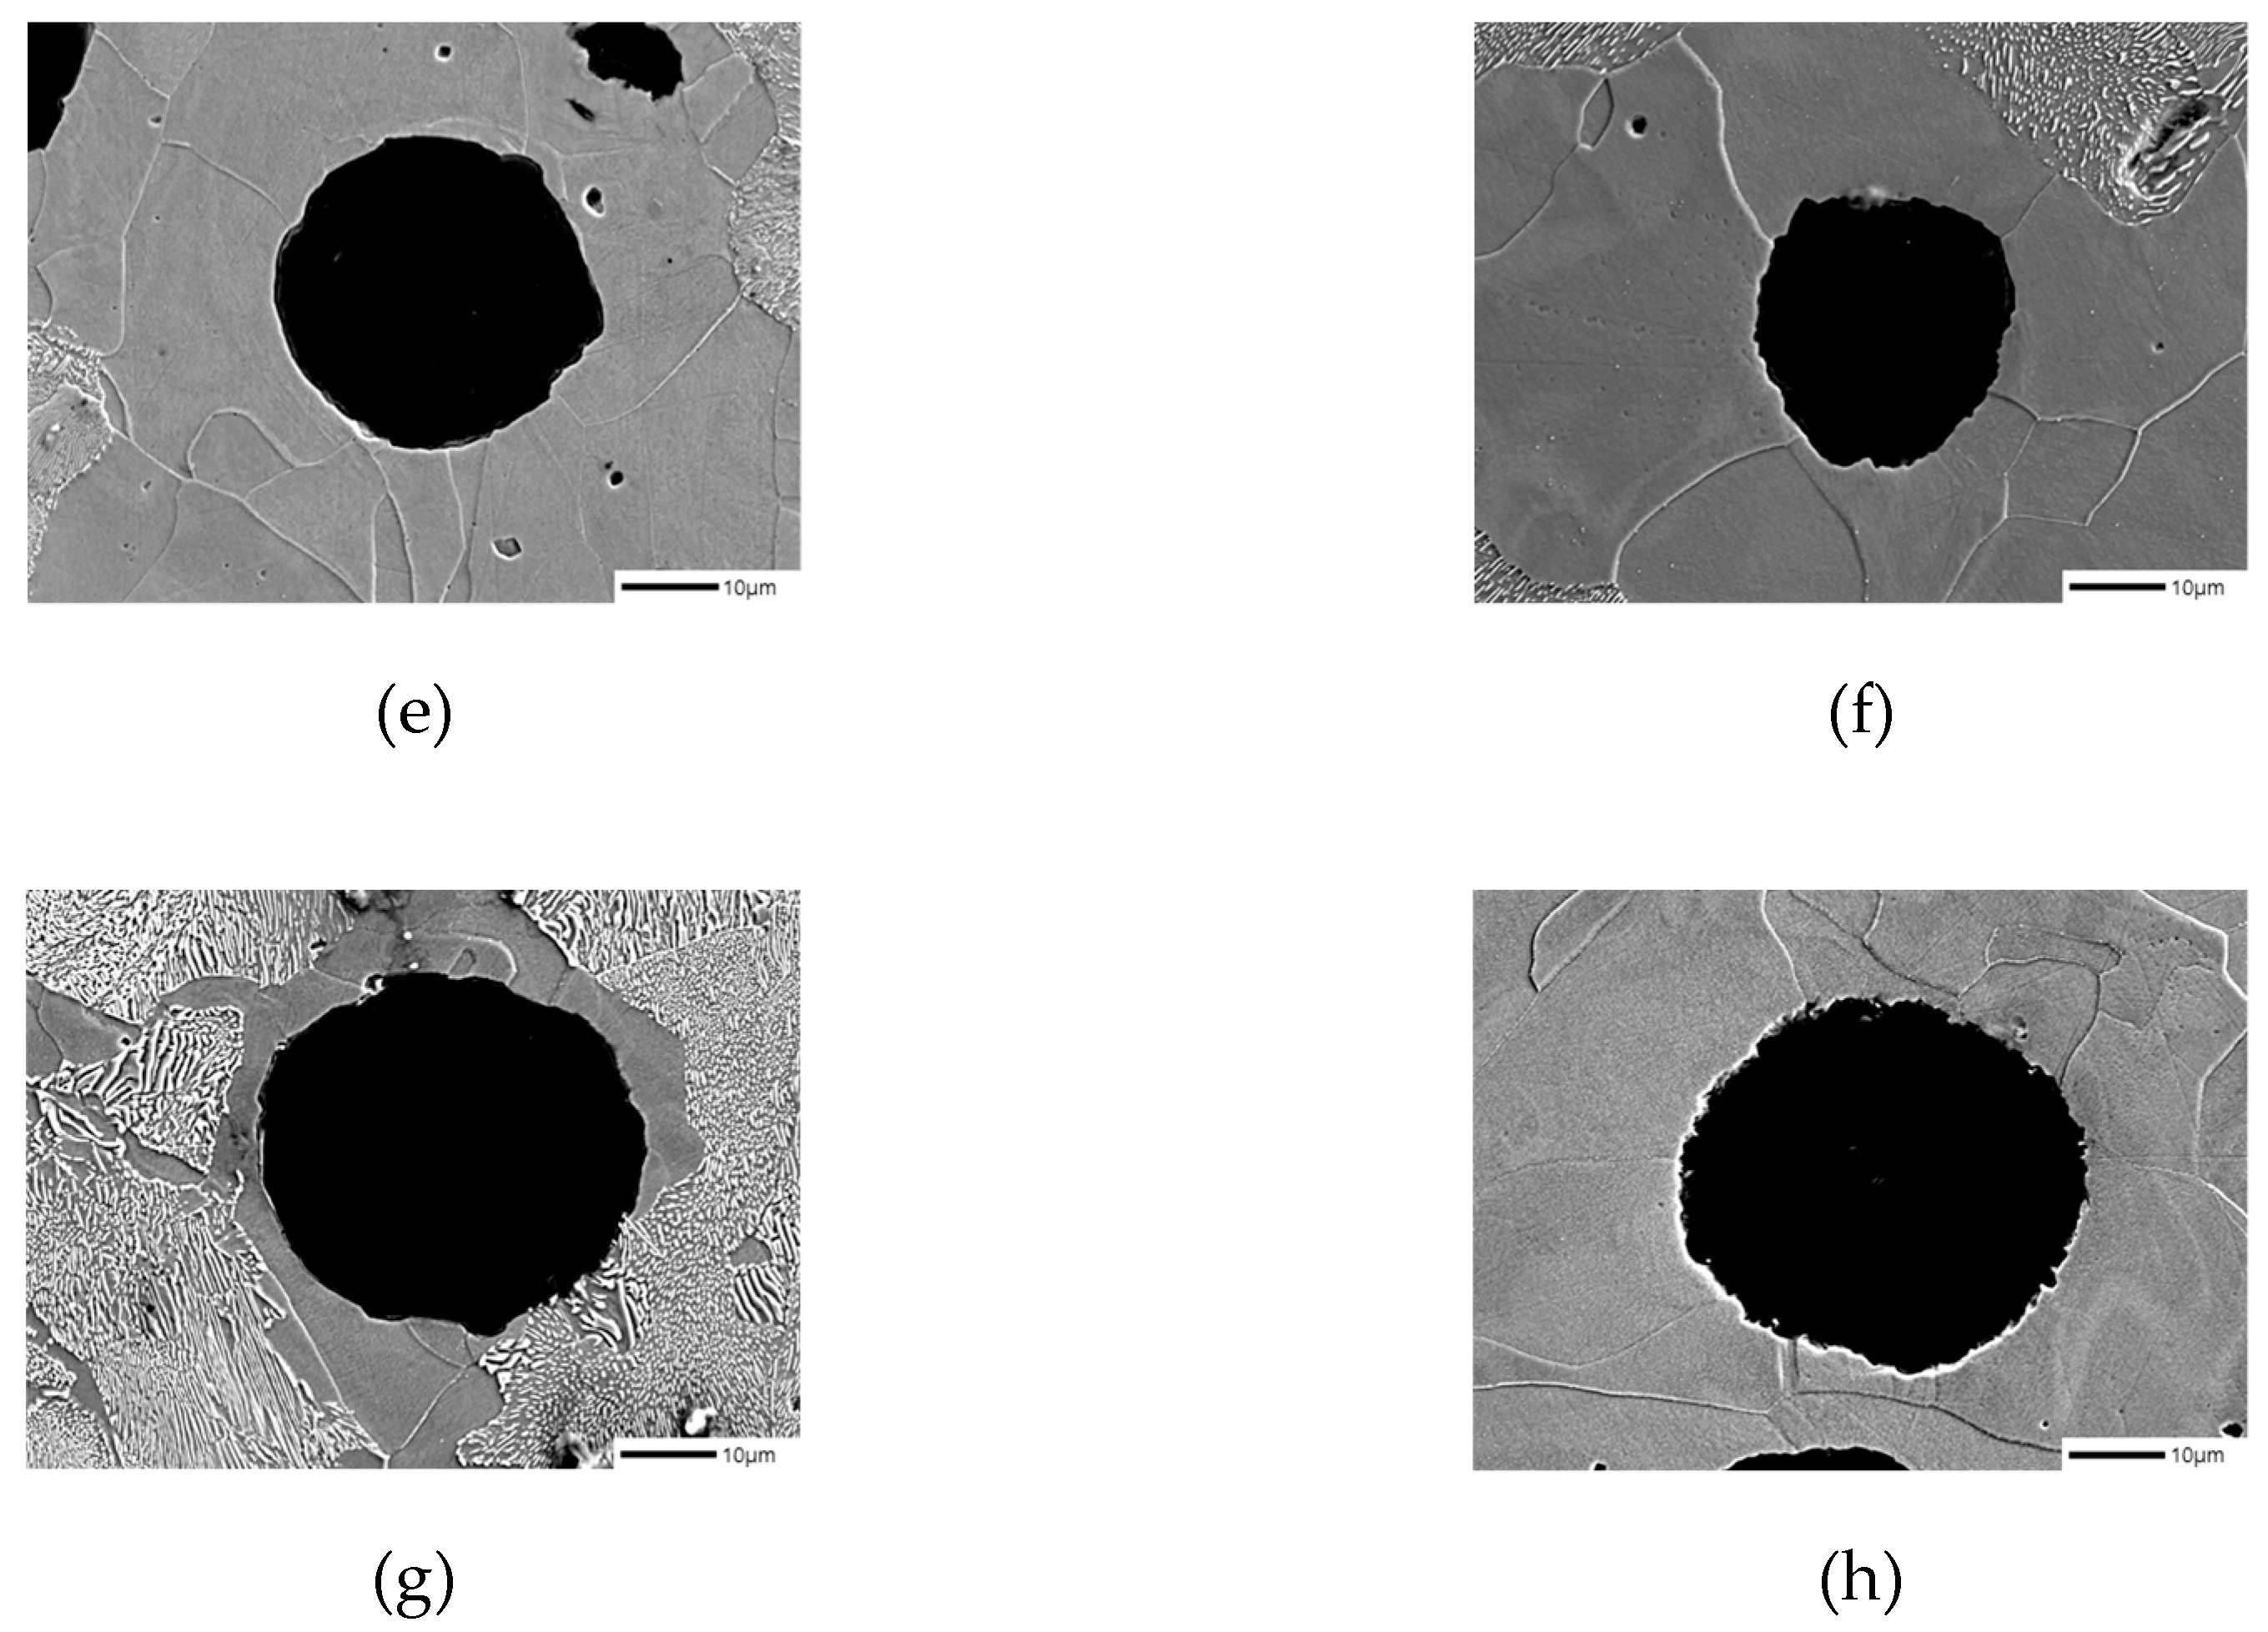
Figure 4.
Graphite shapes of samples deep-etched with 3% nital observed by SEM: (a), (c), € SCI – Mn0.5Cu1; (b), (d), (f) SCI – Mn0.5Cu1B.
Figure 4.
Graphite shapes of samples deep-etched with 3% nital observed by SEM: (a), (c), € SCI – Mn0.5Cu1; (b), (d), (f) SCI – Mn0.5Cu1B.
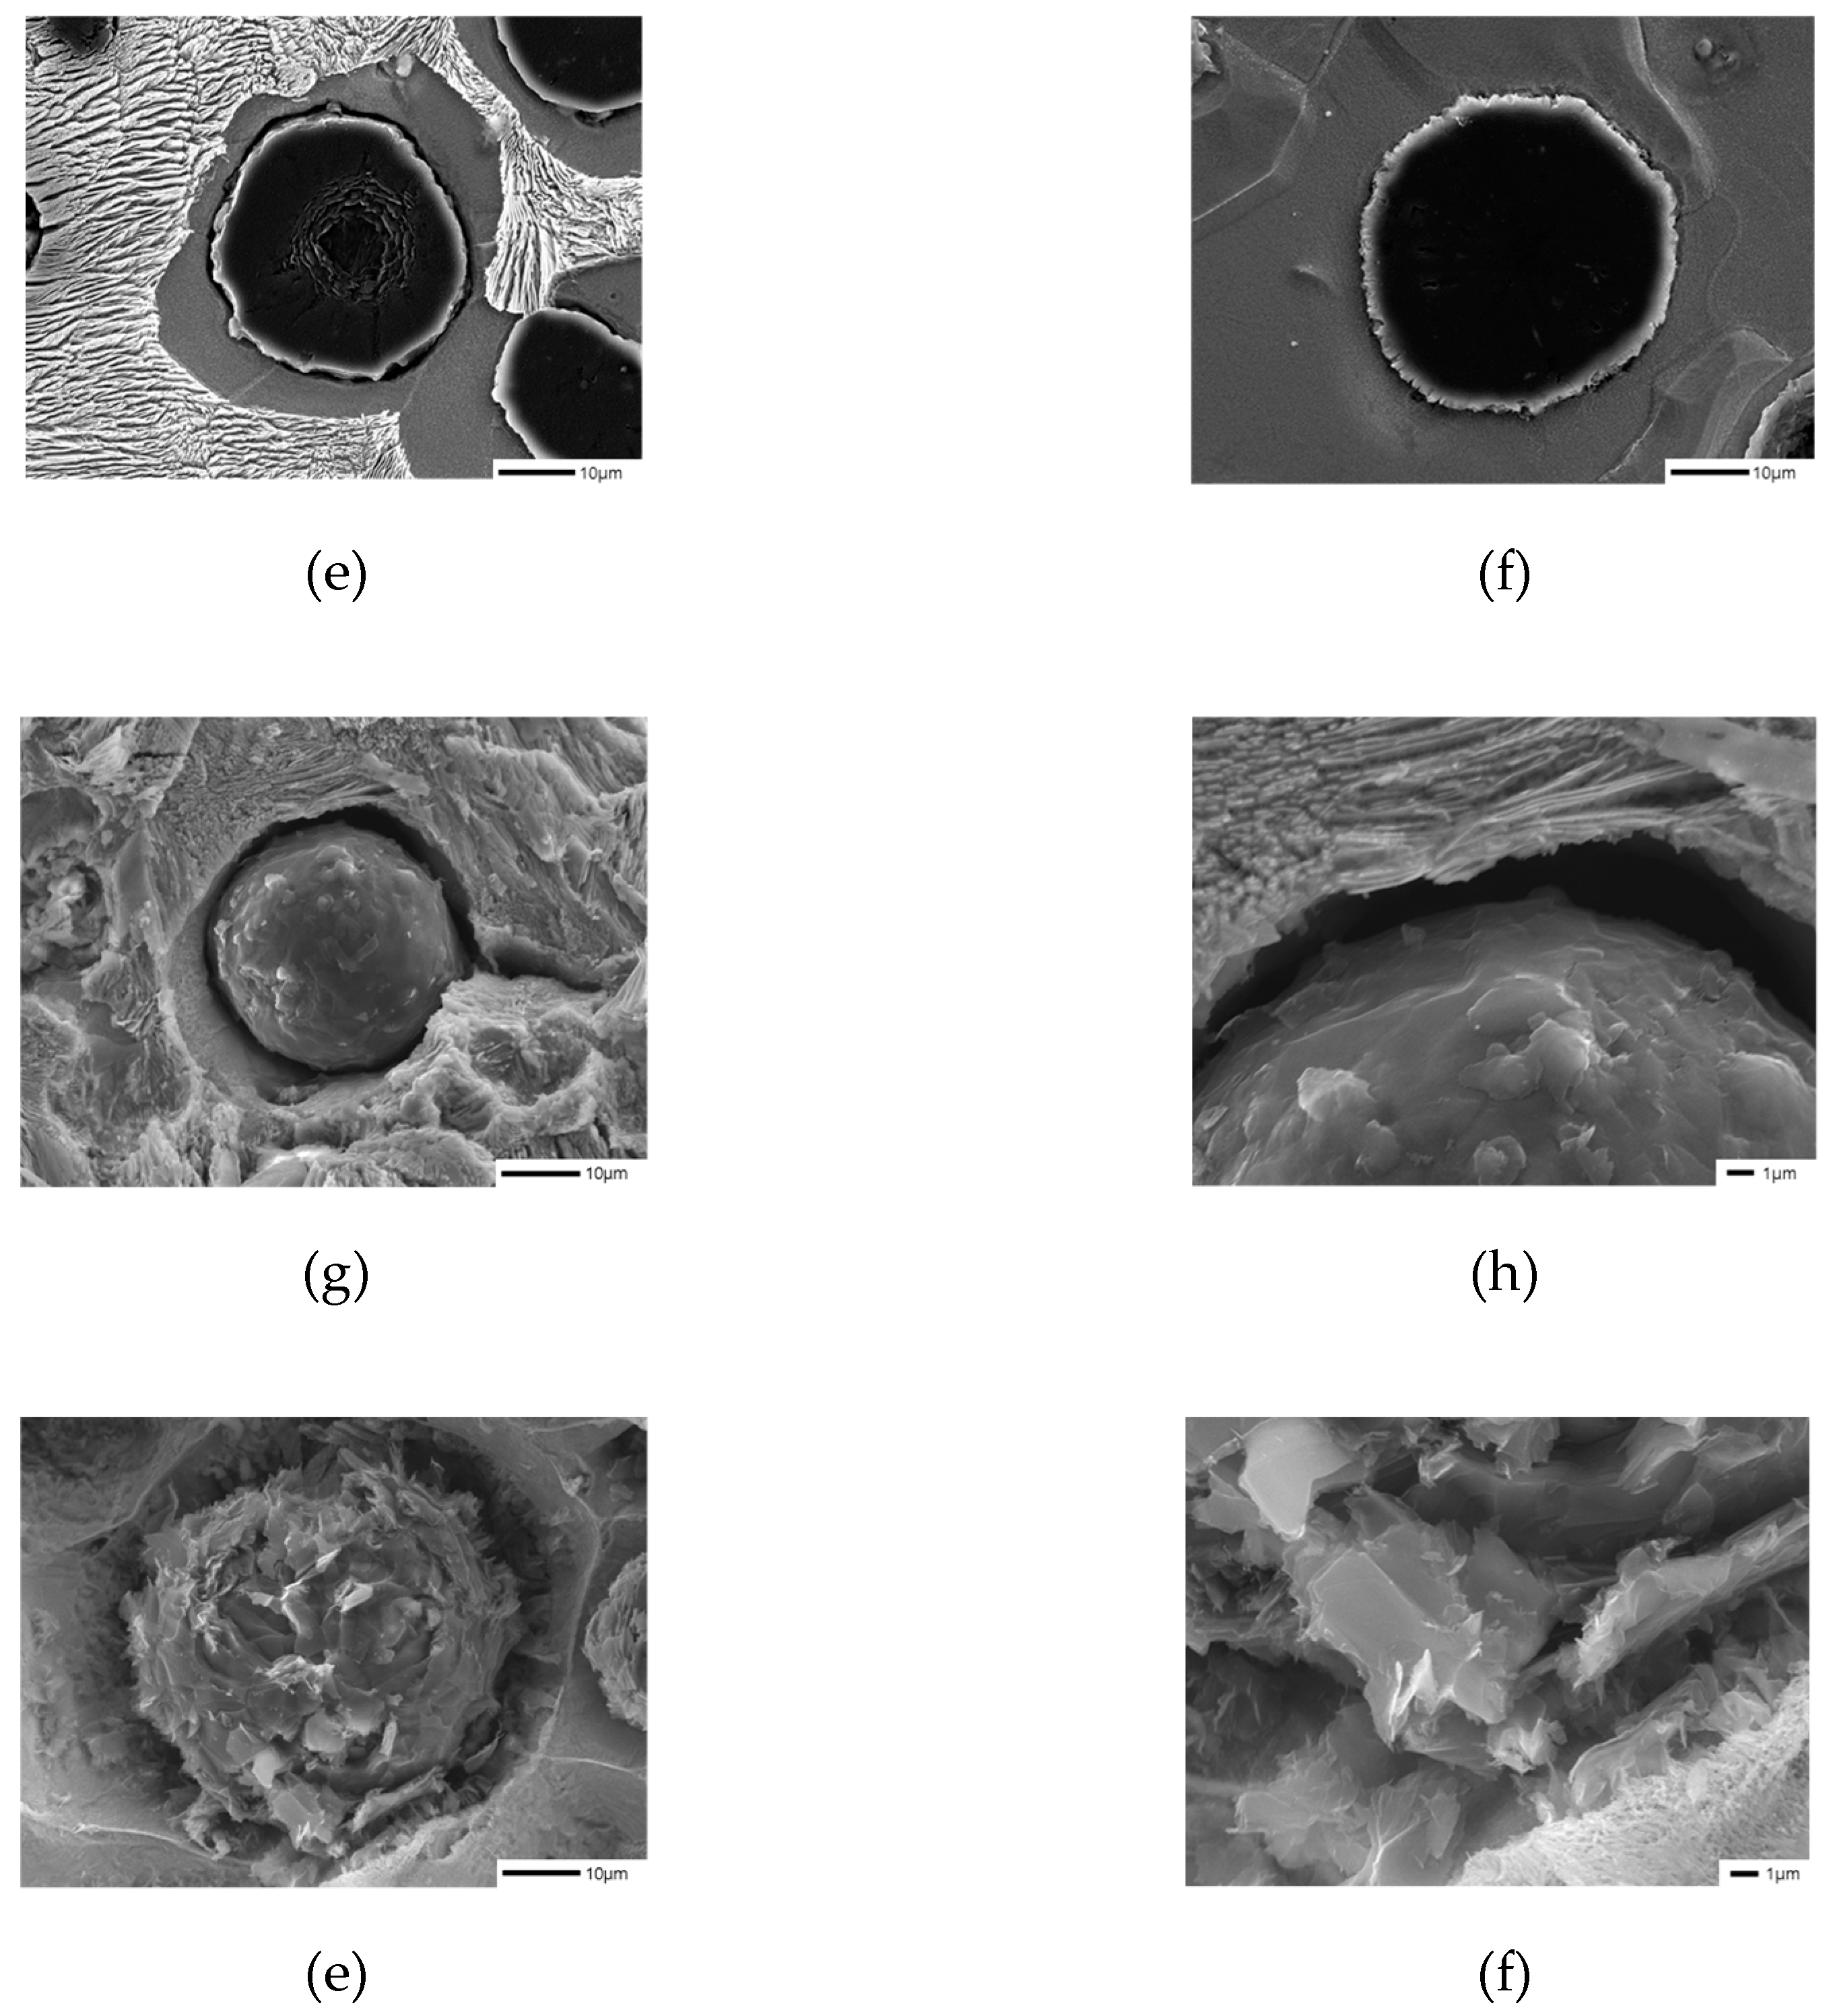
Figure 5.
EDS Mapping analysis of B, Cu in spheroidal graphite cast iron: (a), (c), € SCI – Mn0.5Cu1; (b), (d), (f) SCI – Mn0.5Cu1B.
Figure 5.
EDS Mapping analysis of B, Cu in spheroidal graphite cast iron: (a), (c), € SCI – Mn0.5Cu1; (b), (d), (f) SCI – Mn0.5Cu1B.
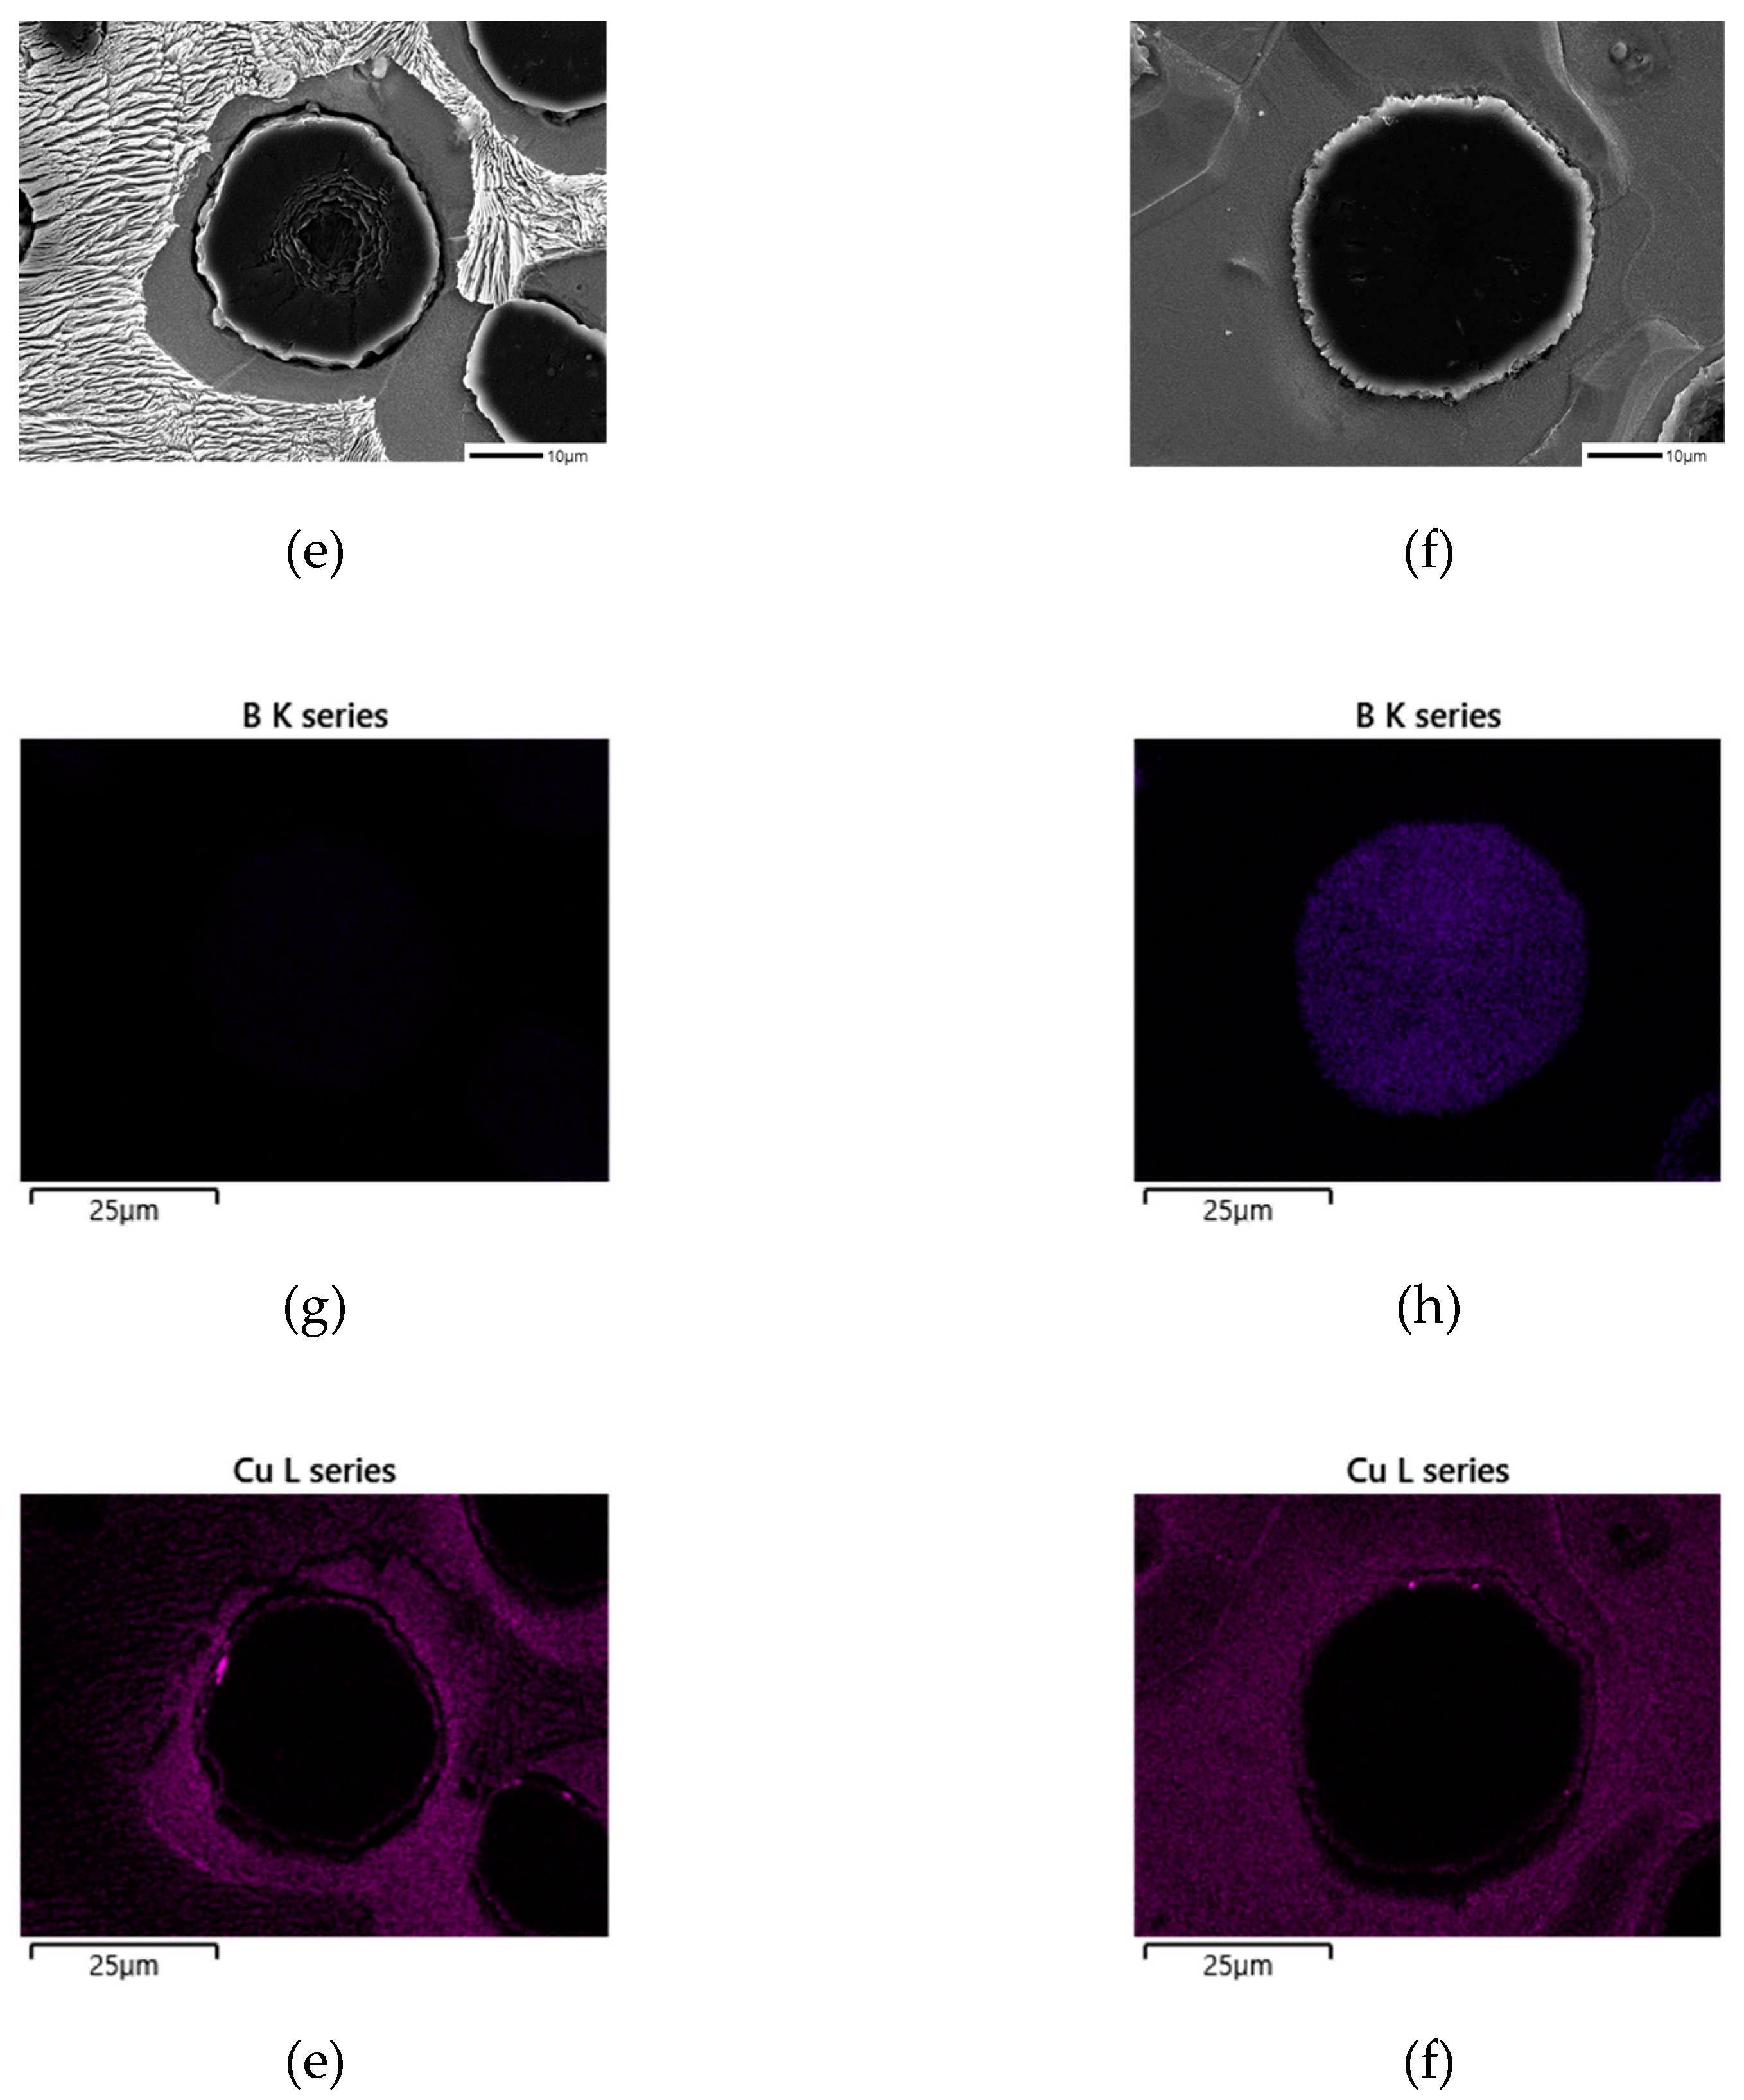
Figure 6.
Result from a DSC run for samples with a heating rate 10°C/min to 1300°C: (a) SCI – Mn0.5Cu0.5; (b) SCI – Mn0.5Cu0.5B.
Figure 6.
Result from a DSC run for samples with a heating rate 10°C/min to 1300°C: (a) SCI – Mn0.5Cu0.5; (b) SCI – Mn0.5Cu0.5B.
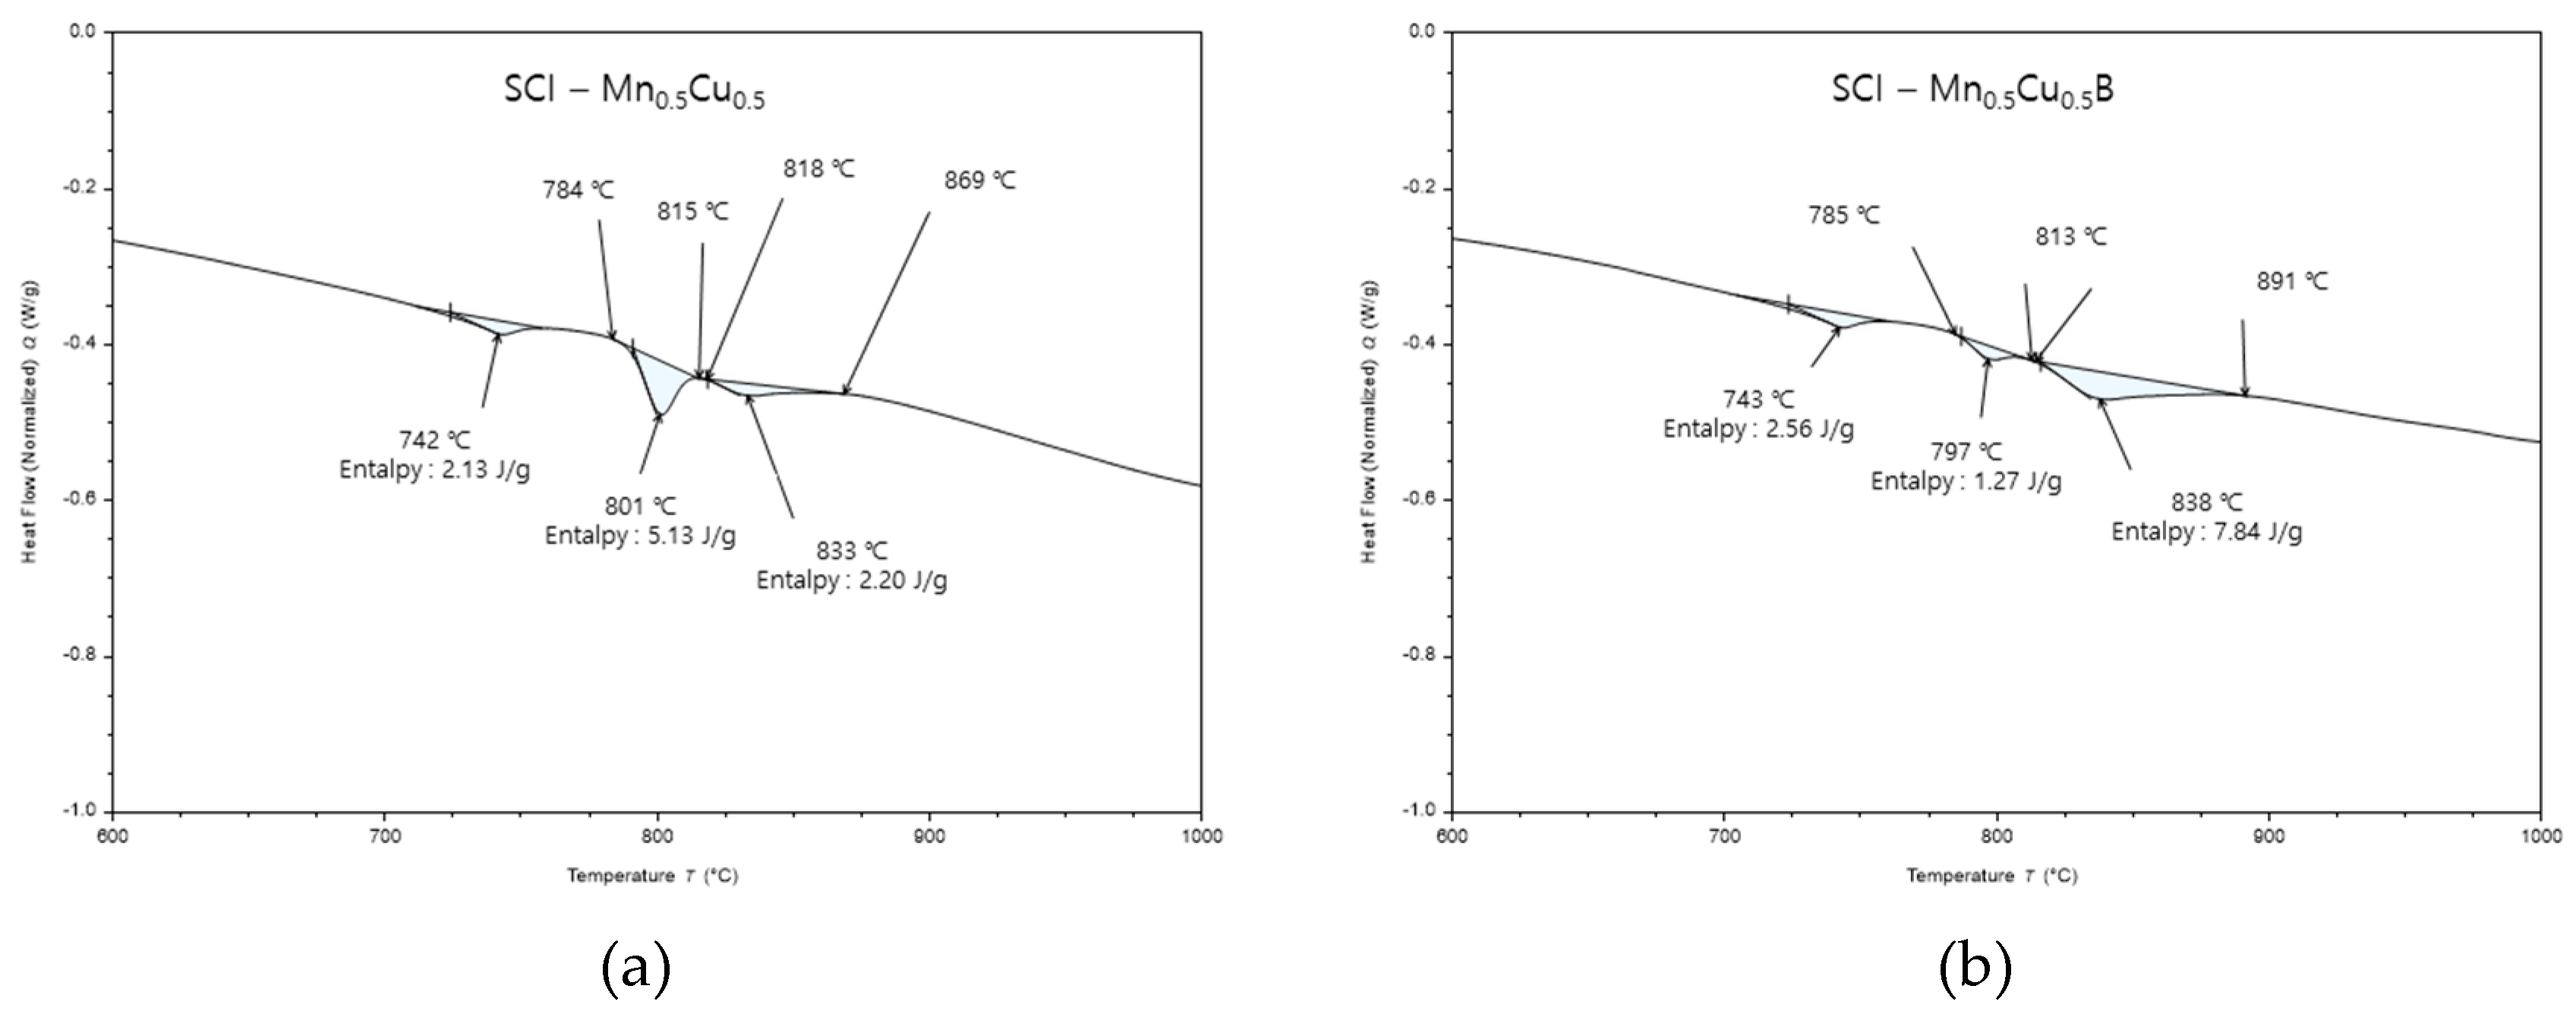
Figure 7.
Mechanical properties: (a) Tensile strength; (b) Yield strength of specimens..
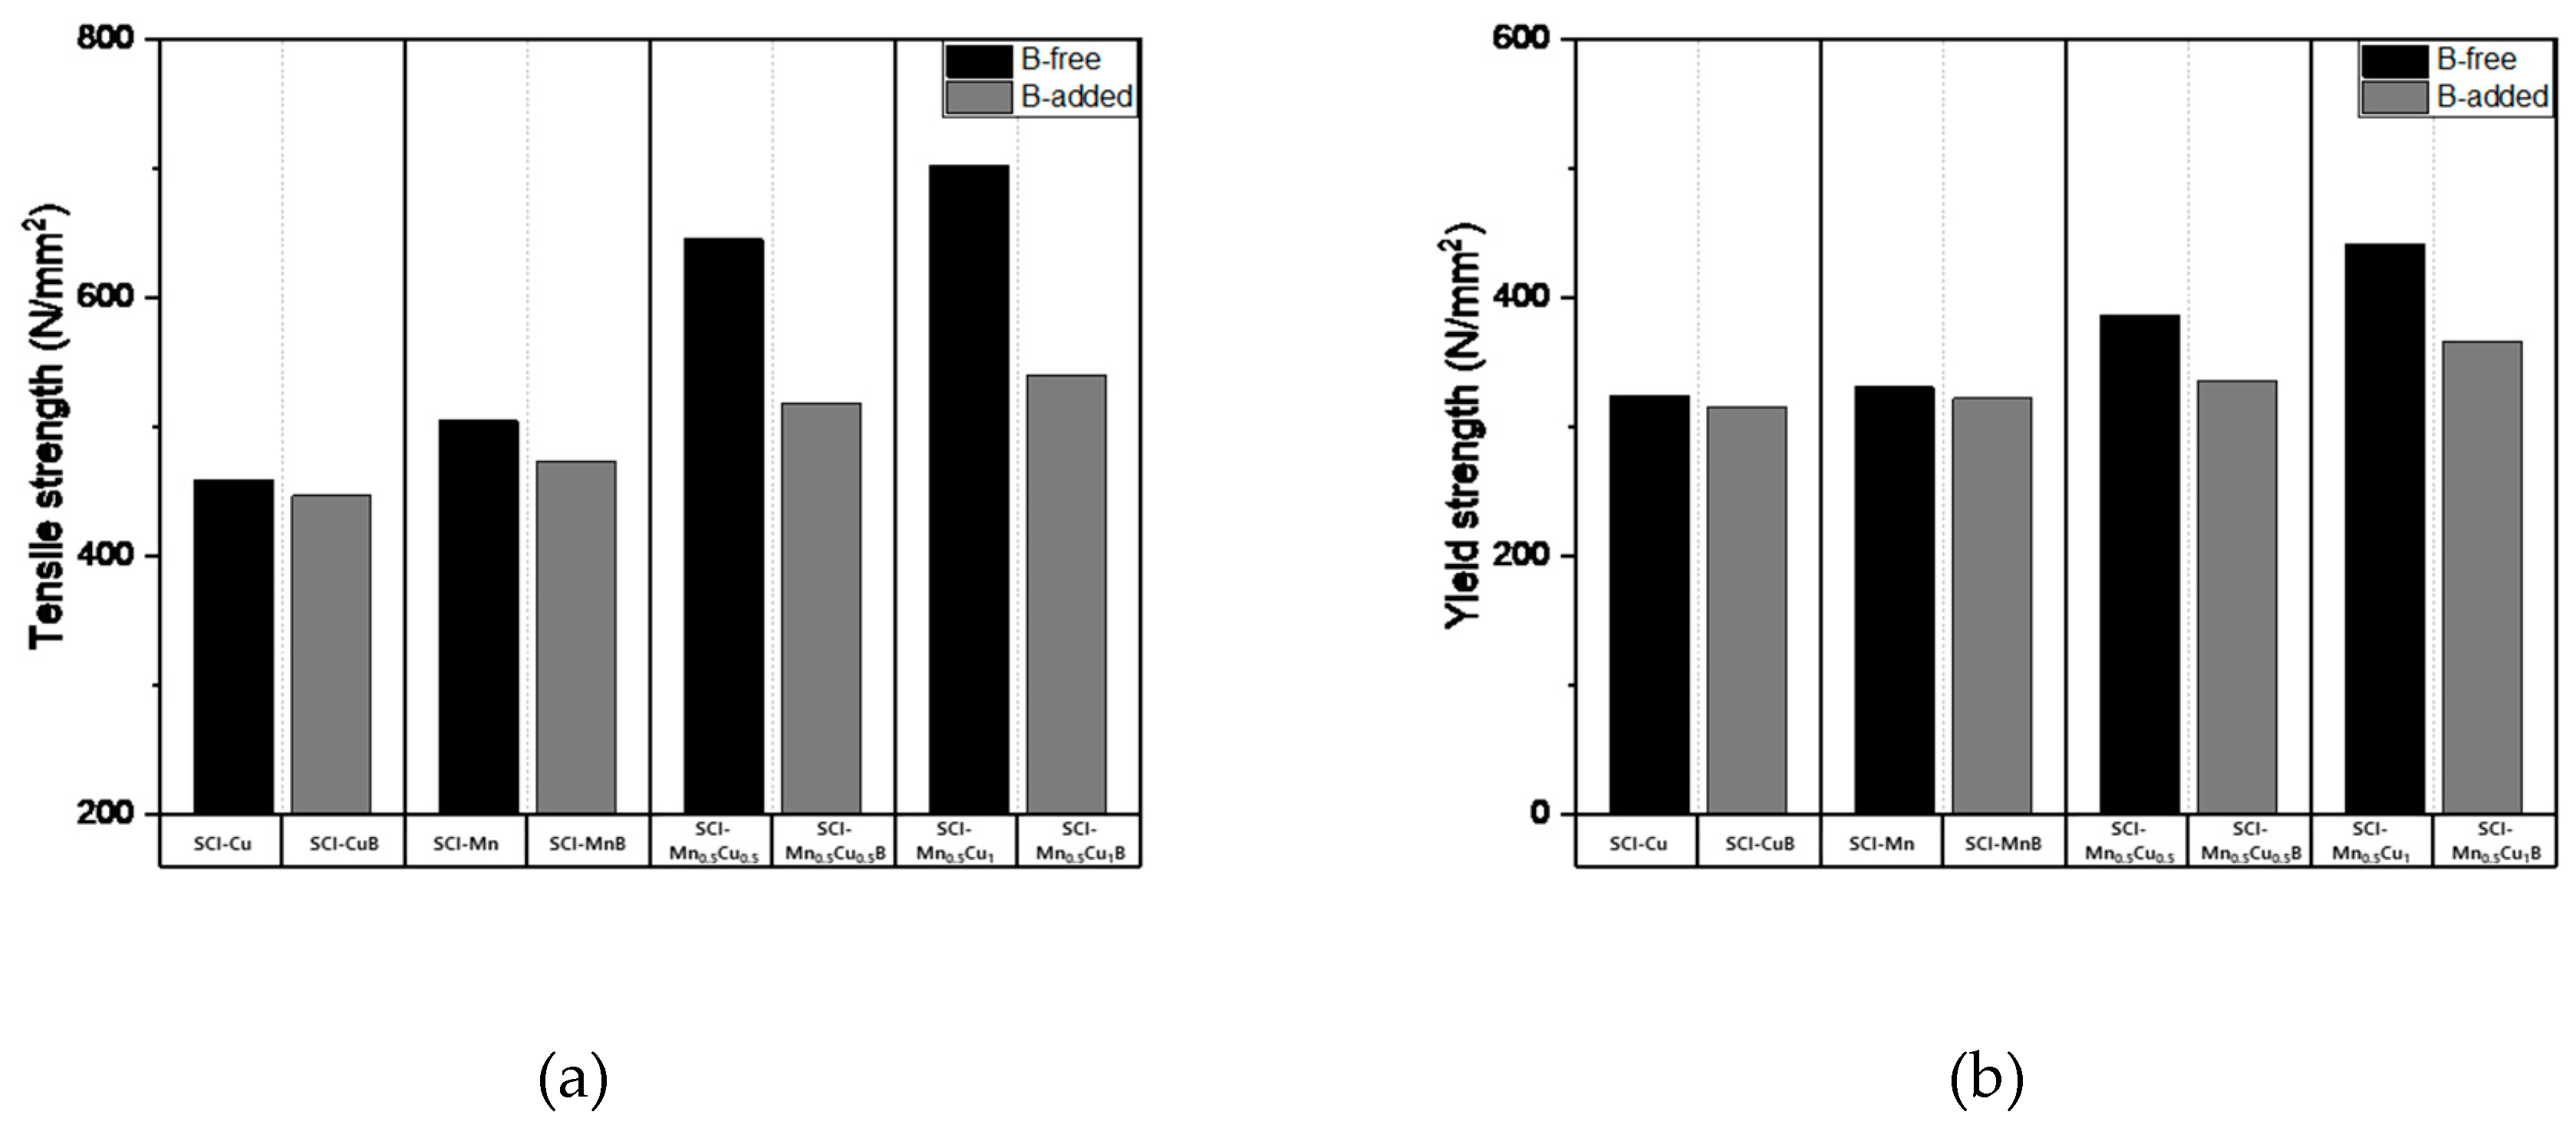
Figure 8.
Mechanical properties: (a) Brinell hardness; (b) Elongation of specimens.
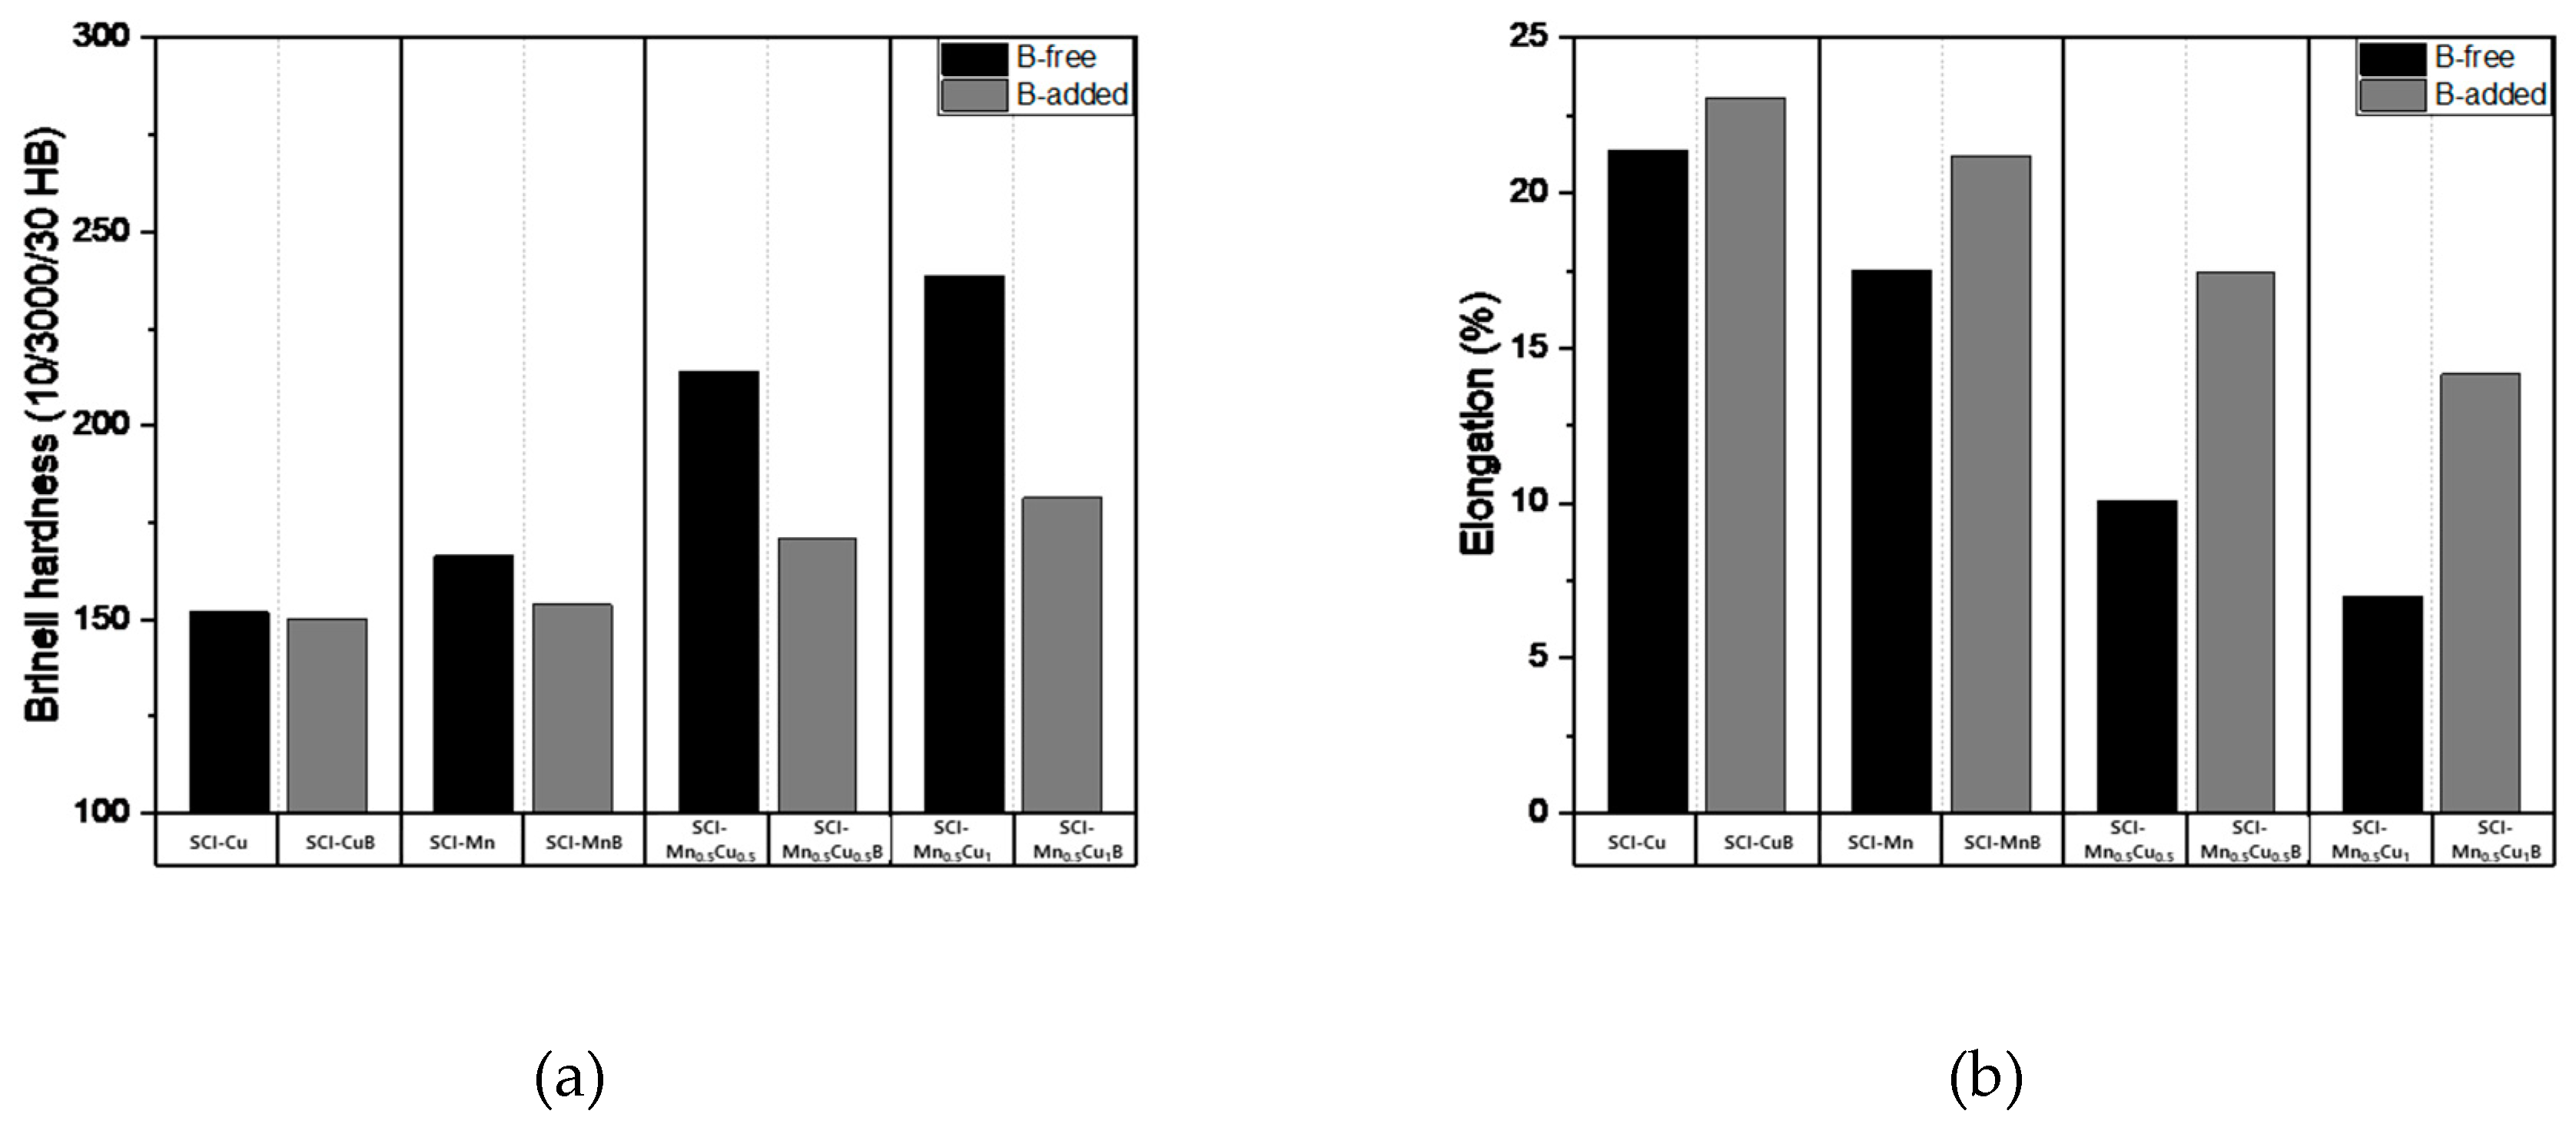
Figure 9.
Impact energy of specimens.
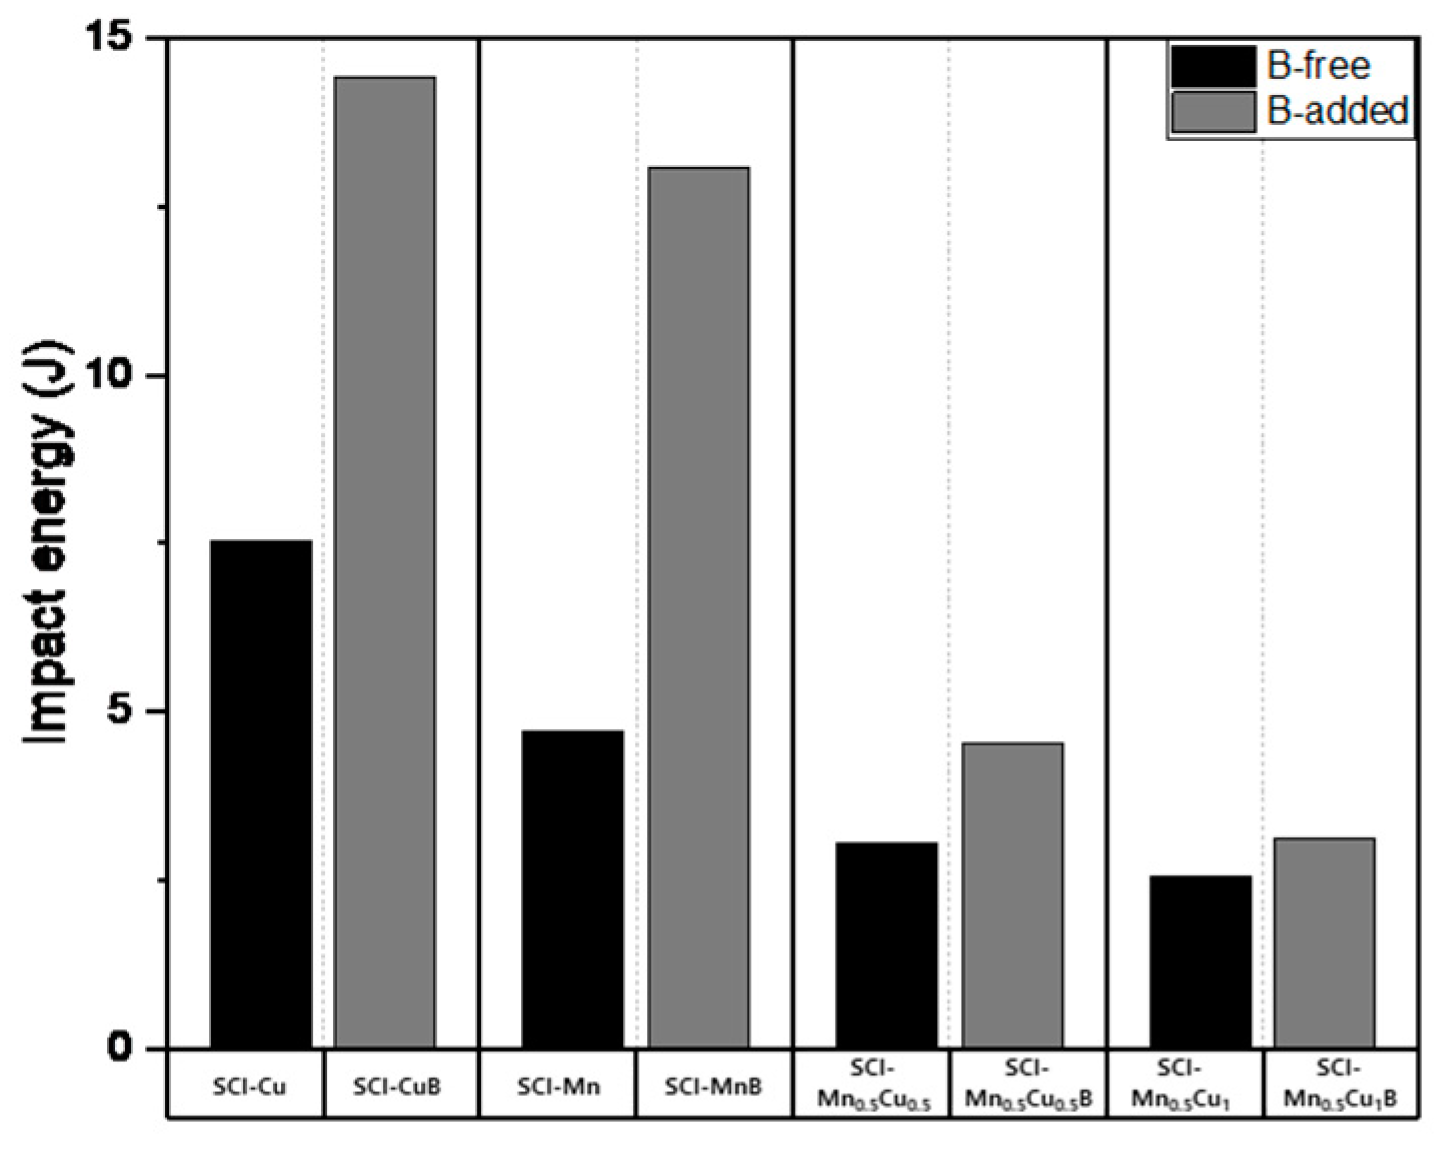
Figure 3.
Fraction of specimens: (a) SCI - Mn0.5Cu0.5; (b) SCI - Mn0.5Cu0.5B; (c) SCI – Mn0.5Cu1; (d) SCI - Mn0.5Cu1B.
Figure 3.
Fraction of specimens: (a) SCI - Mn0.5Cu0.5; (b) SCI - Mn0.5Cu0.5B; (c) SCI – Mn0.5Cu1; (d) SCI - Mn0.5Cu1B.
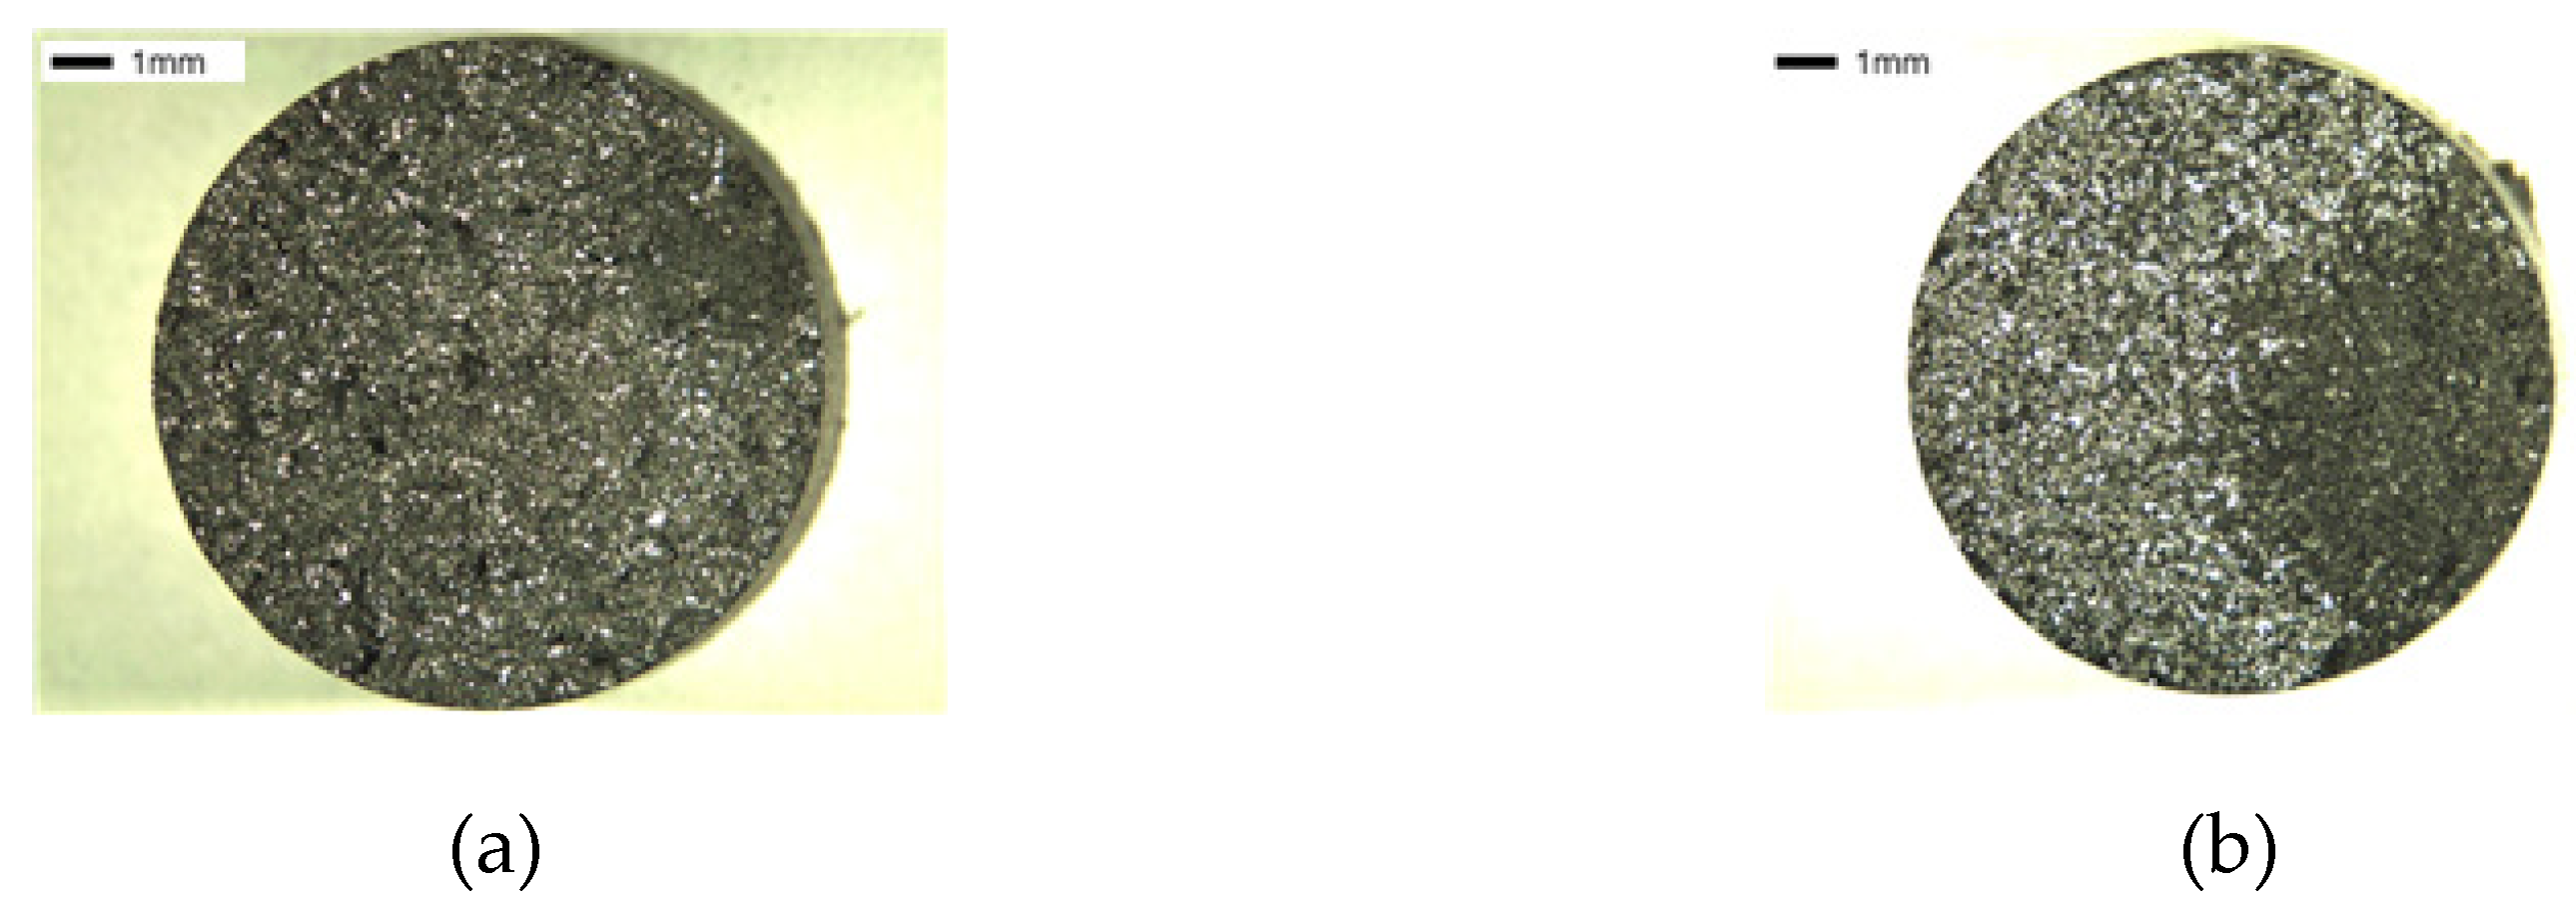
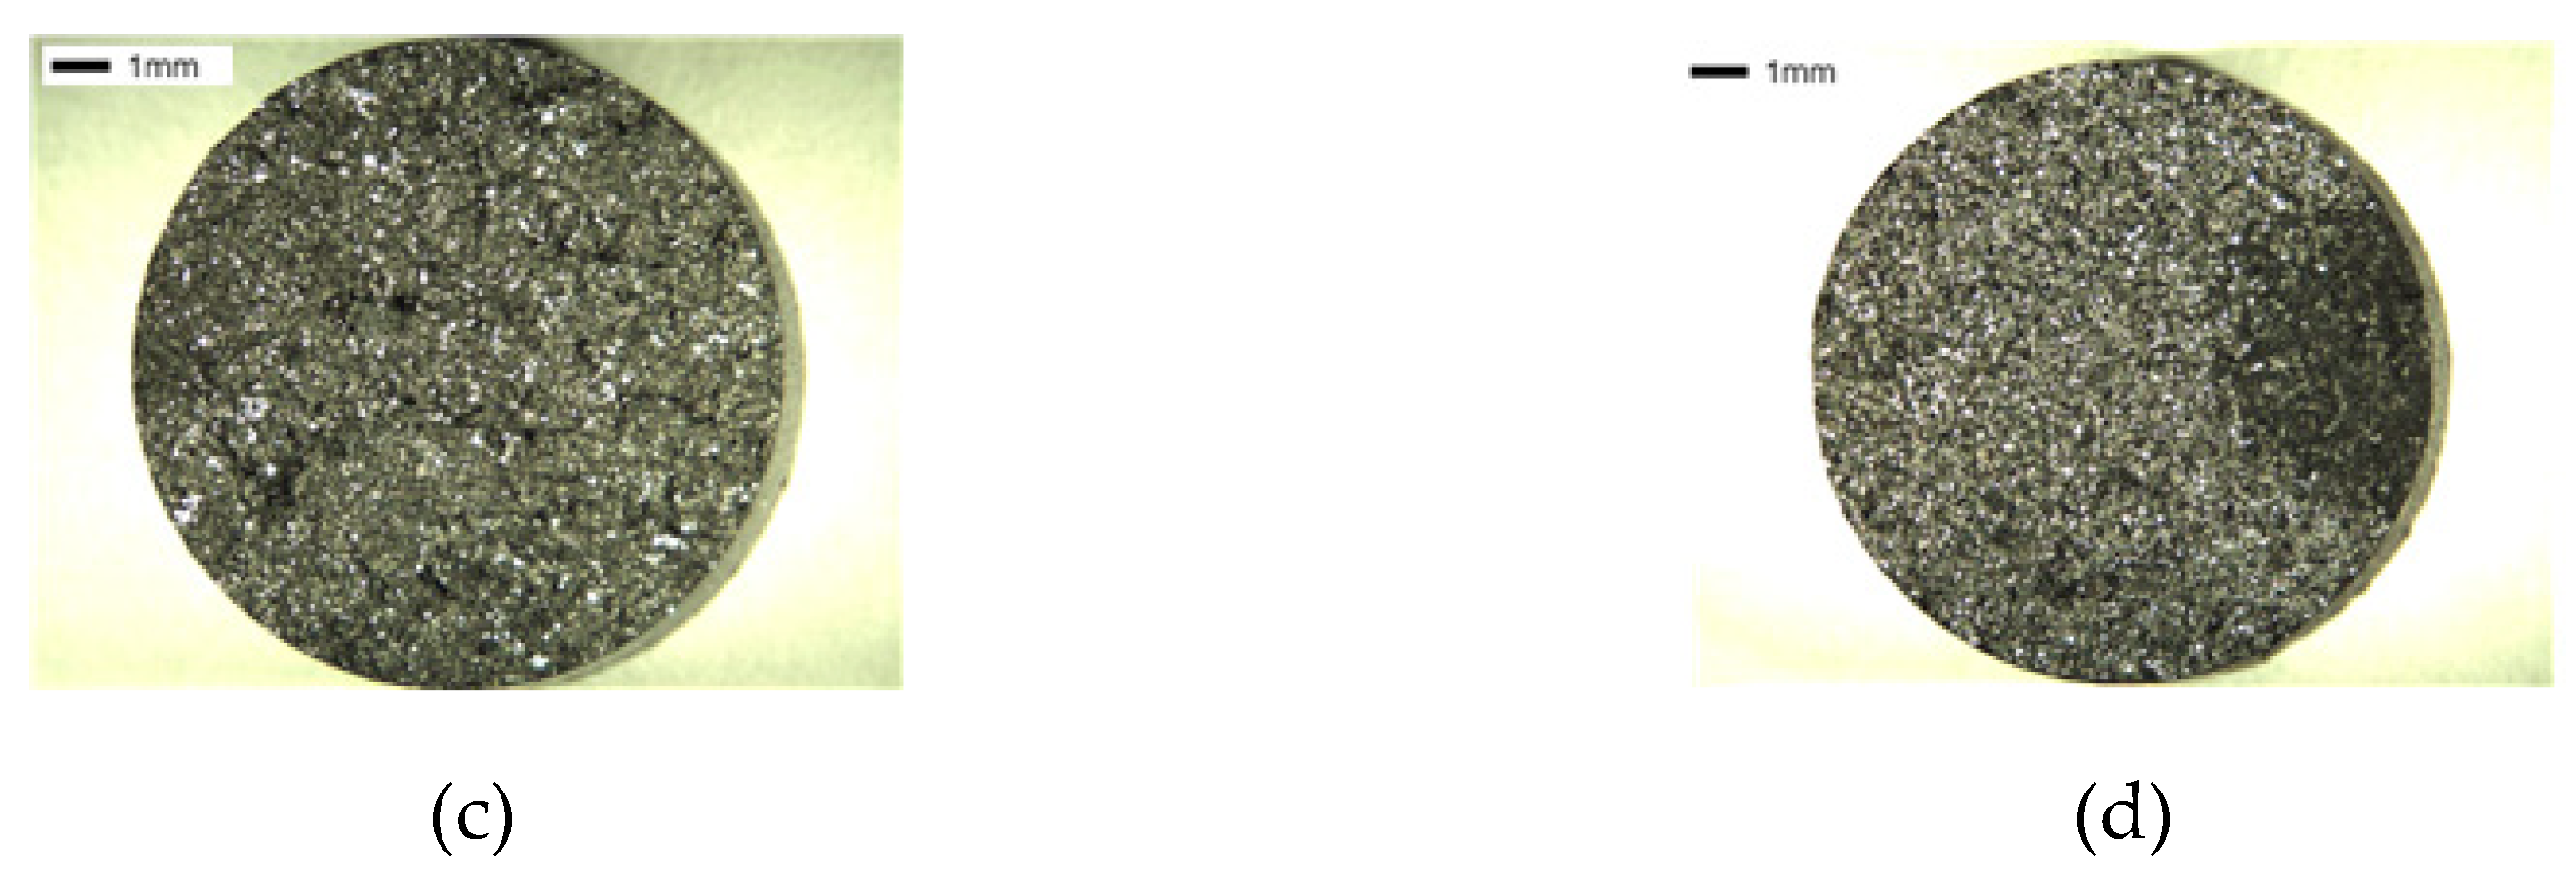

Table 1.
Target chemical composition of specimens (wt%).
| Samples | C | Si | P | S | Mg | Mn | Cu | B |
|---|---|---|---|---|---|---|---|---|
| SCI - Cu SCI - CuB SCI - Mn SCI - MnB SCI - Mn0.5Cu0.5 SCI - Mn0.5Cu0.5B SCI - Mn0.5Cu1 SCI - Mn0.5Cu1B |
3.50 | 2.60 | 0.04 | 0.01 | 0.045 | 0.04 | 0.30 | 0.0000 |
| 3.50 | 2.60 | 0.04 | 0.01 | 0.045 | 0.04 | 0.30 | 0.0025 | |
| 3.50 | 2.60 | 0.04 | 0.01 | 0.045 | 0.5 | 0.00 | 0.0000 | |
| 3.50 | 2.60 | 0.04 | 0.01 | 0.045 | 0.5 | 0.00 | 0.0025 | |
| 3.50 | 2.60 | 0.04 | 0.01 | 0.045 | 0.5 | 0.50 | 0.0000 | |
| 3.50 | 2.60 | 0.04 | 0.01 | 0.045 | 0.5 | 0.50 | 0.0025 | |
| 3.50 | 2.60 | 0.04 | 0.01 | 0.045 | 0.5 | 1.00 | 0.0000 | |
| 3.50 | 2.60 | 0.04 | 0.01 | 0.045 | 0.5 | 1.00 | 0.0025 |
Table 2.
Result microstructure properties of each samples.
| Samples | Nodule Count (Count/mm2) |
Graphite Size (μm) |
Graphite Area (%) |
Ferrite Ratio (%) |
|---|---|---|---|---|
| SCI – Cu SCI – CuB SCI – Mn SCI – MnB SCI – Mn0.5Cu0.5 SCI – Mn0.5Cu0.5B SCI – Mn0.5Cu1 SCI – Mn0.5Cu1B |
196.83 | 19.60 | 11.65 | 92.54 |
| 186.83 | 20.41 | 13.71 | 94.84 | |
| 259.60 | 16.83 | 12.12 | 73.35 | |
| 203.58 | 19.65 | 13.40 | 82.94 | |
| 282.55 | 15.21 | 11.36 | 34.15 | |
| 264.83 | 15.87 | 13.36 | 65.33 | |
| 338.22 | 14.08 | 12.26 | 22.13 | |
| 291.50 | 16.09 | 13.58 | 65.13 |
Table 3.
Chemical composition of samples (wt%).
| Samples | C | Si | P | S | Mg | Mn | Cu | B |
|---|---|---|---|---|---|---|---|---|
| SCI – Cu SCI – CuB SCI – Mn SCI – MnB SCI – Mn0.5Cu0.5 SCI – Mn0.5Cu0.5B SCI – Mn0.5Cu1 SCI – Mn0.5Cu1B |
3.54 | 2.68 | 0.04 | 0.01 | 0.04 | 0.08 | 0.28 | 0.0000 |
| 3.42 | 2.75 | 0.04 | 0.01 | 0.04 | 0.08 | 0.27 | 0.0029 | |
| 3.37 | 2.58 | 0.04 | 0.01 | 0.04 | 0.51 | 0.02 | 0.0000 | |
| 3.28 | 2.60 | 0.04 | 0.01 | 0.03 | 0.52 | 0.01 | 0.0024 | |
| 3.55 | 2.53 | 0.04 | 0.01 | 0.04 | 0.52 | 0.47 | 0.0000 | |
| 3.50 | 2.58 | 0.04 | 0.01 | 0.04 | 0.52 | 0.48 | 0.0025 | |
| 3.60 | 2.62 | 0.04 | 0.01 | 0.05 | 0.56 | 0.99 | 0.0000 | |
| 3.45 | 2.63 | 0.04 | 0.01 | 0.04 | 0.56 | 0.99 | 0.0028 |
Table 4.
DSC results of samples ; Tc : Curie temperature, Tp : α + Fe3C -> γ temperature, Tf : α -> γ temperature, ΔHp : α + Fe3C -> γ enthalpy, ΔHf : α -> γ enthalpy.
Table 4.
DSC results of samples ; Tc : Curie temperature, Tp : α + Fe3C -> γ temperature, Tf : α -> γ temperature, ΔHp : α + Fe3C -> γ enthalpy, ΔHf : α -> γ enthalpy.
| Samples | Tc (°C) |
Tp (°C) |
Tf (°C) |
ΔT (°C) |
ΔHp (J/g) |
ΔHf (J/g) |
|---|---|---|---|---|---|---|
| SCI – Cu SCI – CuB SCI – Mn SCI – MnB SCI – Mn0.5Cu0.5 SCI – Mn0.5Cu0.5B SCI – Mn0.5Cu1 SCI – Mn0.5Cu1B |
748 | 800 | 845 | 45 | 0.00 | 6.75 |
| 747 | 796 | 854 | 59 | 0.00 | 11.85 | |
| 746 | 793 | 839 | 46 | 1.08 | 7.97 | |
| 746 | 787 | 840 | 53 | 0.64 | 8.66 | |
| 742 | 801 | 833 | 32 | 5.13 | 2.20 | |
| 743 | 797 | 838 | 41 | 1.27 | 7.84 | |
| 739 | 800 | 835 | 35 | 8.67 | 0.91 | |
| 739 | 797 | 835 | 38 | 1.85 | 4.06 |
Table 5.
Mechanical properties of samples.
| Samples | TS (N/mm2) |
E (%) |
YS (N/mm2) |
HB (10/3000/30) |
Impact Energy (J) |
|---|---|---|---|---|---|
| SCI – Cu SCI – CuB SCI – Mn SCI – MnB SCI – Mn0.5Cu0.5 SCI – Mn0.5Cu0.5B SCI – Mn0.5Cu1 SCI – Mn0.5Cu1B |
459.28 | 21.38 | 324.36 | 152.00 | 7.53 |
| 446.93 | 23.07 | 315.36 | 150.00 | 14.43 | |
| 504.89 | 17.51 | 331.17 | 166.33 | 4.70 | |
| 473.77 | 21.19 | 322.46 | 153.75 | 13.09 | |
| 645.49 | 10.08 | 386.46 | 214.00 | 3.05 | |
| 518.62 | 17.45 | 335.74 | 171.00 | 4.54 | |
| 703.15 | 7.01 | 442.05 | 238.67 | 2.55 | |
| 539.95 | 14.16 | 366.02 | 181.33 | 3.13 |
Disclaimer/Publisher’s Note: The statements, opinions and data contained in all publications are solely those of the individual author(s) and contributor(s) and not of MDPI and/or the editor(s). MDPI and/or the editor(s) disclaim responsibility for any injury to people or property resulting from any ideas, methods, instructions or products referred to in the content. |
© 2023 by the authors. Licensee MDPI, Basel, Switzerland. This article is an open access article distributed under the terms and conditions of the Creative Commons Attribution (CC BY) license (https://creativecommons.org/licenses/by/4.0/).
Copyright: This open access article is published under a Creative Commons CC BY 4.0 license, which permit the free download, distribution, and reuse, provided that the author and preprint are cited in any reuse.


