
Submitted:
04 May 2023
Posted:
05 May 2023
You are already at the latest version
Abstract
Plasma treatment of livestock slurry and biogas digestate is a method by which the nitrogen content of organic fertilizers can be increased. The resultant nitrogen-enriched organic fertilizer (NEO) contains twice as much plant-available nitrogen, and its pH is reduced, which is known to reduce ammonia volatilization. The current study included 14 spring wheat and barley field trials in Norway fertilized by NEO and other fertilizers over three years. The results showed that 120 kg N ha-1 in NEO yielded the same as 95 kg N ha-1 in mineral fertilizer considering the grain yields and 100 kg N ha-1 regarding the harvested nitrogen yield in the grains. On average, 39 tons ha-1 of untreated slurry supplemented with mineral fertilizers Opti-NS up to 120 kg N ha-1 yielded 5083 kg ha-1 of barley and 5290 kg ha-1 of spring wheat. Filtrating 39 tons of untreated slurry and running it through the N2 Applied unit gave 35 tons of NEO with 120 kg N. 35 tons ha-1 of NEO yielded 5068 kg ha-1 of barley and 5155 kg ha-1 of spring wheat. Filtrating the slurry increased grain yields by 756 and 447 kg ha-1 in spring wheat and barley, respectively, compared to the untreated slurry. 120 kg N ha-1 in mineral fertilizer yielded 5443 kg of barley and 6123 kg of spring wheat. Combining 12 kg N ha-1 in mineral fertilizer at sowing day and 108 kg N ha-1 in NEO at three leaves stage led to a higher yield in spring wheat than 120 kg ha-1 NEO spread at sowing day in two out of three experimental years.
Keywords:
agronomy
; N2 Applied
; field crops
; fertilization
; innovation
; wheat
; barley
; nitrogen
1. Introduction
Global food production systems are facing many challenges. The food demand is increasing in parallel with human population growth [1], and production is being reduced increasingly by global warming and soil damage [2]. At the same time, agroecosystems face high societal expectations to make food production more sustainable [3,4,5,6].
Over the last twelve years, the Norwegian company N2 Applied has developed a unit to enhance the nitrogen content of slurry or digestate, with electricity and air as the only inputs [7,8,9]. The process uses high electrical energy to generate an air plasma, where oxygen and nitrogen combine to form a reactive nitrogen gas. The NOx is subsequently absorbed in the slurry as nitrate and nitrite, enriching the slurry with plant-available nitrogen and reducing the pH. The plasma-treated slurry is termed Nitrogen Enriched Organic fertilizers, shortened to NEO. The unit is now available for scientific use and test producers and might be launched for commercial sale in Europe in 2023.
Inland Norway University of Applied Sciences has, over three years (2020 to 2022) conducted trials in cereal and grass fields as well as in growth chambers. The results from the growth chamber trials are published [10] as well as studies that focused on determining the effects of NEO on soil health [11,12]. In this study, we focus on the effects of NEO in our field trials in spring barley (Hordeum vulgare L.) and spring wheat (Triticum aestivum L.), hereafter simply termed barley and wheat.
Since NEO is a novel product with potentially beneficial gains, the effects on plant yields should be elucidated before being introduced into the global markets. Therefore, this study aims to determine the effect of NEO made from cattle slurry on cereal yields in Norway compared to farmers' alternatives, such as mineral fertilizers and untreated cattle slurry.
2. Materials and Methods
2.1. Experimental Design
Field trials were located at four representative areas for cereal production in Norway: 1. Tønsberg; 2. Årnes; 3. Hamar; and 4. Stjørdal (Figure 1). Details on the locations and soil types are provided in Table 1. The trials were designed to determine the fertilizer effect of NEO compared to the farmers' alternatives: The farmer can use the untreated slurry directly in the field, supply the untreated slurry with an N mineral fertilizer, or use only a complete mineral fertilizer. The NEO can be applied to the field the same day as sowing, or NEO can be spread at three leaves stage of the plants after using a small amount of mineral fertilizer before sowing [13]. The N2-Applied unit needs filtrated slurry. Therefore, we also tested filtrated slurry in the trials in 2020. To examine the fertilizing effect and the nitrogen value of the NEO and the other alternatives for cattle slurry, we designed a nitrogen "ladder" of treatments with different N levels in mineral fertilizer.
The experimental design consisted of two series. In series 1 trials, the initial design during the 2020 season consisted of two trials in Hamar. In 2021 the two trials in Hamar were continued, while two new trials were established in Årnes. The results obtained in 2020 were indicative enough to argue that the filtered slurry has a yield-gaining effect. Therefore, we turned the plots having the filtrated slurry treatment in 2020 into a control treatment with no fertilizers in series 1 in the 2021 and 2022 trials. Another result from 2020 was that NEO applied at three leaf stage of grain plants yielded less than NEO applied on sowing day. Therefore, based on the experiences from 2020, we designed another series of trials - series 2, where we increased the N-level treatments in mineral fertilizers to compare NEO's yield effect even better and left out the NEO application on three leaf stage treatment.
We analyzed probes from all the trial plots for N percentage with the Dumas method to find the Nitrogen yields.
2.2. Fertilizers
In the trials, we used the following fertilizers:
• Untreated slurry: Cattle Slurry from the Norwegian University of Life Sciences farm.
• NEO (Nitrogen Enriched organic fertilizer): This is the same slurry as «Untreated slurry» processed through the N2 Applied unit. The available nitrogen in NEO is around 50 % ammonia, 30 % nitrate, and 20 % nitrite, and the acidity is down to around pH 5,2. The relative levels of nitrate and nitrite vary quite a lot. See Table 2.
• Mineral fertilizer 18-3-15: A commercially available mineral fertilizer produced by Yara [14] with 18 % nitrogen (N); 3 % phosphorus (P), and 15 % potassium (K). The 18 % N consists of slightly more ammonia than nitrate. This fertilizer was chosen due to the similarities in plant available nutrients to NEO.
• Mineral fertilizer Opti-NS (27-0-0) [15]: This is an N fertilizer combined with sulfur (S) (3,6 %) and where the N consists of equal amounts of ammonia and nitrate.
During the production process through the N2-Applied's plasma reactor, the untreated slurry is filtrated for all solid particles larger than 5 millimeters using a screw press, lowering the original volume by 10%. The pulp filtered out has a consistency like soft coarse peat. The filtration and the plasma treatment turn the liquid fertilizer into NEO, which is more rapidly infiltrated into the soil than untreated liquid slurry.
To calculate the amounts of NEO and other fertilizers that should be added to the different trial plots, the company sent samples to AnalyTech Environmental Laboratory in Denmark. In 2021 and 2022, the analysis was taken from the Untreated manure and the ready-produced NEO two weeks before it should be sent to the experimental sites. Table 2 indicates NEO and untreated slurry's nitrogen and pH values in 2020, 2021, and 2022.
In 2020 N2 Applied made a test production of NEO in March and then sent probes for testing of nitrogen content to the Danish lab. Based on the results, we calculated the fertilizer amounts for the trials in 2020. Unfortunately, when the company produced the NEO that should have been used in the field trials, they made a mistake in the production, resulting in the NEO used in the trials having lower nitrogen content than we had used in our calculations. Consequently, the results from the trials in 2020 are valid as they are. However, they are not directly comparable and, therefore, can only be used as supporting material for the results from 2021 and 2022.
The main objective of our studies was to determine the yield effects of treating cattle slurry through the N2 Applied unit, compared to the yield effect of farmers' other alternatives. As a base, we used 120 kg N ha-1 for both wheat and barley, knowing that this level is typical for barley in the grain regions of Norway but somewhat lower than commonly used for spring wheat. To reach 120 kg of nitrogen per ha, we had to process about 40 tons of cattle slurry through the N2 Applied's plasma process unit after filtration. Thus, 40 tons of cattle slurry turns into 37 tons of NEO containing 120 kg of nitrogen. In our trials, we used the following treatments in series 1 and series 2 over three years:
Treatments in series 1 in 2020:
In 2020 we had two trials in series 1. Unfortunately, due to the above-explained production mistake, the nitrogen content in the cattle slurry-based treatments ended up being different in 2020 than in 2021 and 2022:
MaF51: 51 kg N ha-1 in filtrated untreated slurry.
Ma56: 56 kg N ha-1 in untreated slurry
NEO102: 102 kg N ha-1 in NEO
MiNEO 104: 12 kg N ha-1 in mineral fertilizer 18-3-15 applied to the trial plots before sowing and 92 kg N/ ha-1 in NEO at Zadoks GS13 three leaves stage.
Mi51: 51 kg N ha-1 in mineral fertilizer 18-3-15
Mi91: 91 kg N ha-1 in mineral fertilizer 18-3-15
Mi123: 123 kg N ha-1 in mineral fertilizer 18-3-15
MaMi123: 56 kg N ha-1 in untreated slurry combined with 6,7 kg N ha-1 in mineral fertilizer Opti-NS
Treatments in series 1 in 2021 and 2022:
NoF: No fertilizer
Ma65: 65 kg N ha-1 in untreated slurry (manure).
NEO120: 120 kg N ha-1in NEO
MiNEO 120: 12 kg N ha-1 in mineral fertilizer 18-3-15 applied to the trial plots before sowing and 108 kg N/ ha-1in NEO at Zadoks GS13 three leaves stage.
Mi65: 65 kg N ha-1 in mineral fertilizer 18-3-15
Mi91: 91 kg N ha-1 in mineral fertilizer 18-3-15
Mi120: 120 kg N ha-1 in mineral fertilizer 18-3-15
MaMi120: 65 kg N ha-1 in untreated slurry combined with 55 kg N/ha in mineral fertilizer Opti-NS
Treatments in series 2 in 2021 and 2022:
NoF: No fertilizer
NEO120: 120 kg N ha-1 in NEO
Ma65: 65 kg N ha-1 in untreated slurry.
MaMi120: 65 kg N ha-1 in untreated slurry and 55 kg N ha-1 in mineral fertilizer Opti-NS.
Mi30: 30 kg N ha-1 in mineral fertilizer 18-3-15
Mi55: 55 kg N ha-1 in mineral fertilizer 18-3-15
Mi80: 80 kg N ha-1 in mineral fertilizer 18-3-15
Mi105: 105 kg N ha-1 in mineral fertilizer 18-3-15
Mi120: 120 kg N ha-1 in mineral fertilizer 18-3-15
Both slurry and NEO have different N contents from one year to another. Considering this, compromises were made to keep the nitrogen content per hectare constant from year to year as the most decisive factor. In 2021 the N-content in NEO was 3.2 kg N ton-1, and we aimed for fertilization with 120 kg N ha-1 in NEO, accordingly 37.5 tons ha-1. As mentioned, 10% of cattle slurry is filtrated through NEO production. Thus, the farmers' alternative is to spread 41 tons ha-1 of untreated slurry. In 2021 the N-content in the untreated slurry was 1.5 kg N ton-1. This year, applying 41 tons ha-1 of untreated slurry to the trial plots provided 61.5 kg N/ ha-1. In 2022 the NEO had 3.55 kg N ton-1, resulting in 34 tons ha-1 of NEO reaching 120 kg N ha-1. The untreated had 1.75 kg N ton-1, and with a 10 % higher volume than NEO, we applied 37 tons ha-1 of untreated slurry – resulting in 65 kg N ha-1. With this clarification, we used 65 kg N ha-1 in the graph labels for the untreated slurry for 2021 and 2022.
It is also necessary to clarify a point regarding the mineral fertilizer plus NEO treatment (MiNEO120). In earlier testing of NEO, the N2 Applied company had experienced that NEO could be applied to cereal plants after germination. Therefore, we agreed to test this in series 1 by forming the MiNEO120 treatment, where we applied 12 kg N ha-1 in mineral fertilizer Yara Mila complete fertilizer 18-3-15 (Yara, Oslo, Norway) to the trial plots before sowing, combined with 108 kg N ha-1 in NEO applied at three leaves stage Zadoks GS13 [16]. All the other treatments were made on sowing day by spreading the fertilizers to the trial plots and mixing them into the soil using a disc harrow. The grain was sown a few hours after that.
Therefore, comparing MiNEO120 with NEO120 is technically correct. However, comparing MiNEO120 with the other treatments is incorrect because we do not know whether yield differences between MiNEO120 and other fertilizer treatments are due to the fertilizer type, the timing for application, or a combination of type and timing.
2.3. Weather Conditions
Table 3 presents the average temperature, precipitation, and the corresponding normal values for May in all trial locations over the three years 2020-2022. Series 1 had trials in Hamar and Årnes. 2020 in Hamar was 1,4°C colder than average and less than half of the normal precipitation. In 2021, Hamar and Årnes had a normal average temperature but about 20 % more precipitation than normal. In 2022 Hamar had a normal average temperature but a dry month of May with 23,2 mm less precipitation than the normal of 55 mm. The trials in Series 2 were in Tønsberg and Stjørdal. Tønsberg had 24 mm more rain than average in 2021 and about half the normal precipitation in 2022. Stjørdal had a dry month in May, with half the normal precipitation in 2021 and average rainfall in 2022 [17].
2.4. Data Handling and Statistics
Field trial data were first analyzed using ANOVA and Duncan multiple range tests of the means. Then the N effect of NEO was calculated against the nitrogen effect of mineral fertilizer. This was possible as we included a mineral fertilization ladder ranging from 0 kg N-min ha-1 to 120 kg N-min ha-1. A linear regression model expressed the relationship between N provided in mineral fertilization (x-axis) and grain yield (y-axis). The same was done for the N yield data. The regression equations were thereafter used to calculate the N effect of 120 kg N-min ha-1 provided in NEO based on yield and N yield data, respectively. This procedure was repeated for each of the trials and finally across all trials, with 95% confidence intervals. Statistical analyses were done in SPSS software (© 2021 IBM (New York, USA). Excel (© 2021 Microsoft (Seattle, USA), and Minitab 21 (2023 Minitab, LLC (State College, PA, USA)), were used for the graphics
3. Results
3.1. Grain Yield and Nitrogen Yield in Barley and Wheat – Series 1 2020
Looking at the standard error range of means, the two trials in series 1 in 2020 were of high quality. However, the 2020 trials are incompatible with the trials in the same series in 2021 and 2022 due to the differences in nitrogen application levels, as explained in section 2.2. Knowing this, the barley and wheat trials in 2020 still give valuable results.
Grain yield in barley (Figure 2A): NEO102 gave the same yield as MiNEO104, Mi91, and MaMi123. Mi123 significantly yielded most of all treatments. MaF51 gave 448 kg ha-1 a nearly significantly higher yield than Ma56.
Grain yield in wheat (Figure 2A): NEO102 significantly yielded 469 kg ha-1 more wheat than MiNEO104, almost the same as Mi91 and MaMi123. Mi123 significantly yielded most of all treatments. MaF51 gave a 756 kg ha-1, a significantly higher yield than Ma56.
Nitrogen yield in barley and wheat (Figure 2B): We observed the same pattern as the grain yield, but the differences between the treatments have increased.
3.2 Grain Yield and Nitrogen Yield in Barley and Wheat – Series 1 2021 and 2022
Here the results from the three trials in barley and three trials in wheat in series 1 in 2021 and 2022 are presented separately for grain yield and nitrogen yield. In this series, one trial (trial nr 3) gave suspiciously high grain yields and nitrogen yields in wheat by the treatment MiNEO120. In this section, we have included this trial nr 3.
Grain yield in barley (Figure 3A): Mi120 had the highest yield but not significantly 586, 610, and 793 kg ha-1 higher than MiNEO120, NEO120, and MaMi120, respectively. MiNEO120 and NEO120 gave almost equal yields. MiNEO120 and NEO120 yielded significantly more than Ma65 and in the same range as Mi91.
Grain yield in wheat (Figure 3A): Contrary to the barley results, the MiNEO120 gave the highest yield in wheat but not significantly higher than Mi120, NEO120, and MaMi120. NEO120 yielded in the same range as Mi91 but significantly higher than Ma65.
Nitrogen yield in barley (Figure 3B): The Figure shows the same pattern for nitrogen yield in barley as for grain yield.
Nitrogen yield in wheat (Figure 3B): Here, the MiNEO120 rises even higher to the highest nitrogen yield of 106,1 kg N ha-1. This is significantly higher than both NEO120 and MaMi120 and 8,7 kg more N ha-1 Mi120, but this latter difference is insignificant.
3.3. Grain Yield and Nitrogen Yield in Barley and Wheat – Series 2 2021-2022
This section presents the results from the four trials in series 2 in 2021 and 2022 for barley and wheat. There were identical fertilization treatments in series 2 as in series 1, but with two more mineral fertilizer treatments and without the MiNEO120. In series 2, there were four trials – one in spring wheat, one in barley in 2021, and the same in 2022.
Grain yield in barley (Figure 4A): MaMi120 yielded 5064 kg/ha, about the same as Mi120. Mi120 gave only 170 and not a significantly higher yield than NEO120, which gave a grain yield between Mi105 and Mi120. NEO120 gave a 646 kg ha-1 significantly higher yield than Ma65.
Grain yield in wheat (Figure 4A): MaMi120 yielded significantly 451kg ha-1 higher than NEO120. NEO120 gave about the same yield as Mi80 but 695 kg/ha, significantly higher than ma65.
Nitrogen yield in barley and wheat (Figure 4B): The results follow the same pattern for nitrogen yield both in barley and wheat as for grain yield, but the differences between treatments increased.
3.4. Nitrogen Effects: Results from all 10 Trials in Series 1 and 2 in 2021 and 2022
A critical task for our trials was determining how much nitrogen in mineral fertilizer could be replaced by NEO. To find this, we first calculated the nitrogen effects presented in Figure 5, based on the sum of all ten trials in 2021 and 2022. Only the treatments represented in both series could go into these calculations, and because of this, the MiNEO120 is left out. The Y-axis represents the nitrogen effect from the “ladder” of mineral fertilizers. NEO120 had the same effect on grain yield as 95 kg N ha-1 in mineral fertilizer and the same effect on nitrogen yield as 100 kg N ha-1 in mineral fertilizer. In other words, 95 kg N/ ha-1 in mineral fertilizer can be replaced by 120 kg N in NEO, looking at wheat and barley grain yield, and 100 kg N ha-1 in mineral fertilizer can be replaced by 120 kg N ha-1 in NEO if looking at nitrogen yield. Ma65 had the same effect on grain yield as 50 kg N ha-1 in mineral fertilizer, but the nitrogen yield from Ma65 was slightly lower. MaMi120 also gave the same grain yield nitrogen effect as 95 kg N ha-1 in mineral fertilizer. However, the nitrogen yield from MaMi120 was slightly lower.
3.5. Sum Up all Average Yields
The following table presents the average grain yields in barley and wheat from the most noteworthy treatments equal in both series 1 and 2 in 2021 and 2022 (columns 2 and 3) and series 1 only (columns 4 and 5). The treatment MiNEO120 was only part of series 1, and the six trials in this series were located in places other than the trials in series 2. Therefore, we cannot directly compare this treatment in series 1 with those in series 2.
Looking at the sum of all trials in barley and wheat (columns 2 and 3), MaMi120 yielded 5083 kg ha-1 in barley and 5290 kg ha-1 in wheat. This is the same as NEO120 gave in barley and 135 kg ha-1 more than NEO120 in wheat. MaMi120 and NEO120 yielded over 1000 kg ha-1 more than Ma65, with the highest increase in wheat. Mi120 gave 425 kg ha-1 higher yield in barley and 968 kg ha-1 higher yield in wheat than NEO 120.
Series 1 alone (columns 3 and 4) naturally shows much of the same yield differences as in the sum of all trials, but here we also included the MiNEO120. This treatment gave the same yield as NEO120 in barley but a 743 kg ha-1 higher yield than NEO120 and a 935 kg ha-1 higher yield than MaMi120 in wheat. MiNEO120 even yielded more than Mi120 in wheat.
4. Discussion
As no other peer-reviewed publications are available to compare wheat and barley crop yields with the novel NEO product, we must depend on and discuss our findings.
During the three-year study period, the untreated slurry contained a nitrogen content of 1.5 to 1.7 kg plant available N ton-1, while NEO had a nitrogen content of 3.2 to 3.55 kg plant available N ton-1. This indicates that the N2 Applied unit more than doubles the N-content in cattle slurry by adding approximately 1.5 to 1.8 kg N ton-1. In addition, the company reports that their units require 50 kWh of electricity per kg N added to the slurry. Consequently, based on an average addition of 1.65 kg N ton-1 slurry, the unit would require 82.5 kWh of electricity per ton of treated slurry.
The company also informed us that the N2 Applied unit has a daily 5-8 tons capacity. This gives 1500-2400 tons through one unit continuously running for 300 days and nights.
Our studies were not focused on optimizing crop yields but on finding the relative differences in fertilizer effect between NEO, mineral fertilizers, and other farmers' alternatives for using the slurry from cattle. The experiments were located in representative parts of Norway's most crucial grain production areas. Our primary nitrogen level was 120 kg N/ha, the same level as the average in barley and 1-2 kg lower than the average in wheat in practical farming in the region. The yields we received from 120 kg N ha-1 in mineral fertilizer were in the same range as in the official Norwegian variety trials [18].
In the first two trials held in 2020, we got a 756 kg ha-1 higher yield in wheat from filtrated slurry compared to the untreated slurry, which was a significant difference. The filtrated slurry yielded 447 kg ha-1 more than the untreated slurry in barley. Generalizing this, the fertilizer effect was increased by 10-14 percent in barley and wheat, respectively, only by filtrating the slurry, even if the filtration reduces the volume and the applied amount of nitrogen to the soil. This is most probably caused by the decreased C/N ratio in the filtrated slurry, which increases the nitrogen mineralization [19,20] and reduces the potential for both microbial nitrogen immobilization in the soil, and the N2O emissions as well [21]. This explains part of the positive yield effect from the N2 Applied technology.
How much nitrogen in mineral fertilizer can be replaced by NEO? This was the central question in the study. The most representative way to calculate this was to combine all compatible results and calculate the nitrogen effect compared to the “ladder” of different nitrogen levels in the mineral fertilizer treatments. Regarding grain yield, we found that 120 kg N ha-1 in NEO yielded the same as 95 kg N ha-1 in mineral fertilizer. Regarding nitrogen yield, 100 kg N ha-1 in mineral fertilizer yielded the same as 120 kg N ha-1 in NEO. 65 kg N ha-1 in untreated manure supplemented with 55 kg N ha-1 in mineral fertilizer also yielded the same as 95 kg N ha-1 in mineral fertilizer, considering barley and wheat grain yield. Also, 65 kg N ha-1 in untreated manure yielded the same as 50 kg N ha-1 in mineral fertilizer.
The ammonia and nitrate levels are comparable between NEO and the mineral fertilizer utilized in our experiments. The acidic pH of NEO helps stabilize its ammonium content, preventing the escape of gaseous ammonia from NEO. Considering this, it is surprising that the crop yield from 120 kg N ha-1 in NEO is equivalent to 95 kg N/ ha-1 from the mineral fertilizer. As of now, we cannot explain NEO's approximately 20 % reduced yield effect compared to mineral fertilizer, and further exploration to determine NEO's potential nitrogen loss mechanisms is needed.
Figure 2, Figure 3 and Figure 4 and Table 4 indicate the average yields for wheat and barley. The critical nitrogen value in our grain trials was 120 kg N/ha. To get 120 kg N ha-1 in NEO, we used 37.5- and 34-tons ha-1 in 2021 and 2022, respectively, due to the different nitrogen content in the NEO. The corresponding amounts of untreated slurry were 41 and 37 tons/ha, giving an average of 39 tons ha-1 of untreated slurry. Using this, we get the following yields obtained from different use of 39 tons ha-1 of cattle slurry and mineral fertilizer:
39 tons ha-1 of untreated cattle slurry yielded 4068 kg of barley and 4013 kg ha-1 of wheat.
39 tons/ha of untreated slurry supplemented with mineral fertilizers Opti-NS up to 120 kg N ha-1 yielded 5083 kg ha-1 of barley and 5290 kg ha-1 of wheat.
Filtrating 39 tons of untreated slurry and running it through the N2 Applied unit gives 35 tons of NEO with 120 kg N. 35 tons ha-1 of such NEO yielded 5068 kg ha-1 of barley and 5155 kg ha-1 of wheat.
Spreading only mineral fertilizers with 120 kg N ha-1 in Yara 18-3-15 yielded 5443 kg ha-1 of barley and 6123 kg ha-1 of wheat.
Spreading 12 kg N ha-1 in mineral fertilizer at sowing day and 108 kg N ha-1 in NEO at three leaf stage (MiNEO120) gave a 743 kg ha-1 higher yield of wheat than 120 kg N ha-1 in NEO (NEO120) spread at sowing day, and a slightly higher yield than 120 kg N ha-1 in mineral fertilizer also spread at sowing day (Mi120). In barley, MiNEO120 gave no yield increase compared to NEO120, and 586 kg ha-1, a lower yield than Mi120.
On the contrary, in 2020, our two trials with MiNEO treatment had 104 kg N ha-1 but still significantly gave a 469 kg ha-1 lower yield than NEO102 in wheat. In barley, these two treatments gave about equal yields in 2020. In our trials, we have not seen any damage to barley and wheat plants by spreading NEO on three leaves stage.
The high yield of MiNEO120 can partly be explained by the fact that there was one (trial nr 3) out of the six trials in series 1 in 2021 and 2022, where MiNEO120 gave a suspiciously high yield compared to MiNEO120 in the other five trials. We have gone through the weather conditions in the weeks after sowing and after the spreading of NEO in the MiNEO treatment, but we do not find any clear explanations here. On the other hand, it is recognized that wheat absorbs nitrogen later in the growing season than barley[22], and this may explain why MiNEO120 yielded more in wheat than in barley in most of our trials. Another part of the explanation can be that NEO gives high nitrification resulting in more plant-available nitrate over a short period of 3-4 days after application [12]. This might be beneficial to wheat [23]. All the other fertilizer treatments than MiNEO120 were applied on the day of sowing, and thus our experiments do not show how these other treatments would have performed if they had been applied partly on the sowing day and partly on the three-leaf stage, like MiNEO120.
5. Conclusions
- Nitrogen-enriched fertilizer (NEO) from cattle slurry can be spread onto barley and wheat at three leaf stage without harming the plants.
- 120 kg N ha-1 in NEO yielded the same as 95 kg N ha-1 in mineral fertilizer as average to barley and spring wheat.
- On average, 39 tons ha-1 of untreated slurry supplemented with mineral fertilizers Opti-NS up to 120 kg N ha-1 yielded 5083 kg ha-1 of barley and 5290 kg ha-1 of spring wheat.
- Filtrating 39 tons of untreated slurry and running it through the N2 Applied unit gave 35 tons of NEO with 120 kg N. 35 tons ha-1 of NEO yielded 5068 kg ha-1 of barley and 5155 kg ha-1 of spring wheat.
- Filtrating the slurry increased grain yields by 756 and 447 kg ha-1 in spring wheat and barley, respectively, compared to the untreated slurry.
- 120 kg N ha-1 in mineral fertilizer yielded 5443 kg ha-1 of barley and 6123 kg ha-1 of spring wheat.
- Combining 12 kg N ha-1 in mineral fertilizer at sowing day and 108 kg N ha-1 in NEO at three leaf stage led to a higher yield in wheat than 120 kg ha-1 NEO spread at sowing day in two out of three experiment years.
Supplementary Materials
Can be provided on request.
Author Contributions
Conceptualization, T.C. and S.Ø.S.; methodology, T.C. and S.Ø.S.; validation, T.C. and S.Ø.S.; formal analysis, H.M.; investigation, T.C.; data curation, S.Ø.S. and H.M.; writing—original draft preparation, T.C., S.Ø.S., and H.M.; writing—review and editing, T.C., S.Ø.S., and H.M.; visualization, T.C.; S.Ø.S. and H.M.; supervision, S.Ø.S.; project administration, T.C.; funding acquisition, T.C. and S.Ø.S. All authors have read and agreed to the published version of the manuscript.
Funding
This research was funded by the Research Council of Norway (grant number 309640 Plasmabehandlet husdyrgjødsel—gjødselvirkning, miljøpåvirkning og klimagassutslipp), and the Company N2 Applied.
Data Availability Statement
The data is available upon request.
Acknowledgments
The authors would like to thank the staff at NLR Trøndelag, NLR Innlandet, NLR Østafjells, and NLR Viken for the help in conducting the field trials. We also thank Morten Tofastrud and Elisabeth Røe at Inland Norway University of Applied Sciences for their support in project administration. In addition, we would like to acknowledge the project's funders.
Conflicts of Interest
The authors declare no conflict of interest.
References
- FAO. The future of food and agriculture: Trends and challenges; Food and Agriculture Organization of the United Nations, Rome, Italy: ISBN 978-92-5-109551-5, 2017.
- Intergovernmental Panel on Climate Change. Climate Change and Land: IPCC Special Report on Climate Change, Desertification, Land Degradation, Sustainable Land Management, Food Security, and Greenhouse Gas Fluxes in Terrestrial Ecosystems; Cambridge University Press: Cambridge, 2022.
- Vermeir, I.; Verbeke, W. Sustainable Food Consumption: Exploring the Consumer “Attitude – Behavioral Intention” Gap. Journal of Agricultural and Environmental Ethics 2006, 19, 169–194. [CrossRef]
- Augustin, M.A.; Riley, M.; Stockmann, R.; Bennett, L.; Kahl, A.; Lockett, T.; Osmond, M.; Sanguansri, P.; Stonehouse, W.; Zajac, I.; et al. Role of food processing in food and nutrition security. Trends in Food Science & Technology 2016, 56, 115–125. [CrossRef]
- Janker, J.; Mann, S.; Rist, S. Social sustainability in agriculture – A system-based framework. Journal of Rural Studies 2019, 65, 32–42. [CrossRef]
- Rajic, S.; Đorđević, V.; Tomasevic, I.; Djekic, I. The role of food systems in achieving the sustainable development goals: Environmental perspective. Business Strategy and the Environment 2022, 31, 988–1001. [CrossRef]
- Graves, D.B.; Bakken, L.B.; Jensen, M.B.; Ingels, R. Plasma Activated Organic Fertilizer. Plasma Chemistry and Plasma Processing 2019, 39, 1–19. [CrossRef]
- Ingels, R.; Graves, D.B. Improving the Efficiency of Organic Fertilizer and Nitrogen Use via Air Plasma and Distributed Renewable Energy. Plasma Medicine 2015, 5, 257–270. [CrossRef]
- N2 Applied. Nitrogen Enriched Organic fertiliser. Available online: https://n2applied.com/ (accessed on July 19th, 2022).
- Mousavi, H.; Cottis, T.; Hoff, G.; Solberg, S.Ø. Nitrogen Enriched Organic Fertilizer (NEO) and Its Effect on Ryegrass Yield and Soil Fauna Feeding Activity under Controlled Conditions. Sustainability 2022, 14, 2005.
- Mousavi, H.; Cottis, T.; Pommeresche, R.; Dörsch, P.; Solberg, S.Ø. Plasma-Treated Nitrogen-Enriched Manure Does Not Impose Adverse Effects on Soil Fauna Feeding Activity or Springtails and Earthworms Abundance. Agronomy 2022, 12, 2314.
- Mousavi, H.; Solberg, S.Ø.; Cottis, T.; Dörsch, P. Nitrogen-Enriched Organic fertilizer (NEO) elevates nitrification rates shortly after application but has no lasting effect on nitrification in agricultural soils. 2023. [CrossRef]
- Hoel, B. Delt gjødsling til bygg og havre (Divided fertilization of wheat and barley); Bioforsk: https://nibio.brage.unit.no/, 2007.
- Yara. YaraMila™. Available online: https://www.yara.com/crop-nutrition/products-and-solutions/global-fertilizer-brands/yaramila/ (accessed on July 20th 2022).
- Yara International. Yara Opti NS. Available online: https://www.yara.no/gjoedsel/produkter/yarabela/yarabela-opti-ns-27-0-0-4s/ (accessed on 03.05.2023).
- Zadoks, J.C.; Chang, T.T.; Konzak, C.F. A decimal code for the growth stages of cereals. Weed Research 1974, 14, 415–421. [CrossRef]
- yr.no. Weather data history. 2023.
- Strand, E. Jord-og plantekultur 2021 Forsøk i korn, olje-og belgvekster, engfrøavl og potet 2020; NIBIO: https://nibio.brage.unit.no/nibio-xmlui/handle/11250/2740694, 2021.
- Watson, C.A.; Atkinson, D.; Gosling, P.; Jackson, L.R.; Rayns, F.W. Managing soil fertility in organic farming systems. Soil Use and Management 2002, 18, 239–247. [CrossRef]
- Biswas, D.; Micallef, S.A. Safety and Practice for Organic Food; Academic Press: 2019.
- Sutton, M.; Howard, C.; Mason, K.; Brownlie, W.; Cordovil, C. Nitrogen opportunities for agriculture, food & environment. UNECE guidance document on integrated sustainable nitrogen management. 2022.
- Alcoz, M.M.; Hons, F.M.; Haby, V.A. Nitrogen Fertilization Timing Effect on Wheat Production, Nitrogen Uptake Efficiency, and Residual Soil Nitrogen. Agronomy Journal 1993, 85, 1198–1203. [CrossRef]
- Cox, W.J.; Reisenauer, H.M. Growth and ion uptake by wheat supplied nitrogen as nitrate, or ammonium, or both. Plant and Soil 1973, 38, 363–380. [CrossRef]
Figure 1.
The map showing the locations in the southern part of Norway, where the field trials were conducted in 2020, 2021, and 2022: Tønsberg 1, Årnes 2, Hamar 3, and Stjørdal 4.
Figure 1.
The map showing the locations in the southern part of Norway, where the field trials were conducted in 2020, 2021, and 2022: Tønsberg 1, Årnes 2, Hamar 3, and Stjørdal 4.
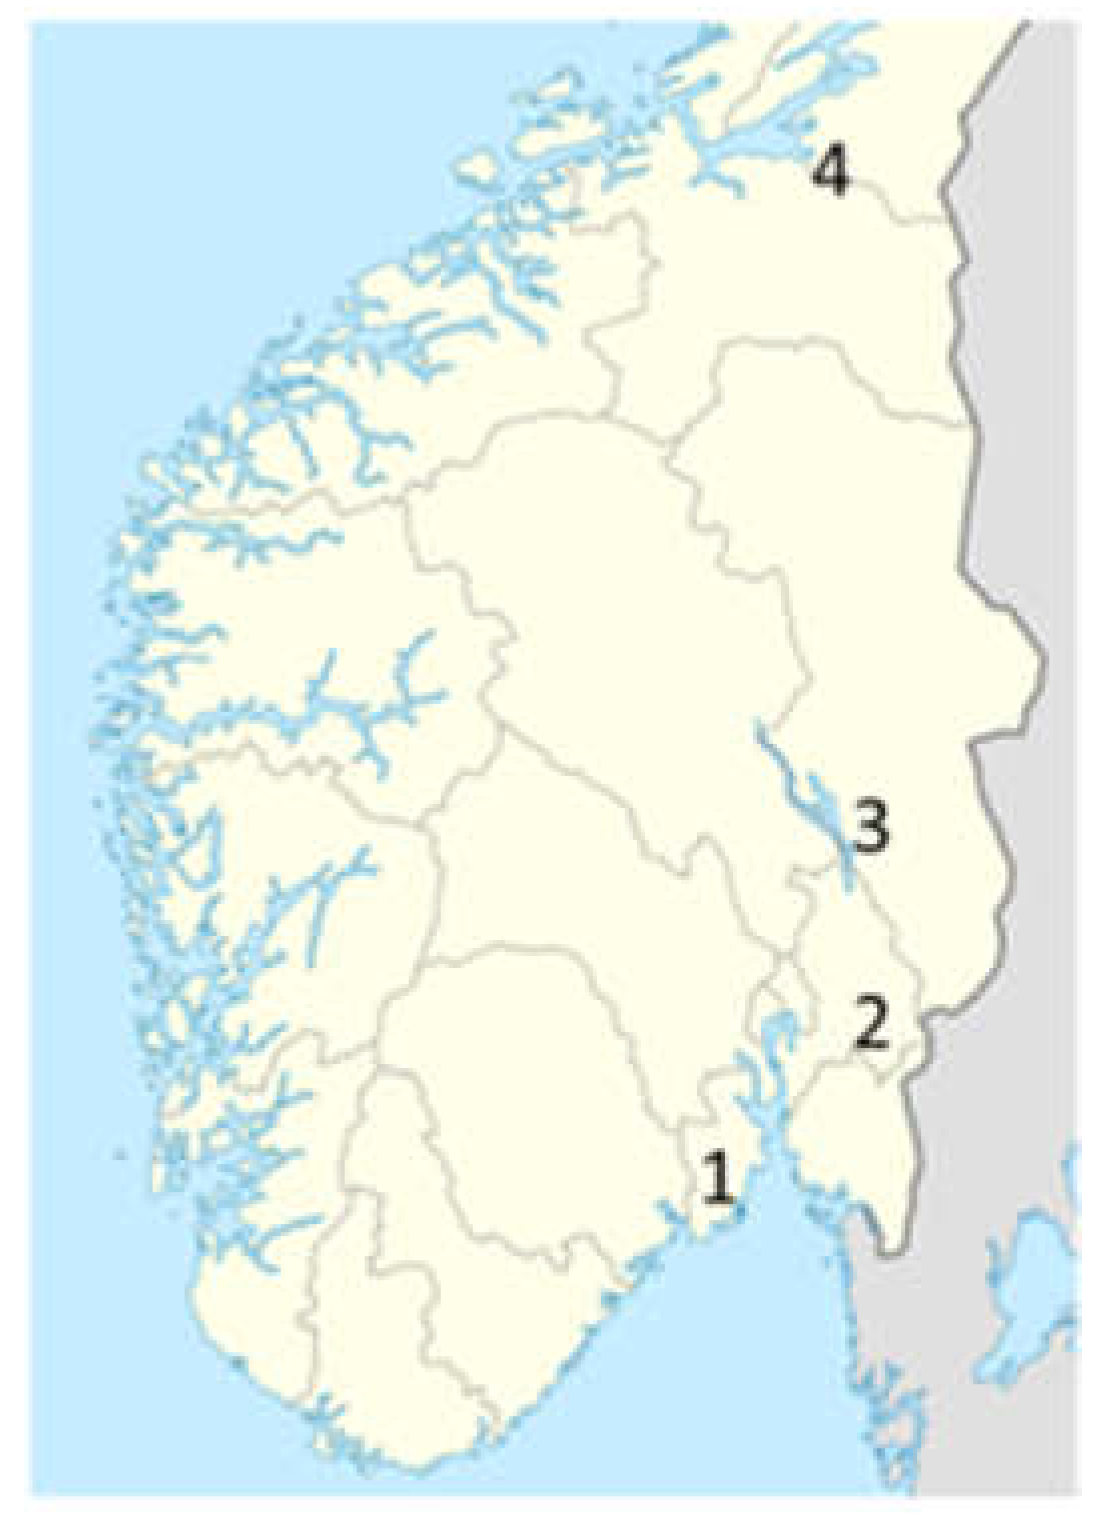
Figure 2.
Grain yield (15 % water content) in kg ha-1 ± standard error of the means. Results from the initial trials in 2020 with one trial in barley (left) and one in spring wheat (right). NEO102 kg N/ha is marked in yellow.
Figure 2.
Grain yield (15 % water content) in kg ha-1 ± standard error of the means. Results from the initial trials in 2020 with one trial in barley (left) and one in spring wheat (right). NEO102 kg N/ha is marked in yellow.
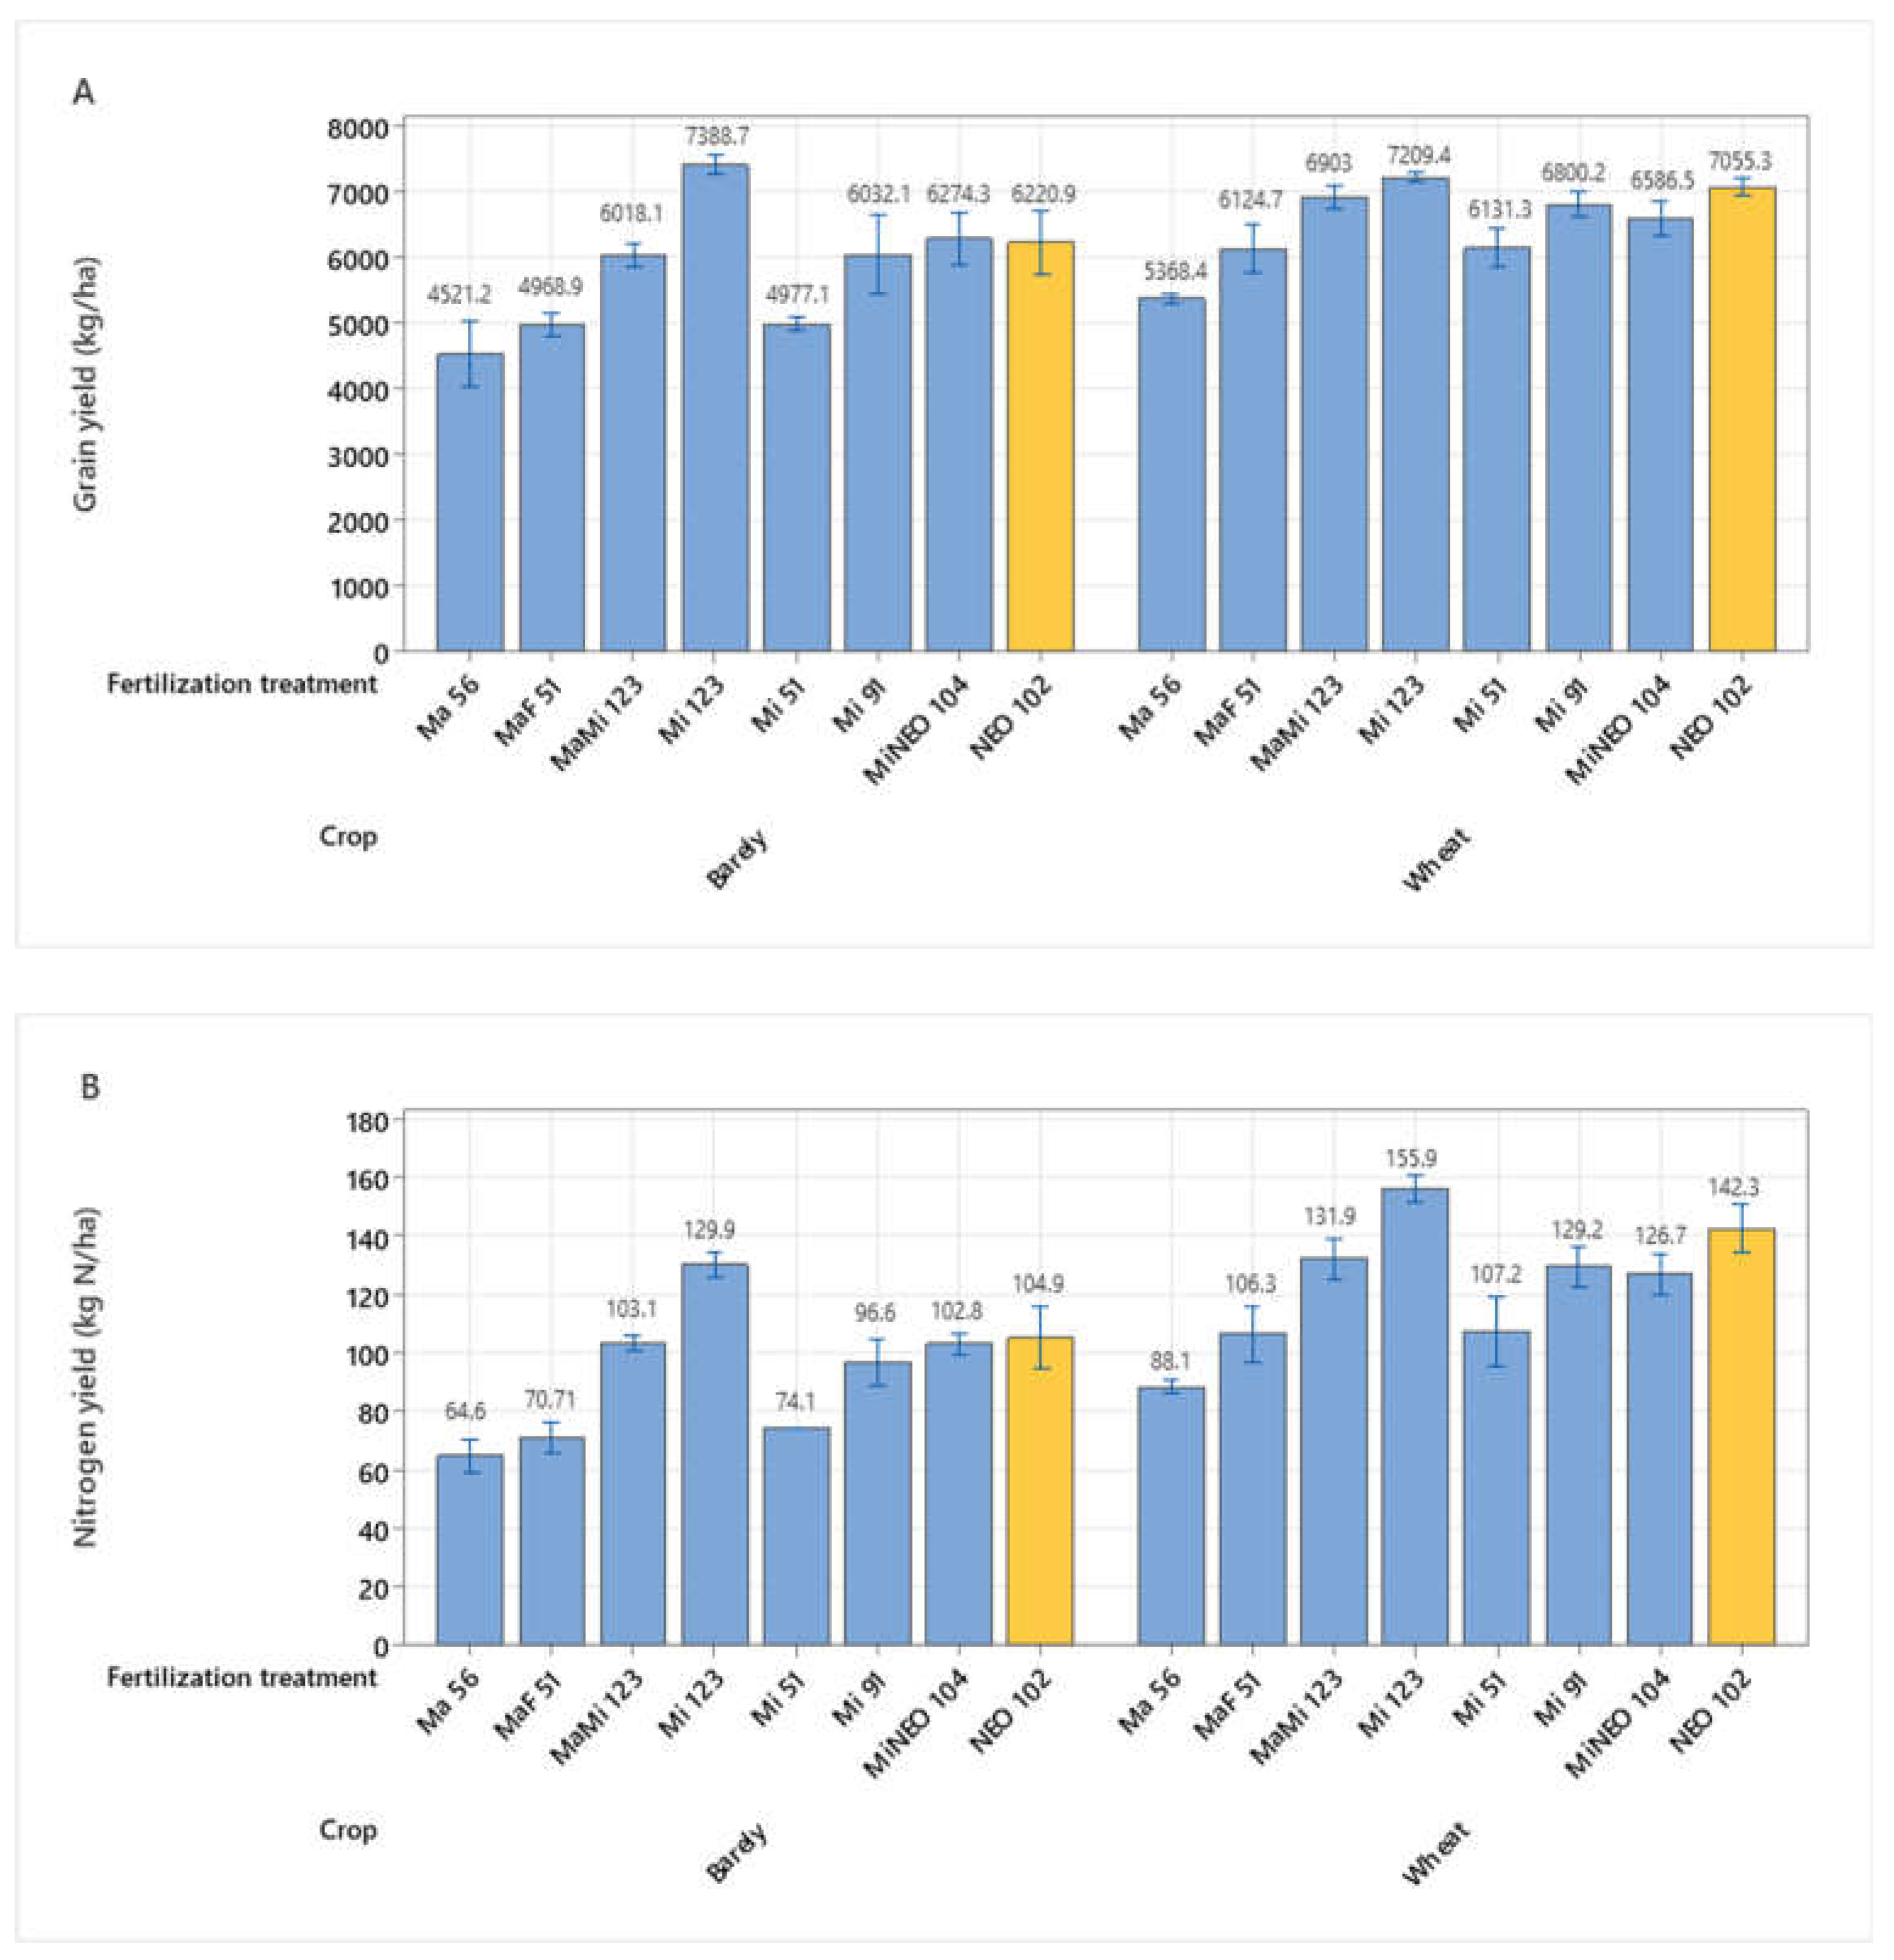
Figure 3.
A: Grain yield (15 % water content), and B: Nitrogen yield, in kg ha-1 ± standard error of the means. Results from Series 1 in 2021 and 2022, with three trials in barley (left) and three trials in spring wheat (right).
Figure 3.
A: Grain yield (15 % water content), and B: Nitrogen yield, in kg ha-1 ± standard error of the means. Results from Series 1 in 2021 and 2022, with three trials in barley (left) and three trials in spring wheat (right).
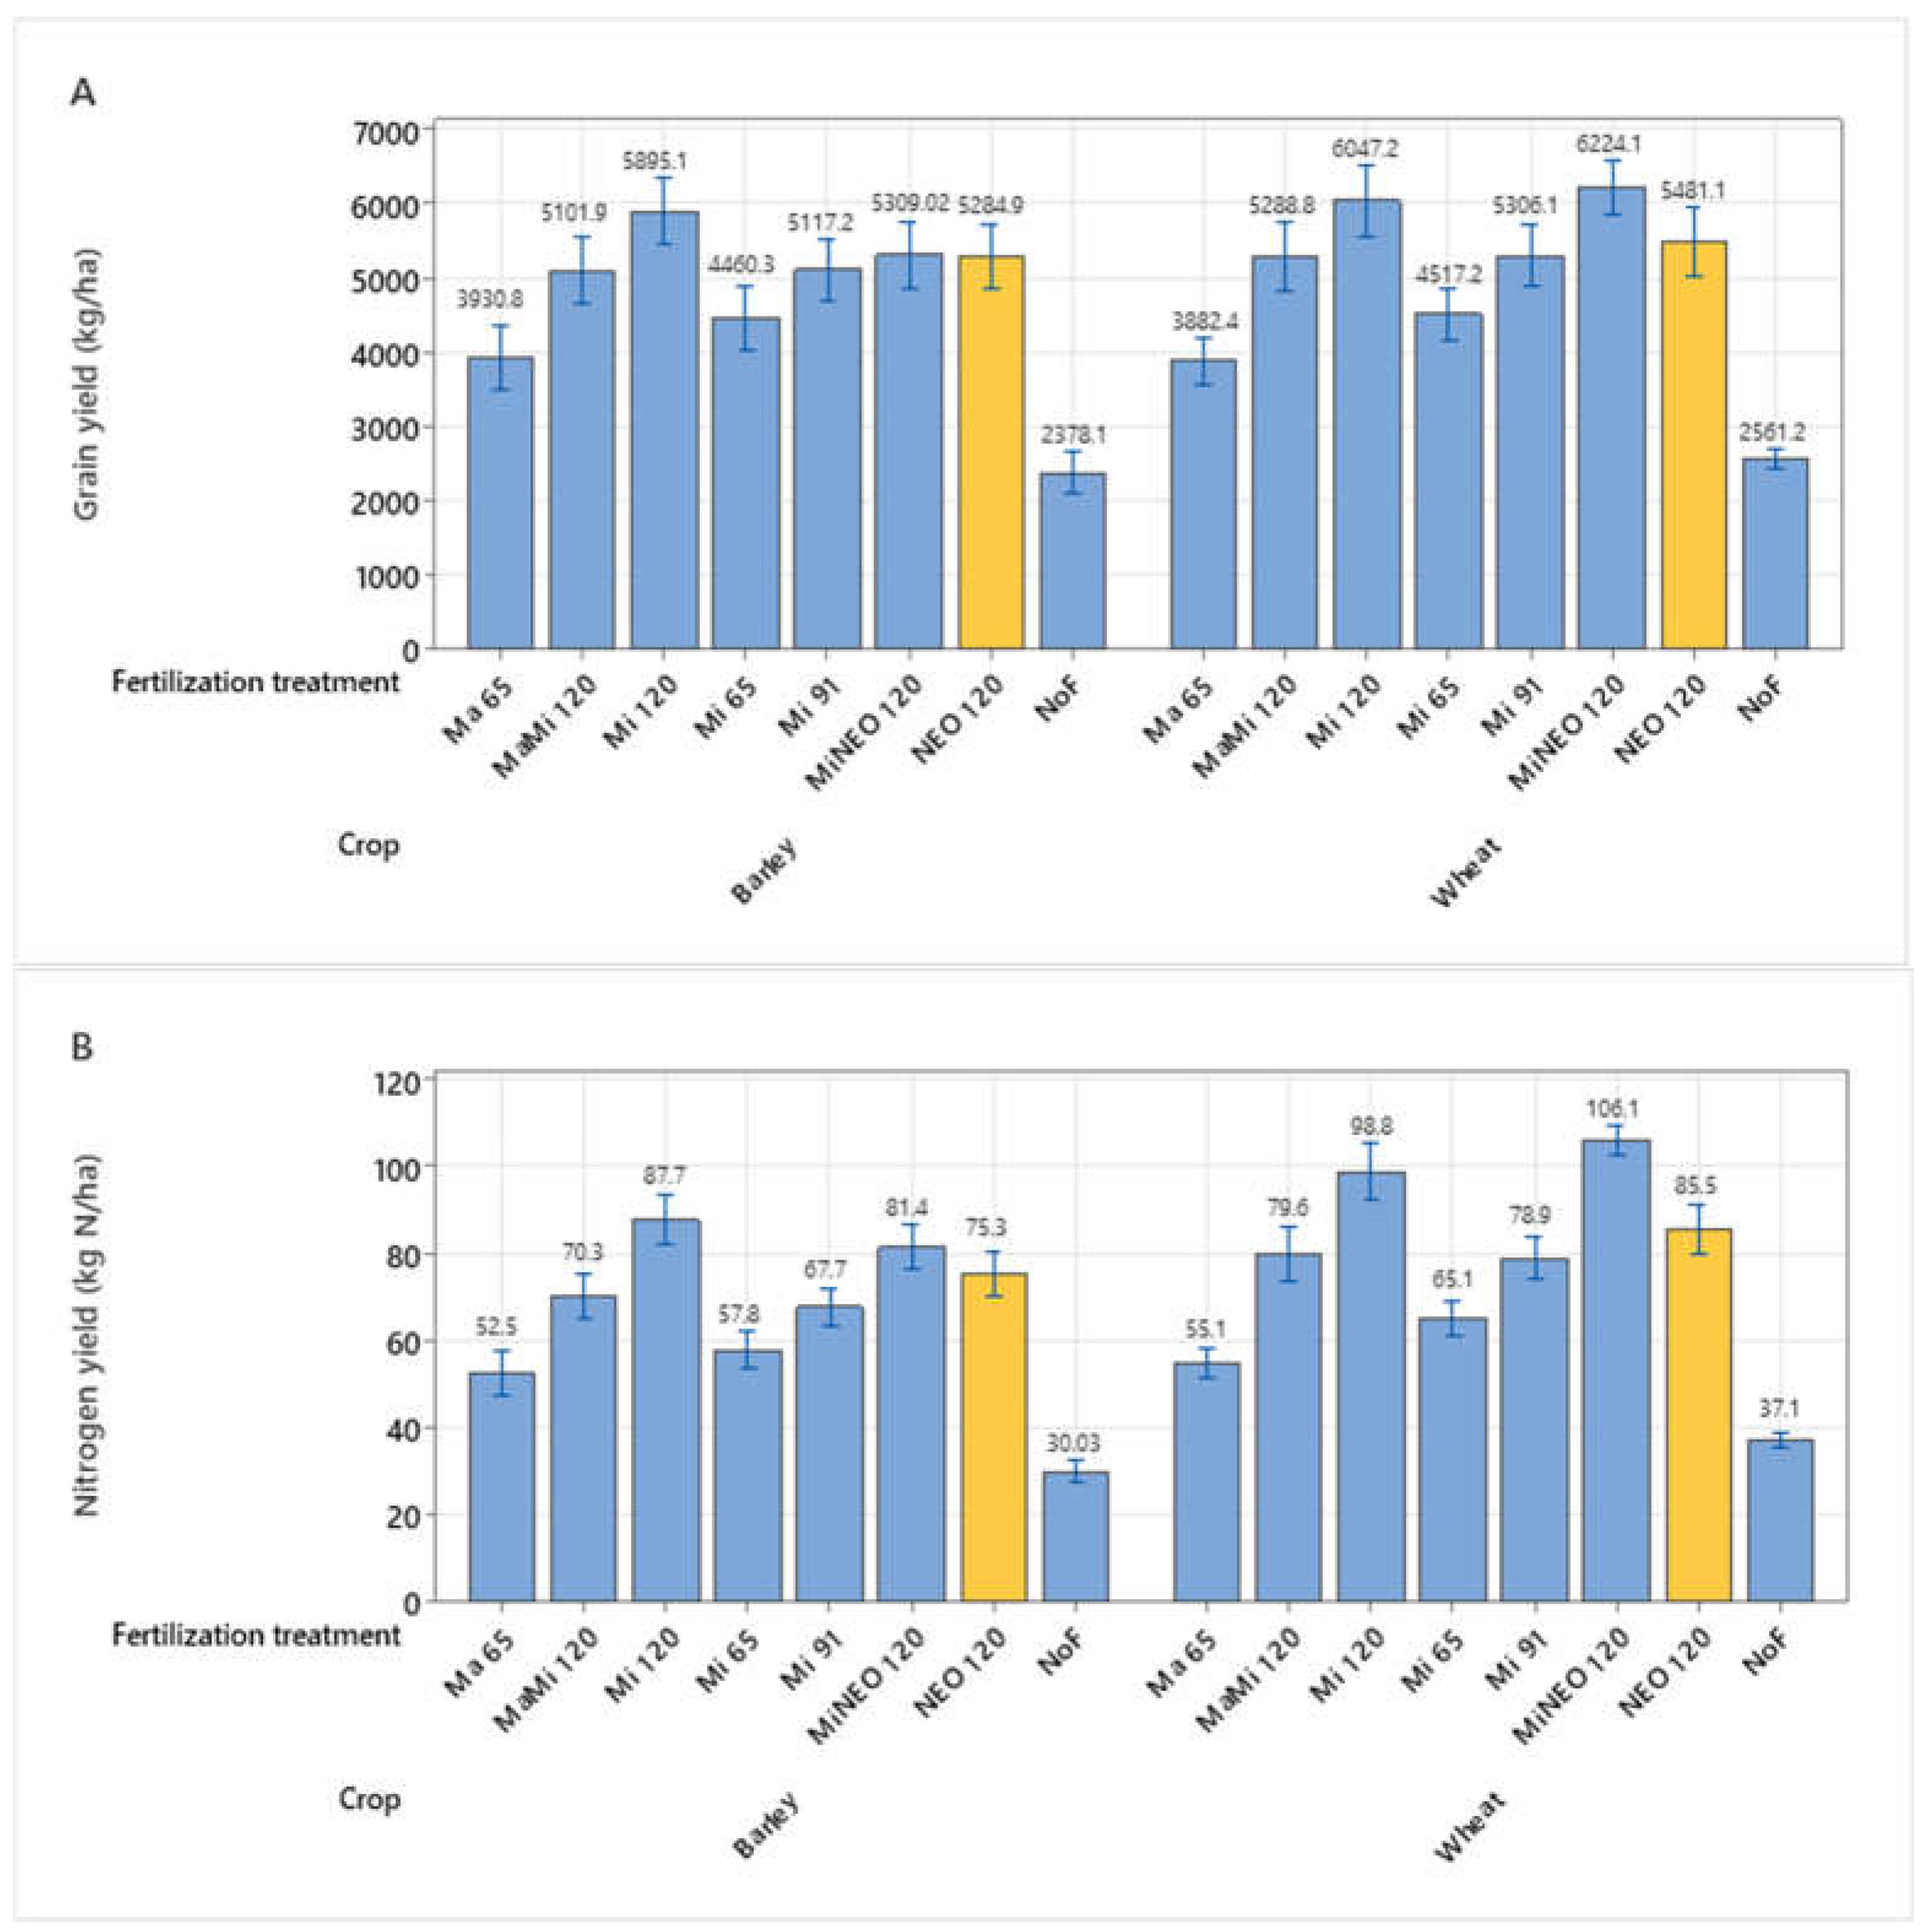
Figure 4.
A: Grain yield (15 % water content), and B: Nitrogen yield, in kg ha-1 ± standard error of the means. Results from Series 2 in 2021 and 2022, with two trials in barley (left) and three trials in spring wheat (right).
Figure 4.
A: Grain yield (15 % water content), and B: Nitrogen yield, in kg ha-1 ± standard error of the means. Results from Series 2 in 2021 and 2022, with two trials in barley (left) and three trials in spring wheat (right).
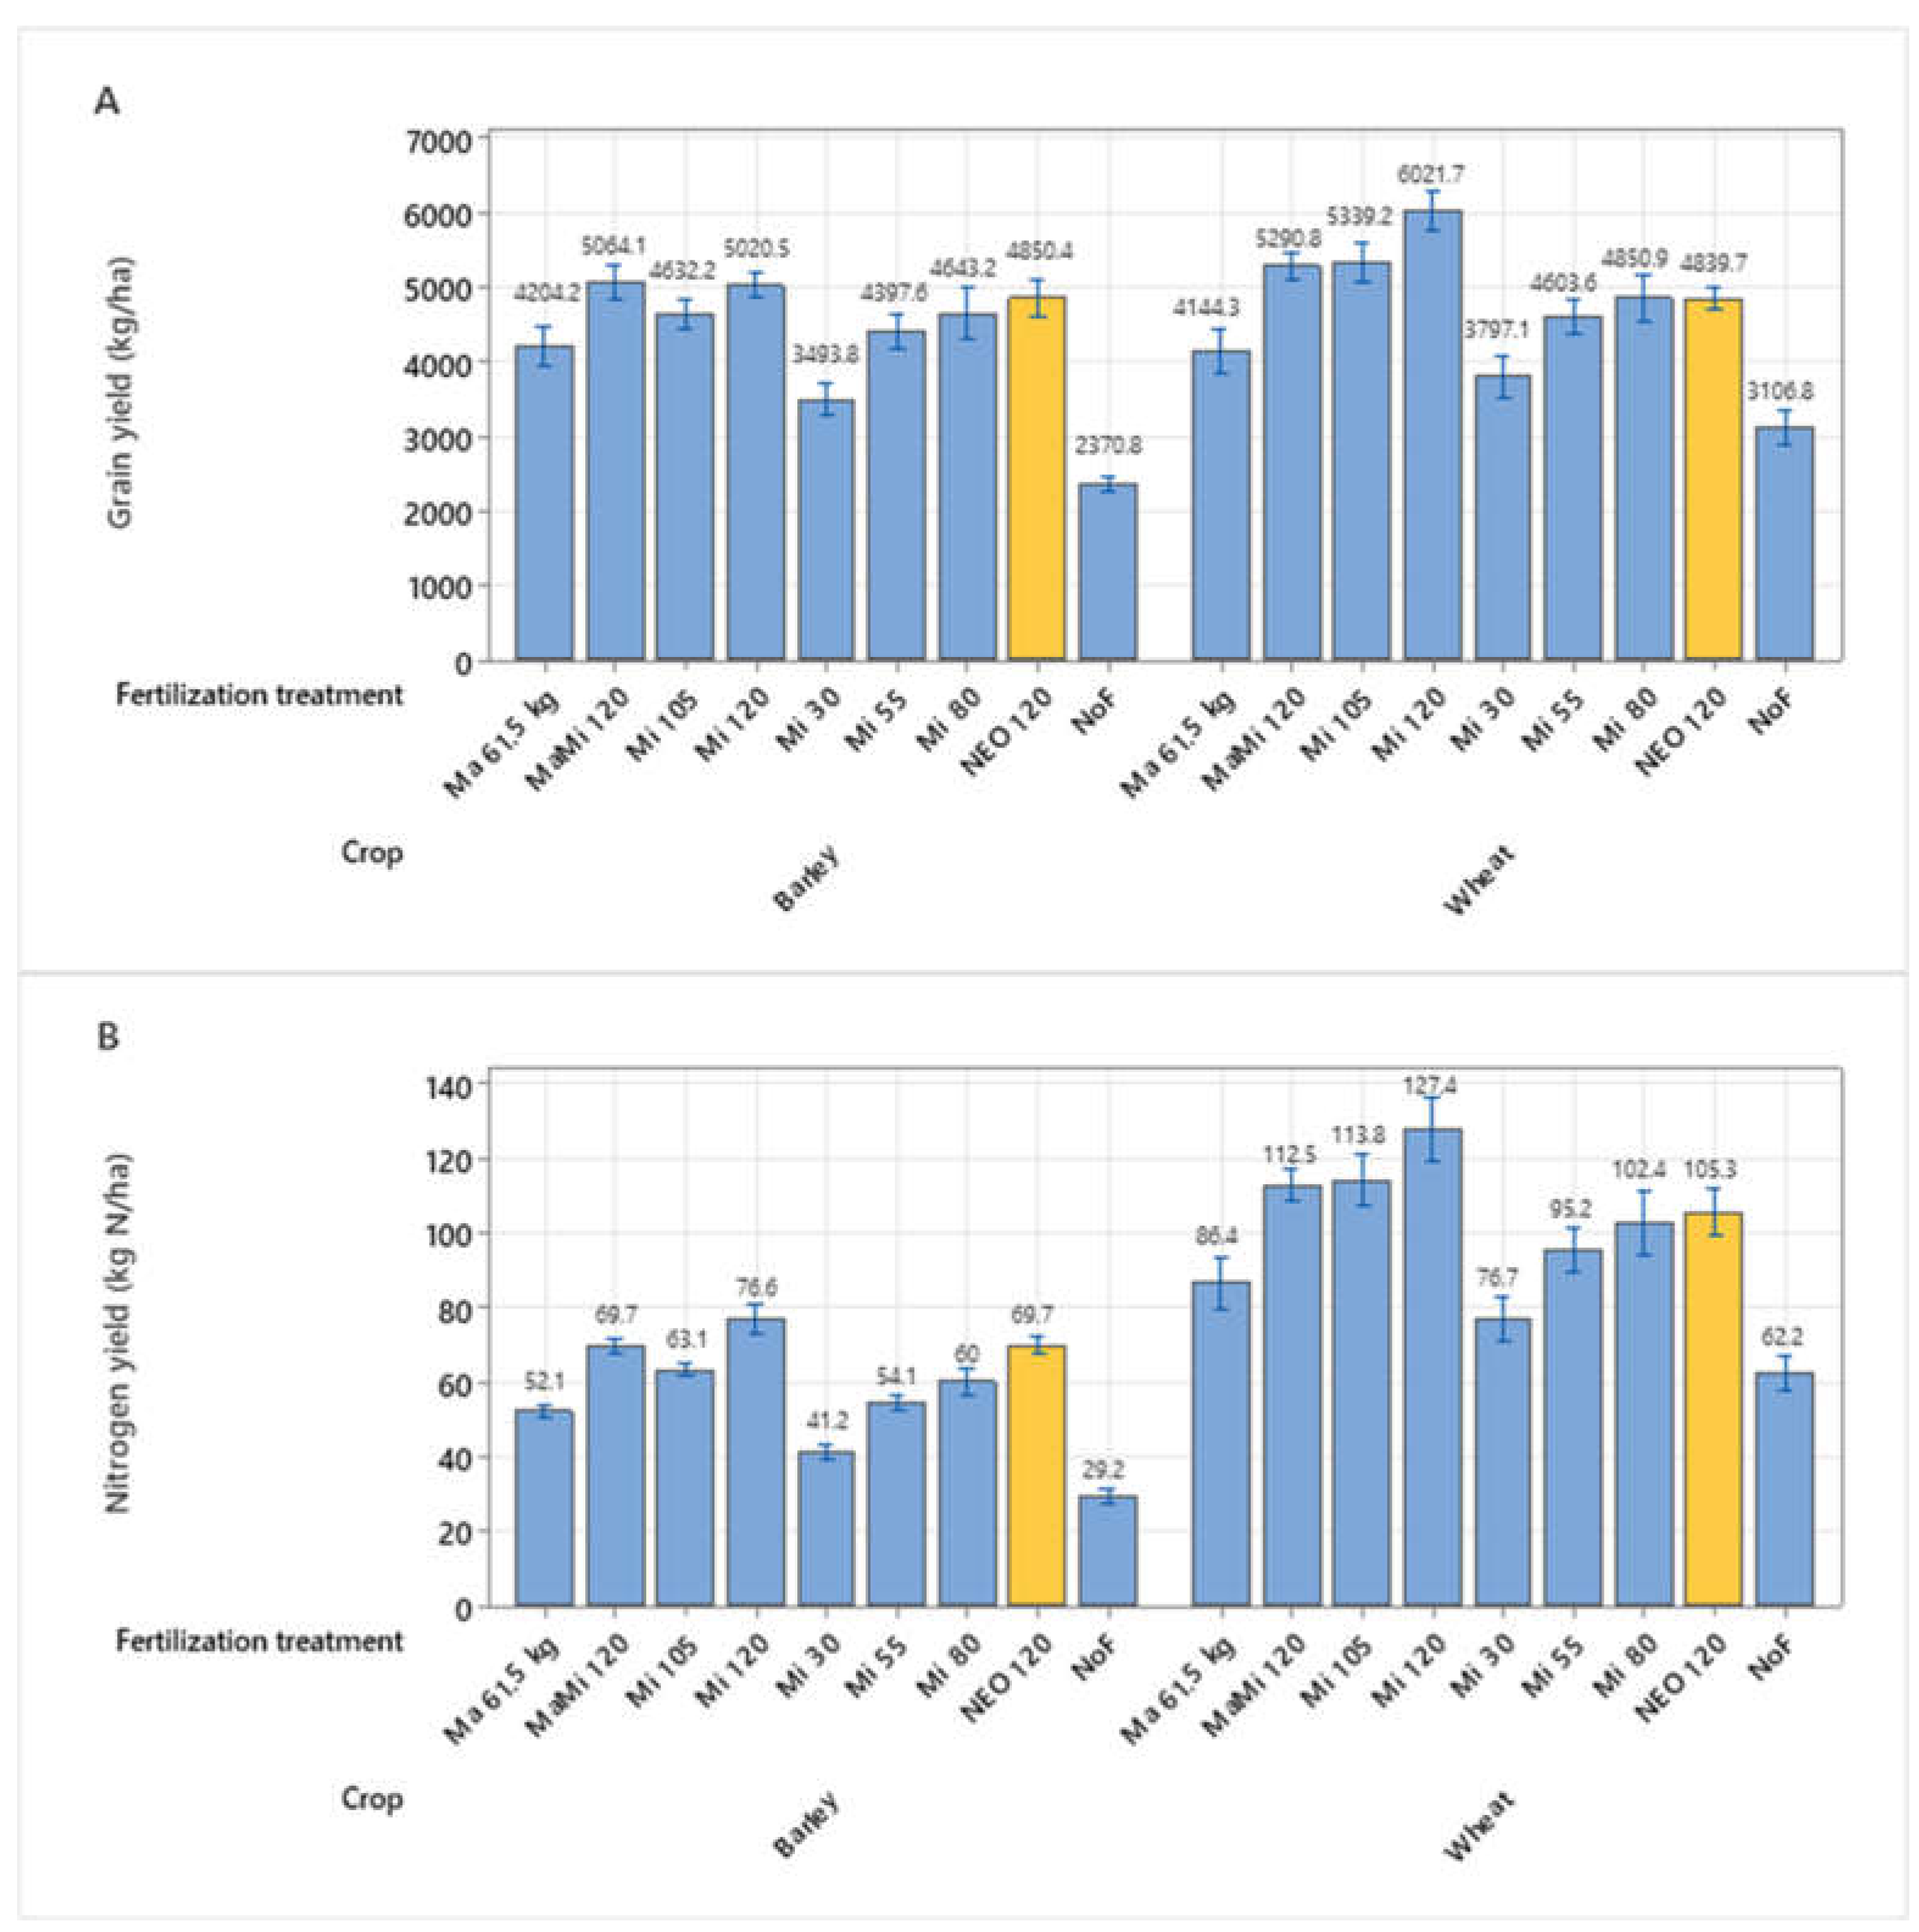
Figure 5.
Nitrogen effect of 120 kg N ha-1 in NEO (NEO120) compared to the nitrogen effect of 65 kg N ha-1 in manure (Ma65) and 120 kg N ha-1 in manure with mineral fertilizer (MaMi120). Results are based on data from ten trials in Series 1 and 2 combined. Results are provided for grain yield data and N yield (bars with light pattern).
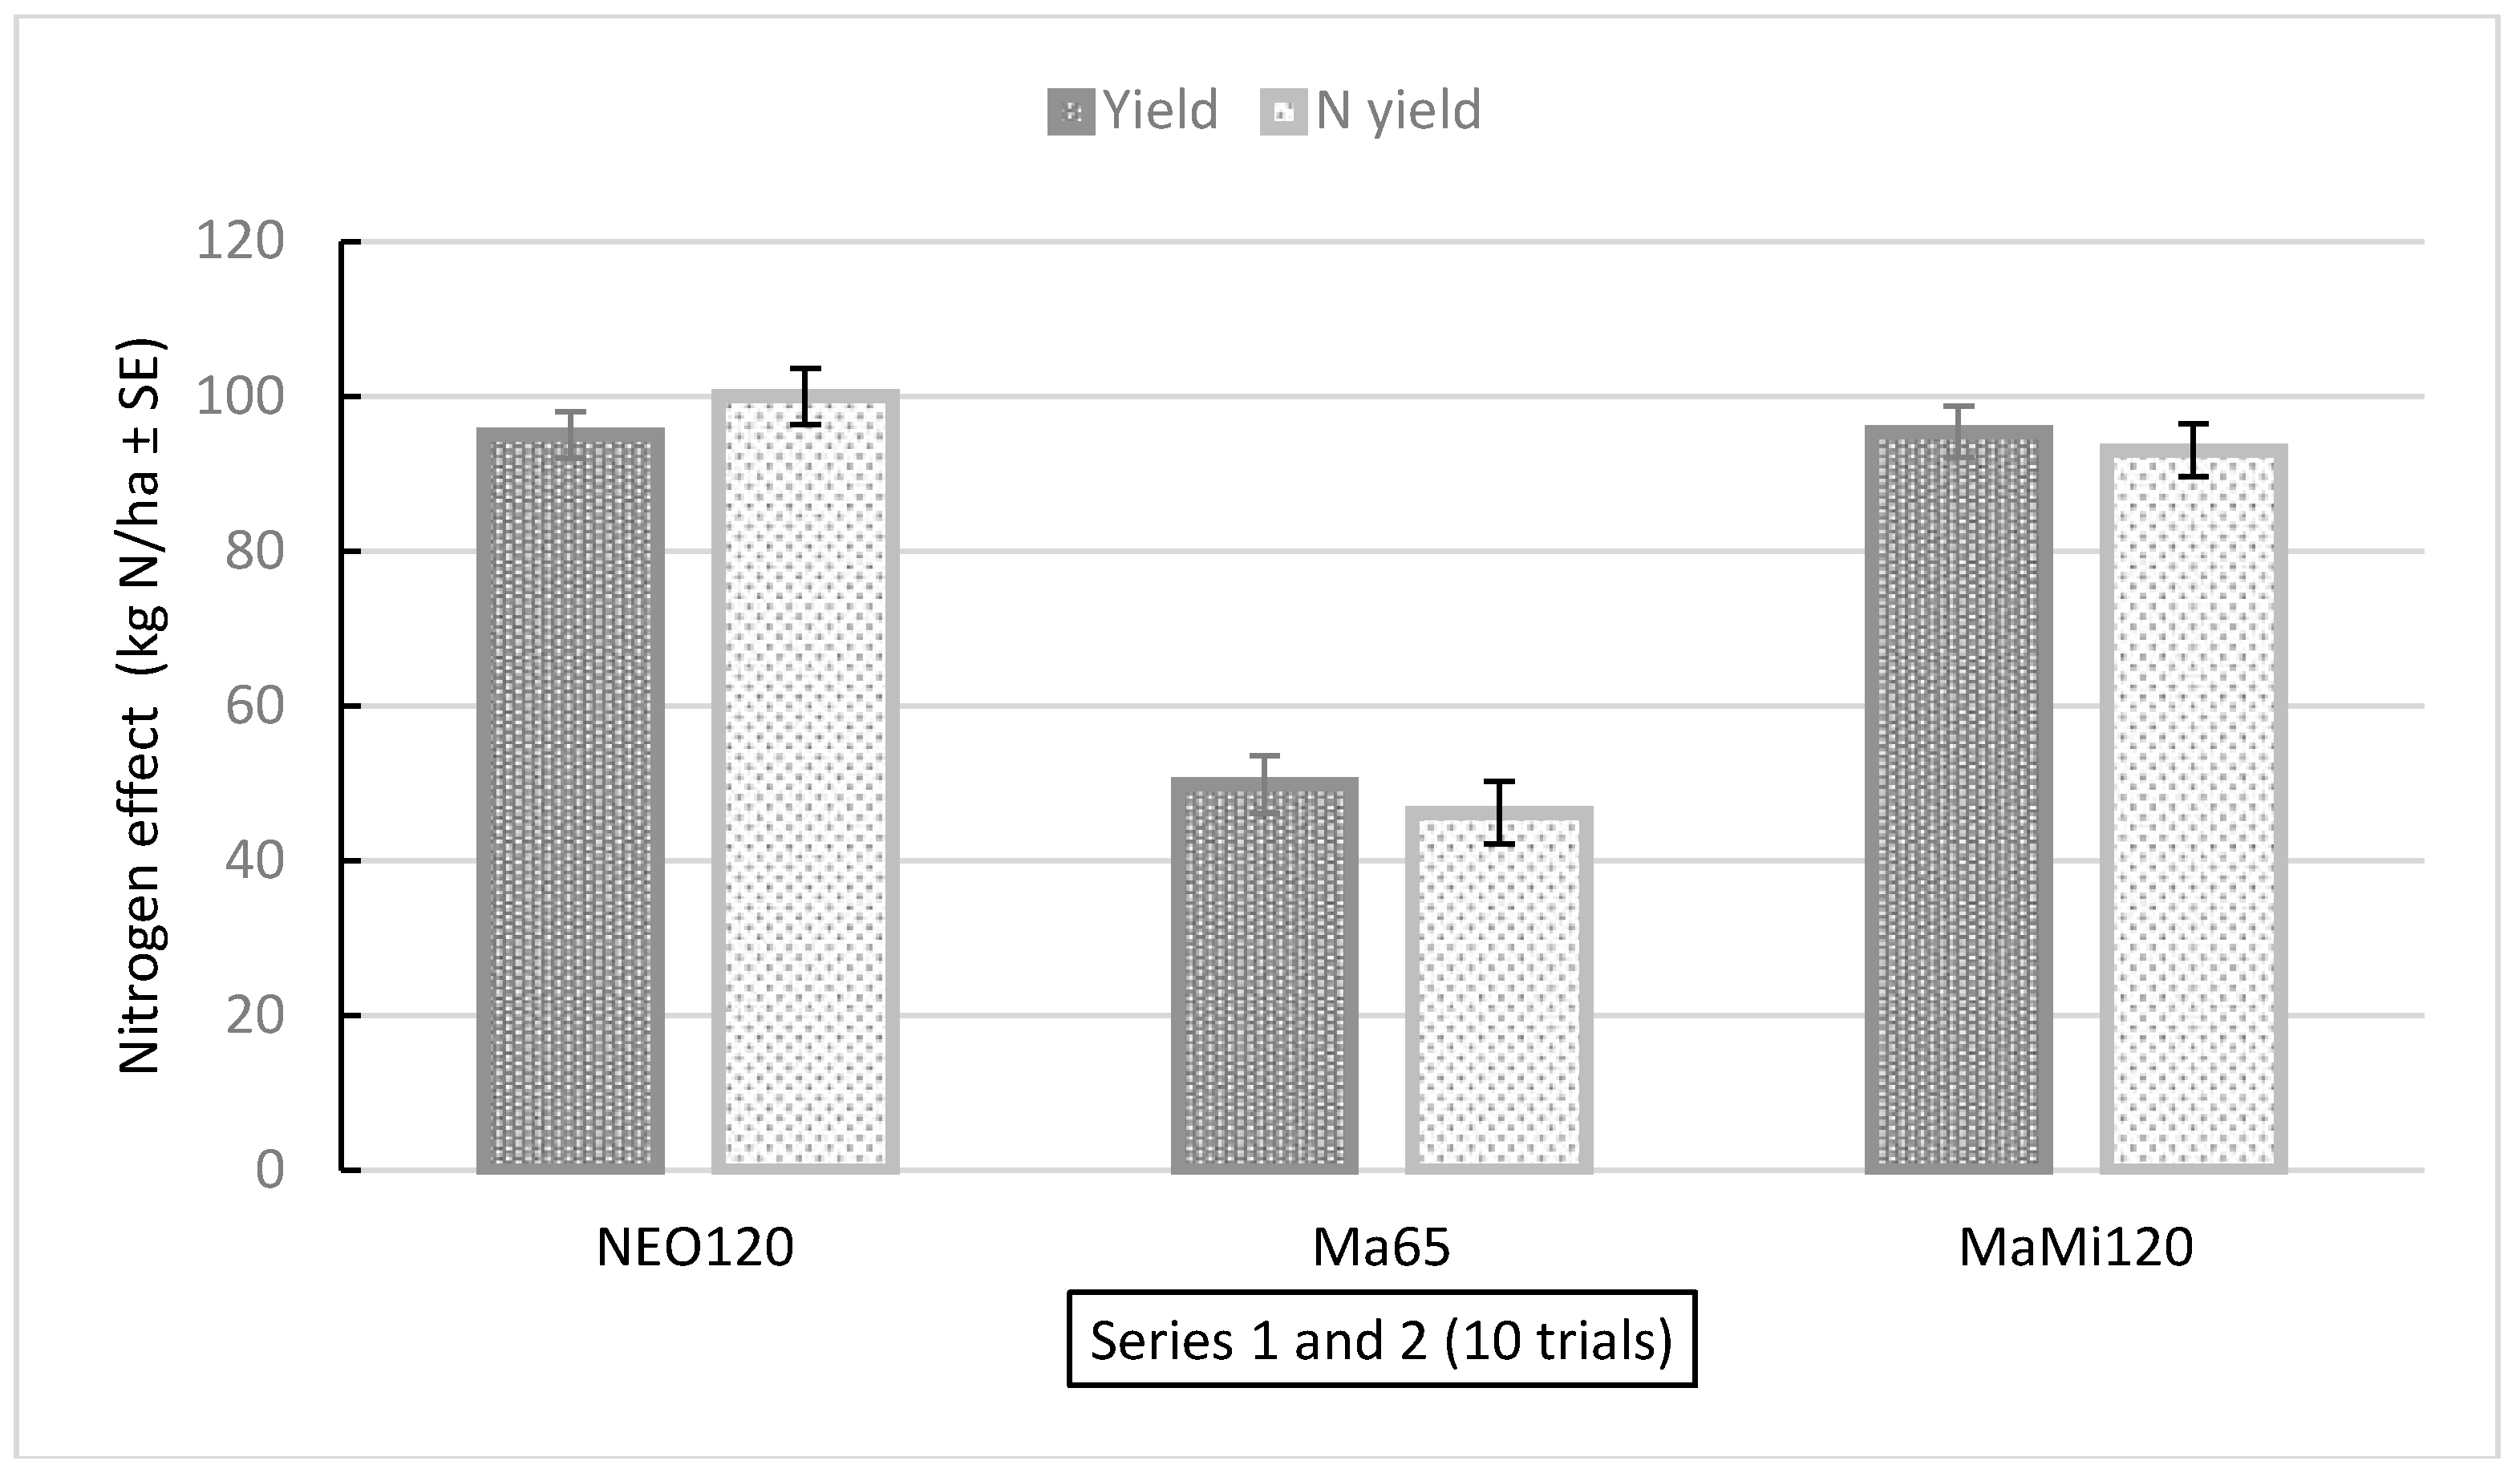

Table 1.
The trial numbers, location coordinates, and soil quality information at the trial sites. The barley and wheat were all spring-sown types.
Table 1.
The trial numbers, location coordinates, and soil quality information at the trial sites. The barley and wheat were all spring-sown types.
| Series | Trial | Location | Crops, Varieties, and Years | Detailed Location and Coordinates | Soil Type and Key Soil Parameters |
|---|---|---|---|---|---|
| 1 | 1 | 3 | Barley' Salome' 2020, Wheat 'Betong' 2021, Barley' Bente' 2022 | 3 km east of Hamar (60,81830°N, 011,17968°E) | Loam, 4,5 % organic, pH 7,4 |
| 1 | 2 | 3 | Wheat 'Mirakel' 2020, Barley' Anita’ 2021, Wheat ‘Betong’ 2022 | 3 km east of Hamar (60,81830°N, 011,17968°E) | Loam, 4,5 % organic, pH 7,4 |
| 1 | 3 | 2 | Wheat ‘Helmi’ 2021 | 3 km west of Årnes (60,12604°N, 11,39471°E) | Silt loam, 4,0 % organic, pH 6,0 |
| 1 | 4 | 2 | Barley ‘Brage’ 2021 | 3 km west of Årnes (60,12604°N, 11,39471°E) | Silt loam, 4,0 % organic, pH 6,0 |
| 2 | 5 | 1 | Wheat ‘Betong’ 2021 | 5 km west of Tønsberg (59.294937°N, 10.318813°E) | Silt loam, 6,5 % organic, pH 6,2 |
| 2 | 5 | 1 | Wheat ‘Betong’ 2022 | 15 km north of Tønsberg (59.384537°N, 10.232651°E) | Silt loam, 4,8 % organic, pH 6,9 |
| 2 | 6 | 4 | Barley ‘Thermus’ 2021 | 4 km north of Stjørdal (7041109°N, 593647°E) | Loam, 2,7 % organic, pH 6,1 |
| 2 | 6 | 4 | Barley ‘Thermus’ 2022 | 4 km north of Stjørdal (7037496°N 597733°E) | Loam, 2,7 % organic, pH 6,1 |
Table 2.
Amounts of mineral N, ammonia N, nitrate N, nitrite N, total N (kg N ton-1), and pH in the NEO and untreated cattle slurry used over the three years (average over several analyses per year).
Table 2.
Amounts of mineral N, ammonia N, nitrate N, nitrite N, total N (kg N ton-1), and pH in the NEO and untreated cattle slurry used over the three years (average over several analyses per year).
| Fertilizer and Year | N-min (Kg ton-1) |
NH4+ (Kg ton-1) |
NO3- (Kg ton-1) |
NO2- (Kg ton-1) |
Total N (Kg ton-1) |
pH |
|---|---|---|---|---|---|---|
| NEO 2020 | 3.4 | 1.68 | 1.24 | 0.52 | 4.7 | 5.3 |
| Untreated 2020 | 1.7 | 1.7 | 0 | 0 | 2.8 | 7.1 |
| NEO 2021 | 3.2 | 1.5 | 0.92 | 0.8 | 4.38 | 5.59 |
| Untreated 2021 | 1.5 | 1.5 | 0 | 0 | 2.68 | 7.17 |
| NEO 2022 | 3.55 | 1.66 | 1.19 | 0.69 | Not analyzed | 5.15 |
| Untreated 2022 | 1.75 | 1.7 | 0 | 0 | Not analyzed | 7.35 |
Table 3.
Average temperatures, Normal temperatures, precipitation, and Normal precipitation for the grain trial locations over the years 2020-2022.
Table 3.
Average temperatures, Normal temperatures, precipitation, and Normal precipitation for the grain trial locations over the years 2020-2022.
| Year | Location | Average Temperature (oC) |
Normal Temperature (oC) |
Average Precipitation (mm) |
Normal Precipitation (mm) |
|---|---|---|---|---|---|
| 2020 | Hamar | 8,5 | 9,9 | 23 | 55 |
| 2021 | Tønsberg | 9,9 | 10,8 | 95,1 | 71 |
| 2021 | Årnes | 9,3 | 10,2 | 88,4 | 59 |
| 2021 | Hamar | 9,5 | 9,9 | 77,9 | 55 |
| 2021 | Stjørdal | 9,6 | 9,0 | 33,1 | 63 |
| 2022 | Tønsberg | 11,4 | 10,8 | 36,5 | 71 |
| 2022 | Hamar | 9.8 | 9,9 | 31,8 | 55 |
| 2022 | Stjørdal | 9,6 | 9,0 | 72,6 | 63 |
Table 4.
The average yields per ha of the treatments Ma65, MaMi120, NEO120, and Mi120 in all 5 trials in barley and 5 trials in wheat in 2021 and 2022 (Series 1 and 2 combined). Columns four and five give the same only from the trials in Series 1 from the same years, also containing the average yield effects from the MiNEO120 treatment.
| Fertilization Treatment | Average Yield (kg ha-1) all Trials 2021 and 2022 Barley (5 Trials) | Average Yield (kg ha-1) all Trials 2021 and 2022 Wheat (5 Trials) | Average Yield (kg ha-1) Series 1 2021 and 2022 Barley (3 Trials) |
Average Yield (kg ha-1) Series 1 2021 and 2022 Wheat (3 Trials) |
|---|---|---|---|---|
| Ma65 | 4068 | 4013 | 3931 | 3882 |
| MaMi120 | 5083 | 5290 | 5102 | 5289 |
| NEO120 | 5068 | 5155 | 5285 | 5481 |
| MiNEO120 | - | - | 5309 | 6224 |
| Mi120 | 5443 | 6123 | 5895 | 6047 |
Disclaimer/Publisher’s Note: The statements, opinions and data contained in all publications are solely those of the individual author(s) and contributor(s) and not of MDPI and/or the editor(s). MDPI and/or the editor(s) disclaim responsibility for any injury to people or property resulting from any ideas, methods, instructions or products referred to in the content. |
© 2023 by the authors. Licensee MDPI, Basel, Switzerland. This article is an open access article distributed under the terms and conditions of the Creative Commons Attribution (CC BY) license (http://creativecommons.org/licenses/by/4.0/).
Copyright: This open access article is published under a Creative Commons CC BY 4.0 license, which permit the free download, distribution, and reuse, provided that the author and preprint are cited in any reuse.


