
Submitted:
29 April 2023
Posted:
04 May 2023
You are already at the latest version
Abstract
In the current socio-economic context, pension systems have become a crucial topic in the agenda of governments and international bodies. In this paper, an empirical study regarding the economic and social sustainability of pension systems in Central and Eastern European Countries was performed. The goal of the research is to establish the sustainability of pension systems with econometric modeling techniques on three dimensions as the research hypotheses are revealed: first, by strengthening the financial soundness of pension systems; second, consolidating the economic environment of pension systems; third, increasing the degree of social security systems with a direct effect of reducing poverty. The results led to relevant insights emphasizing the need for more inclusive economic, financial, and social reforms. From a policy perspective, these findings could be a starting point for the enhancement of the financial adequacy and economic and social sustainability of pension systems in Central and Eastern European Countries. The econometric techniques in this study highlight those modern pensions systems that need to be addressed in a more complex and empirical context that must encompass the main technical aspects. The conclusions suggest that in the future it needs judicial, economic, and social adjustments for the enhancement of the financial soundness of the pension systems.
Keywords:
pension systems
; PAYG
; financial sustainability
; social systems
; security insurance
; econometric techniques
; public reforms
; former socialist countries
1. Introduction
United Nations Organization 2030 Agenda for Sustainable Development (2015) [1] established some bold goals regarding broadening the security and well-being of people. To provide basic social and health services, ensure a decent living, abolish poverty, and support social inclusion, the main mechanisms used by states are social protection systems and pension systems (Chen, Eggleston & Sun, 2018 [2]; Chepngeno-Langat, 2019 [3]; Walsh et al., 2021 [4]; Lee, 2022 [5]; Gong et al., 2022[6]).
Social protection systems uphold the fulfillment of the primary needs of human beings as health care and financial security. Pension systems are an essential component of social protection systems providing the financial flow needed for a decent living for elderly people. The main benefits provided by public pension systems are old-age pensions, disability pensions, and survivor pensions.
Central and Eastern European (CEE) countries founded their social protection systems on the principle of intergenerational solidarity and the contribution of the employed population. Improvements in life expectancy, decreasing birth rate, and migration to Western European countries induced a growing old-dependency ratio and a continuous increase in pension expenditures. Although demographic pressure led to serial reforms in the field of social protection systems, especially in pension systems, Romp & Beetsma (2022) [7] emphasized the role of business cycle shocks in reforming the pension systems.
To protect the financial sustainability of pension systems, all CEE countries made changes to the parameters of the pension system including growing the standard retirement age, expanding the minimum contribution period, restricting early retirement, encouraging the postponement of retirement, and increasing the pension contribution rate (OECD, 2021) [8]. Hinrichs (2021) [9] finds these measures useful for maintaining the financial sustainability of the pension systems, but they may increase the poverty risk of the elderly.
At the same time, the multi-pillar pension system proposed by World Bank was implemented by all CEE countries. Ebbinghaus (2021)[10] points out that the structure of pension systems impacts the reproduction of financial inequality, but the income redistributions of public pension systems reduce poverty risks among the older population.
The actuality and importance of the research theme start from the idea that pension system sustainability is a highly important topic in the agenda of governmental bodies, international institutions, and academia due to the importance of social protection programs and pension systems in reducing poverty and ensuring the financial resources needed for a decent living in old age. Even if the pension system sustainability topic was approached to a great extent in literature, the specific situation of CEE countries remains slightly researched. Our purpose is to expand the literature regarding the sustainability of pension systems in the case of five CEE countries: the Czech Republic, Hungary, Poland, Romania, and Slovakia.
The financial stability of a pension system is defined by the balance between the income from social contributions and the state social insurance budget expenditures on benefits provided to beneficiaries. Besides the financial aspects, the economic stability of the pension system regards the health status of the economy in proving the resources for fulfilling the economic strength needed for a comprehensive pension system. The social stability of a pension system regards the quality and quantity of the labor force established as an active population in order to sustain the economic and financial soundness of the pension system in proper social conditions.
The objective of the paper aims to provide some new empirical evidence for enhancing the actual role and importance of sustainability of pension systems in three fundamental aspects: financial agenda, economic implications, and social protection and security aspects for all elderly persons. The paper addresses the problem of financial, economic, and social sustainability of pension systems in CEE countries researching the nexus between pension expenditures, demographic trends, labor market situation, health features, earnings, and tax aspects. Using econometric techniques, it attempted to establish the influence of several key indicators that characterize pension systems on the socio-economic background of CEE countries.
The scope of the research is subsumed by the evaluation and assessment of empirical and econometrical features regarding strengthening the sustainability aspects of pension systems in CEE countries revealing interesting insights in three directions economic, financial, and social dimensions. Consequently, it is very important to reshape the pension system in CEE countries based on the new economic, financial, and social aspects after the pandemic crises.
The conclusions reveal the need for judicial, economic, and social considerations in reforming the pension systems to enhance the sustainability of the pension systems. The econometrical models were analyzed and assessed for the sustainability of pensions systems in innovation for a sustainable environment revealing the importance of reshaping the entire pensions systems, especially in CEE countries where the communist period reflects itself in the economic structure and in the shape of the pension systems agenda.
The paper follows the following structure: the first part introduced the topic and purpose of the research; the second section outlined the relevant literature regarding the financial, economic, and social aspects of pension systems and highlighted the current state of the art; the third section presented the research method and data; the fourth section was dedicated to empirical results outcomes; the fifth section debates the discussions and recommendations area; the last section exposed the research conclusions.
2. Literature review
2.1. Assessment of financial aspects of sustainable pension systems
Table 1 presents the latest results of the studies regarding the financial aspect of public pension systems. Westerhout et al. (2022) [11] enhance the importance of the PAYG pension system in the uncertain economic and financial environment. Wronski (2023) [12] indicates the role of pension redistribution in reducing wealth inequality, but Lin, Tanaka & Wuc (2021) [13] point out that the PAYG pension system increases the burden on future generations. On the contrary, Laub & Hagist (2017) [14] prove that the latest reforms implemented by Norway, Poland, and Germany had a positive effect on the intergenerational debt burden.
Brosig & Hinrichs (2022) [15] show the improvement in the financial sustainability of the pension system across the European Union (EU) but accentuate the need for benefits’ adequacy, which may not be expressed only in terms of replacement rate (Chybalski & Marcinkiewicz, 2016 [16]).
Koomen & Wicht (2022) [17] proved the relationship between a fully-funded pension system and current
account balance. On one hand, tax system, economic freedom, and government quality were found to have a positive influence on social security budget revenues (Németh, Németh & Vékás, 2019 [18]; Barrios et al., 2020 [19]; Popa et al., 2022 [20]; Kudrna, Tran & Woodland, 2022 [21]). On the other hand, Ștefan (2015) [22], Cristescu (2019) [23], and Dumiter & Jimon (2022) [24] established the influence of demographic and labor market features on social expenditures.
Rotschedl (2015) [25] points out that education has a greater influence than life expectancy and income structure in ensuring the sustainability of the PAYG pension system. Lancia & Russo (2016) [26] observed the political power of the elderly which can determine the decrease in education investment and the increase in pension transfers. Hammer, Christl & De Poli (2023) [27] observed different approaches among EU countries regarding pension provisions, Southern European countries having an old age orientation, and Northern European countries supporting low-income populations. According to Shahid (2014) [28], the benefits provided by pension systems express the generosity and respect of human beings. Indeed, Alonso-Ortiz (2014) [29] found pension system generosity to be an important factor in determining the structure of pension system budgets, but Halaskova (2018) [30] highlighted the influence of country-specific features of each pension system.
Taking into account the studies presented above and detailed in Table 1, it can be observed that it has been an empirical trend orientation toward the analysis of financial aspects of pension systems. Whether the sample was oriented to EU countries, CEE countries, Australia, Taiwan, or other worldwide countries, the research methods are convergent to regression analysis with several different methods of estimation and econometric implementation. The empirical results presented in Table 1 reveal that financial sustainability is a very important feature of a functional, strategic, and soundness pension system overall mechanism.
Based on these findings, the first research hypothesis is:
H.1: Strengthening the financial soundness of pension systems, by increasing the income from social contributions to the state budget with a direct effect on increases in pension amounts will generate, ceteris paribus, a positive impact on elderly persons' standard of living in CEE countries.
2.2. Economic implications for increasing the soundness of pension reforms
Table 2 summarizes the main results regarding the economic aspects of pension systems.
Several studies focused on the demographic factors that influence the pension system. According to Han (2013) [31] migration has a negative influence on bismarkian pension systems Fenge & Peglow (2018) [32], and Jimon, Dumiter & Baltes (2021) [33] found migration and fertility to have a positive effect on pension system sustainability. Di Liddo (2018) [34] highlights that only highly skilled immigrants bring a real benefit to the sustainability of pension systems. Hoang (2022) [35] pointed out that migration is increasing competitiveness and is a driver for pension system reforms. Olivera (2019) [36] found little influence of mortality on pension wealth inequality.
Other studies approached the influence of labor market features on pension systems. Haan & Prowse (2012) [37], Cipriani (2018) [38], and Heer & Trede (2023) [39] enhance the need for postponement of retirement to achieve pension system sustainability. Dieppe & Guarda (2015) [40] highlight the need for increased labor force participation, but Jun (2020) [41] indicated that working life will increase only if there is perceived a greater utility in terms of benefits and income. Sanchez-Marcos & Bethencourt (2018) [42] found that the elimination of some pension benefits will increase the female labor supply.
Falkstedt et al. (2014) [43], and Sundstrup et al. (2018) [44] show that working conditions could be a driver for disability, early retirement, or unemployment. Also, Staubli, & Zweimüller (2013) [45], and Engels, Geyer & Haan (2017) [46] point out that increasing the retirement age may lead to unemployment. On the other hand, Wang (2015) [47] established the influence of the pension systems in increasing fertility and decreasing unemployment.
In terms of the provision of pension systems, Mitchell, Clark & Lusardi (2022) [48] indicate the stability of the real incomes of retirees, Xinbang et al. (2022) [49] reveal the positive influence on the consumption level of the elderly, and Cammeraat (2020) [50] found evidence that social expenditure is reducing poverty and inequality.
After analyzing carefully, the economic implications of pension systems presented in Table 2, it can be observed that there are a variety of countries taken into account by the authors: Germany, the USA, Korea, China, EU, and CEE countries. Regarding the research methods, there are more techniques enabled by the authors than in the case of financial sustainability: regression analysis, simulation models, probit models, and quartile analysis. These techniques combined with the results obtained by the authors suggest economic aspects of pension systems are more complex and vary on the pension system structure in each country.
Based on these findings, the second research hypothesis is:
H.2: The happiness of elderly persons is increased, ceteris paribus, by a comprehensive upward trend of GDP, with direct effects upon the stability of the economic environment, which will consolidate the economic sustainability of pension systems in CEE countries.
2.3. Social underpinnings towards a more comprehensive social security system
Table 3 comprises recent empirical results regarding the social aspects of pension systems.
Several studies proved that retirement and pension system distribution improved the physical and mental health of the elderly (Coe & Zamarro, 2011 [51]; Eibich, 2015 [52]; Cheng et al., 2018 [53]; Chen, Wang & Buscha, 2019 [54]; Pak, 2021 [55]; Mostert et al., 2022 [56]; Herl et al., 2022 [57]). On the contrary, Fe & Hollingsworth (2016) [58], Heller-Sahlgren (2017) [59], and Fitzpatrick & Moore (2018) [60] reveal that retirement has a negative impact on the physical and mental health of the elderly, increasing the sedentarism and social isolation risk.
Carrino, Glaser & Avendano (2020) [61] and Barschkett et al. (2022) [62] associated the increase in retirement age with depressive symptoms. Different results were exposed by Silver, Dass & Laporte (2020) [63] who found that post-retirement employment increase health and reduces depressive symptoms. Also, Hallberg, Johansson & Josephson (2015) [64], and Krumins et al. (2019) [65] showed that early retirement can decrease the mortality risk, and Kang, Park & Ahn (2022) [66] and Brown & Fraikin (2022) [67] established that pension system provisions are reducing poverty. Shin (2012) [68], Ju et al. (2017) [69], and Cheng et al. (2018) [70] sustained that retirement has a positive influence on satisfaction and quality of life.
According to the studies presented above and the structure of this complex research presented in Table 3, it can be identified some interesting insights. The social aspects of comprehensible social security systems are analyzed in the following countries: China, the UK, the USA, South Korea, Belgium, Germany, and South Africa. This situation reveals that all these studies are focused on a single country focusing on the different social parameters of the social security system. Regarding the research method, regression analyses are conducted by using the OLS technique with fixed and random effects, a 2-stage least square method, a logistic model, and a conditional mixed process model. The empirical results presented by these studies suggest that the social characteristics of the pension systems and the most complex one with several facets, with also quality variables and institutions, which cannot be comprised in a mathematics model. The overall conclusion of these studies reveals the importance of strengthening the social security systems at the country level by improving the quality of the social security checks and balances and widening the whole range of social services in order to increase the social soundness of the pension systems.
Based on these findings, the third research hypothesis is:
H.3: The poverty amplitude which affects the elderly people can be reduced, ceteris paribus, by strengthening the social aspects and features of pension systems, in the context of overall social reforms of pension systems in CEE countries.
3. Research methodology
3.1. Empirical models construction and specifications
The research design enriched in this study is structured in sequential steps. These steps are constructed to ensure the research methodology's clarity. First, descriptive statistics analysis is analyzed to establish the correlation between the variables and the soundness of the empirical research. Second, plots between HDI, Happiness Index, Poverty, and the macroeconomic variables will be conducted to establish the complex relationship manifested between these variables. Third, the three hypotheses were tested using the Pooled Ordinary Least Square method having both fixed effects and random effects. The three dependent variables, namely Human Development Index, Happiness Index, and Poverty are used in the regression analysis using the independent variables: employment, unemployment, and beneficiaries and the control variables: taxes, net earnings, Gross Domestic Product, and expenditures on pensions. Fourth, the 2 Stage Least Square Analysis regression with fixed and random effects is performed to establish the complex relationship oriented towards a more sustainable pension system in the background with social, economic, and financial aspects. Finally, it will be conducted robustness tests in order to measure the soundness of the research results by performing Fisher – Augmented Dickey-Fuller (ADF) and Fisher – Phillips – Perron (PP) unit root tests and Pedroni – Eagle – Granger & Kao residual cointegration tests.
3.2. Dependent variables
The dependent variables taken into account in this study are the following: (i) human development index (HDI), (ii) Happiness index (HPI), and (iii) poverty (POV_t). The first dependent variable, namely Human Development Index represents a complex variable capable of revealing the economic aspects of sustainable pensions systems due to its complexity and measurements scale which suggest that economic aspects of pensions systems are very complex and in a dynamic development process. The reason for establishing the Human Development Index as a dependent variable consists of the complex features which are enriched in the composition and structure of the index. Moreover, the connections with the PAYG systems are revealed by the overall economic aspects and social features which connect the development status with the pension system. The second dependent variable, the Happiness Index represents a quid pro quo regarding the assessment of financial aspects of sustainable pension systems. The complex construction of this index represents a good measure for attaining the financial sustainability of pension systems. The main reason for establishing the Happiness index as a dependent variable relies upon the aspects of sustainability and resilience which can be emphasis also on the financial part of a pensions systems. Consequently, the connection with the PAYG pension system is highlighted by well-being aspects regarding the specific demographic problem of the economies and societies. The third dependent variable, poverty, represents the social aspects of sustainable pension systems, revealing the important aspects of equivalent income after social transfers expressed in percentage points. These indicators measured both total, female and male gender has a good performance in tracking the social poverty scale in a country.
3.3. Independent variables
Independent variables which are taken into account in this study are the following: (i) employment; (ii) unemployment, and (iii) beneficiaries. The first independent variable, employment represents an important macroeconomic indicator for revealing the total percentage of the population which currently activates on the labor market. The second independent variable, unemployment determined by the total amount of unemployed people as a percentage of the total population reveals the total number of unemployed people who currently do not have a job or are activated on the labor market expressed in percentage points. Third, the beneficiary’s independent variable represents the total amount of pensionaries on the annual actual basis which benefits from the pension system. These three independent variables encounter soundness in measuring the sustainability of pension systems by taking into account the most sensitive problems of the employment agenda as well as the number of pension beneficiaries.
3.4. Control variables
The control variables which are taken into account for this study are the following: (i) taxes, (ii) net earnings, (iii) Gross Domestic Product; (iv) expenditures on pensions. Taxes are very important to control variables due to the fact that it reveals the total amount of money that a person pays to the state for all the income obtained. This indicator is important for assessing the financial control over the financial sustainability of pension systems. The second control variable, net earnings, represents another financial important issue that suggests the total amount of net money which people encounter for the work they are currently developing. Gross Domestic Product represents an important indicator for revealing the financial soundness of a country and the path for increasing the standard of living. The last control variable, expenditures of pensions represents the percentage points that gather the pension beneficiaries from the total amount of the Gross Domestic Product of a country.
3.5. Data sample description, sources, and specifications
In this study we conduct empirical research for measuring the economic, financial, and social sustainability of pensions systems in five CEE countries: Czech Republic, Hungary, Poland, Romania, and Slovakia. Table 4 presents and analyzes the specifications of data and variables, the construction machinery, and data sources. In order to ensure the time-frame consistency of the empirical data, we have taken into account the time – period from 2010 to 2020 to have a comprehensive, complete, and complex database, without any missing data of a variable in one or more years. This time – period was not updated until 2022 because not all indicators encountered in the database have values. In this sense, for all the variables fulfillment of the completion of the data, the final data set was established for the period 2010 to 2020. The database was constructed by using the following sources: Human Development Reports for the Human Development Index; World Happiness Report for the Happiness Index; Eurostat database for the poverty index. For the independent and control variables it was used the Eurostat database. The plotting analysis was performed by using Python 3.0 software, meanwhile, the regression analyses were performed by using the EViews 12.0 Academic Edition.
4. Empirical results
4.1. Descriptive statistics analysis
Table 5 presents the descriptive part of the research and shows that the dependent variables as Human Development Index, Happiness Index, and total poverty varies from around 1% in the case of the first dependent variable, to 6% in the second dependent variable and having around 18% for the total poverty. This situation reveals that total poverty is more direct and immediately affected and influenced by the social, economic, and financial sustainability of the pension systems. The total employment in the labor force indicates that a stable and high employment rate preserves the soundness of more sustainable pensions systems in the CEE countries, meanwhile, the unemployment rate differs from the different regions of these countries. Moreover, tax policy and tax agenda constitute a quid pro quo for the soundness of the pensions systems and the net income of the active people represents a very important financial indicator. As for the total pension beneficiaries, this aspect is strongly highlighted by an equilibrated and balanced pension budget and financial status. The overall amount of the GDP represents an interesting feature in consolidating the soundness of a more comprehensible pension system in CEE countries, meanwhile, expenditures with pensions systems represent the most sensitive variable for attaining and maintaining the long-term sustainability of pension systems in CEE countries. Analyzing the empirical results, it can be observed that the observations are only 55, due to the construction of the database, the limited time period for several variables, and the lack of data for some variables at larger time series periods. The importance of the limited time period for several variables has the justification for a more comprehensive and accurate database with data fulfillment of all variables in the time period taken into account.
4.2. Plotting charts between the complex relationship of HDI, Happiness index, Poverty, and macroeconomic variables
Figure 1 presents the plotting results between HDI and macroeconomic variables. As can be seen by analyzing the eight subgraphs it can be observed that there are similarities for subgraphs 3,4, 6, and 7. The connections between HDI and taxes, net income, beneficiaries, and GDP reveal that there is a direct correlation between these variables. More specifically, the higher the tax amount and net income of the people, the consistency of the pension beneficiaries and the GDP growth the higher will the scale of HDI which will lead to an improvement in the overall development of people. Other similar subgraphs are 1 and 5 regarding the complex relationship manifested between the amount of labor force (total employment) respectively the tax rates; this leads to the specific complex relationship manifested towards stabilization of tax rates, increasing the total employment, and increasing the HDI index scale. Subgraphs 2 and 8 suggest that there are some interesting insights manifested towards the connections between total unemployment, expenditures on pensions, and HDI; specifically, there are more complex features that influence the total amount of unemployment people which are connected to the expenditures on pensions and consequently have a direct impact upon HDI.
Figure 2 presents the plotting results between Happiness Index and macroeconomic variables. Within this group of subgraphs, there are also some similarities that can be identified. First, subgraphs 3,4,6, and 7 have similar evolutions trends which are linear. More precisely, between the Happiness Index and taxes, net earnings, overall beneficiaries of pension systems, and GDP there can be identified exponential linear correlation due to the fact that increasing the tax rates and the net earning checks and balances, will lead consequently in an increase in the overall beneficiaries of the pensions systems, and also with a sustainable economic growth throughout GDP. This fact will have positive effects on increasing the Happiness Index with a direct impact on the standard of living and increasing the overall positive attitude and vibe of the population. Other similarities can be observed in subgraphs 1 and 5 and also 2 and 8. The similarities between subgraphs 1 and 5 reveal that there can be identified a strong correlation between the total amount of employment and the tax rates dues to the fact that decreasing the tax rates will lead simulate the labor market and influence, mutadis mutandis, the Happiness Index. The similarities manifested between subgraphs 2 and 8 suggest that total unemployment and the expenditures on pensions can exist strong connections but with a high degree of complexity which will, in the end, influence the Happiness Index scale.
Figure 3 presents the plotting results between Poverty and macroeconomic variables. In this case, there are also several similarities that can be identified between the subgraphs. In this sense, subgraphs 3, 4, 5, 6, and 7 have similar trends which are explained by the connections which manifest in practices between taxes, net earnings, tax rates, pension beneficiaries, and GDP. The situation is explained due to the connections between appropriate tax rates and sustainable taxes and net earnings and also a comprehensive amount of total beneficiaries of pensions systems well engaged by the total amount of GDP. This would have an inverse correlation with the Poverty indicator, all these variables and efficient mix engagement between them will lead to a decreasing trend of poverty. Subgraphs 2 and 8 are very similar due to the fact that the total amount of unemployment is correlated with the expenditures of the pension systems in the direction of decreasing important amounts mobilized at the social security budget, but there are also other variables that are involved in this complex process. This situation influences poverty levels with many social implications for the sustainability of pension systems. Finally, subgraph 1 shows an interesting connection between total employment and poverty, having the explanation that increasing the total labor force and strengthening the financial sustainability of overall pension systems can be decisive in decreasing the poverty level.
4.3. Regression results
Table 6 presents the least square analysis regression results in a comparative situation both with ordinary least square, fixed effects, and random effects. Regarding the first equation, having the Human Development Index (HDI) as the dependent variable it can be observed that OLS, FE, and RE models have been statistically significant with R-squared over 0.9. In the OLS, FE, and RE models, the statistically significant coefficients are total employment, total unemployment, taxes, total pension beneficiaries, and GDP. It can be observed that the OLS model manifested a strong negative correlation between HDI and taxes, total pension beneficiaries, and GDP and a strong positive correlation with total employment and total unemployment. The FE model reveals a positive correlation between HDI and total employment, taxes, and pension beneficiaries, and a negative correlation with total unemployment net earnings, and GDP. The RE model suggests a negative correlation between HDI and GDP and a positive correlation with the other statistically significant coefficients.
The regression equations are the following:
where:
HDI = Human Development Index.
HPI = Happiness Index.
POV_t = poverty – at-risk poverty rate, 65 years or over, percentage.
α = free coefficient.
β 1,2,3,4,5,6,7, = predictor coefficients.
Emp_t = Employment – percentage of total population.
Unempl_t = Unemployment – percentage of total population.
Tx = Taxes.
Net = Net earnings.
Ben_t = Pensions beneficiaries.
GDP = Gross Domestic Product.
EXP_p = Expenditures on pensions.
ε = regression error.
The second regression equation, having the Happiness Index (HPI) as a dependent variable analyzed with all three techniques OLS, FE, and RE can be observed with high R-square values which vary between 0.86 and 0.95 revealing a strong significant statistical relevance of the models. In the OLS, FE, and RE models the most significant coefficients are total employment total unemployment, net earnings, taxes, pension beneficiaries, and GDP. Regarding the correlation of the HPI with the other variables in the case of OLS it can be observed a positive correlation with employment, unemployment, and GDP and a negative correlation with net earnings and pension beneficiaries. The FE model highlights a positive correlation of HPI with total employment and total unemployment and a negative correlation with taxes, net earnings, pensions beneficiaries, and GDP. The RE model reveals a positive significant correlation between HPI and total employment, total unemployment, and GDP, meanwhile, a negative correlation can be observed with taxes.
The third regression equation, having the total poverty (POV_t) as a dependent variable and analyzed with the three techniques OLS, FE, and RE reveal the most important statistical significance with R-square which varies from 0.97 to 0.99. However, in this situation, there can be identified a singular strong coefficient situation regarding the negative relationship between total poverty and pension expenditures.
Table 7 presents the two-stage least square regression analysis with the comparative method techniques without any effects (2SLS), with fixed effects (FE) and random effects (RE). Regarding the first equation having the Human Development Index (HDI) as the dependent variable, it can be observed that the models are statistically significant with an R-square that varies from 0.94 to 0.99. In the 2SLS, FE, and RE models the significant coefficients are total employment, total unemployment, taxes, total pension beneficiaries, and GDP. Regarding the 2SLS techniques, HDI is positively correlated with total employment and total unemployment and negatively correlated with taxes, pension beneficiaries, and GDP. In the FE method, HDI is positively correlated with total employment, taxes, and pension beneficiaries, and negatively correlated with total unemployment and GDP. The RE method reveals a strong positive correlation between HDI and total employment, taxes, and pension beneficiaries and a negative correlation with total unemployment, net earnings, and GDP.
The second regression equation of the two-stage least square analysis having the dependent variable Happiness Index (HPI) reveals strong statistically significant of all three models with an R-squared that varies between 0.86 and 0.95. in the 2SLS, FE, and RE estimation techniques the most statistically significant coefficients are all the coefficients except for the pension expenditures variable. In the 2SLS method, HPI is positively correlated with total employment, total unemployment, and GDP, and negatively with taxes, net earnings, and pensions beneficiaries. The FE method highlights the positive statistical correlation between HPI and total employment & total unemployment, meanwhile, with the other variables it manifested an inverse correlation. The RE method presents a strong positive correlation between HPI and total employment, total unemployment, and GDP, and an inverse relationship with taxes, and pension beneficiaries.
The third regression equation of two-stage least squares analysis having the dependent variable total poverty (POV_t) has a high degree of R-square levels which emerge from 0.97 to 0.99. However, the most important statistically significant coefficient is the pension expenditures both in FE, and RE methods. This fact reveals that POV_t and pension expenditures manifest a strong negative correlation.
4.4. Robustness tests
Table 8 presents the unit root test regarding the stationarity of the data enriched in our sample. For this purpose, it was used the Fischer – Augmented Dickey–Fuller Test (ADF) and the Fischer – Phillips – Perron test (PP). In Table 8 the stationary of the variables is analyzed both for the level and the first and second difference, as well as the constant trend features to assuring much more soundness to the empirical results. The empirical results presented in Table 8 reveal that analyzing the p-values can be identified stationary time series and also unit root time series. The empirical results suggest that the unit root hypothesis has not been rejected either in levels or in the 1% differences. As it can be seen, all t – values of both economic variables of HDI, HPI, POV_t, emp_t, unempl_t, tx, net, ben_t, GDP, and EXP_p is lower than the 1% difference. The conclusions drawn from Table 8 are that economic variables of HDI, HPI, POV_t, emp_t, unempl_t, tx, net, ben_t, GDP, and EXP_p have both stationary and unit roots time – series both at Fischer – ADF Test and Fischer – Phillips – Perron Test at the level, first or second difference.
After the analysis conducted in Table 8, it is needed to test the non-stationary time series regarding the long-run evolution. The cointegration problem represents the link of several nonstationary time series of the study variables in the long run. Cointegration is a process in which two or several variables can vary together in the long run simultaneously. In this study, we emphasize that even if the relationships between two or several variables cannot occur in the short run, the cointegration process evaluates the long-run correlation between these variables.
5. Discussion and recommendations
The paper investigates the nexus between the financial, economic, and social aspects of sustainable pension systems. The identified problem in the pension systems of the CEE countries consists of the almost 40 years of communist agenda starting from the 1950s until the 1990s. In this socialist period, the sustainable pension systems in CEE countries have encountered many breaks falls, and downward shifts from the free market agenda. In the aftermath of the historical changes manifested in Europe after the 1990s, these five CEE transition economies have undergone substantial sequential quality shifts in order to strengthen the pensions systems. The pandemic period had a strong negative impact on the sustainability of continuing ongoing measures in order to enhance the soundness of the pension systems in CEE countries. The empirical findings of this study reveal the importance of the three quality features of a sustainable pension system: first financial aspects in order to consolidate the budgetary constraints; second, the economic aspects in order to fulfill the overall macroeconomic equilibrium; third, the social aspects in the light of the social security status of the state preserving the rights and benefits for the vulnerable elderly people.
Given these aspects, Gutierrez et al. (2023) [41] emphasize that for an efficient and sustainable pension system, must be taken into account several variables related to self–interest, and values, but also the increasing trend towards a higher degree of satisfaction with public security services, including the overall increase in the citizen's welfare and the satisfactory of public awareness regarding the sufficient public spendings.
Another very interesting aspect is revealed by Kabar & Kalwij (2023) [42] regarding the crucial enactment of the right retirement age of people both for women and men, having a downward trend in the case of women. Brunello et al. (2023) [43] trigger the need for important economic and social reforms in the minimum retirement age of middle-aged employees both for men and women, but especially in the case of women.
Al–Hassan & Devolder (2022) [44] discuss the new challenges of the PAYS pension scheme in the actual European and international environment; the authors identify several risks and threats which underline the financial sustainability of pension systems and come with a trade-off between a formula based on defined benefits and defined contribution. Moreover, Safaralievich (2022) [45] analyzes the importance of pension provisions in the social security systems and gives a recommendation regarding an important mix that consists of influence factors of the pensions systems and the determining size of the pensions.
Other authors as Aubry (2022) [46] imply the importance of alternative pension systems with strategic investment plans while suggesting that the post-pandemic period has a decreasing trend in the actuarial expectations of the investment plans. Baurin & Hindriks (2022) [47] reveal the aging economy that we face nowadays which may imply that pension benefits gradually readjustment; the authors suggest a two-way policy in this sense: first an accrual rate and the indexation rate for attaining the balance between equality and democracy.
The important features such as the demographic trend and business cycles are the pillar of pension reform according to Romp & Beetsma (2022) [48]; the authors emphasize that there is needed sustainable pension reforms which must be correlated with demographic shocks and business cycle trends. Hoang & Maher (2022) [49] go further and highlight the fiscal constraints of the public pension contribution with a direct focus between budgetary decisions and prudent pension fund management.
Wolf (2021) [50] evaluates and assesses the complex relationship between political pressure, pension systems, and risks especially those encountered in CEE countries. The author examines the last three decades' agenda identifying several underlying risks that the sustainable pension systems must be aware of financial crises, risk–sharing paradigm, financial transfers, and minimum pension guarantees.
This paper's results have taken into account several important studies from the economic literature revealing the substantial need for reforms of pension systems in CEE countries. As in previous studies, this paper suggests a quality institution shift that must be taken by the governments in order to strengthen the social security system overall. The financial aspects of the pension system in CEE countries must be enacted by increasing the earnings wages and also the check and balances of citizens. The economic aspects must comply with long-term economic growth, increasing the citizens' standard of living and preserving overall social welfare.
6. Conclusions
The empirical research enriched in this paper has led to the conclusion that to attain a sustainable pension system it must be enacted a threshold structure: (i) financial features which are responsible for the budgetary resources policy which pensions must offer to the citizens; (ii) economic features which are responsible for the complex and comprehensive business cycle aspects in which the economic fluctuations and disparities must be treated with complex techniques and with actuarial studies; (iii) social features which are responsible for attaining the social security status of the pensions systems and preserving the assurance role of the state.
In CEE countries, the base of the specific communist paths, the transition period, the emerging status, and the actual catching-up economy status must reveal special features and characteristics for attaining and maintaining sustainable pension systems. These special features can be subsumed as (i) measures for increasing the birth rate; (ii) measures to increase the actual health status of citizens; (iii) increasing the standard of living similar to the one established in the Western states of the European Union; (iv) increasing the social integration in the labor force of the young people (18–24 years); (v) decreasing the unemployment rate and further increase in the total amount of active population; (vi) consolidating the legal pension system environment.
The three-research hypothesis emphasized in the literature section has the following appliance outcome. Hypothesis 1 is confirmed by the econometrical results: the consolidation of the state budget in terms of increasing the number and amount of social contributions and enlarging employment percentage in the total labor force will generate higher amounts of pensions which will lead to the financial consolidation of pension systems. Hypothesis 2 is also confirmed by the empirical outcomes because increasing the GDP trend and enabling long-term sustainable economic growth will lead to a more competitive and stable economic environment which can contribute to the elderly persons' happiness.
Hypothesis 3 is also confirmed by the empirical results because the overall reforms in the pension systems that nowadays are enacted in CEE countries are oriented towards strengthening and improving the social status of pension systems can be a quid pro quo in reducing elderly persons' poverty.
Based on these aspects the policy recommendations: first, the governments must be aware that the social security systems, lato sensu, and pension systems, stricto sensu, must be reshaped and consolidated by the new social characteristics and values; second, regarding the financial aspects of pension system it must be revised and reshaped a new financial pension system scheme having at the background the new financial international features; third, the economic environment after the pandemic period will lead to the reconstruction and reconfiguration of the economic system, both national and international in order to adapt to the new economic realities.
The theoretical implications of the paper reveal the importance of reshaping the entire pension system in CEE countries due to the fact that the communist past of these countries and the long transition and emerging period to the market economy have slowed down the necessary reforms of the pension systems. Nowadays, in all CEE it is manifested the need of restructuring and strengthen the pension systems having the background of the new challenges ahead of the CEE economies and the aftermath of the post-pandemic period.
The managerial implications of the research outcomes imply a need for reshaping the pension scheme in CEE, in three ways. First, it is needed the update the pensions laws in CEE countries facing the new law realities and challenges; second, it is ongoing the process of digitalization of the entire pension system in order to evaluate and assess the imbalances between the several categories of pensionaries retired at different time periods; third, it is needed to recalculate the pensions points based on the new methodology in order to enhance the soundness of the pension systems and eliminate the differences between the different times of pensions and social categories structures.
The main added value of this paper is to bring together the three main features of an efficient and sustainable pension system: financial, economic, and social. This integrated approach enriched in the empirical research of this paper considering some of the most important variables and proxies can constitute a quid pro quo for future studies and developments. Moreover, the CEE countries appliance of this study reveals that between these countries have been enacted some similarities in the pension systems which must be taken into account by the governments regarding the administrative coordination between these states.
The weak points and restrained aspects of this study were the institutional characteristics of a social security system and a pension system which are very difficult to be measured and proxied by some variables. Second, the database was very difficult to be constructed due to a lack of data regarding several characteristics and variables. Third, it was very difficult to encompass all the important variables and features of the CEE countries' pension schemes dues to the similarities between these pension system structural schemes.
This study will continue with the enactment in future studies of engaging in an EU study which will analyze the similarities and differences between all pension systems together with the failures and strengths points. Moreover, it can be applied to empirical research based on similar pension systems in different EU regions, with a direct focus on the Euro Zone. Finally, it can be fulfilled an international study regarding the main pension systems structure and characteristics based on the types and continents.
Author Contributions
The authors contributed equally to this work.
Funding
This research received no external funding.
Acknowledgments
The authors thank the anonymous reviewers and editor for their valuable contribution.
Conflicts of Interest
The authors declare no conflict of interest.
References
- United Nations. Transforming our world: the 2030 Agenda for Sustainable Development. 2015. Available online: https://wedocs.unep.org/20.500.11822/9814.
- Chen, X.; Eggleston, K.; Sun, A. The impact of social pensions intergenerational relationships: Comparative evidence from China. The Journal of Economics and Ageing 2018, 12, 225–235. [Google Scholar] [CrossRef]
- Chepngeno-Langat, G. van der Wielen, N. ; Evandrou, M.; Falkingham, J. Unravelling the wider benefits of social pensions: Secondary beneficiaries of the older persons cash transfer program in the slums of Nairobi. Journal of Aging Studies 2019, 51, 100818. [Google Scholar]
- Walsh, K.; Scharf, T.; Van Regenmortel, S.; Wanka, A. (Eds.) Social Exclusion in Later Life - Interdisciplinary and Policy Perspectives. Springer Nature Switzerland AG, 2021.
- Lee, K. Old-age poverty in a pension latecomer: The impact of basic pension expansions in South Korea. Soc Policy Adm. 2022, 56, 1022–1040. [Google Scholar] [CrossRef]
- Gong, J.; Wang, G.; Wang, Y.; Zhao, Y. Consumption and poverty of older Chinese: 2011–2020. The Journal of the Economics of Ageing 2022, 23, 100410. [Google Scholar] [CrossRef]
- Romp, W.; Beetsma, R. OECD pension reform: The role of demographic trends and the business cycle. European Journal of Political Economy, 2022, 102280. [CrossRef]
- OECD 2021. Pensions at a Glance 2021: OECD and G20 Indicators. OECD Publishing, Paris. [CrossRef]
- Hinrichs, K. Recent pension reforms in Europe: More challenges, new directions. An overview,. Soc Policy Adm 2021, 55, 409–422. [Google Scholar] [CrossRef]
- Ebbinghaus, B. Inequalities and poverty risks in old age across Europe: The double-edged income effect of pension systems. Soc Policy Adm. 2021, 55, 440–455. [Google Scholar] [CrossRef]
- Westerhout, E.; Meijdam, L.; Ponds, E.; Bonenkamp, J. Should we revive PAYG? On the optimal pension system in view of current economic trends, European Economic Review 2022, 148, 104227. [Google Scholar] [CrossRef]
- Wronski, M. The impact of social security wealth on the distribution of wealth in the European Union. The Journal of the Economics of Ageing 2023, 24, 100445. [Google Scholar] [CrossRef]
- Lin, H.C.; Tanaka, A.; Wuc, P.S. Shifting from pay-as-you-go to individual retirement accounts: A path to a sustainable pension system. Journal of Macroeconomics 2021, 69, 103329. [Google Scholar] [CrossRef]
- Laub, N.; Hagist, C. Pension and Intergenerational Balance: A case study of Norway, Poland and Germany using Generational Accounting. Intergenerational Justice Review 2017, 2, 64–77. [Google Scholar] [CrossRef]
- Brosig, M.; Hinrichs, K. The “Great Recession” and Pension Policy Change in European Countries. In Nullmeier, F.; González de Reufels, D.; Obinger, H. (Eds.), International Impacts on Social Policy Short Histories in Global Perspective, Springer Nature Switzerland AG. 2022. [CrossRef]
- Chybalski, F.; Marcinkiewicz, E. The Replacement Rate: An Imperfect Indicator of Pension Adequacy in Cross-Country Analyses. Soc Indic Res 2016, 126, 99–117. [Google Scholar] [CrossRef]
- Koomen, M.; Wicht, L. Pension systems and the current account: An empirical exploration. Journal of International Money and Finance 2022, 120, 102520. [Google Scholar] [CrossRef]
- Németh, A.O.; Németh, P.; Vékás, P. Demographics, Labour Market, and Pension Sustainability in Hungary. Society and Economy 2019, 41, 1–26. [Google Scholar] [CrossRef]
- Barrios, S.; Moscarola, F.C.; Figari, F.; Gandullia, L. Size and distributional pattern of pension-related tax expenditures in European countries. International Tax and Public Finance 2020, 27, 1287–1320. [Google Scholar] [CrossRef]
- Popa, A.F.; Sahlian, D.N.; Nicoara, S.A.; Sgardea, F.M.; Vuta, M. Economic Freedom and Government Quality - Influence Factors for Social Insurance Budgets Sustainability in Central and Eastern European Countries. Economic Computation and Economic Cybernetics Studies and Research, 2022, 56, 273–288. [Google Scholar] [CrossRef]
- Kudrna, G.; Tran, C.; Woodland, A. Sustainable and equitable pensions with means testing in aging economies. European Economic Review 2022, 141, 103947. [Google Scholar] [CrossRef]
- Ștefan, G.M. A brief analysis of the administration costs of national social protection systems in EU member states. Procedia Economics and Finance 2015, 30, 780–789. [Google Scholar] [CrossRef]
- Cristescu, A. The Impact of the Aging Population on the Sustainability of Public Finances. Romanian Journal of Regional Science 2019, 13, 52–67. [Google Scholar]
- Dumiter, F.C.; Jimon, S.A. Public Pension Systems’ Financial Sustainability in Central and Eastern European Countries. In Fotea, S.L.; Fotea, I.S., Ed.; Văduva, S. (Eds.), Navigating Through the Crisis: Business, Technological and Ethical Considerations The 2020 Annual Griffiths School of Management and IT Conference (GSMAC), Vol 2, Springer Nature Switzerland AG, 2022. [Google Scholar] [CrossRef]
- Rotschedl, J. Selected factors affecting the sustainability of the PAYG pension system. Procedia Economics and Finance 2015, 30, 742–750. [Google Scholar] [CrossRef]
- Lancia, F.; Russo, A. Public Education And Pensions In Democracy: A Political Economy Theory. Journal of the European Economic Association 2016, 14, 1038–1073 http://wwwjstororg/stable/43965335. [Google Scholar] [CrossRef]
- Hammer, B.; Christl, M.; De Poli, S. Public redistribution in Europe: Between generations or income groups? . The Journal of the Economics of Ageing 2023, 24, 100426. [Google Scholar] [CrossRef]
- Shahid, A. Ageing with Dignity: Old-Age Pension Schemes from the Perspective of the Right to Social Security Under ICESCR. Human Rights Review 2014, 15, 455–471. [Google Scholar] [CrossRef]
- Alonso-Ortiz, J. Social security and retirement across the OECD. Journal of Economic Dynamics & Control 2014, 47, 300–316. [Google Scholar] [CrossRef]
- Halaskova, R. Structure of General Government Expenditure on Social Protection in the EU Member States. Montenegrin Journal of Economics 2018, 14, 7–21. [Google Scholar] [CrossRef]
- Han, K.J. Saving public pensions: Labor migration effects on pension systems in European countries. The Social Science Journal 2013, 50, 152–161. [Google Scholar] [CrossRef]
- Fenge, R.; Peglow, F. Decomposition of demographic effects on the german pension system. The Journal of the Economics of Ageing 2018, 12, 61–76. [Google Scholar] [CrossRef]
- Jimon, S.A.; Dumiter, F.C.; Baltes, N. Financial Sustainability of Pension Systems Empirical Evidence from Central and Eastern European Countries. Springer Nature Switzerland AG. 2021. [CrossRef]
- Di Liddo, G. Immigration and PAYG pension systems in the presence of increasing life expectancy. Economics Letters 2018, 162, 56–61. [Google Scholar] [CrossRef]
- Hoang, T. Fiscal competition and state pension reforms, Public Budgeting & Finance 2022, 42, 41–70. [CrossRef]
- Olivera, J. The distribution of pension wealth in Europe. The Journal of the Economics of Ageing 2019, 13, 30–42. [Google Scholar] [CrossRef]
- Haan, P.; Prowse, V. Longevity, life-cycle behavior and pension reform. MPRA Paper No. 39282. 2012. Available online: https://mpra.ub.uni-muenchen.de/39282/.
- Cipriani, G.P. Aging, Retirement, and Pay-As-You-Go Pensions. Macroeconomic Dynamics 2018, 22, 1173–1183. [Google Scholar] [CrossRef]
- Heer, B.; Trede, M. Age-specific entrepreneurship and PAYG: Public pensions in Germany. Journal of Macroeconomics 2023, 75, 103488. [Google Scholar] [CrossRef]
- Dieppe, A.; Guarda, P. (Eds.) Occasional Paper Series: Public debt, population ageing and medium-term growth. Occasional Paper No 165, European Central Bank, 2015.
- Jun, H. Social security and retirement in fast-aging middle-income countries: Evidence from Korea. The Journal of the Economics of Ageing 2020, 17, 100284. [Google Scholar] [CrossRef]
- Sanchez-Marcos, V.; Bethencourt, C. The effect of public pensions on women’s labor market participation over a full life cycle. Quantitative Economics 2018, 9, 707–733. [Google Scholar] [CrossRef]
- Falkstedt, D.; Backhans, M.; Lundin, A.; Allebeck, P.; Hemmingsson, T. Do working conditions explain the increased risks of disability pension among men and women with low education? A follow-up of Swedish cohorts. Scandinavian Journal of Work, Environment and Health 2014, 50, 483–492 http://wwwjstororg/stable/43188047. [Google Scholar] [CrossRef] [PubMed]
- Sundstrup, E.; Hansen, Å.M.; Mortensen, E.L.; et al. Retrospectively assessed psychosocial working conditions as predictors of prospectively assessed sickness absence and disability pension among older workers. BMC Public Health 2018, 18, 149. [Google Scholar] [CrossRef] [PubMed]
- Staubli, S.; Zweimüller, J. Does raising the early retirement age increase employment of older workers? . Journal of Public Economics 2013, 108, 17–32. [Google Scholar] [CrossRef] [PubMed]
- Engels, B.; Geyer, J.; Haan, P. Pension incentives and early retirement. Labour Economics 2017, 47, 216–231. [Google Scholar] [CrossRef]
- Wang, L. Fertility and unemployment in a social security system. Economics Letters 2015, 133, 19–23. [Google Scholar] [CrossRef]
- Mitchell, O.S.; Clark, R.L.; Lusardi, A. Income trajectories in later life: Longitudinal evidence from the Health and Retirement Study. The Journal of the Economics of Ageing 2022, 22, 100371. [Google Scholar] [CrossRef]
- Xinbang, C.; Wang, F.; Wang, Y.; Wang, Y. An investigation of whether pensions increase consumption: Evidence from family portfolios. Finance Research Letters 2022, 47, 102591. [Google Scholar] [CrossRef]
- Cammeraat, E. The relationship between different social expenditure schemes and poverty, inequality and economic growth. International Social Security Review 2020, 73, 101–123. [Google Scholar] [CrossRef]
- Coe, N.B.; Zamarro, G. Retirement effects on health in Europe. Journal of Health Economics 2011, 30, 77–86. [Google Scholar] [CrossRef]
- Eibich, P. Understanding the effect of retirement on health: Mechanisms and heterogeneity. Journal of Health Economics 2015, 43, 1–12. [Google Scholar] [CrossRef] [PubMed]
- Cheng, L.; Liu, H.; Zhang, Y.; Zhao, Z. The health implications of social pensions: Evidence from China’s new rural pension scheme. Journal of Comparative Economics 2018, 46, 53–77. [Google Scholar] [CrossRef]
- Chen, X.; Wang, T.; Buscha, S.H. Does money relieve depression? Evidence from social pension expansions in China. Social Science & Medicine 2019, 220, 411–420. [Google Scholar] [CrossRef]
- Pak, T.Y. What are the effects of expanding social pension on health? Evidence from the Basic Pension in South Korea. The Journal of the Economics of Ageing 2021, 18, 100287. [Google Scholar] [CrossRef]
- Mostert, C.M.; Mackay, D.; Awiti, A.; Kumar, M.; Merali, Z. Does social pension buy improved mental health and mortality outcomes for senior citizens? Evidence from South Africa’s 2008 pension reform. Preventive Medicine Reports 2022, 30, 102026. [Google Scholar] [CrossRef]
- Herl, C.R.; Kabudula, K. , Kahn, K.; Tollman, S.; Canning, D. Pension exposure and health: Evidence from a longitudinal study in South Africa. The Journal of the Economics of Ageing 2022, 23, 100411. [CrossRef]
- Fe, E.; Hollingsworth, B. Short- and long-run estimates of the local effects of retirement on health. Journal of the Royal Statistical Society 2016, A179, 1051–1067. Available online: http://www.jstor.org/stable/44682196.
- Heller-Sahlgren, G. Retirement blues. Journal of Health Economics 2017, 54, 66–78. [Google Scholar] [CrossRef]
- Fitzpatrick, M.D.; Moore, T.J. The mortality effects of retirement: Evidence from Social Security eligibility at age 62. Journal of Public Economics 2018, 157, 121–137. [Google Scholar] [CrossRef]
- Carrino, L.; Glaser, K.; Avendano, M. Later retirement, job strain, and health: Evidence from the new State Pension age in the United Kingdom. Health Economics 2020, 29, 891–912. [Google Scholar] [CrossRef] [PubMed]
- Barschkett, M.; Geyer, J.; Haan, P.; Hammerschmid, A. The effects of an increase in the retirement age on health—Evidence from administrative data. The Journal of the Economics of Ageing 2022, 23, 100403. [Google Scholar] [CrossRef]
- Silver, M.P.; Dass, A.R.; Laporte, A. The effect of post-retirement employment on health. The Journal of the Economics of Ageing 2020, 17, 100180. [Google Scholar] [CrossRef]
- Hallberg, D.; Johansson, P.; Josephson, M. Is an early retirement offer good for your health? Quasi-experimental evidence from the army. Journal of Health Economics 2015, 44, 274–285 101016/jjhealeco201509006. [Google Scholar] [PubMed]
- Krumins, J.; Berzins, A.; Dahs, A.; Ponomarjova, D. Healthy and Active Pre-Retirement and Retirement Ages: Elderly Inequality in Latvia. 11th International scientific conference „New Challenges of Economic and Business Development – 2019: Incentives for Sustainable Economic Growth” Proceedings, 2019. 463-475. ISBN 978-9934-18-428-4.
- Kang, J.Y.; Park, S.; Ahn, S. The effect of social pension on consumption among older adults in Korea. The Journal of the Economics of Ageing 2022, 22, 100364. [Google Scholar] [CrossRef]
- Brown, A.J. G, Fraikin, A. L. The old-age pension household replacement rate in Belgium. The Journal of the Economics of Ageing 2022, 23, 100402. [Google Scholar] [CrossRef]
- Shin, I. The Effect of Pension on the Optimized Life Expectancy and Lifetime Utility Level, MPRA Paper No. 41374. 2012. Available online: http://mpra.ub.uni-muenchen.de/41374/.
- Ju, Y.J.; Han, K.T.; Lee, H.J.; Lee, J.E.; Choi, J.W.; Hyun, I.S.; Park, E.C. Quality of life and national pension receipt after retirement among older adults. Geriatrics and Gerontology International 2017, 17, 1205–1213. [Google Scholar] [CrossRef] [PubMed]
- Cheng, L.; Liu, H.; Zhang, Y.; Zhao, Z. The health implications of social pensions: Evidence from China’s new rural pension scheme. Journal of Comparative Economics 2018, 46, 53–77 https://wwwjstororg/stable/48699023. [Google Scholar] [CrossRef]
- Gutierrez, R.; Lopez – Rodriguez, F.; Tejero, A. Interests and values. Changes in satisfaction with public pensions and healthcare in Spain before the Great Recession. Espanola de Investigationes Sociologicas 2023, 181, 41–60. [Google Scholar] [CrossRef]
- Kabar, R.; Kalwij, A. State pension eligibility age and retirement behavior: evidence from the United Kingdom household longitudinal study. Network for Studies on Pensions, Ageing, and Retirement – Academic Series 2023, 10, 1–40. [Google Scholar]
- Brunello, G.; De Paola, M.; Rocco, L. Pension reforms, longer working horizons, and absence from work. IZA Institute of Labor Economics 2023, 15871, 1–46. [Google Scholar] [CrossRef]
- Al–Hassan, H.; Devolder, P. Stochastic modelization of hybrid public pension plans (PAYG) under demographic risks with application to the Belgian case. LIDAM Discussion Paper 2022, 42, 1–32. [Google Scholar]
- Safaralievich, M.B. Efficiency of pension systems. International Journal of Business Diplomacy and Economy 2022, 1, 34–40. [Google Scholar]
- Aubry, J.P. Public pensions investment update: have alternatives helped or hurt? Center for Retirement and research at Boston College 2022, 22, 1–11. [Google Scholar]
- Baurin, A.; Hindriks, J. Intergenerational consequences of gradual pension reforms. European Journal of Political Economy 2022, 102336, 1–12. [Google Scholar] [CrossRef]
- Romp, W.; Beetsma, R. OECD pension reform: The role of demographic trends and business cycle. European Journal of Political Economy 2022, 102280, 1–18. [Google Scholar] [CrossRef]
- Hoang, T.; Maher, C. Fiscal condition, institutional constraints, and public pension contribution: are pension contribution shortfalls fiscal illusion? Public Budgeting & Finance 2022, 42, 93–124. [Google Scholar] [CrossRef]
- Wolf, I. The binary path of risks in pension systems and political pressure. World Review of Political Economy 2021, 12, 255–275. [Google Scholar] [CrossRef]
Figure 1.
Plots regarding the interconnections between HDI and macroeconomic variables.
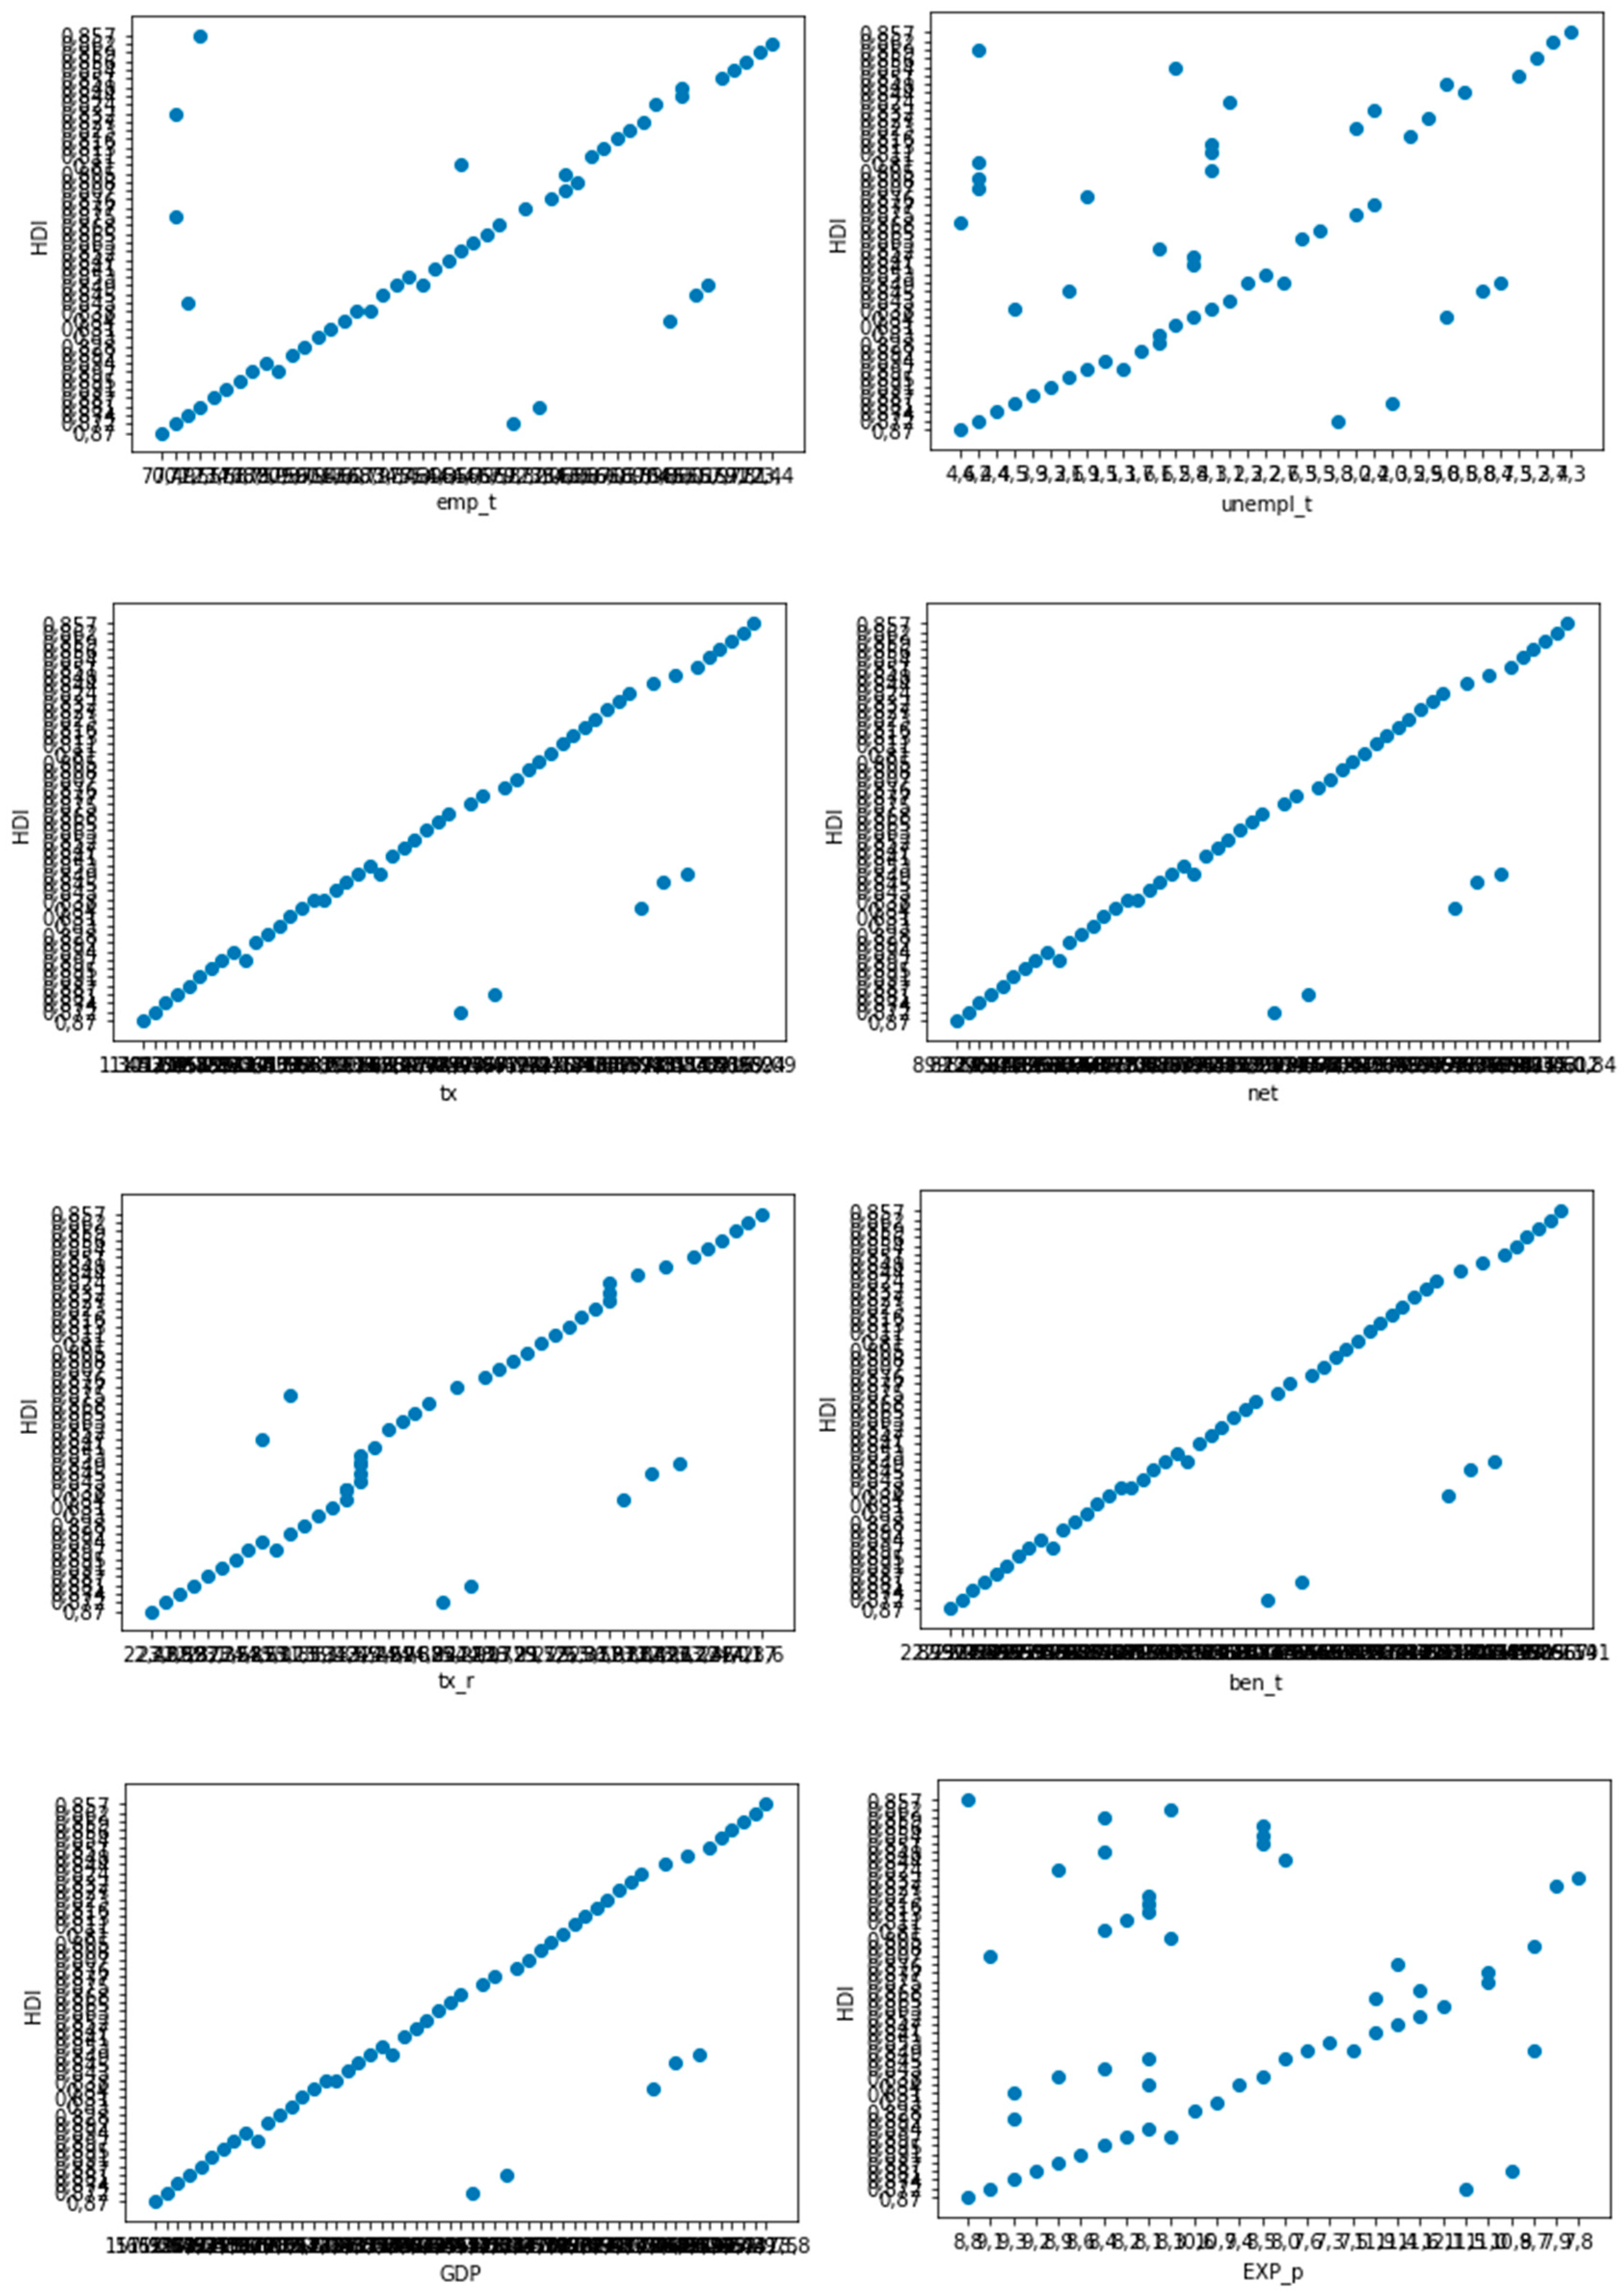
Figure 2.
Plots regarding the interconnections between Happiness Index and macroeconomic variables.
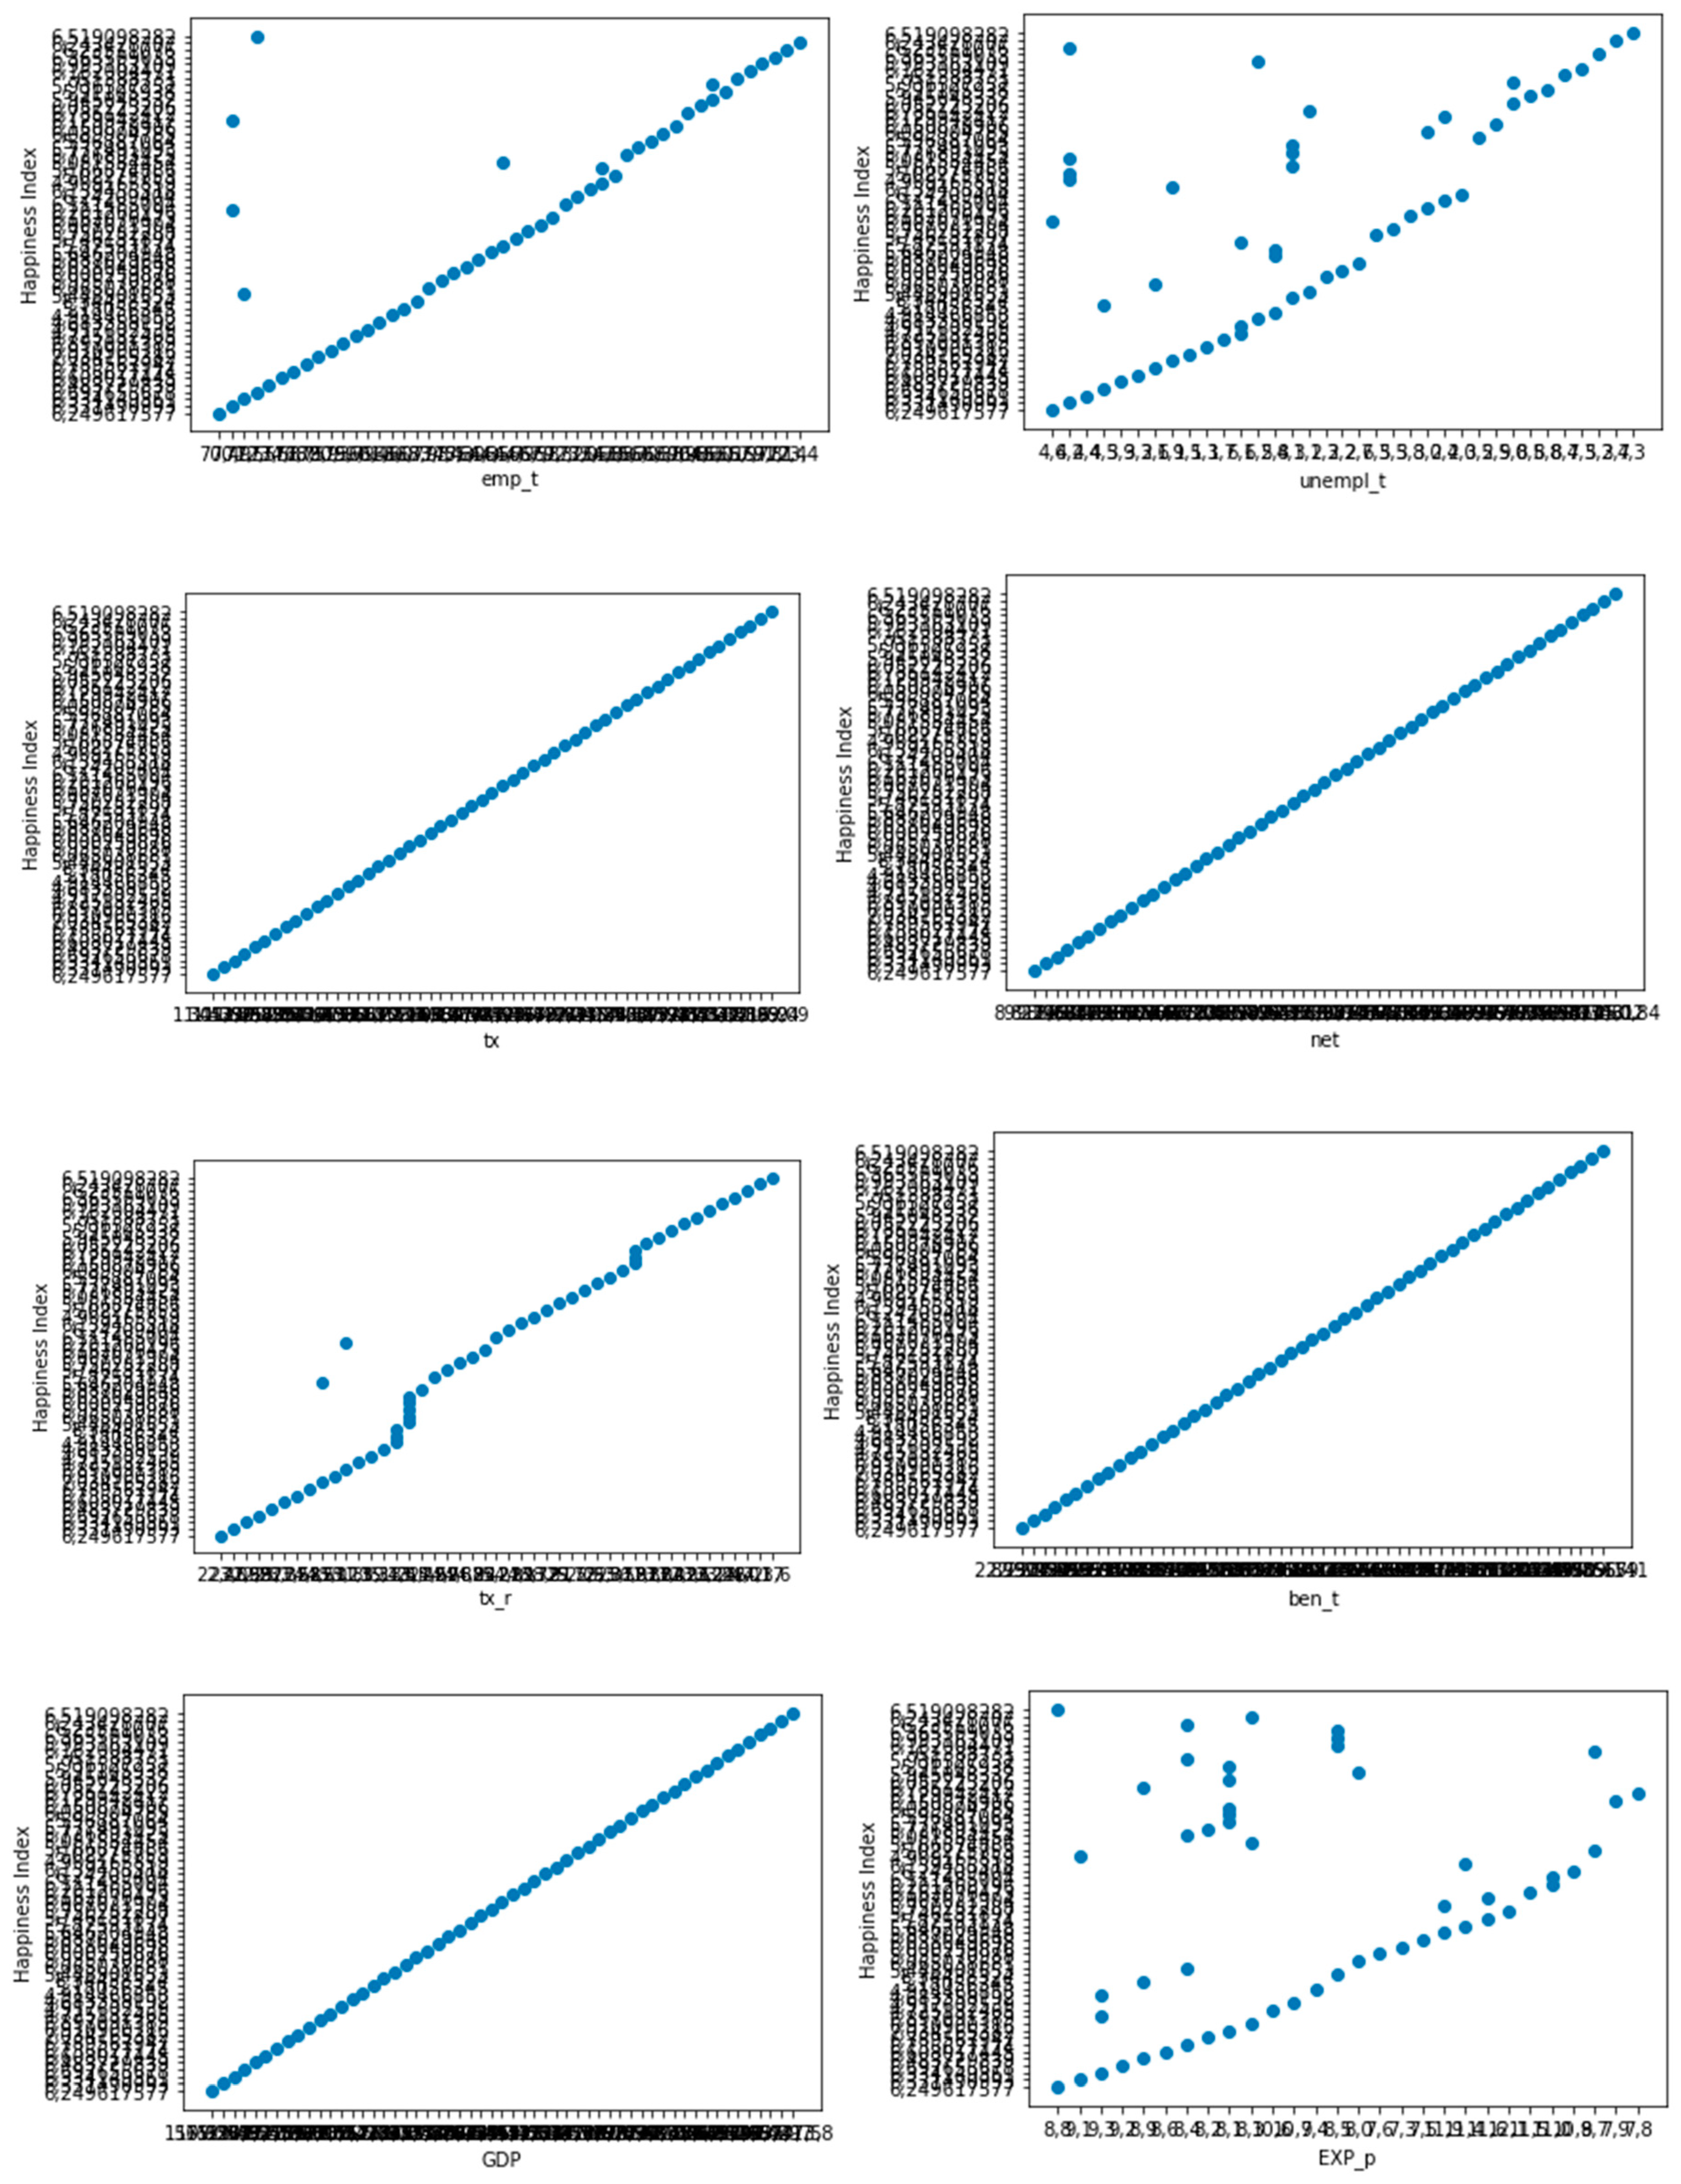
Figure 3.
Plots regarding the interconnections between Poverty and macroeconomic variables.
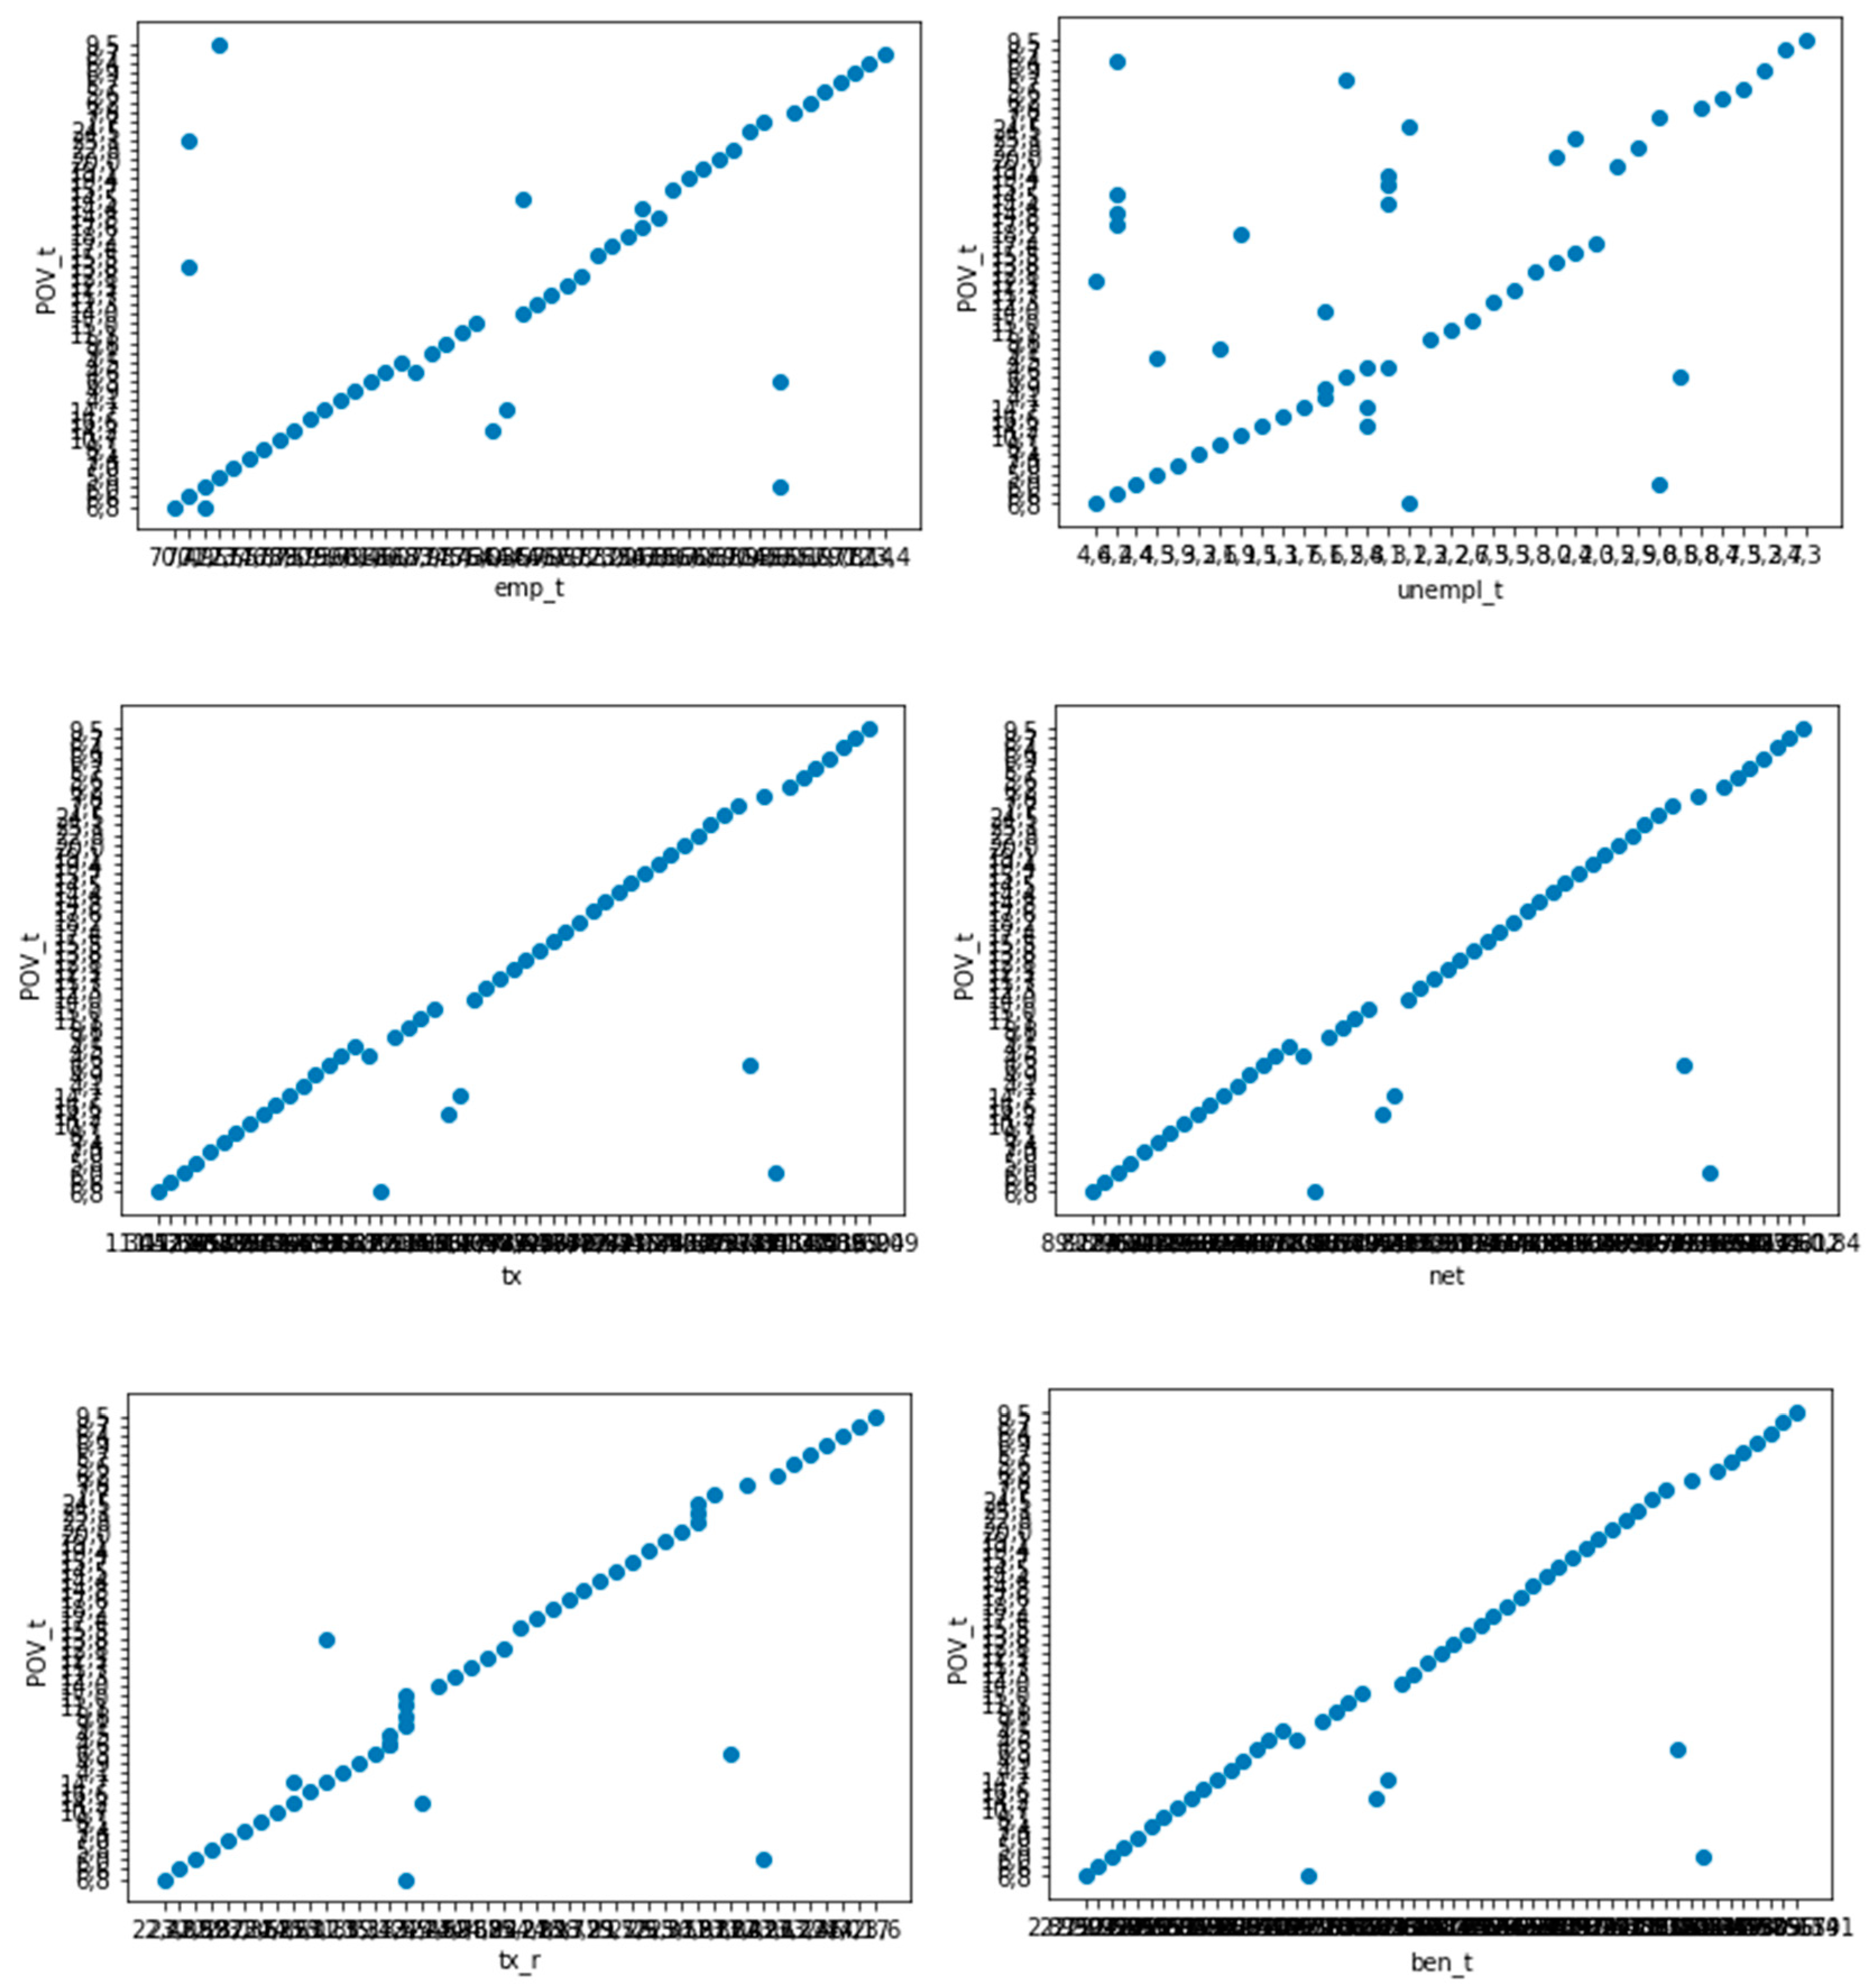
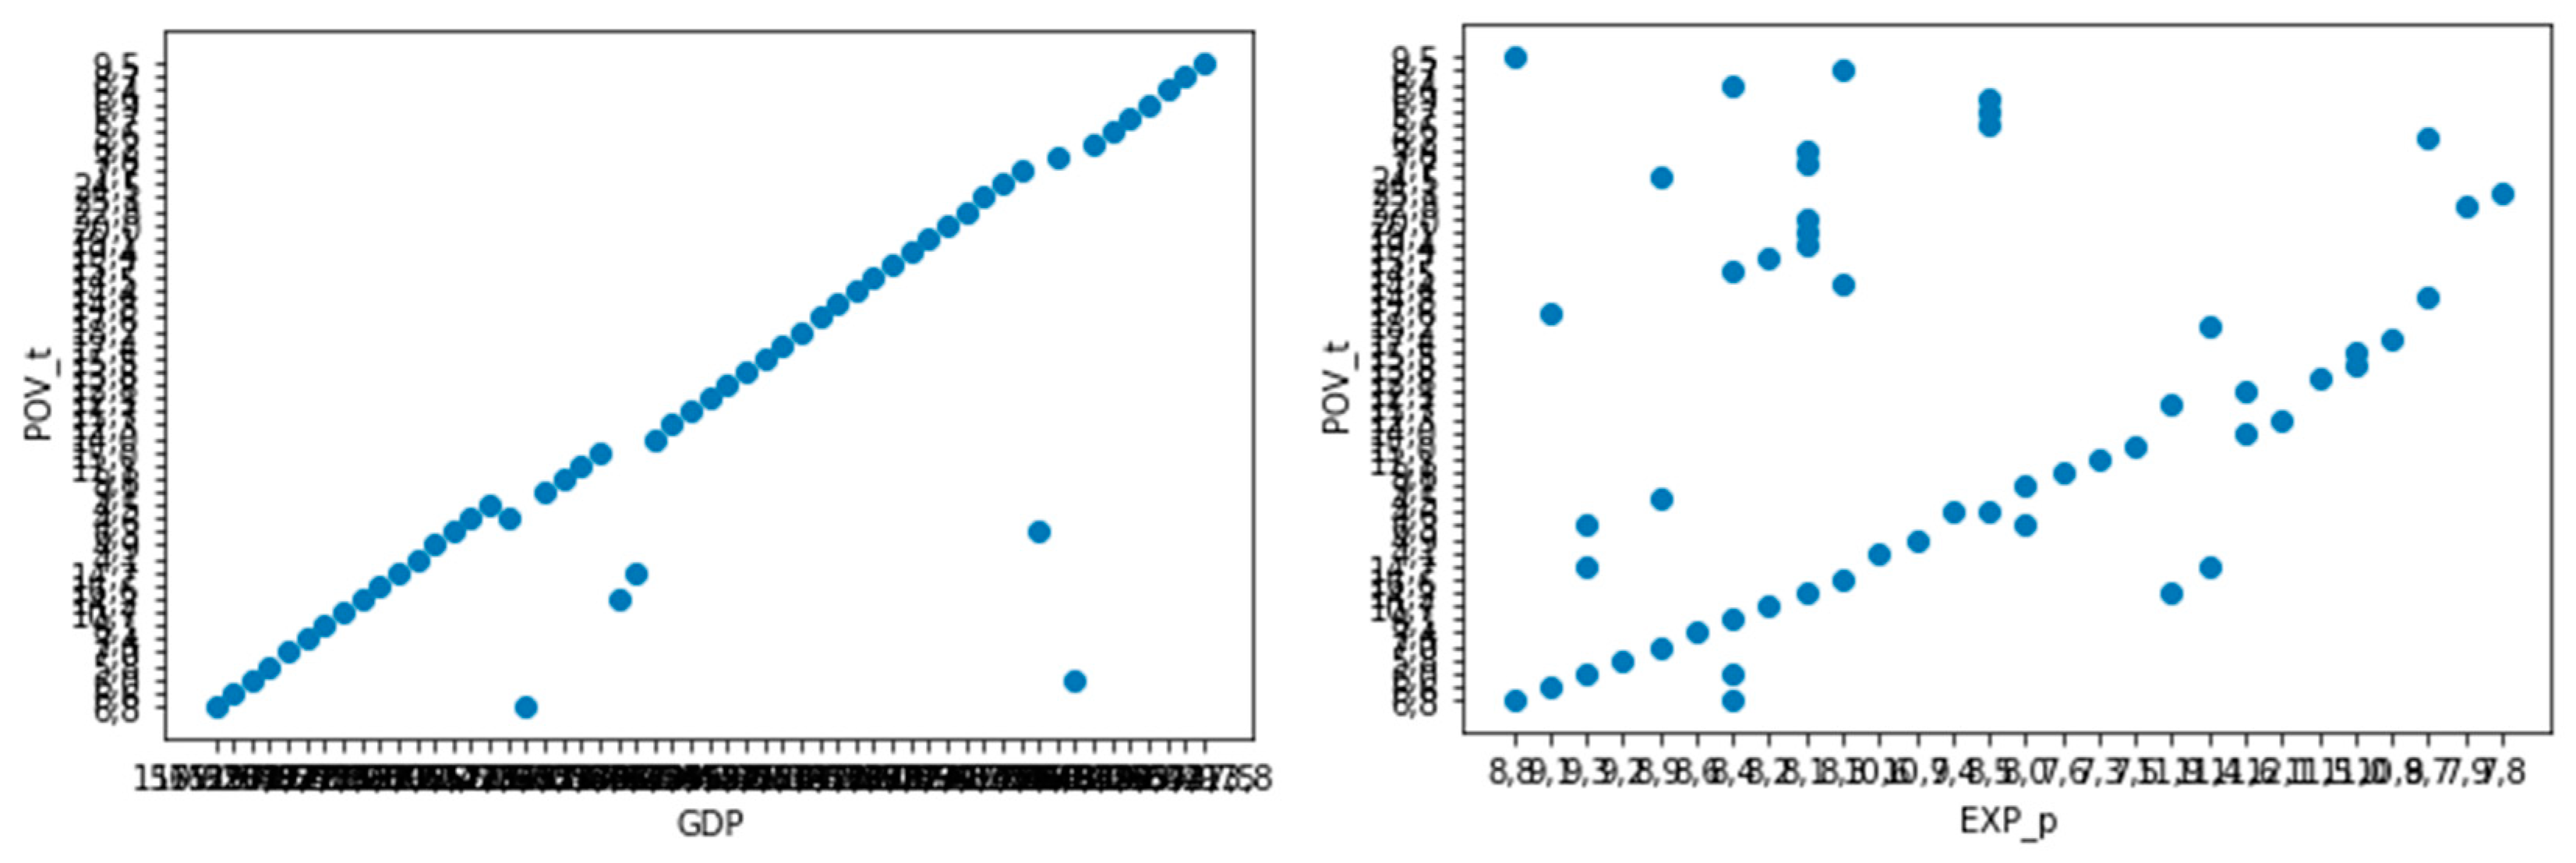

Table 1.
Previous empirical studies regarding the financial aspects of pension systems.
| Author | Research method | Sample | Results and main conclusion |
|---|---|---|---|
| Ștefan (2015) | Panel data model | 28 EU countries | The number of taxpayers, the number of unemployed populations, and the real GDP growth rate influence social expenditures. |
| Chybalski & Marcinkiewicz (2016) | Spearman’s rank correlation Panel regression models |
EU countries | The financial adequacy of pension systems is not broadly measured by the replacement rate. |
| Laub & Hagist (2017) | Generational Accounting | Norway, Poland, Germany | Pension systems reforms determined a more intergenerationally balanced pension system and the debt to be paid by future generations was reduced. |
| Németh, Németh & Vékás (2019) | Scenario technique | Hungary | Social contribution payments and pension benefits are the main factors that influence the sustainability of the pension system. |
| Cristescu (2019) | Panel data model | EU countries | Retirement age, contributory period, and income are the main factors that enhance pension sustainability. |
| Barrios et al. (2020) | Microsimulation model | EU countries | Pension-related tax expenditures have a sizeable impact on revenue (up to + 26% in Romania). |
| Lin, Tanaka & Wuc (2021) | Multi-period over-lapping generation model | Taiwan | PAYG pension systems have a positive welfare effect but place a larger burden on future generations. |
| Kudrna, Tran & Woodland (2022) | Overlapping generations model |
Australia | Means-tested pension systems with fiscal and a redistributive stabilization device could be sustainable in the long run. |
| Westerhout et al. (2022) | Numerical simulation experiments | If the low average rate of economic growth, the low average capital market rate of return, the low volatility of economic growth and the high volatility of the capital market rate of return persist in the coming decades, the optimal size of PAYG should increase. |
|
| Dumiter & Jimon (2022) | Ordinary least squares regressions | Czech Republic, Hungary, Poland, Slovakia, Romania |
The expenditures with social protection are correlated with demographic and labor market features. |
| Koomen & Wicht (2022) | Overlapping generations model |
49 countries | There is a positive significant relationship between fully-funded pension system and current account balance. |
| Brosig & Hinrichs (2022) | EU countries | Pension reforms enacted since 2008 have improved the financial sustainability, but in many cases also endangered the benefits’ adequacy. | |
| Popa et al. (2022) | Ordinary least squares regressions | Czech Republic, Hungary, Poland, Slovakia, Romania |
Economic freedom, quality of public services, the government's capacity to draw up and implement sound and stable policies and the control of corruption positively influences social budget revenues. |
| Hammer, Christl & De Poli (2023) | Quartile analysis | 27 EU countries and the UK | The old-age-oriented countries provide generous benefits to pensioners (most Southern European countries). The low-income-oriented countries support low income population (Northern European countries). |
| Wronski (2023) | Correlation analysis | 19 EU countries | Social security wealth reduces wealth inequality both at the country level and in the whole European Union. |
Table 2.
Previous empirical studies regarding the economic aspects of pension systems.
| Author | Research method | Sample | Results and main conclusion |
|---|---|---|---|
| Falkstedt et al. (2014) | Cox proportional-hazards regression | 9985 men and 9730 women from Sweden | Working conditions explain the increased rate of disability pension among people with lower education. |
| Wang (2015) | Overlapping generations model | The pension system may increase fertility and decrease unemployment. | |
| Dieppe & Guarda (2015) | General equilibrium | Portugal, Luxembourg Finland | To coop the demographic shocks the reforms must encourage labor force participation. |
| Engels, Geyer & Haan (2017) | Multivariate analysis | Germany | Increasing the retirement age favors unemployment. |
| Cipriani (2018) | Overlapping generations model | Aging produces an increase in retirement age. | |
| Fenge & Peglow (2018) | Simulation model and long run projections |
Germany | The increase in net migration and fertility has a positive impact on the pension system sustainability, but cannot counteract the pressure of life expectancy growth. |
| Sanchez-Marcos & Bethencourt (2018) | Partial equilibrium life-cycle model |
USA | The elimination of spousal and survivor benefits can increase the female labor supply. |
| Olivera (2019) | Comparative analysis of socio-economic status life tables | 26 EU countries | Socio-economic status inequalities in mortality and tertiary education are less important in explaining pension wealth inequality. |
| Jun (2020) | Probit regression model | South Korea | A greater utility perceived by workers from continued work due to additional earnings and pension wealth gains will determine the postponement of retirement. |
| Cammeraat (2020) | OLS and 2SLS regression models |
22 EU countries | Public social expenditure is reducing poverty and inequality, but only expenditure on housing determines the GDP growth. |
| Jimon, Dumiter & Baltes (2021) | OLS regression models | Czech Republic, Hungary, Poland, Slovakia, Romania |
Pension system sustainability is related to socio-economic and medical characteristics of population. |
| Mitchell, Clark & Lusardi (2022) | Multinomial Logit regression model Quartile analysis |
USA | The real incomes of retirees remained relatively stable. |
| Xinbang et al. (2022) | Regression analysis | China | The pension system assures the basic life after retirement and have a positive influence on consumption level. |
| Hoang (2022) | EHA and the IV-probit model | 50 states | Interstate migration determines states to adopt pension reform and different actions to improve efficiency. |
| Heer & Trede (2023) | OLG model | Germany | The sustainability of the pension system can be achieved only be the increase of the retirement age up to 70 years. |
Table 3.
Previous empirical studies regarding the social aspects of pension systems.
| Author | Research method | Sample | Results and main conclusion |
|---|---|---|---|
| Hallberg, Johansson & Josephson (2015) | OLS Two-stage least-squares |
Sweden | Early retirement can reduce the mortality risk. |
| Eibich (2015) | Regression Discontinuity Design | Germany | Retirement improves subjective health status and mental health. |
| Fe & Hollingsworth (2016) | Regression discontinuity design (RDD) Panel data model |
11 331 UK male residents | Retirement favors sedentarism and social isolation, indirectly negatively affecting the health of retirees. |
| Ju et al. (2017) | Generalized estimating equations model | Korea | Pension benefits have a positive influence on satisfaction and quality of life. |
| Heller-Sahlgren (2017) | Regression-discontinuity design (RDD) 2SLS model |
10 European countries | Retirement has a large negative longer-term impact on mental health. |
| Cheng et al. (2018) | Fixed-effect model with instrumental variable correction. | China | Pensions have a positive effect on the physical health and cognitive function of the elderly. |
| Chena, Wang & Buscha (2019) | Two-stage least-squares | China | Pension provisions have a positive impact on mental well-being and decrease depressive symptoms. |
| Carrino, Glaser & Avendano (2020) | OLS regressions | UK | The growth of retirement age increases the probability of depressive symptoms among women in a lower occupational grade. |
| Silver, Dass & Laporte (2020) | Conditional Mixed Process (CMP) model | USA |
post-retirement employment has a positive effect on self-assessed health and depressive symptoms for both women and men. |
| Pak (2021) | Difference-in-differences models | South Korea | Pension reduces depressive symptoms. |
| Kang, Park & Ahn (2022) | Linear regression models with the fixed-effect model |
South Korea | The social pension reduces poverty among older adults and improved food, clothing and healthcare products consumption. |
| Brown & Fraikin (2022) | Discrete-time logistic duration model Microsimulation model |
Belgium | The pension replacement rate plays an important role in decreasing poverty. |
| Barschkett et al. (2022) | Difference-in-Differences approach | Germany | Increasing the retirement age has a negative effect on health. |
| Mostert et al. (2022) | Two-stage Least Squared Model | South Africa | Pension distributions improve mental health outcomes of the elderly and prevent depression, traumatic stress, and death. |
| Herl et al. (2023) | OLS regressions | South Africa | Pension is associated with better physical health. |
Table 4.
Data, variables, and specifications.
| Variables | Construction mechanism | Unit/Scale | Sources |
| Dependent variable | |||
| Human Development Index (HDI) | Three key dimensions: A long and healthy life; 2. Access to education; 3. A decent standard of living. |
Three measures: Life expectancy. Years of schooling of children at school entry age and mean years of schooling of the adult population. GNI per capita is adjusted for the price level of the country. |
Human Development Reports – Human Development Index – Country Insights – Database. |
| Happiness Index (HPI) | Three main indicators: 1. Life evaluations. 2. Positive emotions. 3. Negative emotions. |
Variables included: Happiness score or subjective well-being; GDP per capita; Healthy Life Expectancy, Social Support; Freedom to make life choices; Generosity; Corruption Perception; Positive affect; Negative affect; GINI of household income; GINI index; Institutional trust. | The World Happiness Report – Country Rankings – Database. |
| Poverty – total (POV_t) | At risk poverty rate – 65 years over, %. | Cut-off point: 60% of median equivalised income after social transfers | Eurostat Database. |
| Independent variables | |||
| Employment (emp_t) | Employment and activity by sex and age, from 20 to 64 years. | Percentage of total population. | Eurostat Database. |
| Unemployment (unempl_t) | Unemployment by sex and age, from 15 to 74 years. | Percentage of total population. | Eurostat Database. |
| Beneficiaries (ben_t) | Pension beneficiaries at 31st december. | Number of people. | Eurostat Database. |
| Control variables | |||
| Taxes (tx) | Taxes. | Single person without children earning 100% of the average earning, euro. | Eurostat Database. |
| Net earnings (net) | Net earnings. | Single person without children earning 100% of the average earning, euro. | Eurostat Database. |
| Gross Domestic Product (GDP) | Gross Domestic Product at market prices. | Current prices, million euro. | Eurostat Database. |
| Expenditures on Pensions (EXP_p) | Expenditures on pensions. | Percentage of gross domestic product (GDP). | Eurostat Database. |
Table 5.
Descriptive statistics analysis.
| Variable | Obs | Mean | Std. Dev. | Min | Max |
|---|---|---|---|---|---|
| HDI | 55 | 0.8518 | 0.0256 | 0.8050 | 0.8970 |
| HPI | 55 | 5.9710 | 0.5743 | 4.6833 | 7.0341 |
| POV_t | 55 | 17.6954 | 12.4004 | 5.2909 | 40.5774 |
| emp_t | 55 | 69.4436 | 4.9782 | 59.9000 | 80.3000 |
| unempl_t | 55 | 4.3781 | 1.9918 | 1.3000 | 9.0000 |
| tx | 55 | 4.8054 | 2.2255 | 1.3000 | 10.1000 |
| net | 55 | 1225.14 | 460.8173 | 608.41 | 2242.43 |
| ben_t | 55 | 27.0390 | 4.6877 | 21.8800 | 36.9100 |
| GDP | 55 | 7.6072 | 4.0521 | 2.0000 | 17.6000 |
| EXP_p | 55 | 19.6931 | 13.0319 | 6.8764 | 53.2504 |
Table 6.
Comparative ordinary least square analysis.
| HDI | HPI | POV_t | |||||||
| OLS | FE | RE | OLS | FE | RE | OLS | FE | RE | |
| c | 0.5416* (12.54) |
0.8033* (22.84) |
0.6894* (22.62) |
-2.8972 (-1.90) |
0.7606 (0.40) |
-2.3649 (-1.46) |
1.2000 (8.24) |
4.2446 (6.50) |
4.6888 (8.28) |
| emp_t | 0.5416* (7.71) |
0.0004*** (1.03) |
0.0017*** (4.36) |
0.1302* (7.07) |
0.0859** (3.68) |
0.1031* (4.94) |
-1.3276 (-7.52) |
-3.3044 (-4.03) |
-3.8955 (-5.31) |
| unempl_t | 0.0108*** (2.39) |
-0.0045*** (-1.3656) |
0.0001*** (0.06) |
0.3305* (2.0769) |
0.4818* (2.73) |
0.35* (2.28) |
1.8241 (1.19) |
-2.7229 (-0.43) |
-6.3543 (-1.17) |
| tx | -0.0057*** (-1.26) |
0.0045*** (1.59) |
0.0005*** (0.21) |
-0.1899* (-1.20) |
-0.0807** (-0.53) |
-0.1899* (-1.38) |
-3.788 (-2.49) |
-2.6955 (0.50) |
-1.1959 (-0.24) |
| net | 9.080 (2.34) |
-4.1300 (-0.83) |
4.7900 (1.35) |
-0.0002*** (-1.74) |
-0.0006*** (-2.58) |
-3.9600 (-0.21) |
-386.61 (-2.95) |
168.44 (1.84) |
141.98 (2.15) |
| ben_t | -0.0002*** (-0.69) |
0.0003*** (1.11) |
0.0006*** (2.47) |
-0.0238** (-2.17) |
-0.0339** (-2.08) |
5.7400 (0.00) |
-4.4457 (-4.22) |
3636.89 (0.63) |
2779.12 (0.61) |
| GDP | -0.0024** (-5.54) |
-0.0002*** (-0.45) |
-0.0009*** (-2.92) |
0.0379** (2.44) |
-0.0097*** (-0.40) |
0.0404** (2.37) |
5.5477 (3.73) |
-4897.73 (-0.57) |
7567.88 (1.26) |
| EXP_p | 1.1900 (10.69) |
6.1100 (1.97) |
1.2200 (5.57) |
-3.0900 (-0.78) |
-3.38 (-2.065) |
1.4100 (1.22) |
6.41 (17.06) |
-1.0109 (-1.76) |
-0.9396* (-2.31) |
| R-Squared | 0.94 | 0.99 | 0.97 | 0.86 | 0.95 | 0.90 | 0.97 | 0.99 | 0.99 |
| F / Wald | 115.74 | 42.65 | 173.25 | 42.89 | 31.13 | 35.64 | 245.07 | 1232.67 | 2349.63 |
| Hausman (chi-squared test) | 51.48 | 39.66 | 14.62 | ||||||
Notes: *p<0.1; **p<0.05; ***<0.01; HDI, HPI & POV_t represent the dependent variables of the regression; t statistics values are presented in parenthesis.
Table 7.
Comparative two-stage least square analysis.
| HDI | HPI | POV_t | |||||||
| 2SLS | FE | RE | 2SLS | FE | RE | 2SLS | FE | RE | |
| c | 0.5232* (0.05) |
0.8265* (22.66) |
0.6948* (21.53) |
-1.8492 (-1.09) |
1.8956 (0.88) |
-1.5710 (-0.82) |
12.7645 (7.84) |
35.7341 (5.57) |
3.9582 (6.82) |
| emp_t | 0.0042** (0.00) |
0.0003*** (0.73) |
0.0017** (4.49) |
0.1190* (5.79) |
0.0740** (2.95) |
0.0931** (3.95) |
-14.2689 (-7.22) |
-2.6091 (-3.48) |
-32.1990 (-4.46) |
| unempl_t | 0.0120** (2.28) |
-0.0042** (-1.44) |
-0.0032** (-1.05) |
0.3926* (2.23) |
0.4925* (2.84) |
0.4587* (2.54) |
2.0734 (1.23) |
7496.14 (0.14) |
24.6340 (0.45) |
| tx | -0.0065** (-1.22) |
0.0051** (1.97) |
0.0032** (1.20) |
-0.2713* (-1.53) |
-0.0958** (-0.62) |
-0.3079* (-1.91) |
-41.0830 (-2.41) |
-52.973 (-1.15) |
-75.8880 (-1.56) |
| net | 6.7900 (1.55) |
-7.2200 (-1.45) |
-2.7200 (-0.07) |
-0.0002*** (-1.68) |
-0.0007*** (-2.51) |
2.1700 (0.01) |
287.8194 (-2.06) |
207.3621 (2.37) |
239.9830 (3.71) |
| ben_t | -0.0001*** (-0.31) |
0.0001*** (0.56) |
0.0007*** (3.12) |
-0.0300** (-2.55) |
-0.0415** (-2.22) |
-0.0022** (-0.14) |
-5.0358 (-4.45) |
5883.85 (1.05) |
5217.13 (1.15) |
| GDP | -0.0024** (-4.82) |
-0.0003*** (-0.73) |
-0.0006*** (-1.65) |
0.0497** (2.93) |
-0.0147** (-0.59) |
0.0440** (2.04) |
57.852 (3.55) |
-5130.07 (-0.68) |
-1092.22 (-0.16) |
| EXP_p | 1.1900 (9.74) |
2.8400 (0.97) |
7.5200 (3.31) |
-6.6500 (-1.64) |
-2.6500 (-1.55) |
1.3400 (1.00) |
6.3642 (16.33) |
-0.7698* (-1.50) |
-0.6624* (-1.64) |
| R-Squared | 0.94 | 0.99 | 0.98 | 0.86 | 0.95 | 0.90 | 0.97 | 0.99 | 0.99 |
| F / Wald | 101.90 | 229.57 | 178.05 | 39.94 | 29.48 | 35.35 | 266.51 | 1727.14 | 3765.63 |
Notes: *p<0.1; **p<0.05; ***<0.01; HDI, HPI & POV_t represent the dependent variables of the regression; t statistics values are presented in parenthesis.
Table 8.
Unit root tests – Fischer – Augmented Dickey-Fuller (ADF) and Fischer – Phillips – Perron (PP).
Table 8.
Unit root tests – Fischer – Augmented Dickey-Fuller (ADF) and Fischer – Phillips – Perron (PP).
| Variables |
Fischer – ADF Test | Fischer – PP Test | |||||||
|---|---|---|---|---|---|---|---|---|---|
| Constant | Constant and Trend | Constant | Constant and Trend | ||||||
| t-statistic | p-value | t-statistic | p-value | t-statistic | p-value | t-statistic | p-value | ||
| HDI HPI POV_t emp_t unempl_t tx net Level ben_t GDP EXP_p |
9.5694 | 0.4790 | 7.8969 | 0.6389 | 20.0191 | 0.0291** | 9.5168 | 0.4838 | |
| 2.7420 | 0.9869 | 18.8234 | 0.0310** | 2.5632 | 0.9899 | 34.6689 | 0.0001*** | ||
| 28.7379 | 0.0014*** | 38.6428 | 0.0000*** | 34.9735 | 0.0001*** | 24.0637 | 0.0074*** | ||
| 15.1847 | 0.1255 | 11.5510 | 0.3162 | 1.3255 | 0.9994 | 6.9875 | 0.7266 | ||
| 8.4898 | 0.5811 | 18.3128 | 0.0499* | 1.9580 | 0.9967 | 3.8324 | 0.9546 | ||
| 4.3499 | 0.9302 | 13.9888 | 0.1735 | 1.9360 | 0.9968 | 3.3913 | 0.9707 | ||
| 5.1912 | 0.8780 | 15.4392 | 0.1169 | 4.73210 | 0.9083 | 4.1237 | 0.9416 | ||
| 17.0063 | 0.0742* | 13.2886 | 0.2080 | 15.4451 | 0.1167 | 27.6844 | 0.0020*** | ||
| 0.5836 | 1.0000 | 8.9144 | 0.5402 | 1.3765 | 0.9993 | 18.1848 | 0.0519* | ||
| 1.7034 | 0.9981 | 10.3990 | 0.4062 | 0.6834 | 1.0000 | 3.6609 | 0.9614 | ||
| HDI HPI POV_t emp_t unempl_t tx net 1st ben_t dif. GDP EXP_p |
15.2430 | 0.1235 | 11.7226 | 0.3040 | 18.1665 | 0.0522 | 23.5285 | 0.0090*** | |
| 39.5550 | 0.0000*** | 24.7072 | 0.0059*** | 67.2140 | 0.0000*** | 57.4348 | 0.0000*** | ||
| 38.5202 | 0.0000*** | 41.6979 | 0.0000*** | 38.4722 | 0.0000*** | 46.6716 | 0.0000*** | ||
| 13.4754 | 0.1983 | 4.1970 | 0.9380 | 11.0193 | 0.3560 | 4.7504 | 0.9072 | ||
| 11.2192 | 0.3407 | 0.8773 | 0.9999 | 4.5178 | 0.9210 | 0.6392 | 1.0000 | ||
| 11.1324 | 0.3473 | 1.2184 | 0.9996 | 5.6176 | 0.8463 | 0.6280 | 1.0000 | ||
| 23.7911 | 0.0082*** | 12.9715 | 0.2253 | 19.4541 | 0.0349** | 21.2580 | 0.0194** | ||
| 36.6656 | 0.0001*** | 22.1274 | 0.0145** | 38.0651 | 0.0000*** | 35.7338 | 0.0001*** | ||
| 28.1533 | 0.0017*** | 24.4896 | 0.0064*** | 33.3038 | 0.0002*** | 30.1732 | 0.0008*** | ||
| 13.4747 | 0.1983 | 6.6705 | 0.7561 | 10.6732 | 0.3835 | 3.4748 | 0.9679 | ||
| HDI HPI POV_t emp_t unempl_t tx net 2nd ben_t dif. GDP EXP_p |
31.6277 | 0.0005*** | 16.7360 | 0.0804* | 41.7726 | 0.0000*** | 37.6193 | 0.0000*** | |
| 49.4573 | 0.0000*** | 26.4837 | 0.0031*** | 91.7182 | 0.0000*** | 77.3631 | 0.0000*** | ||
| 62.3122 | 0.0000*** | 31.1992 | 0.0005*** | 67.8915 | 0.0000*** | 52.3499 | 0.0000*** | ||
| 20.9090 | 0.0217** | 33.4272 | 0.0002*** | 23.2970 | 0.0097** | 45.4464 | 0.0000*** | ||
| 13.4145 | 0.2014 | 38.4734 | 0.0000*** | 14.2309 | 0.1627 | 51.8556 | 0.0000*** | ||
| 18.9492 | 0.0409** | 41.3270 | 0.0000*** | 17.1920 | 0.0702 | 45.2660 | 0.0000*** | ||
| 15.9526 | 0.1010 | 7.6899 | 0.6591 | 32.2941 | 0.0004*** | 17.0157 | 0.0740* | ||
| 25.9997 | 0.0037** | 21.8658 | 0.0158** | 53.9178 | 0.0000*** | 50.8666 | 0.0000*** | ||
| 42.5584 | 0.0000*** | 30.5120 | 0.0007*** | 51.0581 | 0.0000*** | 42.1172 | 0.0000*** | ||
| 15.1614 | 0.1263 | 5.8383 | 0.8287 | 15.5746 | 0.1125 | 8.2044 | 0.6098 | ||
Notes: *p<0.1; **p<0.05; ***<0.01;.
Table 9.
Cointegration test Pedroni – Eagle Granger (EG).
| Variables |
statistic | p-value | Weighted statistic |
p-value |
|---|---|---|---|---|
| HDI – emp_t HPI – unempl_t POV_t – tx net – ben_t GDP – EXP_p |
1.0169 | 0.1546 | 0.8736 | 0.1912 |
| 2.1952 | 0.0141 | 0.3297 | 0.3708 | |
| 1.3693 | 0.0854 | 1.1042 | 0.1347 | |
| -0.5733 | 0.7168 | -0.4098 | 0.6591 | |
| 5.5242 | 0.0000 | 1.7338 | 0.0415 |
Table 10.
Cointegration test – Kao residual.
| Coefficient | Std. error | t-statistic | p-value | |
|---|---|---|---|---|
| ADF | -2.5850 | 0.0049 | ||
| Resid (-1) | -0.5913 | 0.1413 | -4.1824 | 0.0001 |
| D(Resid (-1)) | 0.1571 | 0.1498 | 1.0490 | 0.3000 |
Disclaimer/Publisher’s Note: The statements, opinions and data contained in all publications are solely those of the individual author(s) and contributor(s) and not of MDPI and/or the editor(s). MDPI and/or the editor(s) disclaim responsibility for any injury to people or property resulting from any ideas, methods, instructions or products referred to in the content. |
© 2023 by the authors. Licensee MDPI, Basel, Switzerland. This article is an open access article distributed under the terms and conditions of the Creative Commons Attribution (CC BY) license (https://creativecommons.org/licenses/by/4.0/).
Copyright: This open access article is published under a Creative Commons CC BY 4.0 license, which permit the free download, distribution, and reuse, provided that the author and preprint are cited in any reuse.


