Submitted:
26 April 2023
Posted:
03 May 2023
You are already at the latest version
Abstract
Saltwater intrusion in the rapidly developing city of Da Nang in central Vietnam is currently causing various water-related challenges, including inadequate water supply and water pollution. An integrated SWAT-MODFLOW numerical model was used to investigate the origin and mechanism of saltwater in Holocene and Pleistocene aquifers. Geophysical and isotopic approaches were used to validate the SEAWAT model applied for simulating saltwater intrusion. The results suggest that the ebb and flow of tides, as well as water levels in rivers primarily impact coastal aquifers. However, effective water resource planning and management, along with maintaining the natural recharge of fresh water from local rain during the rainy season, could enable the rational and efficient utilization of groundwater, reducing saltwater intrusion in many areas. During the dry season, groundwater is recharged from higher altitude areas. The current saltwater intrusion mainly occurs along the rivers up to the hydraulic dam. Simulated models, using scenarios of stop abstracting groundwater, but changing to the use of surface water for drinking water, show that the area of saline water shrinks quickly after 30 years, reducing from 59.6 km2 to 39.5 km2 and from 40.2 km2 to 28.6 km2 in Holocene and Pleistocene, respectively.
Keywords:
saltwater intrusion
; groundwater modeling
; sustainable groundwater development
; Coastal aquifers
; Surface water interaction
; Water resource management
1. Introduction
Currently, the world’s population is grappling with the pressing issue of water scarcity and saltwater intrusion. The availability of water has become a major concern for many regions, especially those that are arid or semiarid. In the past, the management of water resources has typically treated surface water and groundwater as distinct and separate from each other [1], even though they are closely interconnected components of the hydrological cycle [2]. In Vietnam, most of the water resources management is focused on surface water [3,4], while issues concerning groundwater are neglected and not managed properly. In many studies, modelling has been identified to be the most effective approach for estimating both surface and groundwater availability [5,6,7,8].
Saltwater origin and mechanisms in coastal aquifers in Vietnam have been studied extensively and the main causes identified are groundwater exploitation [9]; inter-aquifer leakage due to diffusion and density flow or high hydraulic gradient [10].
A major urban center located in the central region of Vietnam is Da Nang with over 70 km of coastline and is renowned for its pivotal role in tourism, industry, and agriculture. Despite this, the city is facing multiple challenges such as high population density, water scarcity, environmental pollution, and saltwater intrusion. Due to its vast coastline, the aquifers in this region are greatly impacted by the saline intrusion, but no study has yet analyzed this phenomenon using numerical models. A survey was conducted to create a hydrogeological map of the city, and it was revealed that about 30% of the aquifer area in this region is affected by salinity [11]. Thus, it is essential to evaluate the current condition of saltwater intrusion and identify an effective solution to this problem.
In this study, geophysical, hydrogeochemical and isotopic methods were applied to investigate the distribution of saltwater and its origin and mechanism in the coastal aquifers. The status of saltwater intrusion in the Da Nang area was assessed using a coupled SWAT-MODFLOW numerical model. The model was calibrated and employed to forecast potential scenarios of saltwater intrusion, considering the influence of economic and urban development through changes in groundwater pumping and recharge rates.
2. Study Area
The focus of this study is the coastal region of Da Nang, as highlighted in Figure 1a. The area spans a total of 360 km2. The Han River (Figure 1a) acts as the boundary between the coastal plain and the southern parts of the city, while sand dunes can be found in the Ngu Hanh Son and Nam O areas, largely due to wind activity. The geology and hydrogeology of the study region drawn for a cross-section A-B and C-D is shown in Figure 1b. and comprises three primary hydrogeological formations: aquitards, porous aquifers, and fracture aquifers.
The study area is predominantly covered by porous sediments from the Holocene and Pleistocene ages (a blue color in Figure 1). Holocene deposits in the study region are found with thickness varies from 5 m to 29 m and contain sand, silty sand and gravel (light blue, Figure 1). The area of Holocene aquifer (qh) is around 160 km2, with an outcrop area of approximately 90 km2. The groundwater levels in this aquifer vary seasonally, and it is in the range of 0.45 to 3.0m from the surface in Lien Chieu Hai Chau area, 1.8 to 11.2m in the Son Tra – Ngu Hanh Son area.
Following Holocene, there are fine to coarse sand, as well as sand with gravel and pebbles of Pleistocene age with a thickness up to 34m, average is about 25m. The sediment in Pleistocene deposit contains gravel sand to silty sand (dark blue, Figure 1). The area of the qp aquifer is around 160 km2.
An observation for the water level in different boreholes and geological structures revealed that qh and qp aquifers are the same hydraulic system in the study area.
The fissure aquifer in the study zone possesses an area of less than 40 km2 (green color in Figure 1), majority of those areas encompassed by younger sediments, predominantly composed of sericite schist, calcareous limestone, quartz schist, and shale, the aquifer is considered to have a moderate to poor capacity for water storage.
In light of the hydrogeological characteristics, the Holocene and Pleistocene porous aquifers need particular attention because water from these aquifers is currently exploited as the clean water source of the local population. Both, however, are under the vulnerability of saline intrusion.
3. Methods
3.1. Sampling Procedure and Field Measurement
Water from 35 boreholes was sampled during two sampling campaigns in Dec/2019 (dry season) and May/2020 (wet season) for major cations and anions, TDS and isotopic compositions of deuterium and oxygen 18 in water determination. The positions of boreholes from those samples were taken were selected around the saltwater boundaries from hydrogeological mapping in 2012 (Figure 1). The isotopic compositions of δ18O δ2H in water samples are expressed in delta (δ) notation by the Equation (1) and Equation (2):
Where 2Rsample, 2Rstd, 18Rsample and 18Rstd are, respectively, the ratios of abundances (in Mole) of the heavier to those of the lighter isotopes in water samples subject to analysis and in standard. The standard for water isotopic composition determination is VSMOW2 (Vienna Standard of Mean Ocean Water batch 2), supplied by the International Atomic Energy Agency (IAEA) based in Vienna, Austria.
Before taking groundwater samples, the groundwater levels in boreholes were recorded, then the stagnant water in each sampling borehole was pumped out till the pH, temperature, EC in water became unchanged. The pH, temperature and EC of water were measured using a WTW Multi 197i device equipped with appropriate probes.
Groundwater samples were taken from the boreholes and passed through polycarbonate membranes with a pore size of 0.45 µm to eliminate suspended solids. For major cations analysis, 50 mL of the filtered samples were acidified by HNO3 acid (65%, PA grade, Merck, Germany) to pH 1-2. The samples were kept in HDPE (high-density polyethylene) bottles for transport to the laboratory. For major anions determination, 50 mL of the filtered samples were stored without acidification in HDPE bottles for transport to the laboratory. For water isotopic composition analysis 50 mL of the filtered water was taken and stored in HDPE bottles with double caps to avoid evaporation. The samples were subjected to analyses within 2 weeks of the sampling day.
Rainwater was collected using a device made according to the IAEA’s recommendation [12]. The device was installed on the roof of an office building located within the study area. Sea water was sampled at a distance of 20 m from the shore, at a depth of 0.5 m from the surface for δ18O and δ2H analyses.
3.2. Analytical Procedure
The major ionic contents of water samples were analyzed at the Centre for Excellence in Analysis and Experiment (CEAE) of the Hanoi University of Mining and Geology (HUMG) by using ion chromatography (IC) method on a DIONEX 600.
The water isotopes compositions (δ18O δ2H) were analyzed by laser spectrometry method on a Picaro’s cavity ring down spectrometer CRDS L2130-I at the Laboratory of Water Resources of the Ha Noi University of Natural Resources and Environment (HUNRE). The results of δ18O δ2H were expressed in ‰ relative to the VSMOW2.
3.3. Geophysical Method
Electrical resistivity tomography (ERT) was used in this study to validate the developed saltwater numerical model. The ERT technique provides a continuous characterization of subsurface electrical conductivity (by the means of electrical resistivity distribution) [13,14]. Besides, the ERT method provided high-quality electrical resistivity data obtained [15] with substantial spatial precision and the capability to survey underground areas continuously in both 2D and 3D dimensions [16] that were used to calibrate the numerical model in this study.
In the research area, 17 ERT profiles across the salt-fresh water interface were measured (Figure 1a) by using a multi-electrode SuperSting R1/IP equipment, with inter-electrode spacing of 10m.
3.4. Numerical Model
MODFLOW is a comprehensive groundwater modeling system that employs finite-difference technology to simulate three-dimensional flow. It can accurately model steady and variable flows in saturated environments and has the ability to represent aquifers as confined, unconfined, or a combination of both [2]. The model considers different boundary conditions such as unchanging pressure head, recharge, and consistent or varying flows. The discretized domain of the aquifer system is created using a combination of nodes and finite difference cells [17,18]. The governing equation for MODFLOW is based on Darcy’s Law, which is represented by a partial differential equation, and it is described in equation (2). With its powerful capabilities and advanced technology, MODFLOW is a highly effective tool for analyzing groundwater systems and their behavior in various environments.
The behaviour of groundwater is governed by a fundamental equation expressed in terms of partial differential equations. The Equation (3) takes into account several variables such as hydraulic conductivities in the x, y, and z axis (Kxx, Kyy, and Kzz), piezometric head (h), volumetric flux per unit volume (W), specific storage of the porous medium (Ss), and time (t). The hydraulic conductivities in the major axes, which are parallel to the x, y, and z axis, are used to calculate the rate of flow in each direction. The height of the water column above a reference point, known as the piezometric head, is a crucial factor for understanding the pressure distribution in the aquifer. Sources or sinks of water that may affect the flow direction and rate are represented by the volumetric flux per unit volume. The specific storage of the porous medium indicates the quantity of water stored in a unit volume of the medium under unit hydraulic gradient change. Time plays a crucial role in modelling the behaviour of groundwater over time. Thus, Equation (3) provides a comprehensive framework for understanding the complex behaviour of groundwater in various geological settings.
3.4. SWAT-MODFLOW Integration
The combination of surface water and groundwater models can provide valuable insights into the spatial-temporal replenishment of groundwater and the interaction between river water and groundwater. SWAT-MODFLOW is a powerful tool that can simulate these complex interactions [6,19]. Figure 2a illustrates that SWAT is used to model the top layers such as the root zone, vadose zone, and shallow aquifer, while MODFLOW is used to model the lower layer, which is the deep aquifer.
In this study, both the SWAT and MODFLOW models were employed to evaluate recharge rates, first separately and then in combination. The SWAT model was initially used to evaluate recharge rates and calculate groundwater recharge values at the HRU level. In order to combine the SWAT and MODFLOW models, the HRU recharge rates had to be transferred and utilized as input data for MODFLOW, as illustrated in Figure 2b. Since SWAT is semi-distributed, it was uncertain where each HRU was located within the sub-basins. To overcome this issue, a single HRU was created for each sub-basin based on the dominant soil, land use, and slope option [2]. By combining the two models and accounting for the limitations of each, it was possible to obtain a more accurate and comprehensive understanding of the groundwater replenishment process.
4. Results and Discussion
4.1. Distribution of Salinity
The classification of water types according to TDS (total dissolved solids) is an important step in water resource management. Zhou [20] proposed a classification system based on TDS levels, which includes four categories: brine (TDS > 50 g/l), saline water (TDS = 3–50 g/l), brackish water (TDS = 1–3 g/l), and freshwater (TDS < 1 g/l). This system allows for a clear understanding of the quality of water resources and helps to guide decision-making related to their use and management. An understanding of the TDS levels present in various water sources can help in assessing the suitability of water for different applications, such as drinking, irrigation, or industrial use. Data from 35 sampling locations were used to generate a limit between fresh and salt water. Among points that were collected during 2020 (in dry and rainy seasons), TDS varies from 0.1 to 3.6 g/l. Five samples with TDS higher than 1 g/l are located along the rivers (Figure 1.a). It was revealed that a sharp contrast of electrical resistivity along Profile 1, 2 (Figure 3). Below surface up to 15 m depth, resistivity varies from about 15 Ohm.m close to the river and up to more than 50 Ohm.m is observed corresponding to superficial Holocene sediments made of sandy clay or unsaturated zone. Resistivity readings ranging from 1 to 10 Ohm.m at a depth of 15-30 m suggest the presence of salt and brackish water from the nearby river. Aquifer with freshwater is reflected by a high resistivity (> 40 Ohm.m) below 30 m depth due to the presence of gravel. The low resistivity zone in the deep part close to the river is demonstrated as salty water affected by surface water from the river.
4.2. The Chemical Composition of the Groundwater in the Area under Investigation
In the study of groundwater hydrochemistry, it is essential to examine the variations between rainy and dry seasons. As shown in Table 1, the hydrochemical and stable isotopic results of groundwater in the rainy season were analyzed. Similarly, Table 2 displays the corresponding results for the dry season. These findings provide valuable insights into the dynamics of groundwater quality and its potential impact on the environment and human health.
The chemical characteristics of groundwater in the study area were presented in a Piper diagram shown in Figure 4.
It was found that the groundwater in the area is dominated by Na-Ca-Cl-SO4 type. However, some boreholes were found to have chloride concentrations that exceeded the national standard for groundwater quality set by the Ministry of Natural Resources and Environment [21] by up to 40 times. The high levels of chloride in groundwater may be attributed to the ongoing salt intrusion occurring in the study area.
4.3. Isotopic Compositions in Water as Indicators for the Genesis and Recharge Area of Groundwater in the Study Region
In this study, the isotopic composition of groundwater sampled from the study area is displayed alongside the local meteoric water line (LMWL) for the Da Nang city area in Figure 5. The LMWL in this region follows a model with a slope of 8.98 and an intercept of 10.71, as depicted in Figure 5. These values are slightly different from the Global Meteoric Water Line (GMWL) of 8 and 10, respectively, as established by Craig [22]. The variation in values could be attributed to the unique weather conditions in Da Nang city, which is characterized by high atmospheric temperatures and humidity throughout the year.
In the rainy season isotopic compositions in groundwater (open dots in Figure 5) from the study area positioned close to the LMWL indicate that groundwater in this area is recharged from the local precipitation. The only point positioned below the LMWL, possibly is being affected by seawater making the isotopic signatures in water from that borehole to be enriched.
For the dry season, a quite different trend of the δ2H vs δ18O relationship for groundwater was observed (solid dots in Figure 5), oxygen 18 in the water was depleted but deuterium was enriched. The reason for this could be the recharge area was at a higher altitude for which isotopic compositions in precipitation were depleted, and the flow direction of the recharge would be through and beneath a landfill. In fact, a large landfill is currently located around 12-15 km towards Northwest of Da Nang for collecting and processing waste from the city. The leachate from the landfill containing sulphide (H2S) and methane (CH4) as the products of domestic waste bio-decomposition leak into aquifers. This leakage would be so intensive during the dry season because of not enough pressure from recharge to protect from the infiltration of the leachate to aquifers. It was reported that hydrogen in H2S and CH4 generated from domestic waste is enriched in deuterium [23,24] and the enriched deuterium in sulphide and methane participated in the isotopes exchange with hydrogen in water in aquifers making deuterium in water to be enriched. However, oxygen 18 has no chance to take part in isotopes exchange, therefore its signature was unchanged as it was from the recharge area.
4.4. Saltwater Intrusion in the Study Area
Saltwater intrusion modelling was validated and calibrated by using EC measurement data from boreholes in two campaigns 2019-2020 and electrical resistivity tomography (ERT) measurement. The results from the calibrated numerical model in Holocene and Pleistocene aquifers in the rainy season (05/2020) show that the salinity area with TDS higher than 1 g/l in the Holocene aquifer decreases faster than the Pleistocene aquifer compared to which in the rainy season of the year 2012. The salinity decreases because of the precipitation recharge to these aquifers. The replenishment of the aquifer due to rain and the pumping process both impact the aquifer, causing it to pale. In areas located near the Han and Cu De River, and the coastline, the salinity level rises with the passing of time, a result of the high influence of rivers and the sea on the surface aquifer. Figure 7 indicates areas with TDS greater than 1g/l of Holocene and Pleistocene aquifers during wet season (4/2020). Accordingly, the total area with salinities higher than 1 g/l in Holocene aquifer is 41.8km2 and in Pleistocene aquifer is 53.4km2.
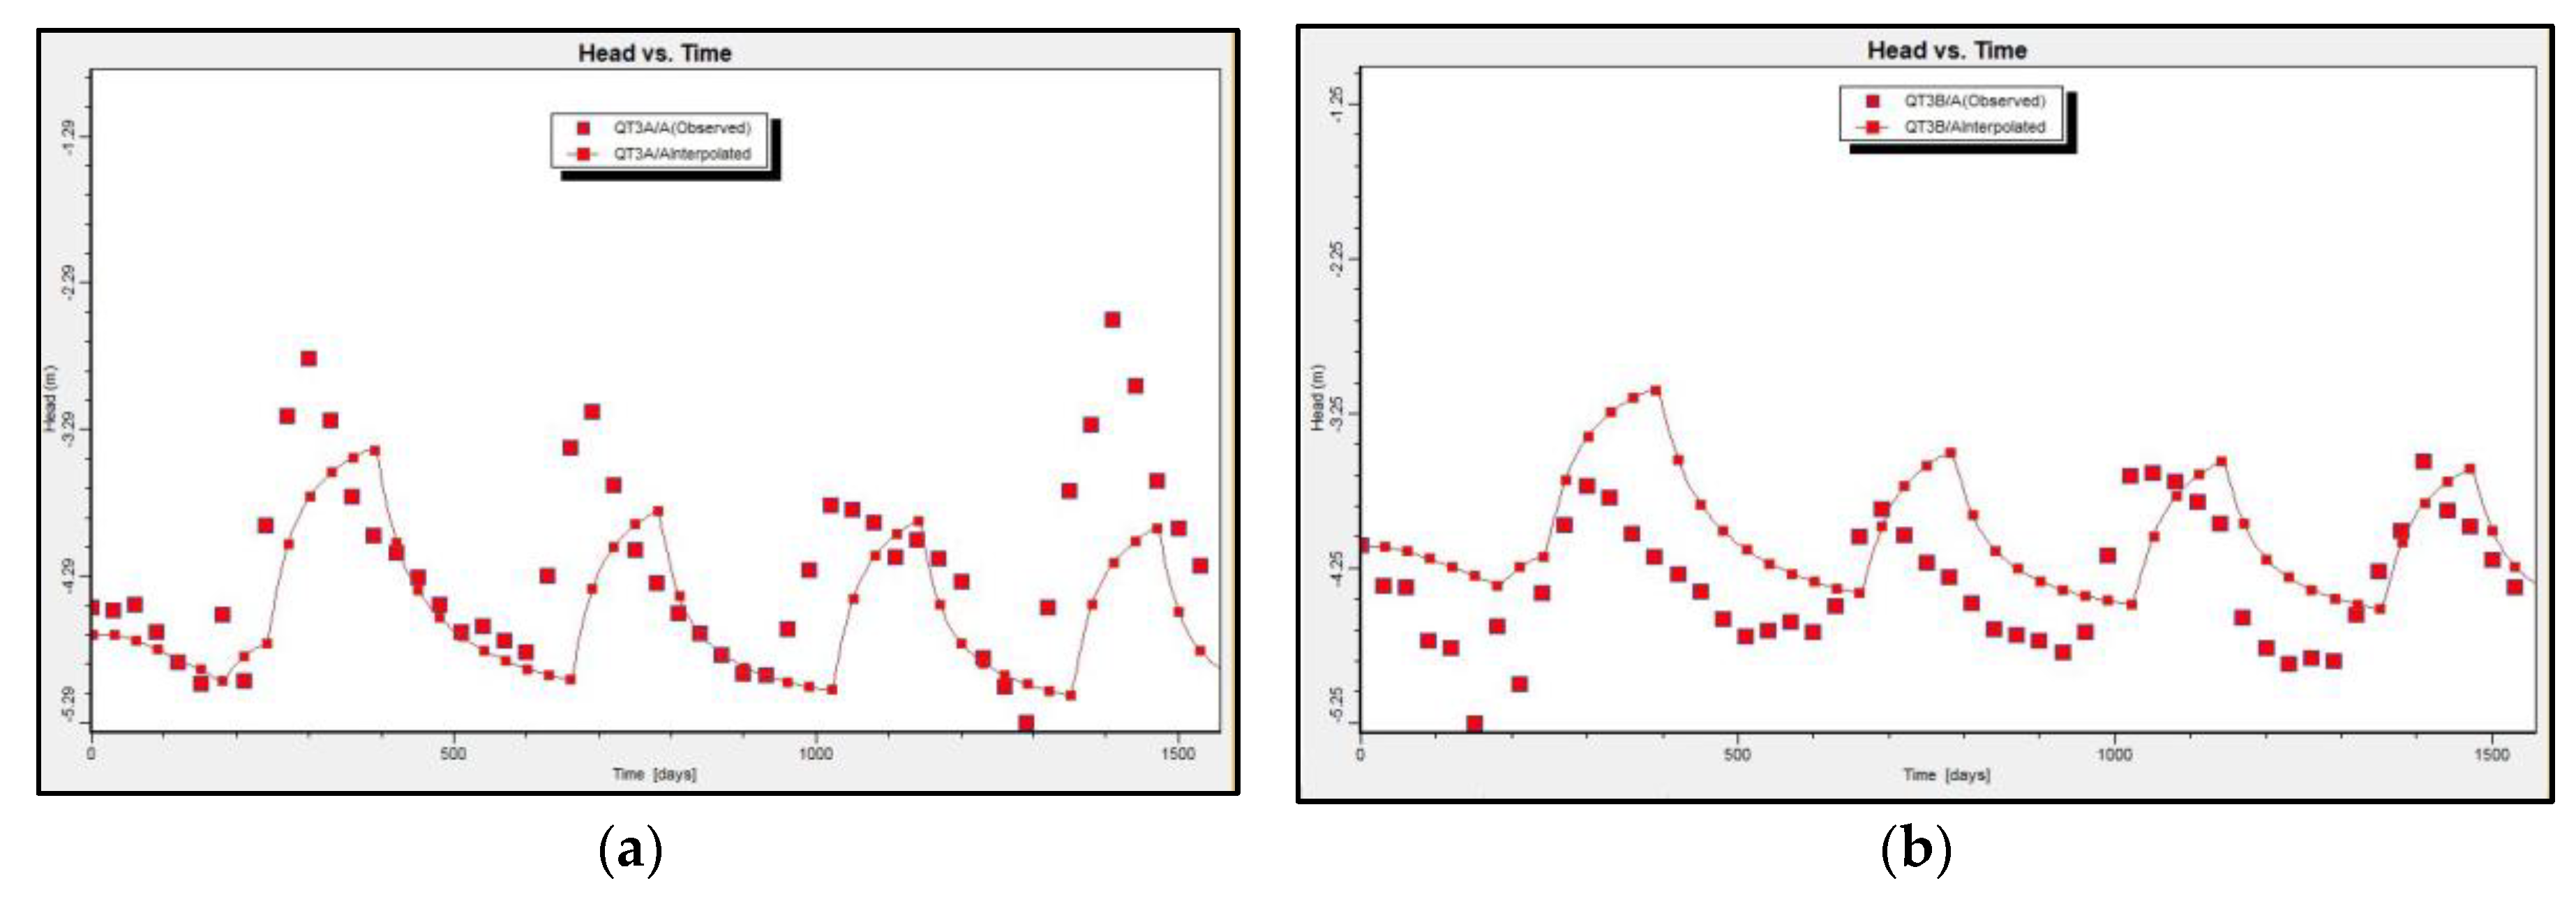
Figure 6.
Simulated and observed groundwater head values at observation borehole QT3A (a) and QT3B (b).
Figure 6.
Simulated and observed groundwater head values at observation borehole QT3A (a) and QT3B (b).
4.5. Saltwater Intrusion due to Recharge and Pumping in Coastal Aquifers
The potential control of saltwater intrusion by reducing groundwater pumping or by increasing surface water infiltration was assessed using the calibrated model. To predict the saltwater intrusion in 2020, four distinct scenarios were simulated:
- status quo: with the current groundwater pumping rate and recharge from rain/surface water
- stop pumping: use 100% surface water resource for water supply
- double pumping rates: increase GW pumping rate to fit the demand of drinking water of the city
- no recharge occurs: no recharge area due to urban development
Figure 6 displays a comparison between the simulated water heads in scenarios 1 and 2 and the water heads that were acquired from the existing pumping rates. The changes in the water heads ranged from 0.2 to 1 m, and they depended on the position of the observation borehole. Those boreholes located in proximity to pumping wells showed a higher degree of change. Based on the results of the numerical modeling for saltwater intrusion in the Holocene and Pleistocene aquifers in April 2020, it was observed that the area of the Holocene aquifer with initial high salinity decreased at a faster rate than that of the Pleistocene aquifer. This difference may be due to the higher levels of precipitation recharge in the Pleistocene aquifer, as shown in Figure 7.
Predicted saltwater areas in different scenarios for both aquifers Holocene and Pleistocene in the years 2035 and 2050 are shown in Table 3. Most of the pumping wells in this area penetrated to Pleistocene aquifer, the simulated model shows the saltwater area in both aquifers decrease quickly when all pumping wells stop, the saltwater area decreases 23.4% and 28.9% in Pleistocene and Holocene aquifer respectively in 2050. The simulated salt intrusion model from the scenario of groundwater of pumping rate doubled to fit the water demand in future times is relatively similar to the scenario of no recharge to groundwater due to urban development.
5. Conclusions
In Da Nang area, data from groundwater analysis and ERT measurements shows the distribution of saltwater (TDS>1g/l) in Holocene with about 60.3km2 and in the Pleistocene aquifer with 41.3km2. In some boreholes, water contains chloride at a concentration exceeding 40 times compared to the National Standard for groundwater quality. Hydrochemical and stable isotopic data of 35 points from both aquifers demonstrated that in the rain season, groundwater is recharged from the local precipitation, in the dry season groundwater is recharged from a higher altitude area and the flow direction of the recharge would be through and beneath a landfill. The replenishment of groundwater from surface sources is a valuable resource that can reduce the extent of saltwater intrusion in many areas. Along the river downstream up to the hydraulic dams, saltwater in groundwater mainly recharges by surface water from rivers.
The study area was simulated for surface and groundwater, including saltwater intrusion, through the development of an integrated SWAT and MODFLOW model. Thanks to groundwater pumping management, with freshwater recharge from the surface, the area of saline groundwater in both aquifers is decreasing. Double pumping rate scenario and no recharge scenario give the same salt intrusion effect to qh and qp aquifers. In this area, groundwater is an effective resource for water supply to the city, but detailed studies are needed to control saltwater intrusion into aquifers.
Acknowledgments
This research was funded by Ministry of Education and Training of Vietnam (Program 562) under grant code B2019-MDA-562-16.
References
- Winter, T.C., Harvey, J.W., Franke, O.L. & Alley, W.M. Ground water and surface water: A single resource. 1998. Circular.
- Dowlatabadi, S. & Zomorodian, S. Conjunctive simulation of surface water and groundwater using SWAT and MODFLOW in Firoozabad watershed. KSCE Journal of Civil Engineering, 2015, 20. [CrossRef]
- Chau, T.K.A.K., D.X. Study on water balance in Sesan river basin in drought year 2015/2016. Journal of Meteorological, 678, 2017, 44-53.
- Au, N.T.T., Liem, N.D., Loi, N.K. Applying GIS technique and SWAT model to assessing water discharge in Dakbla watershed. Journal of National University, 29, 2013,1-13.
- Nguyen, B.T., Anh., C.V., Trinh., N.D., Son., H.T. & Nguyen, V.D. Saltwater intrusion in aquifers of Danang area and solution for sustainable groundwater development. Journal of Mining and Geology Science and Technology, 2018, 10-20.
- Nguyen, B.T. & Khoa, T.V.L. Integrated SWAT-MODFLOW model to study saltwater intrusion in Da Nang coastal city. IOP Conference Series: Earth and Environmental Science, 2022, 1071, 012037.
- Voss, C.I. & Souza, W.R. Variable density flow and solute transport simulation of regional aquifers containing a narrow freshwater-saltwater transition zone. Water Resources Research, 1987, 23, 1851–1866. [CrossRef]
- ABD-ELHAMID, H.F. & JAVADI, A.A. A density-dependant finite element model for analysis of saltwater intrusion in coastal aquifers. Journal of Hydrology, 2011, 401, 259–271. [CrossRef]
- Long, P.N. & Dat, H.T. Application of GIS-Base GALDIT for vulnerability assessment to saltwater intrusion of Holocene coastal aquifer: A case of Quang Nam - Da Nang city, Vietnam. Science of the Earth, 2020, 42, 298–310. [CrossRef]
- Hoan, H.V., Larsen, F., Lam, N.V., Nhan, D.D., Luu, T.T. & Nhan, P.Q. Salt Groundwater Intrusion in the Pleistocene Aquifer in the Southern Part of the Red River Delta, Vietnam. VNU Journal of Science: Earth and Environmental Sciences, 2018, 34. [CrossRef]
- Nguyen, B.T., Anh., C.V., Trinh., N.D., Son., H.T. & Nguyen, V.D. Saltwater intrusion in aquifers of Danang area and solution for sustainable groundwater development. Journal of Mining and Geology Science and Technology, 2018, 10-20.
- IAEA. Water and environment newsletter of the Isotope Hydrology Section. International Atomic Energy Agency. 2002.
- Loke, M.H. & Barker, R.D. Rapid least-squares inversion of apparent resistivity pseudosections by a quasi-Newton method1. Geophysical Prospecting, 1996, 44, 131–152.
- Zarroca, M., Bach, J., Linares, R. & Pellicer, X.M. Electrical methods (VES and ERT) for identifying, mapping and monitoring different saline domains in a coastal plain region (Alt Emporda, Northern Spain). Journal of Hydrology, 2011. 409, 407-422.
- Bauer, P., Supper, R., Zimmermann, S. & Kinzelbach, W. Geoelectrical imaging of groundwater salinization in the Okavango Delta, Botswana. Journal of Applied Geophysics, 2006, 60, 126–141. [CrossRef]
- Batayneh, A.T., Elawadi, E.A. & Al-Arifi, N.S. Use of Geoelectrical Technique for Detecting Subsurface Fresh and Saline Water: A Case Study of the Eastern Gulf of Aqaba Coastal Aquifer, Jordan. Journal of Coastal Research, 2010, 26, 1079–1084. [CrossRef]
- Mehl, S. & Hill, M.C. Development and evaluation of a local grid refinement method for block-centered finite-difference groundwater models using shared nodes. Advances in Water Resources, 2002, 25, 497–511. [CrossRef]
- Chiang, W.-H. & Kinzelbach, W. Processing Modflow A Simulation System for Modeling Groundwater Flow and Pollution. 1998.
- Kim, N.W., Chung, I.M., Won, Y.S. & Arnold, J.G. Development and application of the integrated SWAT–MODFLOW model. Journal of Hydrology, 2008, 356, 1–16. [CrossRef]
- Zhou, Y., Wang, Y., Li, Y. et al. Hydrogeochemical characteristics of central Jianghan Plain, China. Environ Earth Sci 68, 2013, 765–778. https://doi.org/10.1007/s12665-012-1778-9. [CrossRef]
- MONRE. National technical regulation on groundwater quality. Ministry of Natural Resources and Environment, QCVN 09: 2015/BTNMT.
- Craig, H. Isotopic Variations in Meteoric Waters. Science, 1961, 133, 1702–1703. [CrossRef]
- Hackley, K.C., Liu, C.L. & Coleman, D.D. Environmental Isotope Characteristics of Landfill Leachates and Gases. Groundwater, 1996. 34, 827-836. [CrossRef]
- Clark, I. & Fitz, P. Environmental Isotopes in Hydrology. Lewis Publishers. 1998.
Figure 1.
(a) Hydrogeological map and location of sampling wells and (b) cross-section along A-B and C-D line shown in the map.
Figure 1.
(a) Hydrogeological map and location of sampling wells and (b) cross-section along A-B and C-D line shown in the map.
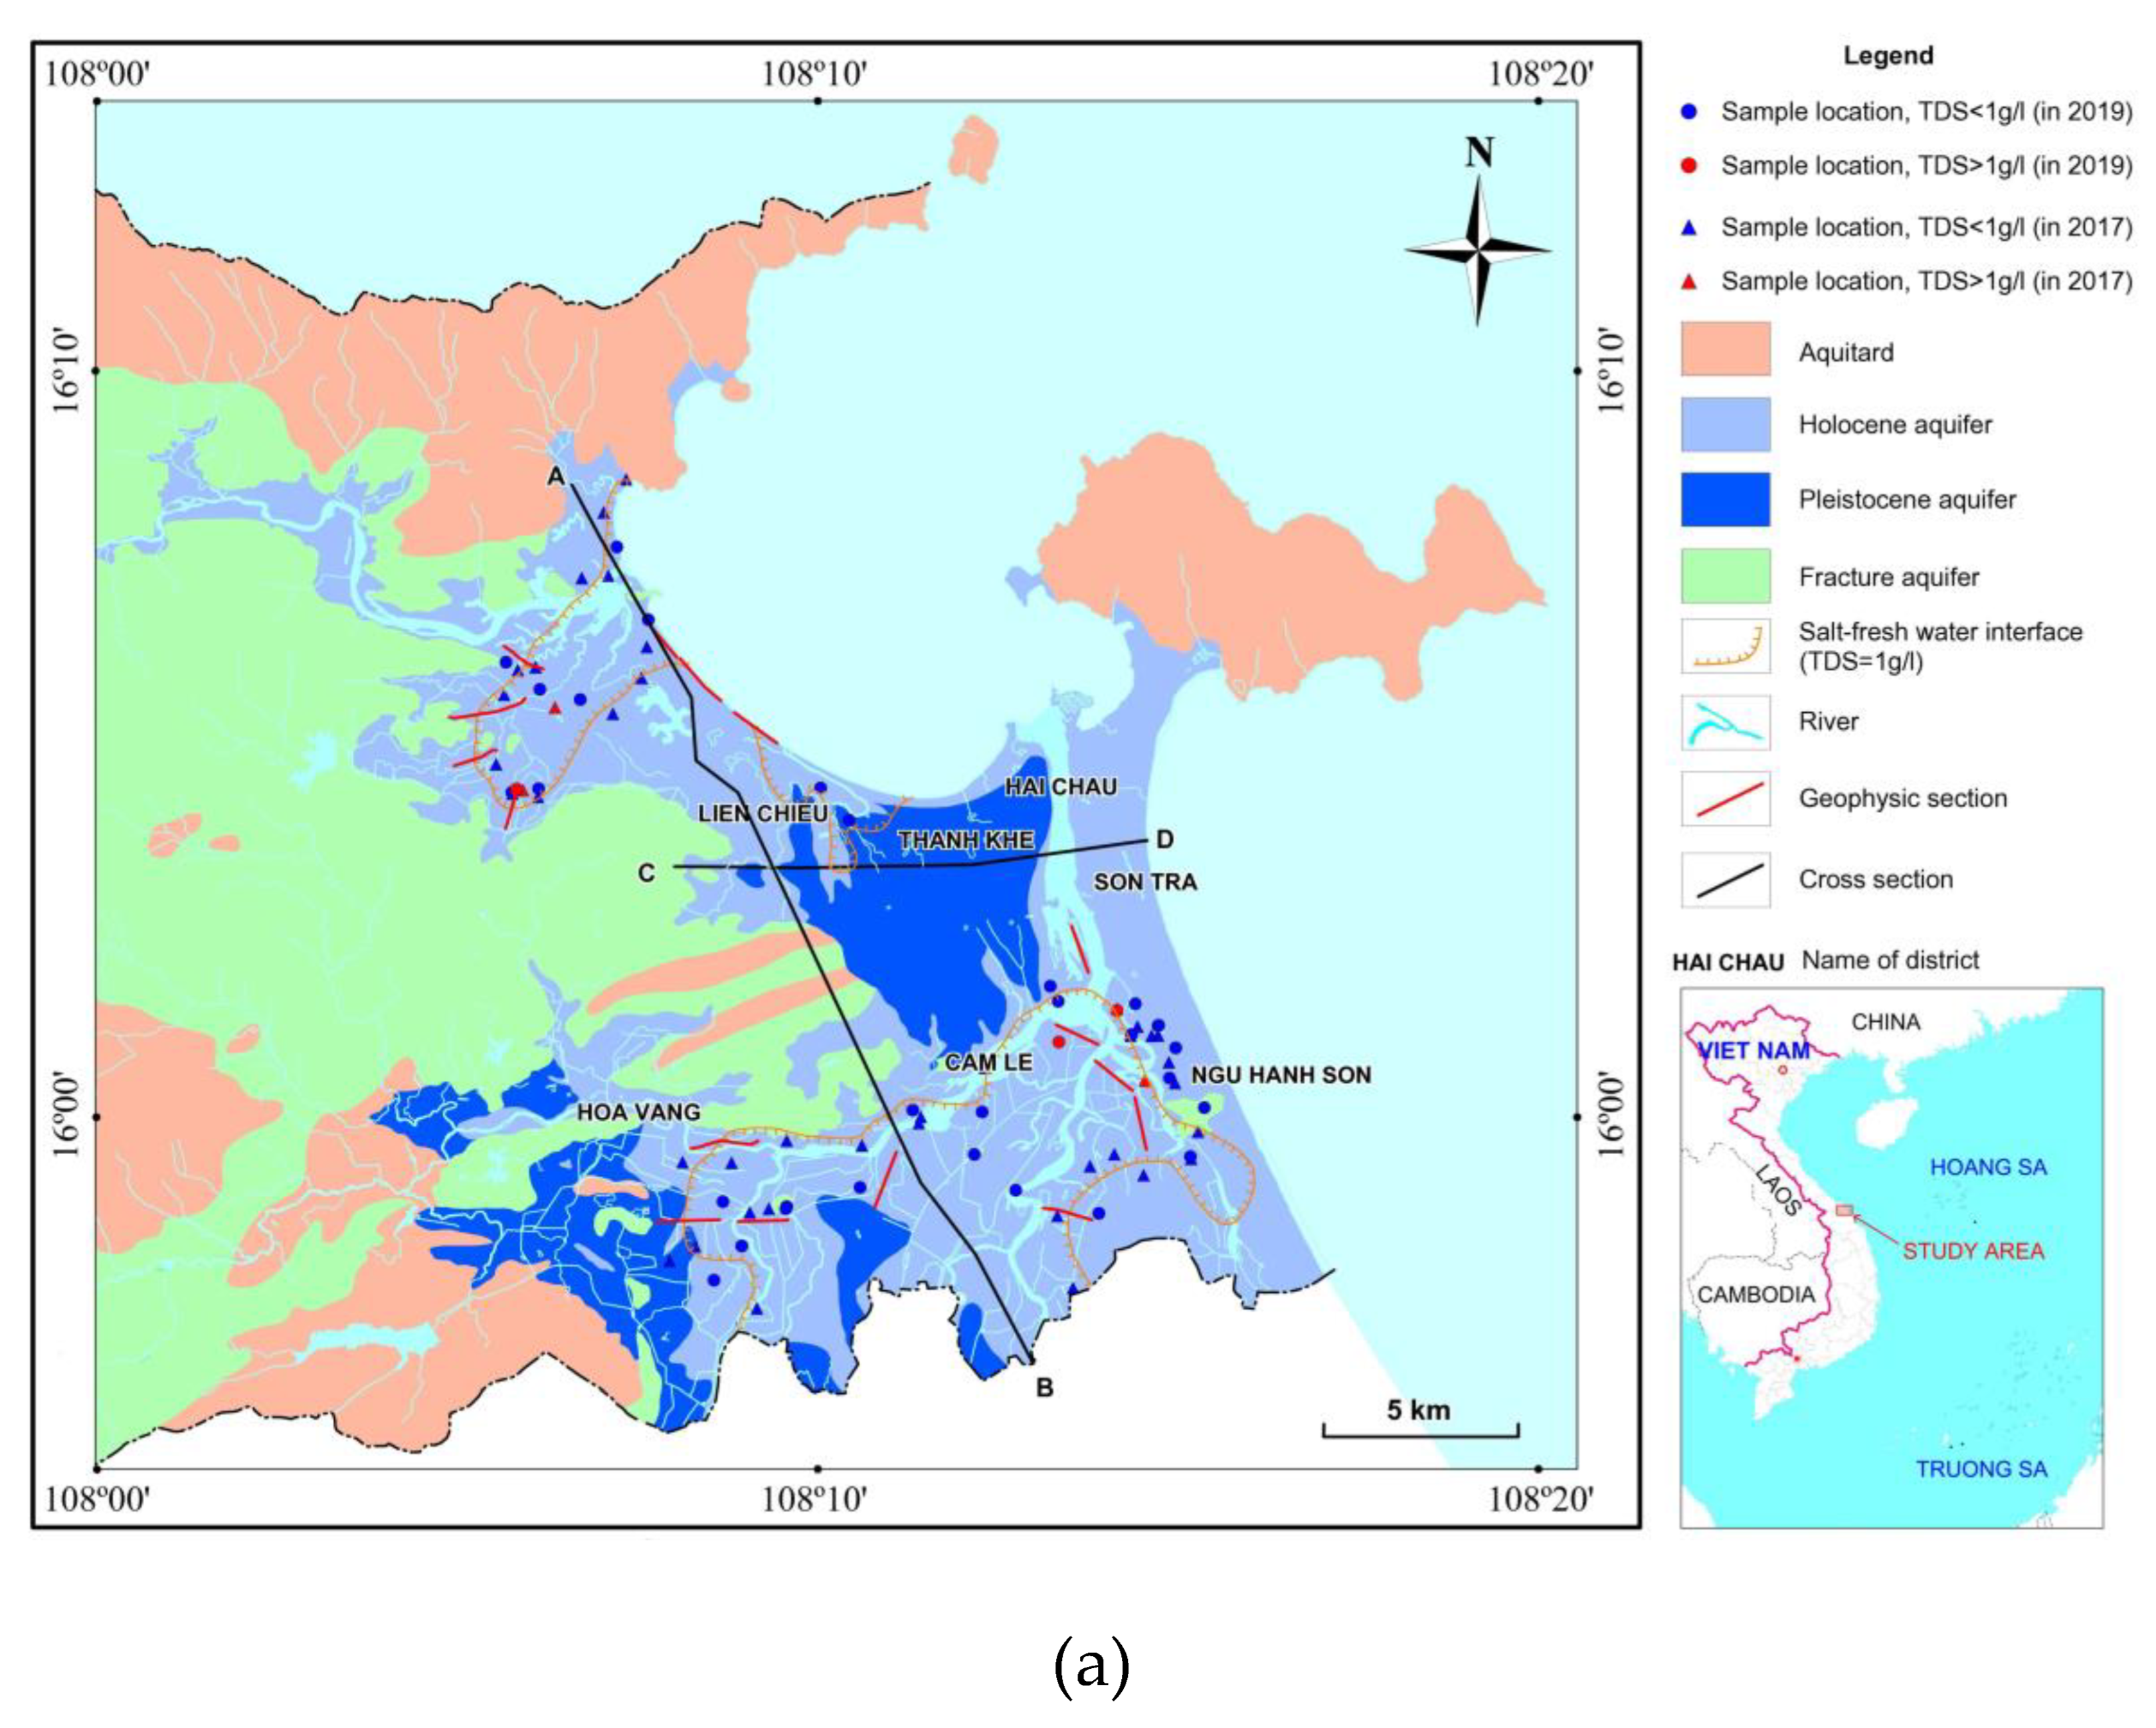
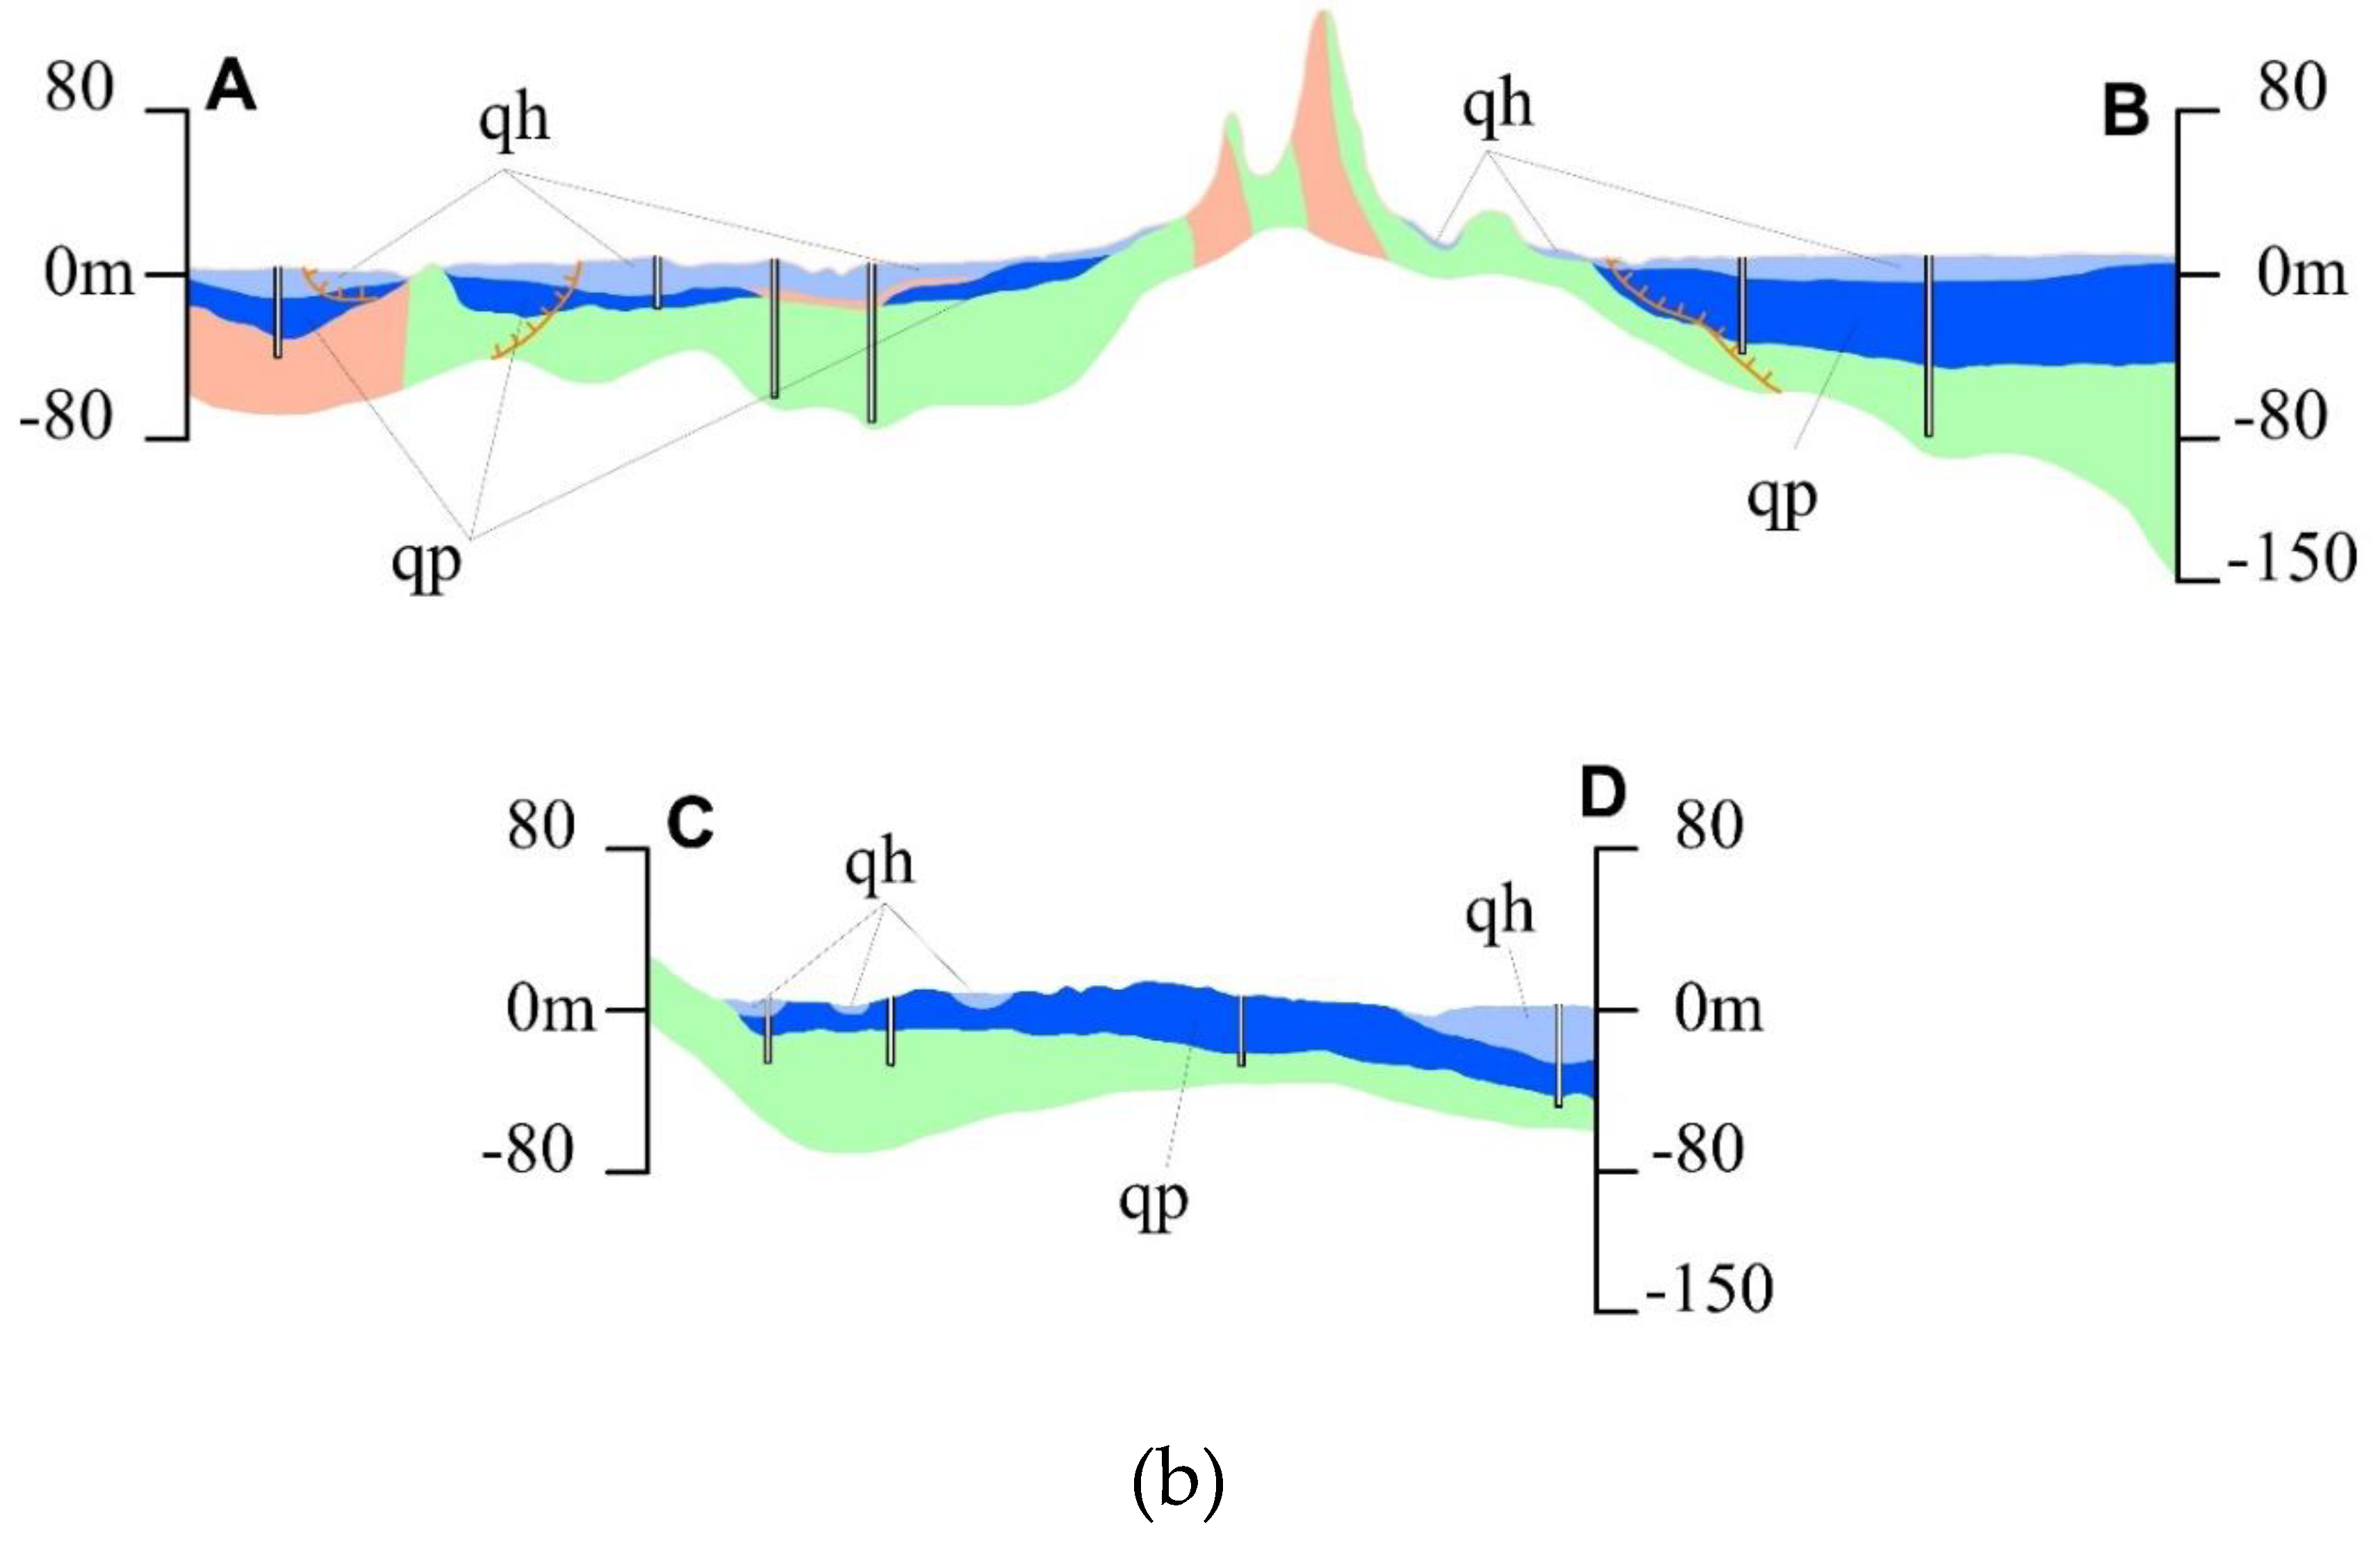
Figure 2.
A combination of surface water and groundwater models for hydrological analysis in Da Nang coastal area (a) [6] and the linkage of a river in MODFLOW with SWAT (b) [19].
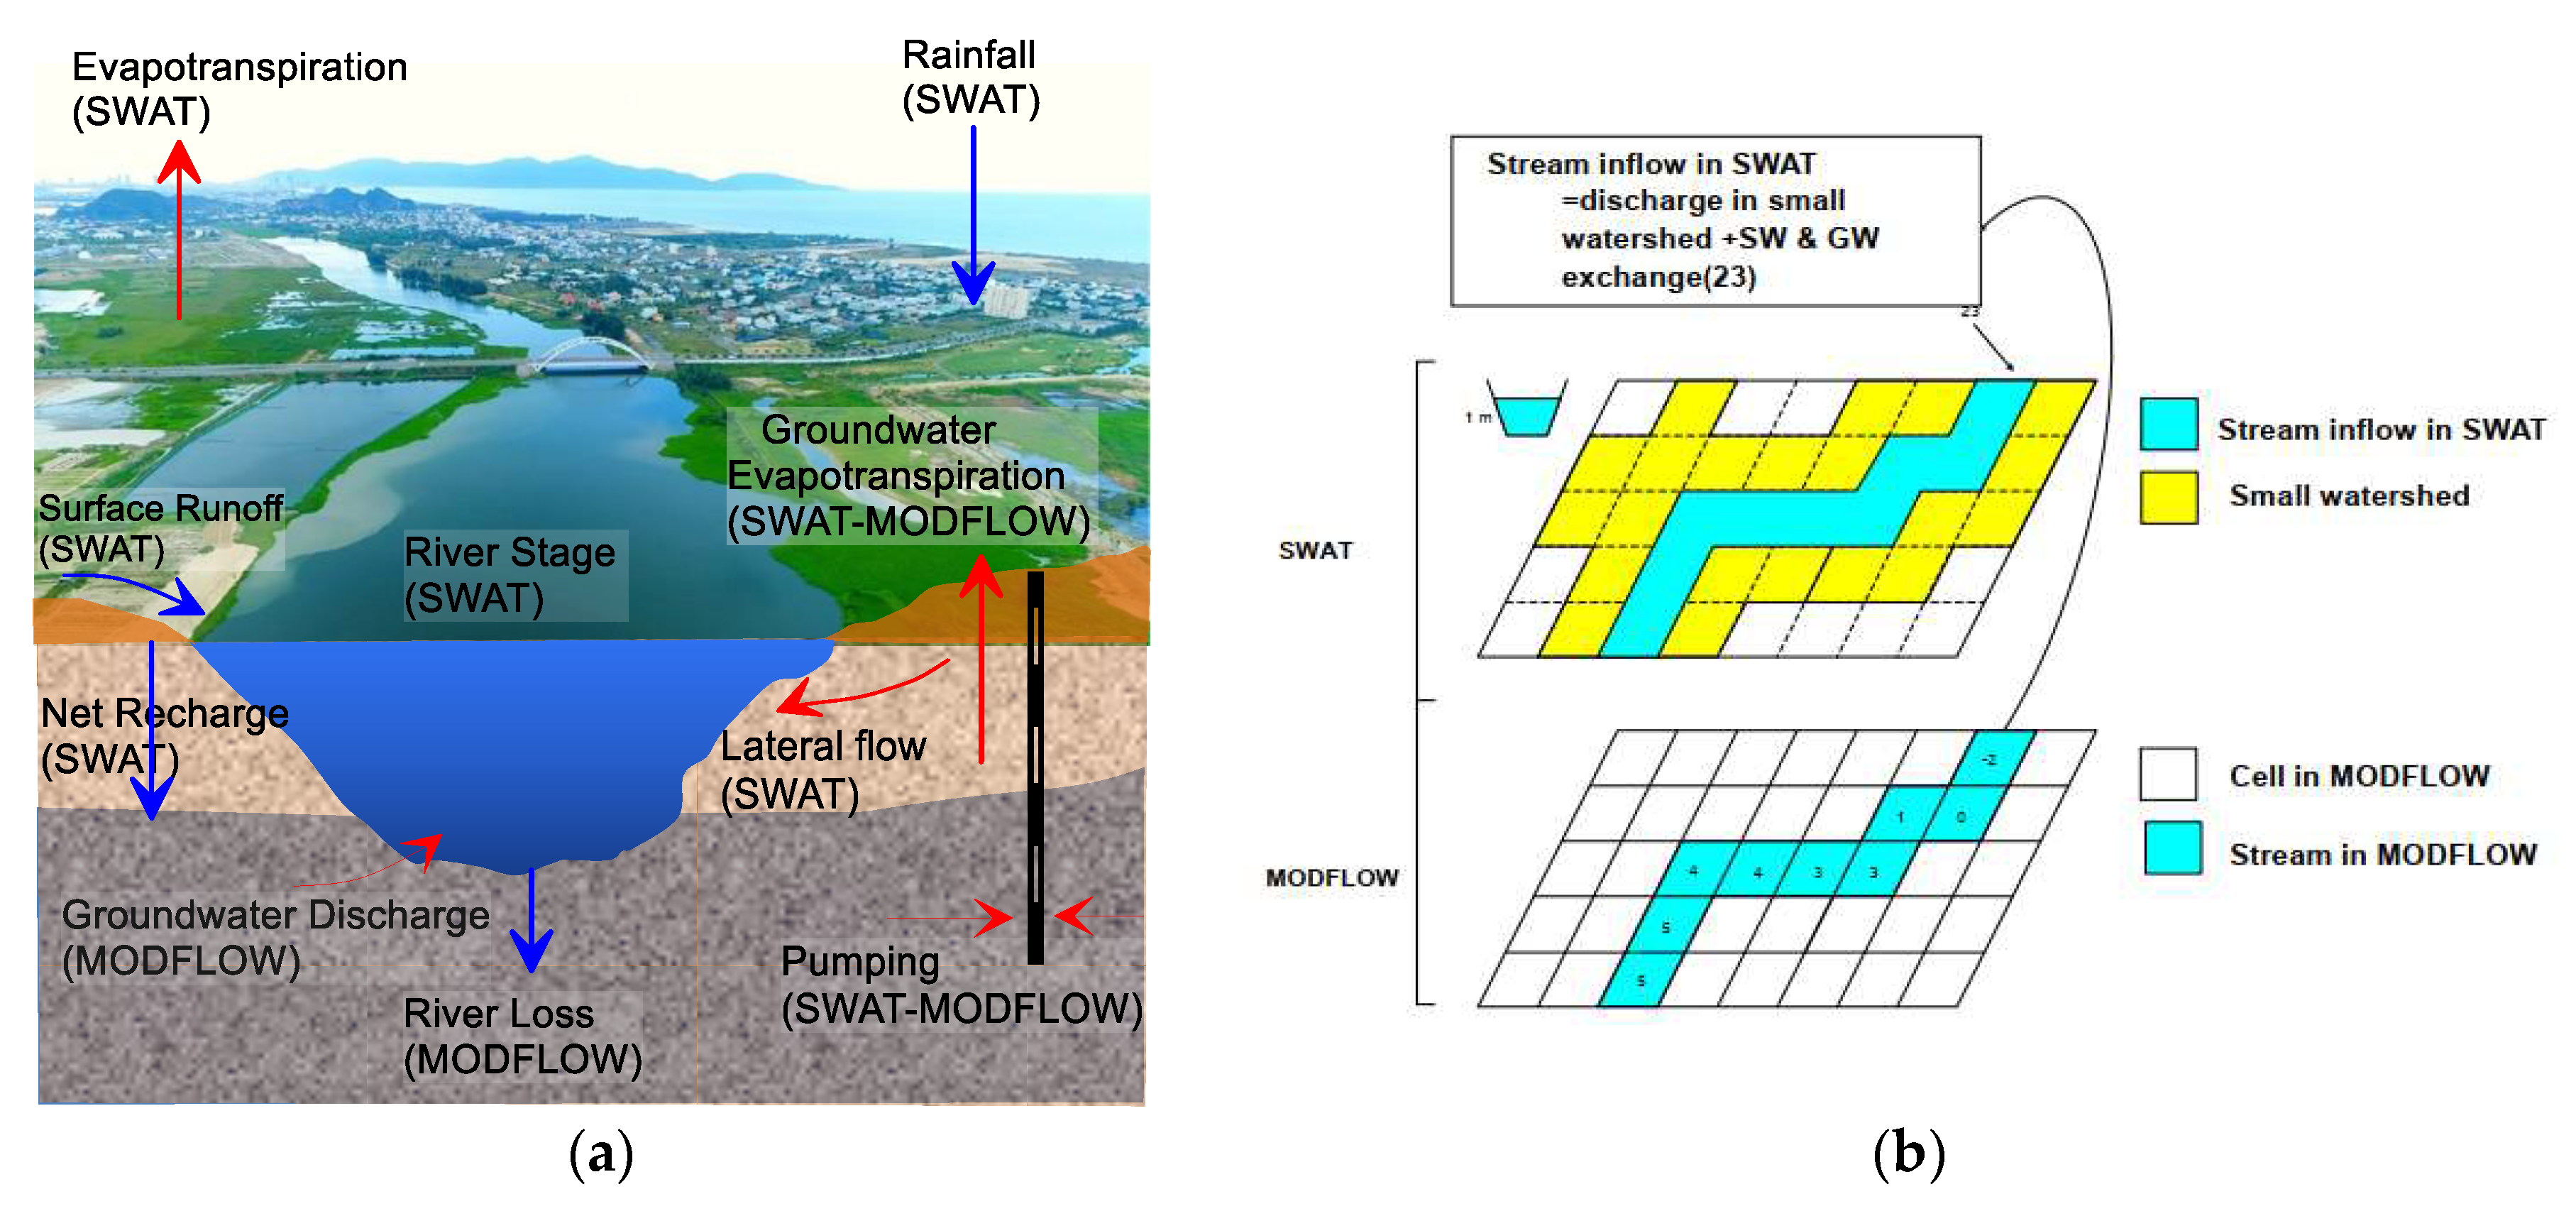
Figure 3.
2-D electrical resistivity tomography (ERT) of Section 2 (a) and Section 13 (b).
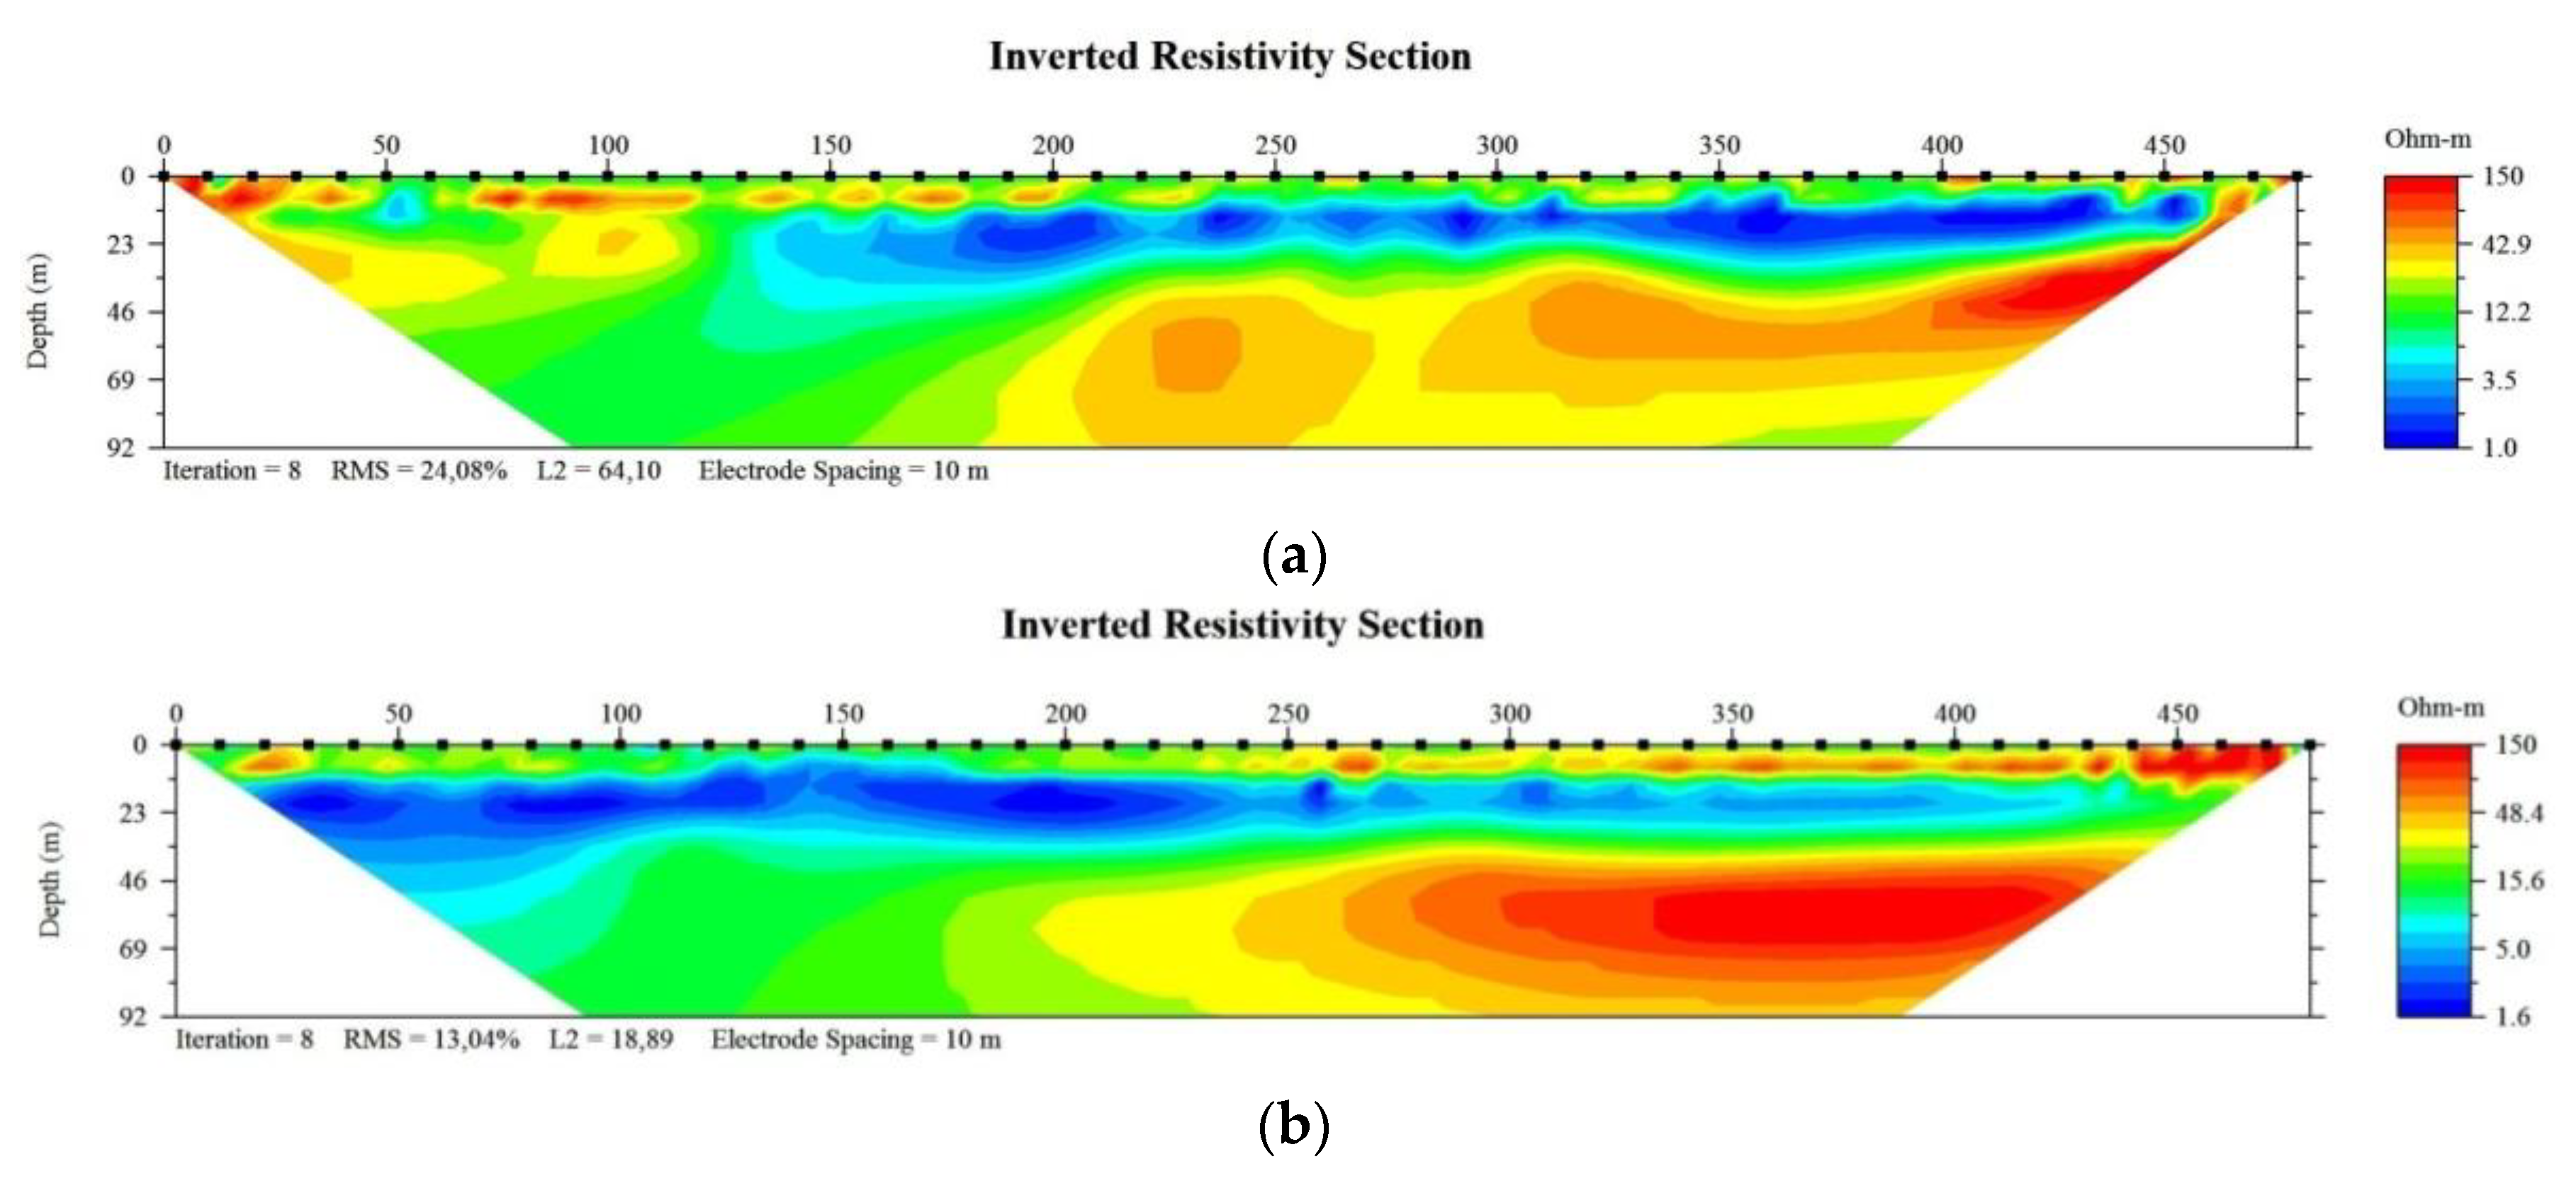
Figure 4.
A Piper diagram showing the chemistry of groundwater in the study area.
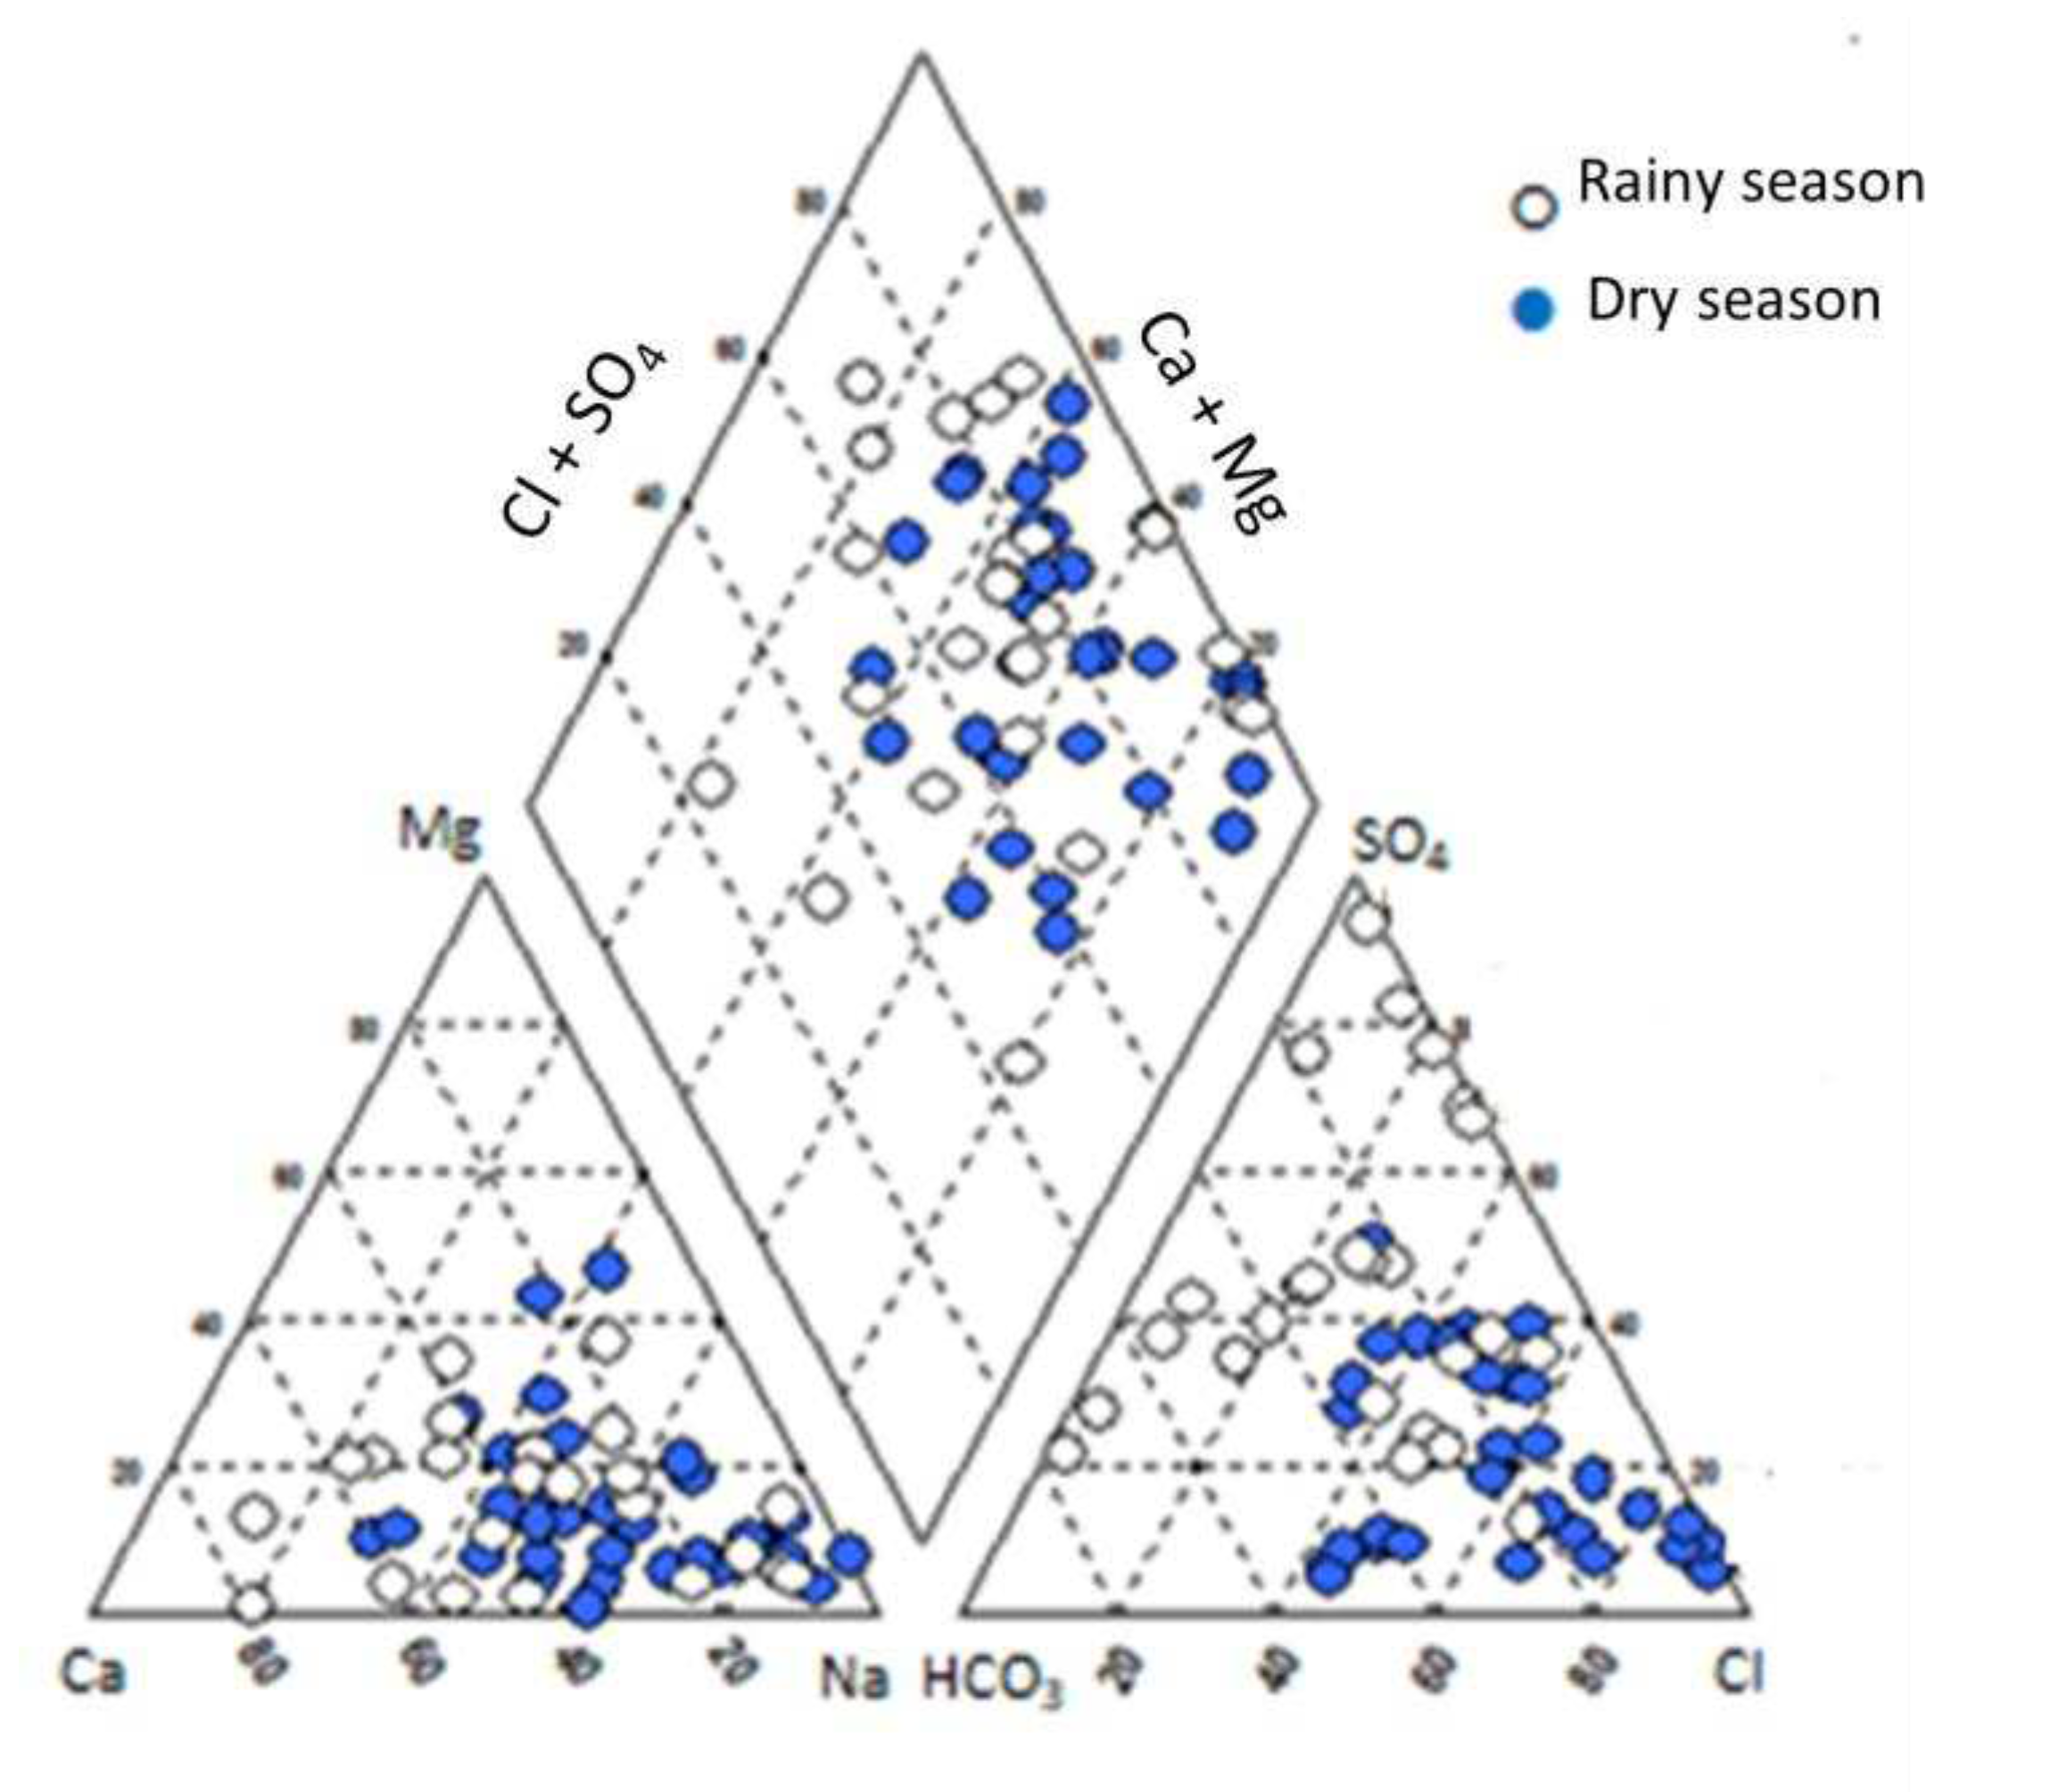
Figure 5.
Isotopic compositions in groundwater samples analyzed along with the local meteoric water line in a coastal area of Da Nang city in 2020.
Figure 5.
Isotopic compositions in groundwater samples analyzed along with the local meteoric water line in a coastal area of Da Nang city in 2020.
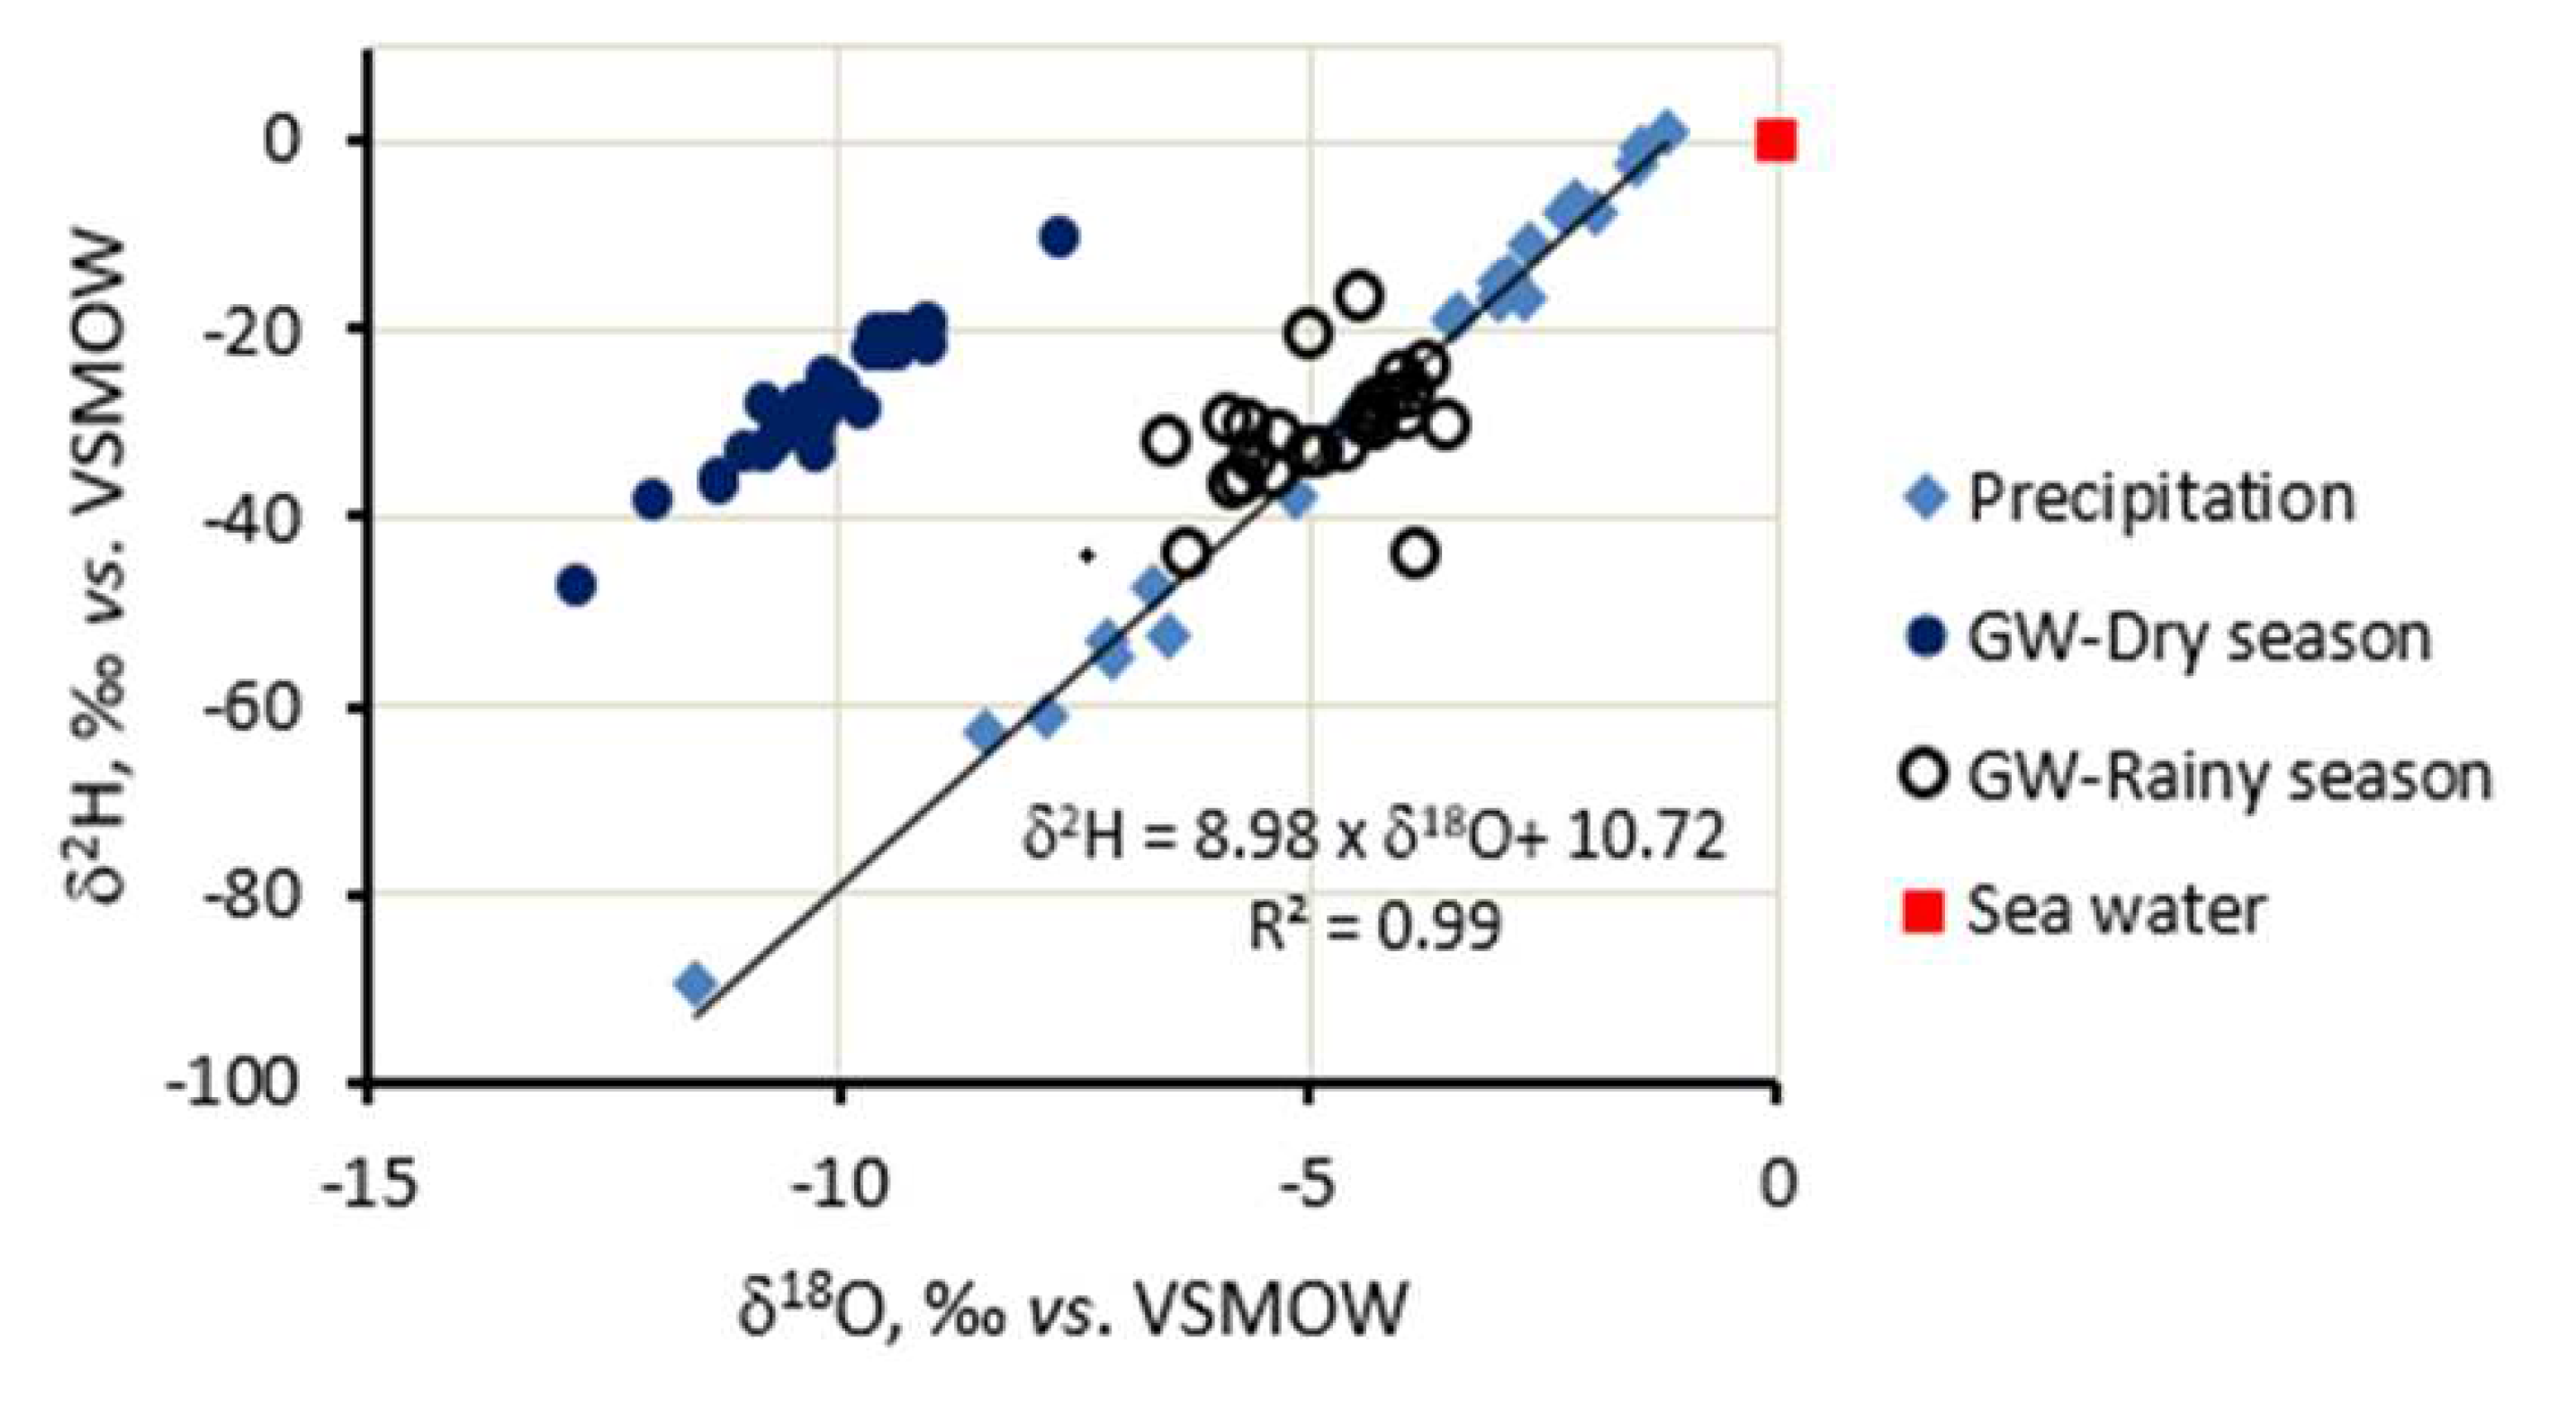
Figure 7.
Saltwater intrusion distribution in groundwater of the study site in April 2020 (modeled using Visual MODFLOW) (a) Depicting the distribution in the Holocene aquifer; (b) Depicting the distribution in the Pleistocene aquifer.
Figure 7.
Saltwater intrusion distribution in groundwater of the study site in April 2020 (modeled using Visual MODFLOW) (a) Depicting the distribution in the Holocene aquifer; (b) Depicting the distribution in the Pleistocene aquifer.
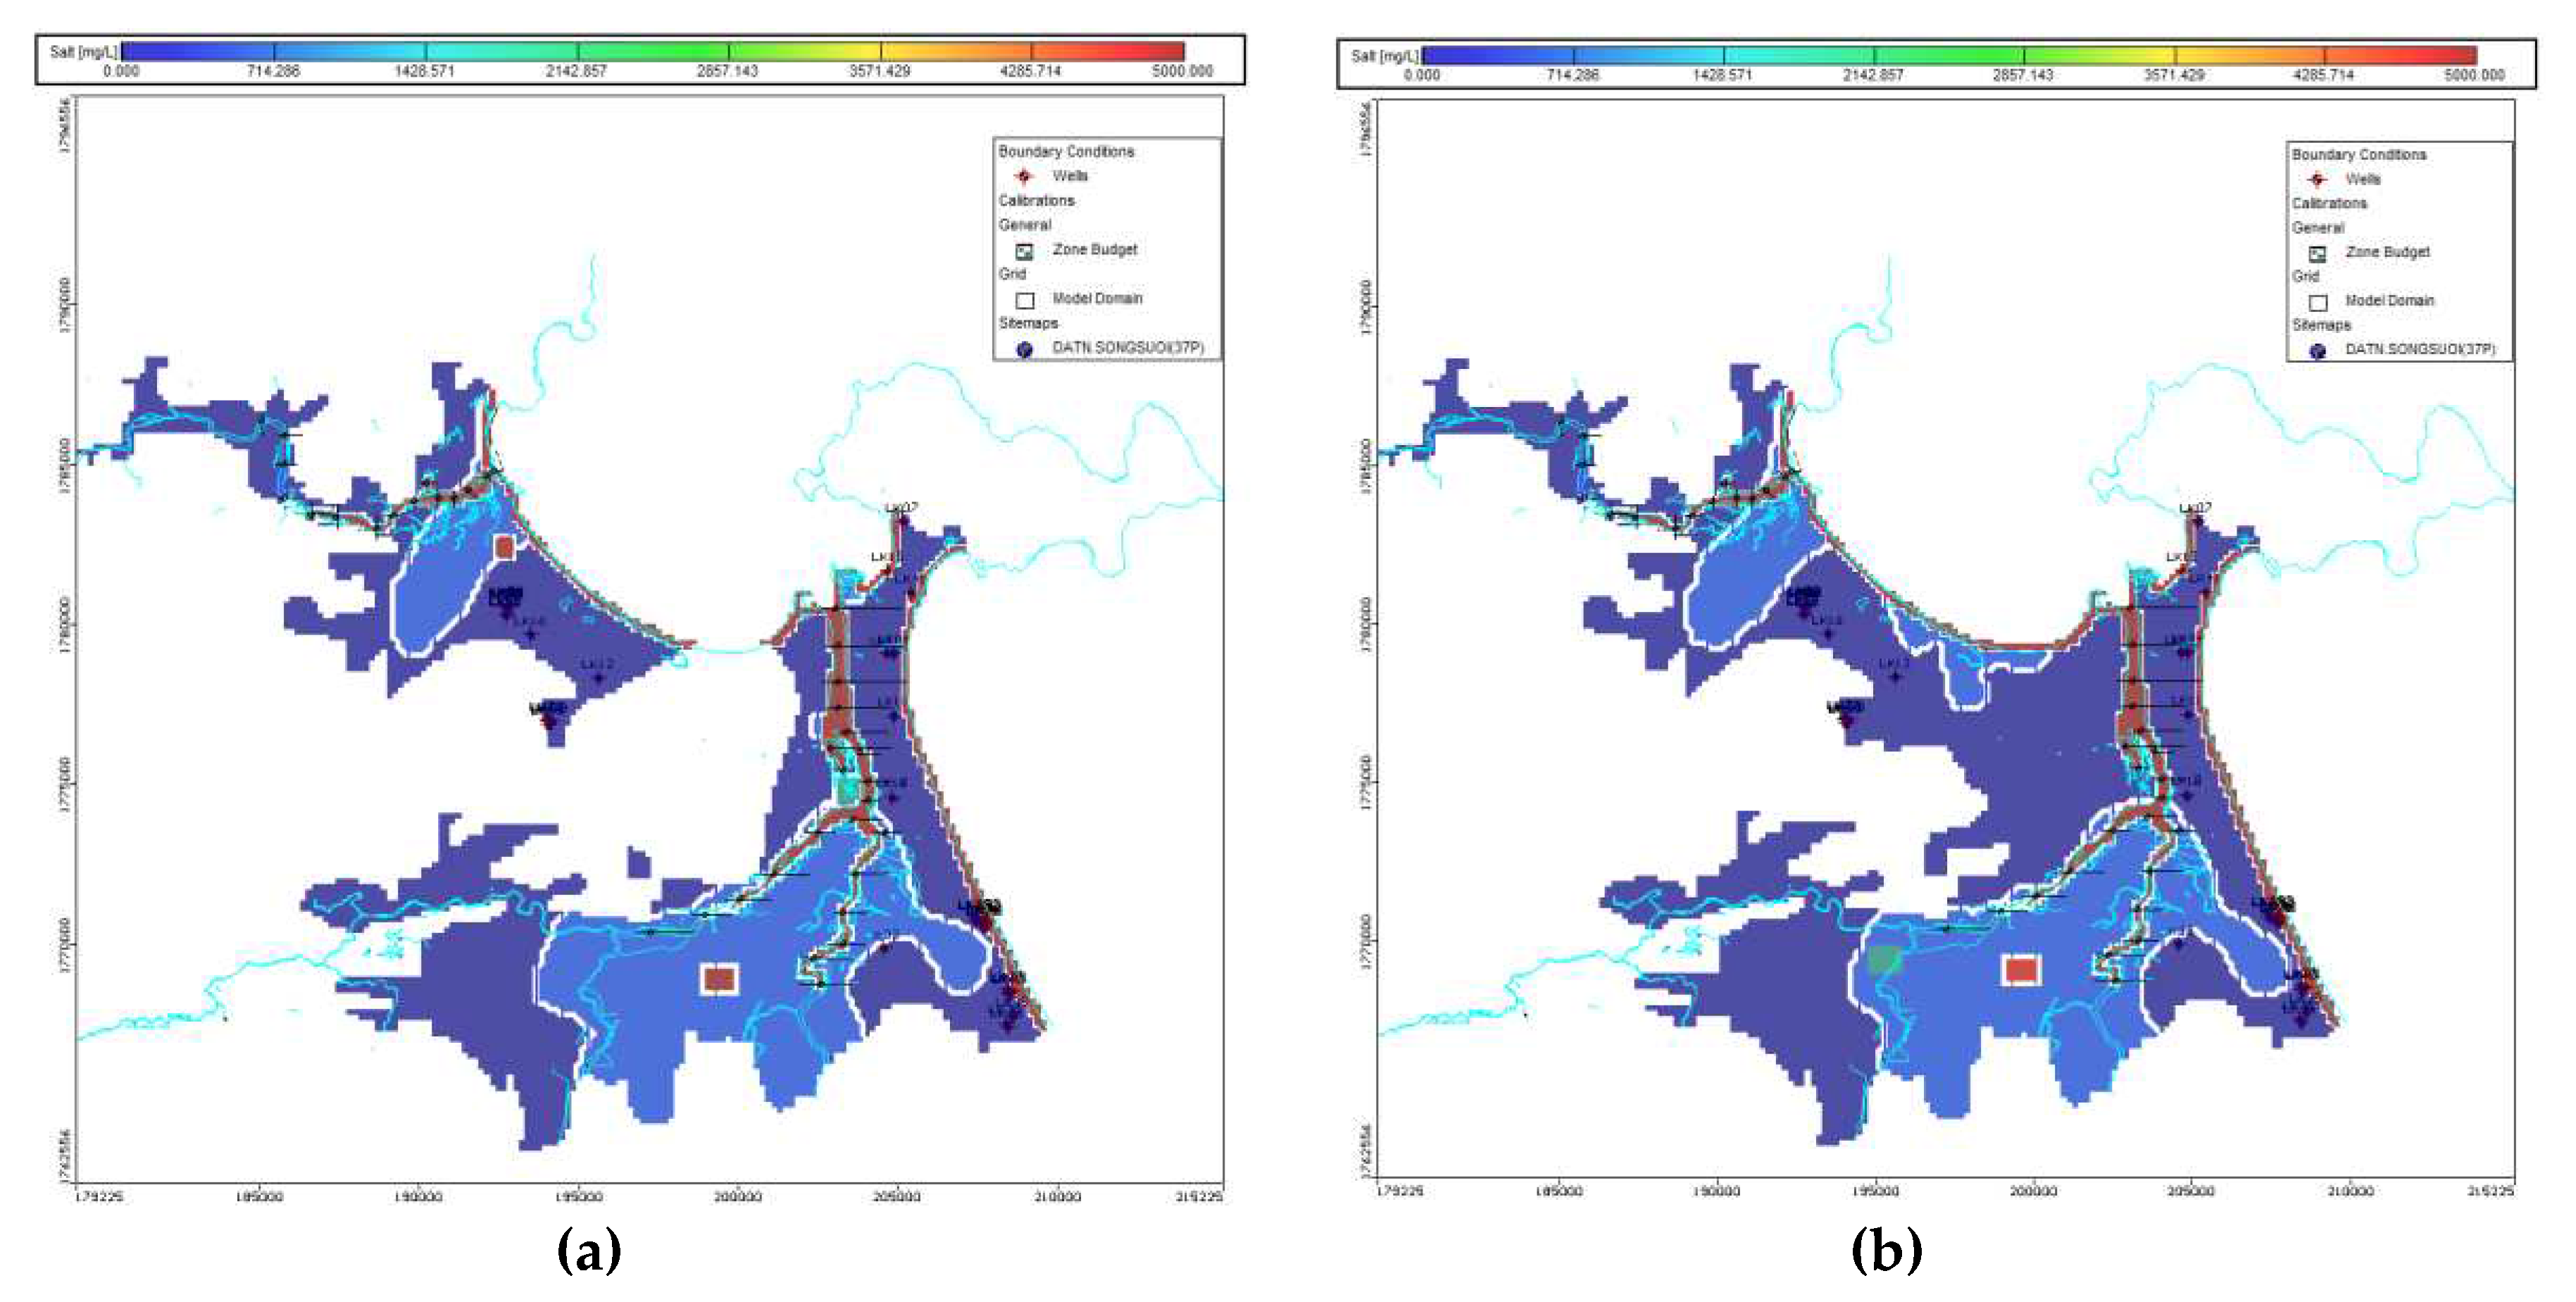

Table 1.
Analysis of the chemical composition and stable isotopes of groundwater during the rainy season (4/2019).
Table 1.
Analysis of the chemical composition and stable isotopes of groundwater during the rainy season (4/2019).
| No | Field Code | Ca2+ (mg/l) |
Mg2+ (mg/l) |
Na+ (mg/l) |
SO42- (mg/l) |
Cl- (mg/l) |
HCO3- (mg/l) |
d18O (‰) |
d2H (‰) |
| 1 | BS1 | 32.06 | 48.76 | 590.41 | 87.51 | 1032.34 | 34.97 | -10.22 | -30.75 |
| 2 | BS2 | 33.67 | 9.73 | 58.67 | 91.51 | 71.05 | 69.46 | -11.94 | -38.23 |
| 3 | NHS12 | 33.67 | 6.93 | 52.75 | 80.33 | 71.02 | 53.74 | -10.67 | -32.21 |
| 4 | BS3 | 34.27 | 3.53 | 20.27 | 43.09 | 35.50 | 60.47 | ||
| 5 | BS5 | 13.03 | 3.28 | 57.97 | 15.84 | 63.19 | 81.45 | -12.8 | -47.61 |
| 6 | BS6 | 96.99 | 40.25 | 94.83 | 297.57 | 120.70 | 166.37 | -9.1 | -20.01 |
| 7 | BS7 | 38.08 | 4.86 | 26.36 | 31.04 | 71.01 | 49.31 | -9.18 | -20.61 |
| 8 | BS8 | 36.07 | 0.49 | 71.66 | 12.64 | 78.10 | 152.30 | -10.53 | -31.15 |
| 9 | BS10 | 34.67 | 3.04 | 76.88 | 98.64 | 85.20 | 53.34 | -10.19 | -27.95 |
| 10 | BS11 | 15.63 | 12.16 | 82.74 | 18.21 | 129.22 | 83.76 | -11.26 | -36.48 |
| 11 | BS12 | 123.45 | 58.85 | 1278.34 | 310.64 | 2130.0 | 27.15 | -10.22 | -33.19 |
| 12 | BS13 | 21.04 | 10.71 | 39.62 | 52.15 | 62.48 | 50.01 | -11.24 | -35.85 |
| 13 | BS14 | 19.24 | 12.65 | 34.41 | 53.29 | 67.45 | 30.60 | -10.75 | -32.98 |
| 14 | BS15 | 39.26 | 8.51 | 50.06 | 90.94 | 90.17 | 24.47 | -10.63 | -30.25 |
| 15 | BS16 | 12.42 | 3.77 | 36.71 | 13.07 | 65.32 | 25.56 | -9.95 | -26.34 |
| 16 | BS17 | 20.04 | 7.32 | 26.72 | 8.31 | 43.31 | 84.09 | -10.13 | -25.33 |
| 17 | BS18 | 29.26 | 25.78 | 150.02 | 48.81 | 173.24 | 258.46 | -10.13 | -28.88 |
| 18 | BS20 | 13.43 | 3.16 | 70.41 | 21.06 | 68.16 | 99.88 | -9.05 | -21.79 |
| 19 | BS21 | 16.03 | 2.43 | 53.88 | 29.61 | 84.49 | 21.33 | -9.65 | -22.51 |
| 20 | BS22 | 25.45 | 8.15 | 62.13 | 62.13 | 58.93 | 103.61 | -9.74 | -28.92 |
| 21 | BS23 | 4.01 | 2.07 | 7.91 | 3.75 | 28.40 | 9.86 | -10.78 | -28.25 |
| 22 | BS24 | 2.20 | 5.59 | 9.55 | 4.32 | 30.53 | 2.50 | -10.37 | -27.88 |
| 23 | BS25 | 25.45 | 13.51 | 197.89 | 118.55 | 223.65 | 136.13 | -9.03 | -19.66 |
| 24 | BS26 | 4.61 | 5.59 | 8.67 | 8.65 | 32.66 | 59.33 | -11.01 | -33.32 |
| 25 | HV40 | 30.20 | 18.02 | 374.67 | 113.42 | 600.66 | 19.34 | -7.61 | -10.38 |
| 26 | BS27 | 47.01 | 17.88 | 786.83 | 264.59 | 1084.88 | 153.15 | -9.98 | -26.78 |
| 27 | HV41 | 10.02 | 1.22 | 15.58 | 9.79 | 38.34 | 48.56 | -9.37 | -22.36 |
| 28 | BS28 | 10.60 | 5.96 | 130.02 | 100.31 | 137.03 | 50.48 | -9.34 | -20.43 |
| 29 | BS29 | 19.60 | 1.58 | 30.02 | 28.19 | 55.38 | 22.64 | -9.4 | -20.88 |
| 30 | BS30 | 22.04 | 5.11 | 40.27 | 57.85 | 41.18 | 55.72 | -9.56 | -20.73 |
| 31 | BS31 | 29.06 | 4.86 | 68.87 | 32.18 | 116.40 | 55.09 | -9.46 | -22.33 |
| 32 | BS32 | 33.62 | 3.44 | 37.95 | 57.00 | 66.74 | 38.61 | -10.24 | -27.79 |
Table 2.
Hydrochemical and stable isotopic composition of groundwater in the dry season (12/2020).
| No | Field code |
Ca2+ (mg/l) |
Mg2+ (mg/l) |
Na+ (mg/l) |
SO42- (mg/l) |
Cl- (mg/l) |
HCO3- (mg/l) |
d18O (‰) |
d2H (‰) |
| 1 | BS1 | 118.27 | 46.01 | 347.22 | 818.63 | 263.88 | 24.23 | -5.66 | -29.89 |
| 2 | BS1A | 116.47 | 44.43 | 348.31 | 781.00 | 273.17 | 22.83 | -6.30 | -43.94 |
| 3 | NHS12 | 18.81 | 4.13 | 8.49 | 16.33 | 1.41 | 71.03 | -6.55 | -31.88 |
| 4 | BS3 | 38.28 | 4.26 | 8.63 | 31.95 | 45.64 | 48.40 | -4.45 | -16.59 |
| 5 | BS7 | 41.48 | 10.09 | 22.81 | 68.16 | 25.01 | 89.38 | -5.03 | -20.53 |
| 6 | BS10A | 17.01 | 6.66 | 26.32 | 17.75 | 68.00 | 38.57 | -5.90 | -29.28 |
| 7 | BS11 | 13.02 | 18.02 | 43.15 | 117.15 | 7.25 | 35.14 | -5.82 | -36.34 |
| 8 | BS12 | 160.28 | 60.15 | 1118.1 | 2105.15 | 86.02 | 33.42 | -5.69 | -35.78 |
| 9 | BS13 | 29.02 | 16.42 | 25.72 | 65.32 | 63.68 | 46.97 | -5.62 | -33.54 |
| 10 | BS15 | 43.23 | 16.49 | 38.85 | 93.72 | 90.26 | 42.97 | -3.89 | -43.98 |
| 11 | BS17 | 12.02 | 4.86 | 19.11 | 35.51 | 12.78 | 34.78 | -4.33 | -29.94 |
| 12 | BS18 | 35.67 | 25.17 | 103.11 | 174.66 | 85.41 | 101.52 | -4.00 | -28.73 |
| 13 | BS20 | 12.82 | 6.32 | 37.95 | 55.38 | 19.97 | 51.34 | -3.55 | -29.92 |
| 14 | BS21 | 21.41 | 6.93 | 32.25 | 63.91 | 27.49 | 41.33 | -4.61 | -32.21 |
| 15 | BS24 | 16.01 | 0.49 | 15.62 | 18.46 | 1.98 | 58.46 | -5.01 | -32.95 |
| 16 | BS25A | 1.22 | 2.07 | 21.75 | 19.17 | 2.71 | 35.48 | -5.35 | -31.33 |
| 17 | BS25 | 50.11 | 6.08 | 198.72 | 159.75 | 160.55 | 232.17 | -4.01 | -24.84 |
| 18 | HV40 | 73.51 | 25.91 | 859.82 | 1309.95 | 274.64 | 36.25 | -4.34 | -28.74 |
| 19 | BS27 | 86.69 | 32.12 | 909.32 | 1469.7 | 196.72 | 63.80 | -4.31 | -27.79 |
| 20 | HV41 | 10.81 | 3.77 | 20.52 | 26.98 | 10.33 | 47.02 | -4.12 | -27.15 |
| 21 | BS28 | 40.08 | 11.67 | 35.15 | 78.11 | 91.41 | 24.42 | -3.76 | -23.96 |
| 22 | BS29 | 14.03 | 0.61 | 9.82 | 21.32 | 3.03 | 31.47 | -4.90 | -32.74 |
| 23 | BS30 | 18.44 | 0.61 | 26.25 | 24.14 | 39.95 | 36.71 | -5.40 | -35.31 |
| 24 | BS31 | 59.12 | 0.61 | 17.15 | 39.76 | 65.38 | 77.49 | -4.41 | -29.62 |
| 25 | BS32 | 32.02 | 4.86 | 38.81 | 78.12 | 31.50 | 51.04 | -3.94 | -26.51 |
Table 2.
Hydrochemical and stable isotopic composition of groundwater in dry season (12/2020).
| Scenarios | Area of Saltwater with TDS > 1g/l (km2) | |||||
| Holocene aquifer | Pleistocene aquifer | |||||
| In 2020 | In 2035 | In 2050 | In 2020 | In 2035 | In 2050 | |
| status quo | 60.3 | 53.0 | 41.3 | 41.3 | 37.6 | 31.2 |
| stop pumping | 59.6 | 51.2 | 39.5 | 40.2 | 35.3 | 28.6 |
| 2x pumping rates | 60.2 | 56.4 | 44.3 | 41.8 | 38.8 | 35.4 |
| no recharge | 60.8 | 57.9 | 45.4 | 41.4 | 38.0 | 37.2 |
Disclaimer/Publisher’s Note: The statements, opinions and data contained in all publications are solely those of the individual author(s) and contributor(s) and not of MDPI and/or the editor(s). MDPI and/or the editor(s) disclaim responsibility for any injury to people or property resulting from any ideas, methods, instructions or products referred to in the content. |
© 2023 by the authors. Licensee MDPI, Basel, Switzerland. This article is an open access article distributed under the terms and conditions of the Creative Commons Attribution (CC BY) license (https://creativecommons.org/licenses/by/4.0/).
Copyright: This open access article is published under a Creative Commons CC BY 4.0 license, which permit the free download, distribution, and reuse, provided that the author and preprint are cited in any reuse.


