Submitted:
27 April 2023
Posted:
27 April 2023
You are already at the latest version
Abstract
Keywords:
1. Introduction
2. Materials and Methods
2.1. Solutions preparation
2.2. Radiolysis experiments
2.3. Molecular simulations
2.4. Thermochemistry
3. Radiolytic Oxidation Results and Discussion
3.1. Solubility of the crocin in water
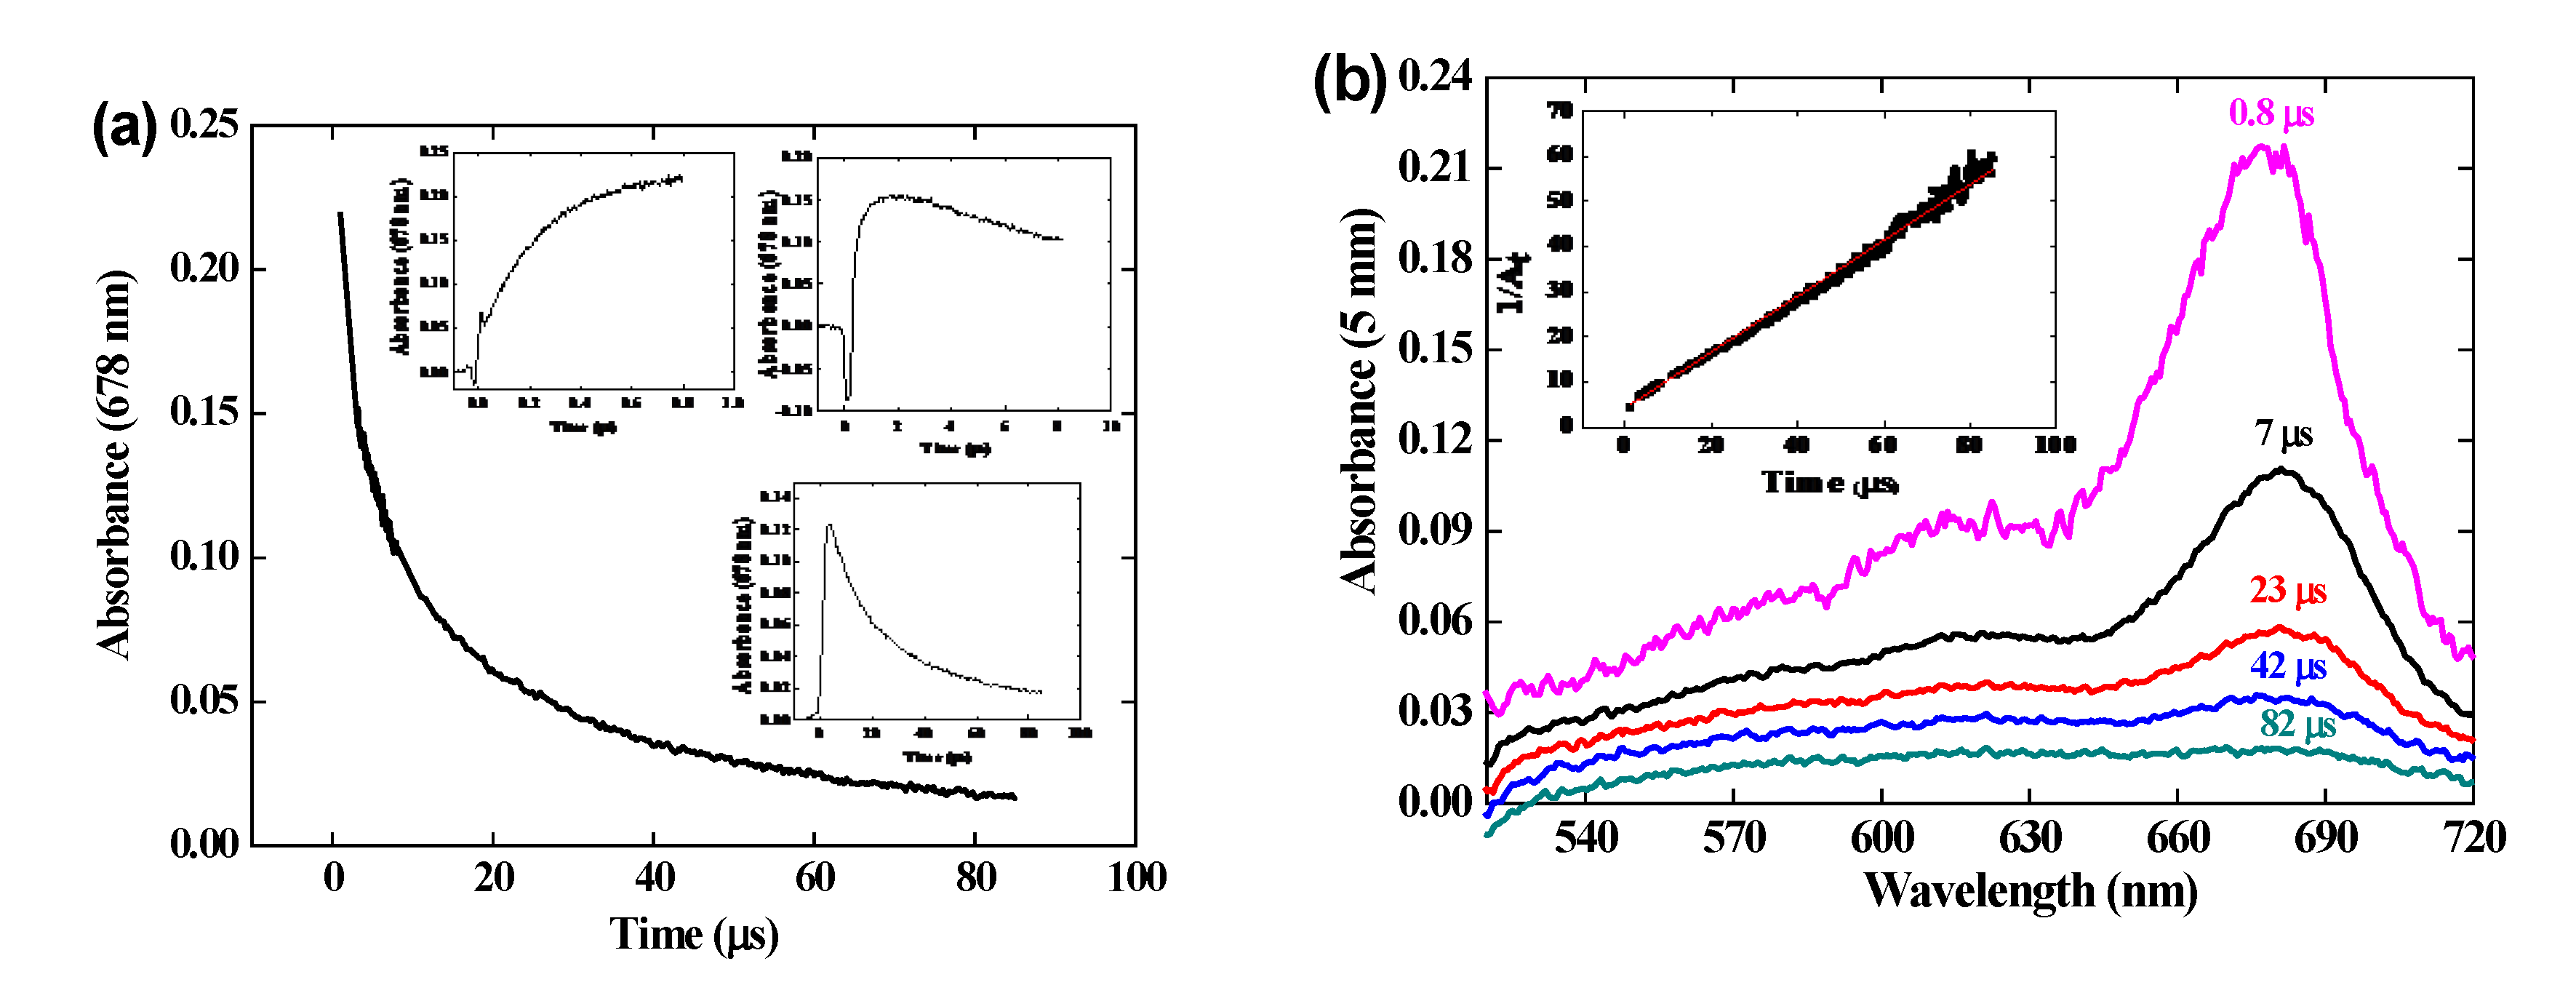
3.2. Reaction of crocin with OH• radical within 1 μs
3.3. Calibration in molar absorption coefficient of the radical optical spectrum.
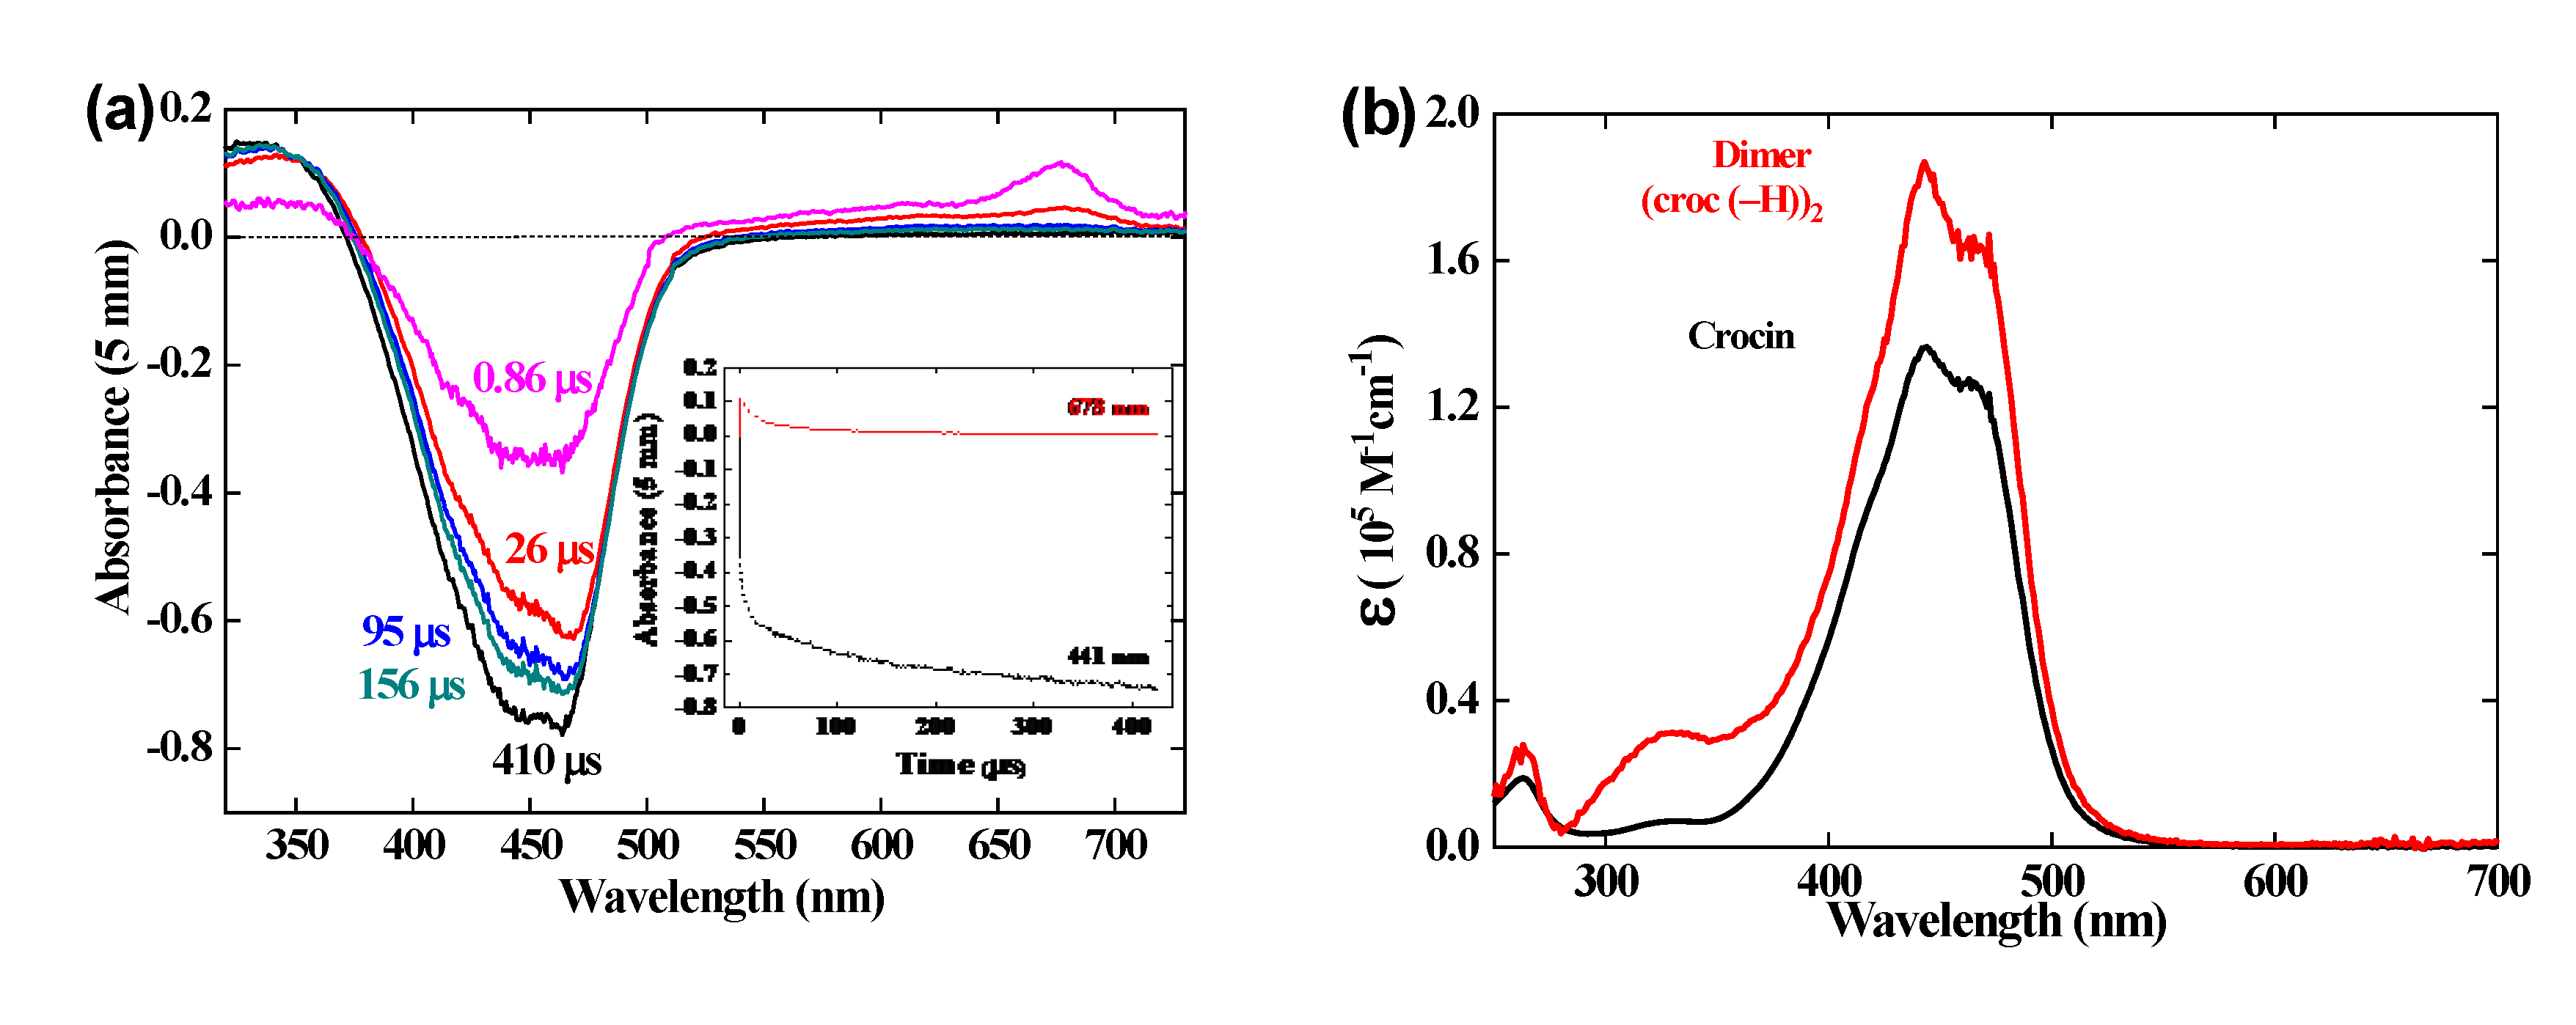
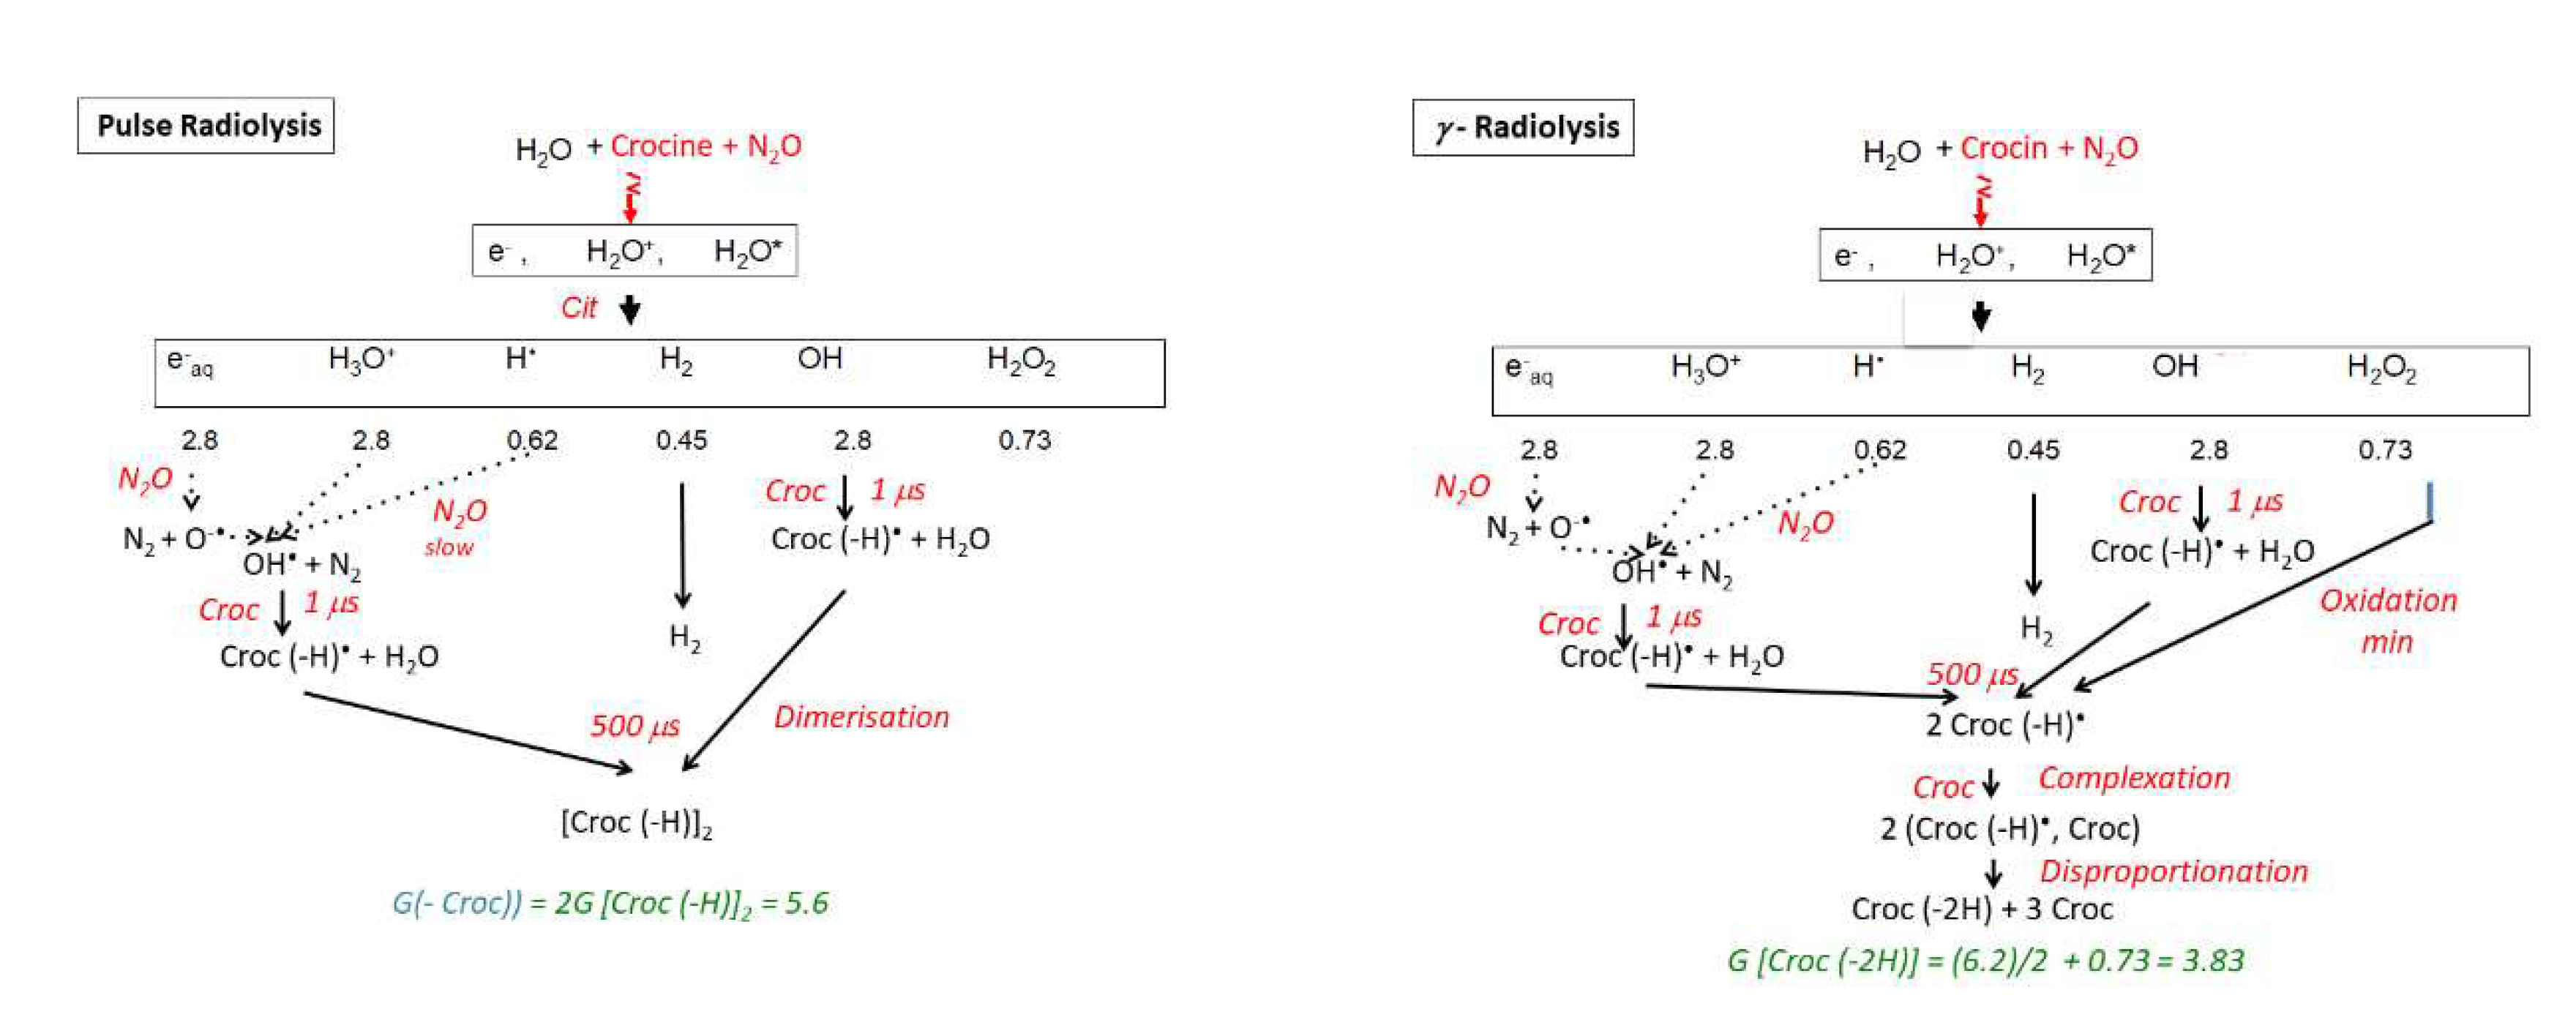
3.4. Reaction of the crocin oxidized radical (R•) within 1 to 500 μs
3.5. Calibration of the optical absorption spectrum of the radical dimer.
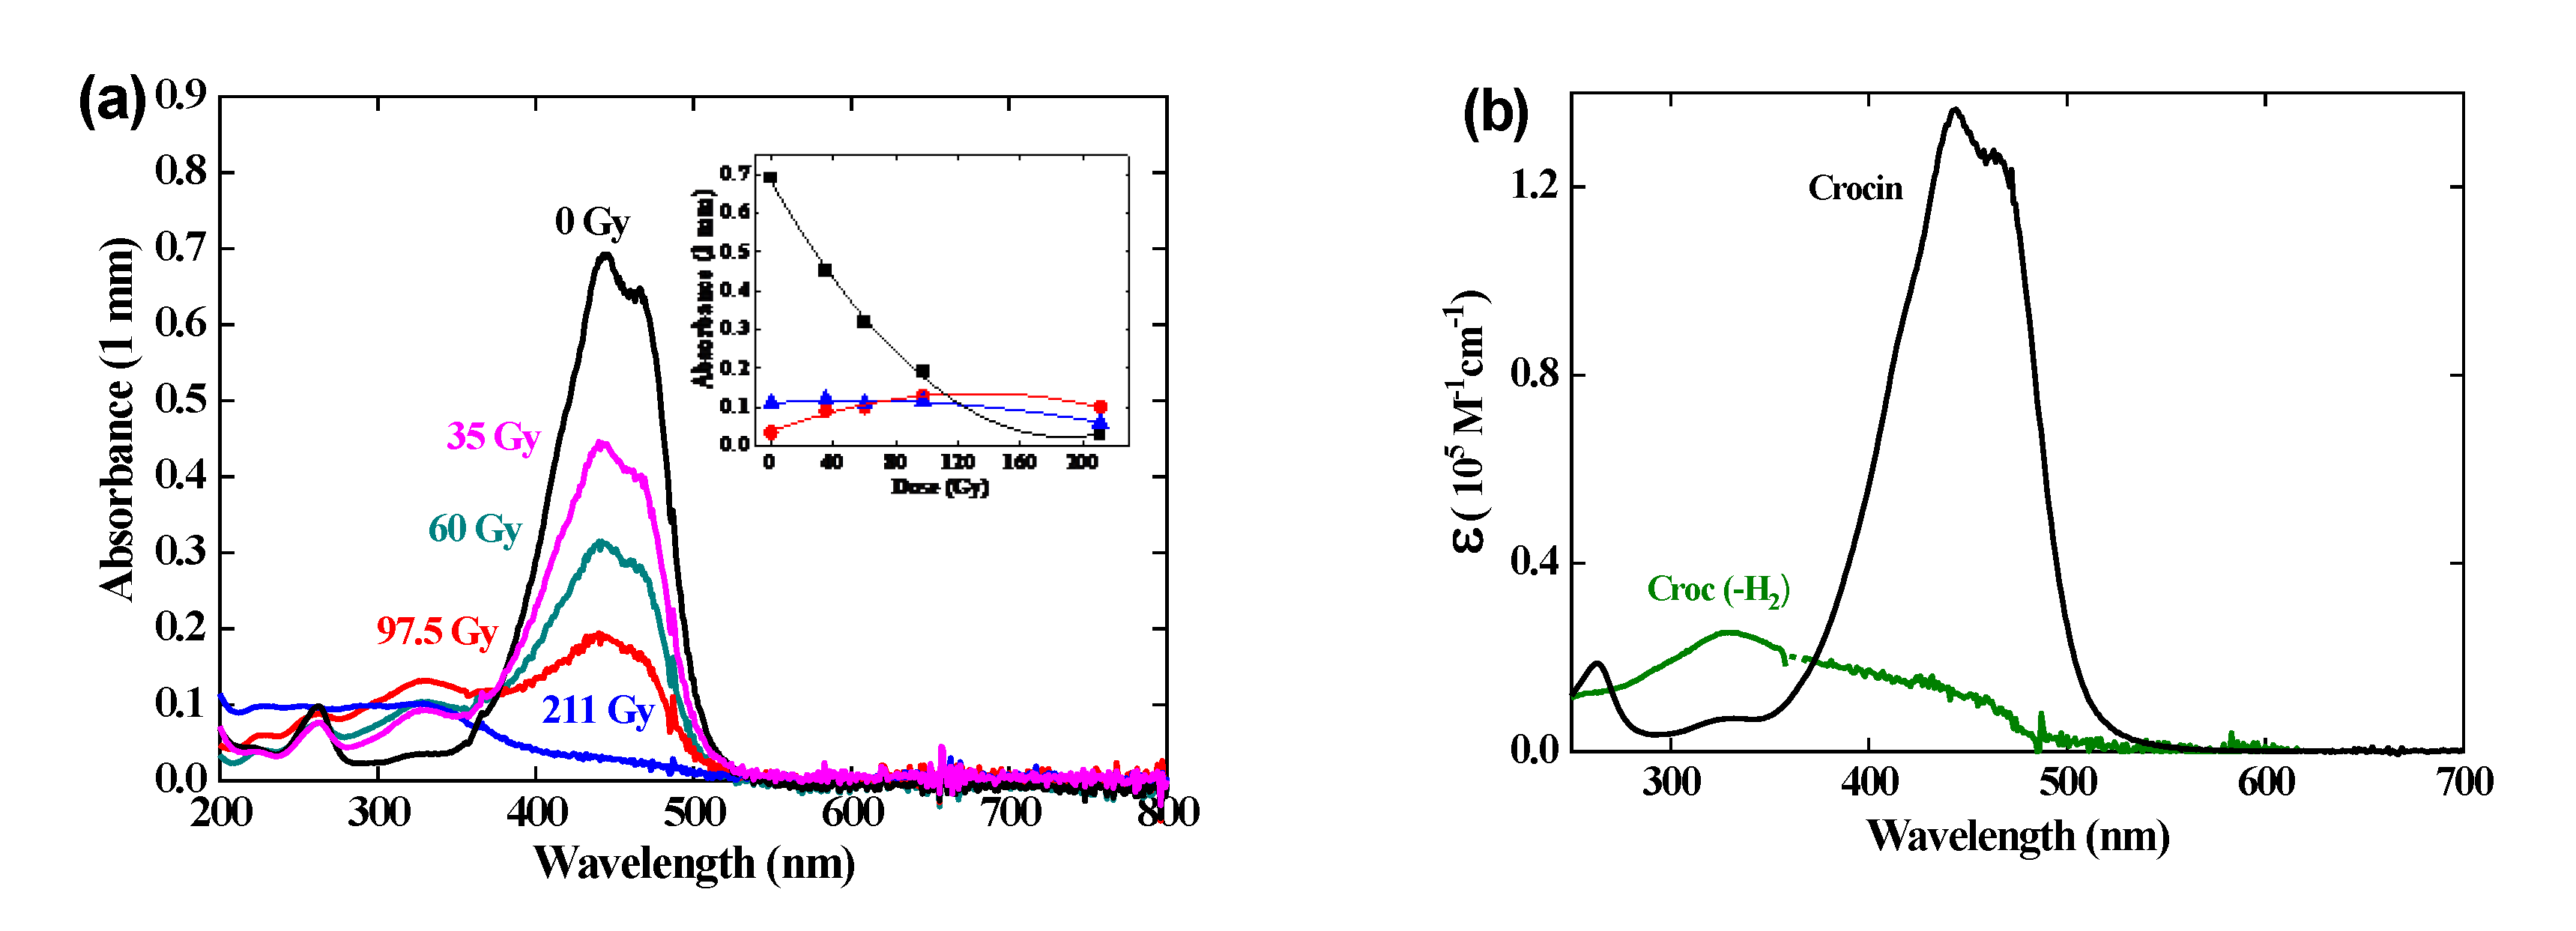
3.6. Gamma irradiation of crocin
4. Thermochemistry of Crocin and Me2-crocetin
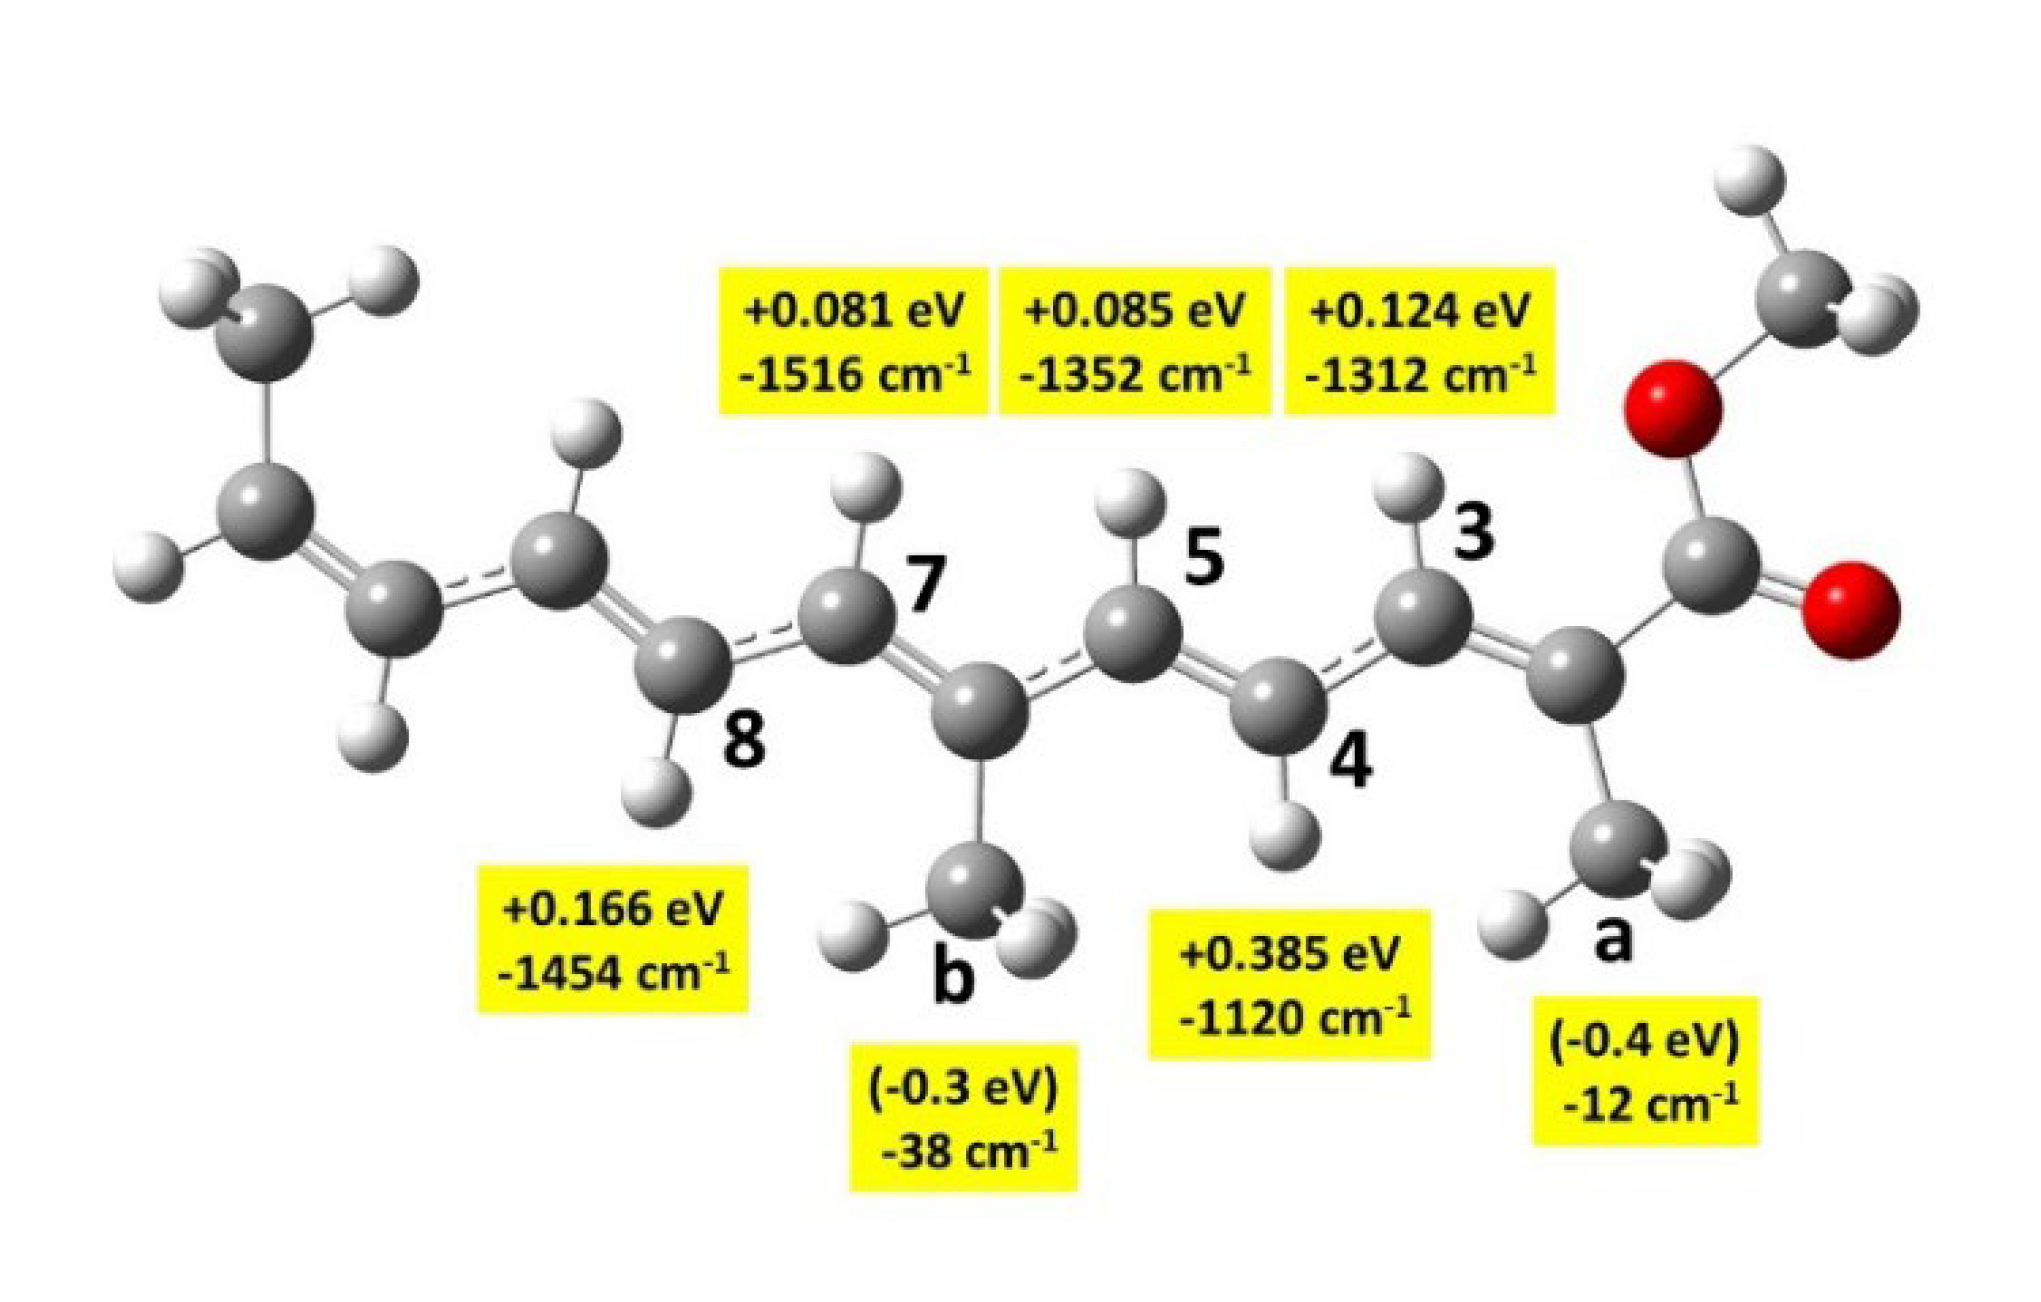
4.1. Oxidation free energies
4.2. Transition states
4.3. Conformation analysis.
5. Molecular Simulations.
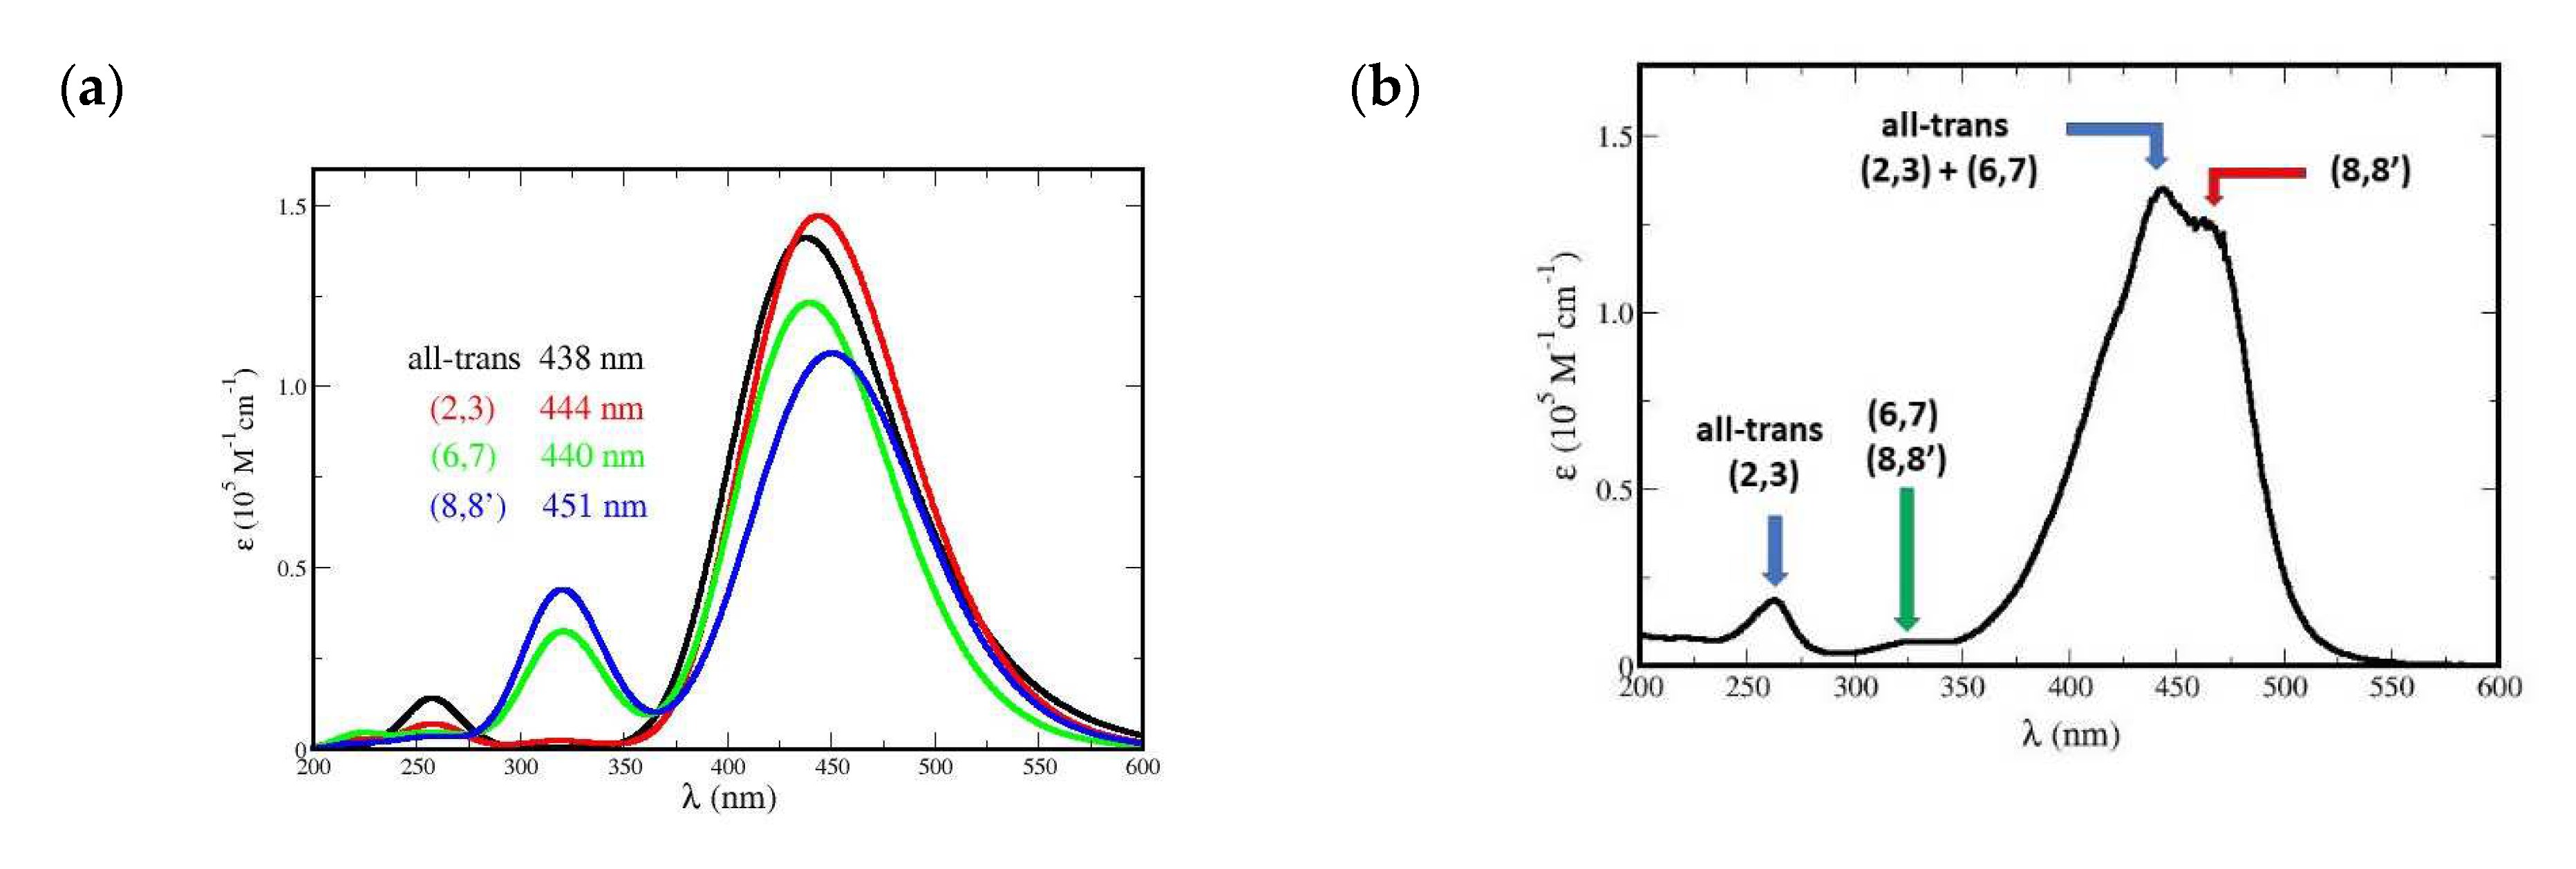
5.1. Absorption spectrum of Me2-crocetin
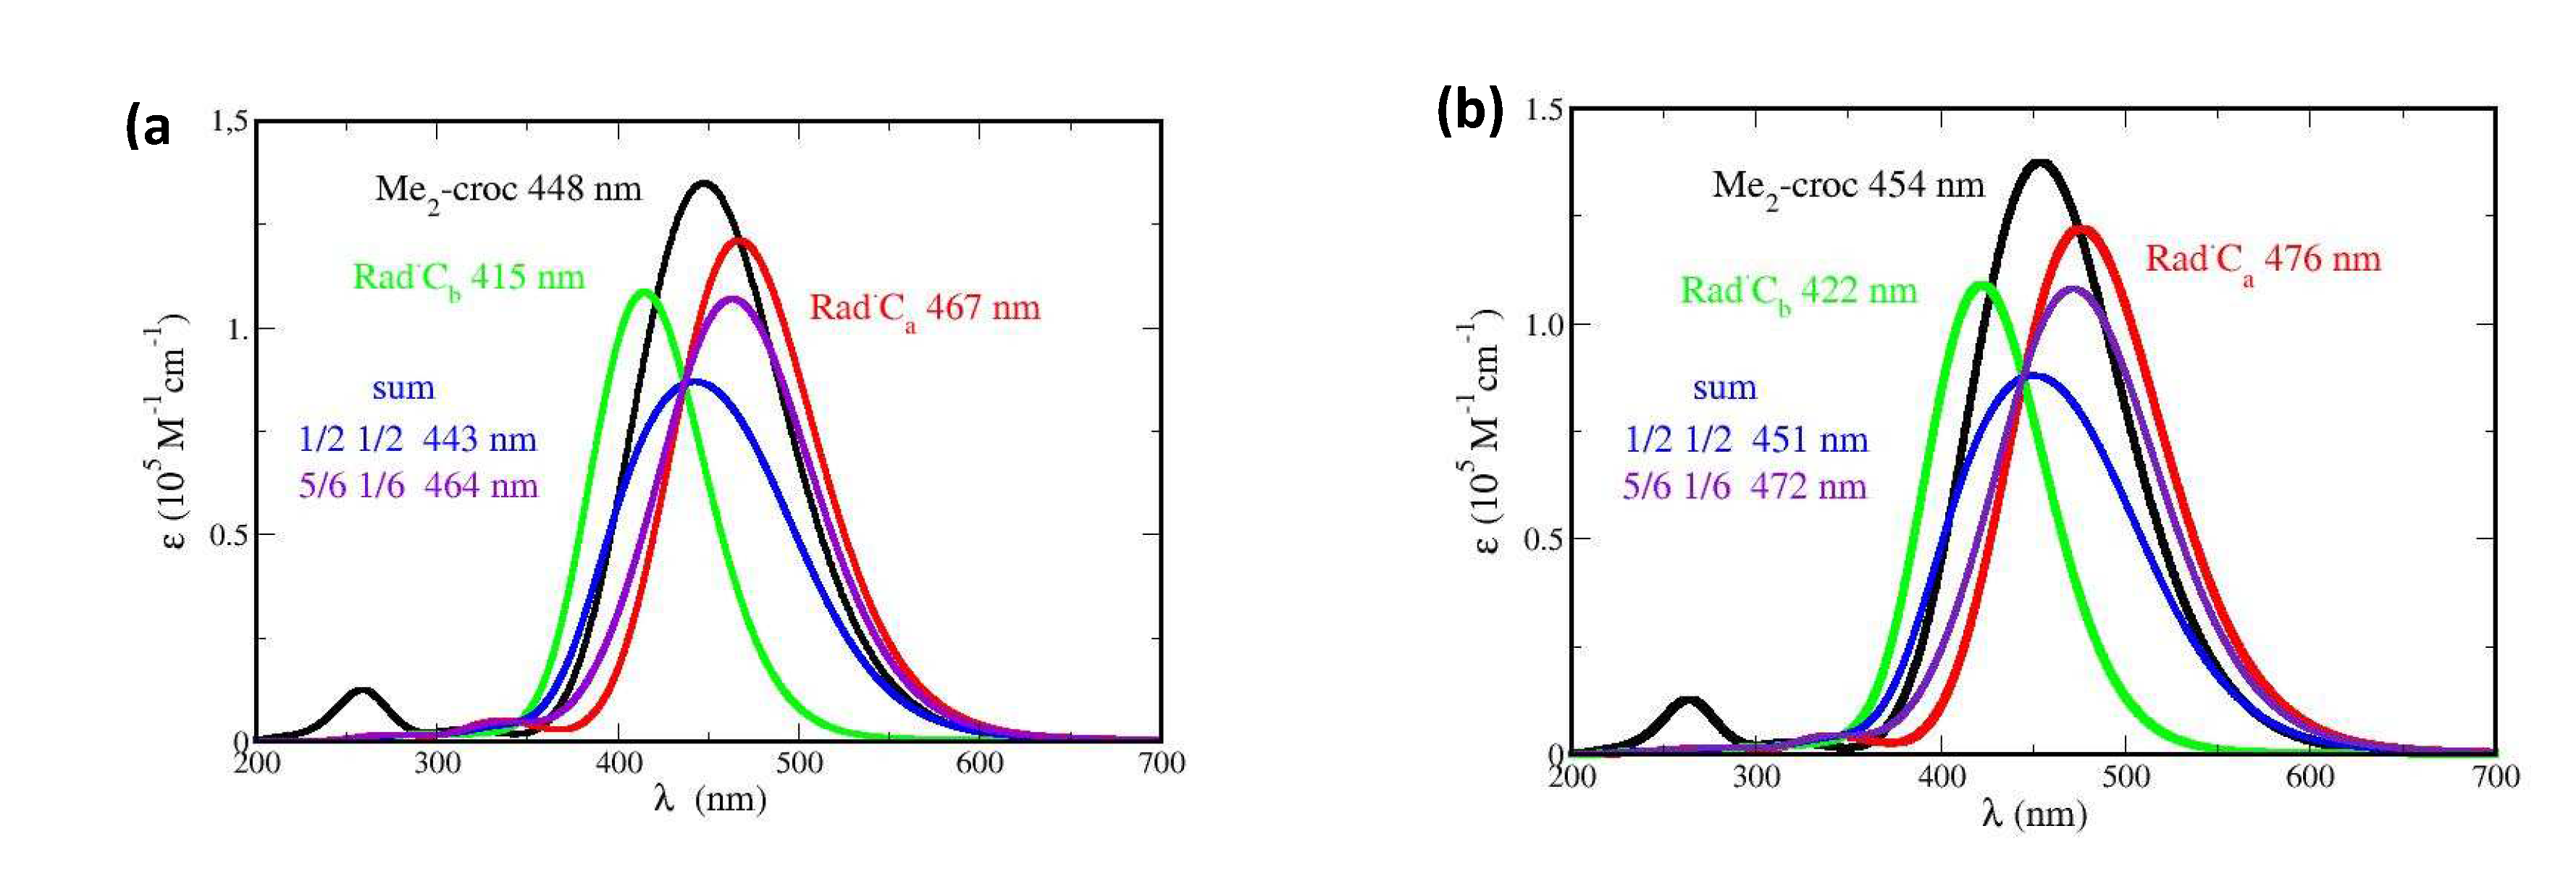
5.2. Absorption spectra of Me2-crocetin radicals
5.3. Absorption spectra of covalent dimers.
5.4. Absorption spectra of products of radical’s disproportionation
6. Conclusions
Supplementary Materials
Author Contributions
Funding
Data Availability Statement
Acknowledgments
Conflicts of Interest
References
- Mashmoul, M.A., A.; Khaza'ai, H.; Yusof, B.N.M.; Noor, S.M. Saffron: a natural potent antioxidant as a promising anti-obesity drug. Antioxidants, 2013, 2, 293–308. [Google Scholar] [CrossRef]
- Ramadan, A.S., G.; Mahmoud, S.S.; Nofal, S.M.; Abdel-Rahman, R.F. Evaluation of the safety and antioxidant activities of Crocus sativus and Propolis ethanolic extracts. J. Saudi Chem. Soc. 2012, 16, 13–21. [Google Scholar] [CrossRef]
- Kalalinia, F.; Ghasim, H.; Farzad, S.A.; Pishavar, E.; Ramezani, M.; Hashemi, M. Comparison of the effect of crocin and crocetin, two major compounds extracted from saffron, on osteogenic differentiation of mesenchymal stem cells. Life Sci. 2018, 208, 262–267. [Google Scholar] [CrossRef]
- Wang, M.-Z.; Gao, J.; Chu, Y.; Niu, J.; Chen, M.; Shang, Q.; Peng, L.-H.; Jiang, Z.-H. Synthesis of crocetin derivatives and their potent inhibition in multiple tumor cells proliferation and inflammatory property of macrophage. BMC Complement. Med. Ther. 2020, 20, 1–8. [Google Scholar] [CrossRef]
- Kabiri, M.; Rezadoost, H.; Ghassempour, A. A comparative quality study of saffron constituents through HPLC and HPTLC methods followed by isolation of crocins and picrocrocin. LWT 2017, 84, 1–9. [Google Scholar] [CrossRef]
- Kyriakoudi, A.; Chrysanthou, A.; Mantzouridou, F.; Tsimidou, M.Z. Revisiting extraction of bioactive apocarotenoids from Crocus 884 sativus L. dry stigmas (saffron). Anal. Chim. Acta. 2012, 755, 77–85. [Google Scholar] [CrossRef] [PubMed]
- I Abdullaev, F. Biological effects of saffron. BioFactors (Oxford, England), 1993, 4, 83–86. [Google Scholar]
- Rios, J.L.; Recio, M.C.; Giner, R.M.; Manez, S. An update review of saffron and its active constituents. Phytother. Res. 1996, 10, 189–193. [Google Scholar] [CrossRef]
- Winterhalter, P.; Straubinger, M. Saffron—renewed interest in an ancient spice. Food Rev. Int. 2000, 16, 39–59. [Google Scholar] [CrossRef]
- Schmidt, M.; Betti, G.; Hensel, A. Saffron in phytotherapy: Pharmacology and clinical uses. Wien. Med. Wochenschr. 2007, 157, 315–319. [Google Scholar] [CrossRef]
- Liu, N.; Yang, Y.; Mo, S.; Liao, J.; Jin, J. Calcium antagonistic effects of Chinese crude drugs: Preliminary investigation and evaluation by 45Ca. Appl. Radiat. Isot. 2005, 63, 151–155. [Google Scholar] [CrossRef] [PubMed]
- Friend, J.; Mayer, A. The enzymic destruction of carotenoids by isolated chloroplasts. Biochim. et Biophys. Acta 1960, 41, 422–429. [Google Scholar] [CrossRef] [PubMed]
- Weber, F.; Laskawy, G.; Grosch, W. Co-oxidation of carotene and crocin by soyabean lipoxygenase isoenzymes. Eur. Food Res. Technol. 1974, 155, 142–150. [Google Scholar] [CrossRef]
- Bors, W.; Saran, M.; Michel, C. Radical Intermediates Involved in the Bleaching of the Carotenoid Crocin. Hydroxyl Radicals, Superoxide Anions and Hydrated Electrons. Int. J. Radiat. Biol. Relat. Stud. Physics, Chem. Med. 1982, 41, 493–501. [Google Scholar] [CrossRef]
- Buxton, G.V. An overview of the radiation chemistry of liquids. In : Spotheim- Maurizot, M., Mostafavi, M., Douki, T., Belloni, J. (Eds.), Radiation chemistry from basics to applications in material and life sciences. EDP Sciences-L'Act. Chim., Paris, 2008, pp. 3–16.
- Akhtari, K.; Hassanzadeh, K.; Fakhraei, B.; Fakhraei, N.; Hassanzadeh, H.; Zarei, S.A. A density functional theory study of the reactivity descriptors and antioxidant behavior of Crocin. Comput. Theor. Chem. 2013, 1013, 123–129. [Google Scholar] [CrossRef]
- Kordzadeh, A.; Saadatabadi, A.R.; Adi, A. Investigation on penetration of saffron components through lipid bilayer bound to spike protein of SARS-CoV-2 using steered molecular dynamics simulation Heliyon. 2020, 6, e05681.
- Saffari, B.; Amininasab, M. Crocin inhibits the fibrillation of human α synuclein and disassembles maturefFibrils: Experimental findings and mechanistic insights from molecular dynamics Simulation. ACS Chem. Neurosci. 2021, 12, 4037–4057. [Google Scholar] [CrossRef] [PubMed]
- Martinez, A.B. ; A. antiradical power of carotenoids and vstamin E: Testing the hydrogen atom transfer mechanism. J. Phys.Chem. B, 2008, 112, 16945–16951. [Google Scholar]
- Ceron-Carrasco, J.P.; Bastida, A.; Requena, A.; Zuniga, J.; Miguel, B. A Theoretical Study of the Reaction of β-Carotene with the Nitrogen Dioxide Radical in Solution. J. Phys. Chem. B 2010, 114, 4366–4372. [Google Scholar] [CrossRef]
- Cerezo, J.; Zuniga, J.; Bastida, A.; Requena, A.; Ceron-Carrasco, J.P.; Eriksson, L.A. Antioxidant Properties of β-Carotene Isomers and Their Role in Photosystems: Insights from Ab Initio Simulations. J. Phys. Chem. A 2012, 116, 3498–3506. [Google Scholar] [CrossRef]
- Liao, F.-X.; Hu, C.-H. A density functional theory study for the role of end groups on the antioxidative potency of carotenoids. Theor. Chem. Accounts 2013, 132, 1–13. [Google Scholar] [CrossRef]
- Monego, D.L.; da Rosa, M.B.; Nascimento, P.C.D. Applications of computational chemistry to the study of the antiradical activity of carotenoids: A review. Food Chem. 2017, 217, 37–44. [Google Scholar] [CrossRef] [PubMed]
- Sandhiya, L.; Zipse, H. Conformation-dependent antioxidant properties of β-carotene. Org. Biomol. Chem. 2021, 20, 152–162. [Google Scholar] [CrossRef]
- Tzeng, Y.-Z.; Hu, C.-H. Radical-Induced Cis–Trans Isomerization of Fatty Acids: A Theoretical Study. J. Phys. Chem. A 2014, 118, 4554–4564. [Google Scholar] [CrossRef] [PubMed]
- Belloni, J.M., H.; Gobert, F.; Larbre, J.-P.; Demarque, A.; De Waele, V.; Lampre, I.; Marignier, J.-L.; Mostafavi, M.; Bourdon, J.-C.; Bernard, M.; Borie, H.; Garvey, T.; Jacquemard, B.; Leblond, B.; Lepercq, P.; Omeich, M.; Roch, M.; Rodier, J.; Roux, R. ELYSE. A picosecond electron accelerator for pulse radiolysis research. Nucl. Instrum. Meth. Phys. Res., Sect. A 2005, 539, 527–539. [Google Scholar]
- Marignier, J.-L.; de Waele, V.; Monard, H.; Gobert, F.; Larbre, J.-P.; Demarque, A.; Mostafavi, M.; Belloni, J. Time-resolved spectroscopy at the picosecond laser-triggered electron accelerator ELYSE. Radiat. Phys. Chem. 2006, 75, 1024–1033. [Google Scholar] [CrossRef]
- Torche, F.; Marignier, J.-L. Direct Evaluation of the Molar Absorption Coefficient of Hydrated Electron by the Isosbestic Point Method. J. Phys. Chem. B 2016, 120, 7201–7206. [Google Scholar] [CrossRef] [PubMed]
- Wang, F.; Schmidhammer, U.; Larbre, J.-P.; Zong, Z.; Marignier, J.-L.; Mostafavi, M. Time-dependent yield of the hydrated electron and the hydroxyl radical in D2O: a picosecond pulse radiolysis study. Phys. Chem. Chem. Phys. 2018, 20, 15671–15679. [Google Scholar] [CrossRef] [PubMed]
- Jacquemin, D.; Brémond, E.; Planchat, A.; Ciofini, I.; Adamo, C. TD-DFT Vibronic Couplings in Anthraquinones: From Basis Set and Functional Benchmarks to Applications for Industrial Dyes. J. Chem. Theory Comput. 2011, 7, 1882–1892. [Google Scholar] [CrossRef]
- Brémond. ; Alberto, M.E.; Russo, N.; Ricci, G.; Ciofini, I.; Adamo, C. Photophysical properties of NIR-emitting fluorescence probes: insights from TD-DFT. Phys. Chem. Chem. Phys. 2013, 15, 10019–10027. [Google Scholar] [CrossRef]
- Ungerer, P.; Tavitian, B.; Boutin, A. Applications of molecular simulations in the oil and gas industry. Monte-Carlo methods. Editions Technip: Paris 2005.
- Vydrov, O.A.; Scuseria, G.E. Assessment of a long-range corrected hybrid functional. J. Chem. Phys. 2006, 125, 234109. [Google Scholar] [CrossRef]
- Frisch, M.J. et al. Gaussian 16, Rev B.01, Gaussian, Inc, Wallingford, CT 2016.
- Lever, A.B.; Gorelski, S.I. Ruthenium complexes of non-innocent Ligands: Aspects of charge transfer spectroscopy. Struct. Bonding (Berlin) 2004, 107, 77–114. [Google Scholar]
- Wang, F.; Pernot, P.; Marignier, J.-L.; Archirel, P.; Mostafavi, M. Mechanism of (SCN)2. - Formation and decay in neutral and basic KSCN solutions upon irradiation from a pico to microsecond range. J. Phys. Chem. B 2019, 123, 6599–6608. [Google Scholar] [PubMed]
- Archirel, P.; Houée Levin, C.; Marignier, J.-L. Radiolytic oxidation of two inverse dipeptides, methionine-valine and valine-methionine: a Joint experimental and computational study. J. Phys. Chem. B 2019, 123, 9087–9097. [Google Scholar] [CrossRef]
- Léonard, C.; Le Quéré, F.; Adjei, D.; Denisov, S.A.; Mostafavi, M.; Archirel, P. Oxidation of silver cyanide Ag(CN)2- by the OH radical: from ab initio calculations to molecular simulations, and to experiment. J. Phys. Chem. A 2020, 124, 10787–10798. [Google Scholar] [CrossRef] [PubMed]
- Ipatov, A.; Cordova, F.; Doriol, L.J.; Casida, M.E. Excited-state spin-contamination in time-dependent density-functional theory for molecules with open-shell ground states. J. Mol. Struct. THEOCHEM 2009, 914, 60–73. [Google Scholar] [CrossRef]
- Wertz, D.H. Relationship between the gas-phase entropies of molecules and their entropies of solvation in water and 1-octanol. J. Am. Chem. Soc. 1980, 102, 5316–5322. [Google Scholar] [CrossRef]
- Lattach, Y.; Archirel, P.; Remita, S. Influence of chemical functionalities of a molecular imprinted polymers on its sensing properties: electrochemical measurements and semiempirical DFT calculations. J. Phys. Chem. B. 2012, 116, 1467–148. [Google Scholar] [CrossRef]
- Dennington, R.D.; Keith, T.A.; Millam, J.M. GaussView 6. 1.1 Semichem Inc. 2019.
- Kuhn, R.; Wang, Y. Synthese des Tetradecacetylcrocins und verwandter Verbindungen. Berichte der Dtsch. Chem. Ges. (A B Series) 1939, 72, 871–878. [Google Scholar] [CrossRef]
- Cvetković, D.; Marković, D. Stability of carotenoids toward UV-irradiation in hexane solution. J. Serb. Chem. Soc. 2008, 73, 15–27. [Google Scholar] [CrossRef]
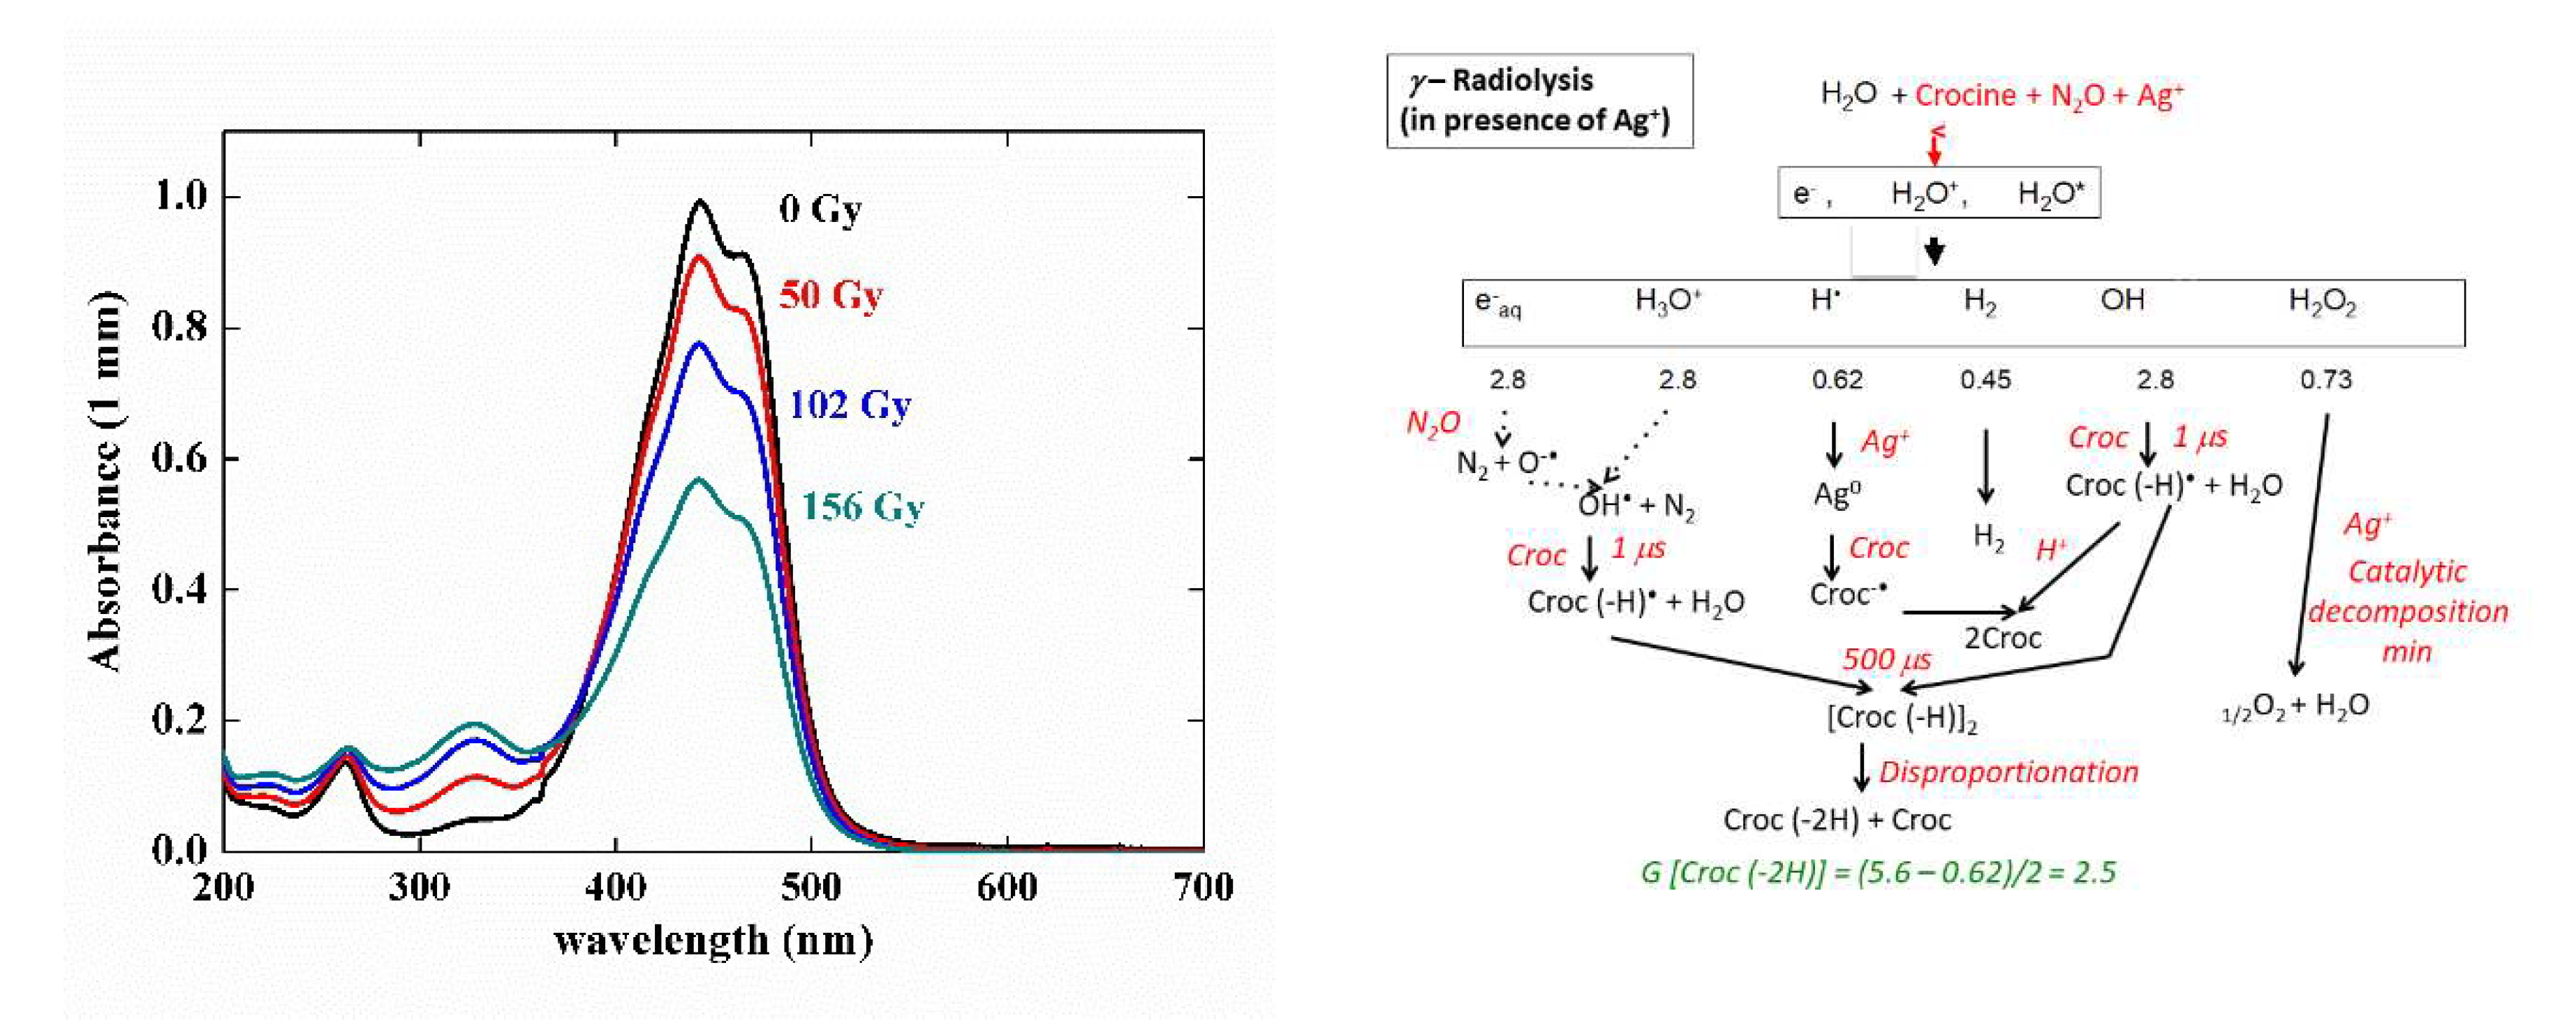

| Solution | Crocin (pulse radiolysis) |
Crocin (γ-rays) |
Crocin + Ag+ (γ-rays) |
|---|---|---|---|
| Gexp(- croc) | - | 4.0 | 2.1 |
| Gcalc(- croc) | 6.2 | 3.84 | 2.5 |
| Gcalc (croc –(H•) | 6.2 | - | - |
|
ε678nm(croc –(H)•) ε441nm(croc –(H)•) ε333nm(croc –(H)•) |
0.0623 1.17 0.10 |
- | - |
| Gcalc (croc –(H))2 | 3.1 | - | - |
|
ε333nm(croc –(H))2 ε441nm(croc –(H))2 ε678nm(croc –(H))2 |
0.31 1.84 0 |
- |
- |
| Gcalc (croc –2H)) | - | 3.84 | 2.5 |
|
ε333nm(croc (–2H)) ε441nm(croc (–2H)) |
- | 0. 26 0.13 |
- |
| Reaction | ∆rG (eV) | ||
|---|---|---|---|
| Me2-crocetin + OH• | → R•Ca | + H2O |
- 1.98 |
| → R•Cb | - 1.94 | ||
| R•Ca + R•Ca | → dimer CaCa | - | - 1.09 |
| R•Ca + R•Cb | → dimer CaCb | - | - 1.05 |
| R•Cb + R•Cb | → dimer CbCb | - | - 1.12 |
| R•Ca + R•Ca | → Me2-crocetin (- 2H) CaCa’ 1A | + Me2-crocetin | - 0.26 |
| → Me2-crocetin (- 2H) CaCa’ cyclic | - 0.48 | ||
| → Me2-crocetin (- 2H) Ca•Cb• 3a | + 0.30 | ||
| → Me2-crocetin (- 2H) Ca•Cb• 1A | ≥ + 0.30 | ||
| → Me2-crocetin (- 2H) CaCb cyclic | - 1.28 | ||
| → Me2-crocetin (- 2H) CaCb’ 1A | - 0.26 | ||
| → Me2-crocetin (- 2H) CaCb’ cyclic | - 0.39 | ||
| R•Ca + R•Cb | → Me2-crocetin (- 2H) CaCa’ 1A | + Me2-crocetin | - 0.30 |
| → Me2-crocetin (- 2H) CaCa’ cyclic | - 0.52 | ||
| → Me2-crocetin (- 2H) Ca•Cb• 3a | + 0.26 | ||
| → Me2-crocetin (- 2H) Ca•Cb• 1A | ≥ + 0.26 | ||
| → Me2-crocetin (- 2H) CaCb cyclic | - 1.32 | ||
| → Me2-crocetin (- 2H) CaCb’ 1A | - 0.30 | ||
| → Me2-crocetin (- 2H) CaCb’ cyclic | - 0.43 | ||
| → Me2-crocetin (- 2H) CbCb’ 1A | - 0.29 | ||
| → Me2-crocetin (- 2H) CbCb’ cyclic | - 1.04 | ||
| R•Cb + R•Cb | → Me2-crocetin (- 2H) Ca•Cb• 3a | + Me2-crocetin | + 0.22 |
| → Me2-crocetin (- 2H) Ca•Cb• 1A | ≥ + 0.22 | ||
| → Me2-crocetin (- 2H) CaCb cyclic | - 1.36 | ||
| → Me2-crocetin (- 2H) CaCb’ 1A | - 0.33 | ||
| → Me2-crocetin (- 2H) CaCb’ cyclic | - 0.47 | ||
| → Me2-crocetin (- 2H) CbCb’ 1A | - 0.33 | ||
| → Me2-crocetin (- 2H) CbCb’ cyclic | - 1.08 | ||
| R•Ca + Me2-crocetin | (R•Ca, Me2-crocetin) | - | - 0.52 |
| R•Cb + Me2-crocetin | (R•Cb, Me2-crocetin) | - | - 0.52 |
Disclaimer/Publisher’s Note: The statements, opinions and data contained in all publications are solely those of the individual author(s) and contributor(s) and not of MDPI and/or the editor(s). MDPI and/or the editor(s) disclaim responsibility for any injury to people or property resulting from any ideas, methods, instructions or products referred to in the content. |
© 2023 by the authors. Licensee MDPI, Basel, Switzerland. This article is an open access article distributed under the terms and conditions of the Creative Commons Attribution (CC BY) license (http://creativecommons.org/licenses/by/4.0/).


