Submitted:
21 April 2023
Posted:
23 April 2023
You are already at the latest version
Abstract
Based on the 2013–2017 Chinese Family Database and China Household Finance Survey, the study examines the impact of farmland transfer on the income structure of agricultural households. We observe a significant rise in the income of transferred-out households, while that of transferred-in households is unchanged. A further empirical decomposition of income shows a significant increase in both the wage and asset generated incomes of transferred-out households. Although the income generated by transferred-in households through agricultural production and management increases significantly, the decrease in wage income is larger. The study’s empirical designs are robustly tested with propensity score matching and instrumental variables. Moreover, we conduct a comparative analysis of the external constraints faced by the two groups to explore the reasons for the divergence of the income effect. The results show that transferred-in households face highly pronounced external constraints in terms of capital, technology, and farmland size, while transferred-out households face relatively fewer impediments to non-agricultural employment. Our empirical results imply that external constraints can limit the social welfare improvements of agricultural land reform, suggesting that other complementary measures would be required for future policy improvements to work better.
Keywords:
farmland transfer
; income effect
; external constraints
; transferred-out households
; transferred-in households
1. Introduction
The sustainability of economy calls for inclusive growth and poverty reduction. With the rural being the most vulnerable to poverty, searching for ways to raise farmers’ incomes has consequently be en one of the objectives of policy makers (Ellis & Freeman, 2004; Haggblade et al., 2010) [1,2], supported by policy instruments such as transfer payments, microfinance, infrastructure improvement, technology introduction, human capital investment, and land reform. Undoubtedly, these policies are aimed at deepening labor divisions between the farm and nonfarm sectors so that farmers can maximize output by fully utilizing their competitive advantages. This paper is concerned with the role of land reform, that is, land transfer, on farmers’ income growth.
By allowing the land transfer, why can the farmer’s income be enhanced? Actually, an efficient market for farmland transfer can optimize both productivity and farmers’ social welfare by reducing the misallocation of labor mobility and land size. (Ricker-Gilbert et al., 2019) [3]. Apparently, households are heterogeneous in skill; some of them have a competitive advantage in agriculture, while others are in nonfarm sector. With less frictions in the land market, agriculturally advantaged farmers may expand the land size and maximize scale economies to increase agricultural output and income (Kijima & Tabetando, 2020; Zhang et al., 2020a; Deininger et al., 2014) [4,5,6]. For non-farm competitive households, they may rent out land and engage directly in the non-farm sector, thereby raising the wage and rental income (Han et al., 2021; Peng et al., 2020; Jin & Jayne, 2013) [7,8,9]. Thus, total household income would improve significantly.
However, the allocation of productive factors in developing countries is hindered by market failures and institutional frictions (Chari et al., 2021; Chen, 2017) [10,11], resulting in resource misallocation and high transaction costs (Restuccia & Rogerson, 2017) [12]. Considerable evidence suggests that agricultural land reforms in developing countries have not improved farmers’ social welfare, but worsened agricultural sector productivity (Adamopoulos & Restuccia, 2020; Adamopoulos et al., 2022) [13,14]. In China, agricultural land reforms were implemented in rural areas in the early 1980s through the Household Responsibility System (HSR), while the farmland certification program commenced in the late 2000s. However, the findings of related policy assessments have been inconsistent, with Adamopoulos et al. (2022) [14] concluding that the HSR did not necessarily improve agricultural productivity, while both Chari et al. (2021) [10] and Gao et al. (2021) [15] argue that the reforms optimized agricultural resource allocation. We speculate that the divergent study findings are caused by external constraints; nonetheless, the extent to which external constraints affect agricultural households’ economic performance remains unknown.
Empirical evidence shows the mixed relation between farmland transfers and household income. Most scholars have found that farmland transfer policies can optimize the distribution of surplus rural labor, thus improving agricultural household income and social welfare (Li et al., 2019; Nguyen et al., 2021; Peng et al., 2020) [8,16,17]. Nevertheless, some studies have also presented contrasting results. For example, some studies have found that transferred-in households could experience income growth, while transferred-out households do not experience such growth (Han et al., 2021; Zhang et al., 2018) [7,18]. One study suggests a significant negative correlation between transferred-out behavior and household income (Geng et al., 2021) [19]. Even in other developing countries, the studies on the same topic have found inconsistent findings. For example, Kijima & Tabetando (2020) [4] finds that in neither Kenya nor Uganda did transferred-in land increase farmers’ income, differing from Jin & Jayne’s (2013) [9] analysis for Kenya. As well, Chamberlin & Ricker-Gilbert (2016) [20] note that in Malawi & Zambia, households faced greater economic losses with smaller transferred-in land, and rental returns were even insignificant for transferred-out households.
We believe the main reason for such mixed evidence is that external constraints, which impede the efficiency of agricultural land reform. As a result, participating farmers are not necessarily able to optimize their resource allocation through their production sector choices. Extant literature ignores the inconsistent impact of external constraints on transferred-in and transferred-out farmers. Thus, this study seeks to answer two research questions: (1) Are there differences in the incomes of transferred-in and transferred-out farmers? and (2) What aspects of external constraints lead to such differences?
We use data from the 2013–2017 China Household Finance Survey (CHFS) and Chinese Family Database (CFD) for our empirical test. The survey questionnaire consists of detailed questions about the current status of households in terms of employment, income, credit, and participation in farmland transfer. We find significant differences in the impact of farmland transfer on transferred-in and transferred-out households: transferred-out households’ income increases significantly, but that of transferred-in households has a downward trend. Using propensity score matching (PSM) and shift-share instrumental variable, we further confirm the robustness of these findings. To investigate the external constraints behind this difference, we further analyze the employment, agricultural productivity, and credit characteristics of agricultural households. The analysis of external constraints shows that the constraints faced by transferred-out households in the off-farm employment market are relatively small, while the financial, technological, and farmland size constraints faced by transferred-in households worsen their economic performance.
This study contributes to the literature in several fields. First, our study offers a more nuanced analysis of the impact of farmland titling on farmland market efficiency and welfare effects in rural China (Chari et al., 2021; Chavas et al., 2021; Gao et al., 2021; Zhao, 2020) [10,15,21,22]. The studies that come the closest are Zhang et al. (2018) [18] and Peng et al. (2020) [8], who respectively analyzed the income effect of farmland transfer on transferred-in and transferred-out agricultural households, based on cross-sectional survey data. However, it remains unclear which type of agricultural household income is more affected by farmland transfer. Based on large tracking survey data, this study discusses the impact of farmland transfer on the different sources of income of different agricultural households and analyzes the possible mechanisms behind the phenomenon.
The study also provides a plausible explanation for the resource misallocation in agricultural land reform in developing countries (Gao et al., 2021) [15]. External constraints, such as those on farmland scale, capital, and technology, limit the production optimization of transferred-in households. These findings establish a basis for corresponding policy recommendations.
Finally, the study explains the impacts of agricultural land reform in developing countries. Past empirical evidence has identified the impacts of agricultural land reform in Kenya, Mexico, Vietnam, Malawi, and Zambia (Chamberlin & Ricker-Gilbert, 2016; De Janvry et al., 2015; Jin & Jayne, 2013; Nguyen et al., 2021; Ricker-Gilbert et al., 2019) [9,17,20,23]. This study contributes to the developing literature on the impact of farmland transfer markets, particularly on the welfare of agricultural households.
2. Conceptual Framework
2.1. Impact of Farmland Transfer on Transferred-In and Transferred-Out Households without Constraints
To analyze the effect of farmland transfer on household income, we develop an idealized rural economy with only two productive sectors: agricultural and non-agricultural. The following is assumed under the idealized rural economy: (1) Farmers produce the same crops, and the non-agricultural sector is also homogeneous in terms of products. (2) Farmers are heterogenous in ability, with transferred-in households having greater agricultural productivity and transferred-out households having greater non-farm productivity. (3) Agricultural output depends only on the input of labor and farmland. (4) Gross product growth remains stable.
We use the following equation to model a household’s agricultural production function:
where is the household’s agricultural output; and are the quantities of farmland and labor invested, respectively, in the agricultural production of household i. We assume that agricultural and labor outputs are consistent with the law of diminishing marginal returns, showing 0 < α < 1. Parameter is the common total factor productivity (TFP) item, while denotes the farming ability under unconstrained conditions. Based on initial conditions, if we assume that the farmland cannot be transferred but the farmers can give up farming and choose off-farm employment, then the number of migrant workers rises. Hence, we can derive the total income function of household i as follows:
where is the marginal value of production in a village. It remains constant owing to the stable gross product. is the amount of labor force in off-farm employment, and denotes the non-farming ability of household i. and are agricultural income and non-agricultural production income, respectively.
After farmland transfer is allowed, farmers with advantages in agricultural production will rent in more land; we call such households transferred-in households. Farmers with advantages in non-agricultural production will rent out land; we call such households transferred-out households. The farmland transfer unit rent is r. We assume transferred-in households will rent in land and increase labor in agricultural production. Further, we assume transferred-out households will rent out land and decrease labor in agricultural production. Therefore, the income function of transferred-in households is
and the income function of transferred-out households is
We can set up the equation for and based on the first-order condition of maximizing income. For transferred-in households, the first-order condition of maximizing income is . Therefore, the solution is
For transferred-out households, the first-order condition of maximizing income is . Therefore, the solution is
Based on our assumption regarding farmers’ abilities, we know for transferred-in households and for transferred-out households. Hence, when transferred-in households allocate more land and labor to agricultural production, the added value in their agricultural income is greater than the reduced value in their non-agricultural income. As for transferred-out households, the reduced value in their agricultural income is less than the added value in their non-agricultural income, which gives us
Proposition 1: .
Proposition 2: .
Likewise, it is clear that the condition for transferred-in households to rent in the maximum size of land is
The situation is similar for transferred-out households when the reduced value in agricultural income is equal to the sum of the increased value in non-agricultural income and rental income, indicating that they have rented out the land to reach the maximum. Therefore, in the absence of external constraints, households participate in farmland transfer depending on their comparative advantages. As a result, both transferred-in and transferred-out households easily obtain a positive income improvement.
2.2. Impact of Farmland Transfer on Transferred-In and Transferred-Out Households with Constraints
With external constraints, it is difficult for farmers to maximize production based on their ability. We introduce constraint parameters and for the agricultural and non-agricultural sectors, respectively. is the loss of agricultural production efficiency due to external constraints such as farmland, capital, and technology, while is the risk of unemployment faced by households in the non-agricultural sector. Then, a household’s agricultural production function is
and the non-agricultural production function is: .
Hence, the income function of transferred-in households is
and the income function of transferred-out households is
with the introduction of external constraints, the added value in agricultural income for transferred-in households is , and the reduced value in non-agricultural income is . Similarly, for transferred-out households, the reduced value in agricultural income is , and the added value in non-agricultural income is . At this point, although both transferred-in and transferred-out farmers have their own comparative advantages, income variation will depend on external constraints.
For a simple example, assuming that the agricultural sector is exposed to more external constraints, namely . At this point, for the transferred-in farmer, although the Proposition 1 () is still satisfied. But we can no longer tell the magnitude of the change in farm income () from the change in nonfarm income (). Given this, we propose the following hypothesis:
Hypothesis 1.
With greater external constraints in the agriculture, transferred-out farmers can reach income growth, while transferred-in farmers face uncertainty in revenue variation.
Hypothesis 2.
In case of more pronounced constraints in non-farm employment, transferred-out households experience uncertainty in income growth, while transferred-in farmers attain income growth.
3. Data and Method
3.1. Data Source and Description
This study uses 2011 data from the CFD of Zhejiang University and the CHFS conducted by the Survey and Research Center for China Household Finance at the Southwestern University of Finance and Economics. The sample is selected using stratified, three-stage, and probability proportionate to size sampling methods. The dataset investigates all aspects of farmers’ lives, allowing us to examine the effect of farmland transfer in detail.
The data cover 320 villages in 2011, with an initial sample size of 8438 households, which expanded by 1428 villages in 2017, with a sample size of 40,011 households. By now, this survey has been conducted six times, once every two years, and data have been made public in 2011, 2013, 2015, 2017, and 2019. Yet, since this paper requires information on land transfer and agricultural production, while the related data are only available from three surveys in 2013, 2015 and 2017, therefore we use cross-sectional panel data between 2013 and 2017 for data comparability. First, the data of non-rural households are excluded. Second, only the data of households that are tracked and investigated in 2013, 2015, and 2017 are retained. Finally, agricultural households with major data gaps are excluded. The final dataset comprises 6994 agricultural households, with 20,982 observations.
Table A1 (Appendix A) shows the distribution of agricultural households involved in farmland transfer. A total of 1305 (18.66%) agricultural households participate in the transfer, of which 579 (8.28%) transfer out the farmland, and 754 (10.78%) households transfer in. The number of transferred-out households continues to increase, and by the end of 2017, the number of transferred-out households increases by 452, accounting for 14.74%. The number of transferred-in households decreases after increasing briefly. By the end of 2017, the number of transferred-in households decreases by 131 compared with 2013, and the proportion decreases to 8.91%.
To determine the income differences across various agricultural households, we classify them into three categories (transferred-in, transferred-out, and non-transfer). Figure 1 presents the household income comparison, showing that wage income accounts for more than 50% of household income in almost all categories, with a rising trend. The wage income of transferred-out households sees the maximum increase. Transferred-in households have the highest management income but the lowest increase in wage income. Property income accounts for a small proportion of household income and is characterized by slow growth. The income gap between transferred-in and non-transfer households is insignificant, but may not indicate the real income effect and needs to be tested with empirical evidence.
3.2. Variable Definition and Descriptive Statistics
To empirically test the income effect of farmland transfer, we choose agricultural, management, property, transfer, wage, and family net incomes as the main dependent variables. The core independent variables are whether to transfer out or transfer in. Simultaneously, referring to the literature, the household head’s characteristic variables (sex, age, education level) and family characteristics (family size, number of laborers, average years of education, etc.) that could effect household income are selected as control variables (Gao et al., 2019; Min et al., 2017; Su et al., 2018) [24,25,26]. Table A2 (Appendix A) shows these variables’ specific definitions and basic statistical characteristics. Table 1 shows the statistical descriptions of various economic indicators and their differences between transfer households and non-transfer households.
Table 1 shows that transferred-out households’ agricultural and management incomes are significantly lower than those of non-transfer households. Meanwhile, transferred-out households’ property, transfer, wage, and family net incomes are significantly higher than those of non-transfer households. We find that transferred-in households’ agricultural, management, and transfer incomes are significantly higher than those of non-transfer households. However, transferred-in households have lower property, wage, and family net incomes. In terms of other control variables as well, there are significant differences between transfer households and non-transfer households, which indicates a “selection bias” problem. Agricultural households’ participation in farmland transfer is a non-random “self-selection” behavior. The statistical differences of the above indicators may not be the inevitable result of farmland transfer behavior; they could have been caused by other factors. Therefore, it is necessary to further verify the income effect of farmland transfer through multiple regression analysis.
3.3. Empirical Strategy
To obtain the actual income effect of farmland transfer on different households, we construct the following reduced-form model.
where lnYit denotes the income of household i in period t, including the logarithm of agricultural, management, transfer, property, wage, and family net incomes. Dit is the status variable when household i transfers in or out at time t and can take values of 0 to 1. Xit represents a series of control variables affecting household income, δt represents time fixed effects, and εit is the random error term. As the macro-economic environment affects the transfer decision (Aguilar-Støen et al., 2016; Peng et al., 2020) [8,27] and family net income, we control for the regional fixed effects of the city level to reflect the impact of the macro-economic environment.
A concern with the regression is that the decision of whether to participate in farmland transfer is the result of self-selection. Selection bias leads to the problem of endogeneity and biased ordinary least squares estimators (Li et al., 2019; Zhang et al., 2018; Zhang et al., 2020b) [16,18,28]. Because of the concern that households’ transfer decisions are based on observable or unobservable variables, we adopt two methods to mitigate estimation bias.
Firstly, one potential cause of self-selection in land transfer participation could be the prior significant differences among households. Hence, we use the propensity score matching (PSM) method (D’Agostino, 1998) [29] to find the sample similar to the households who has participated in land transfer. The strategy for finding similar matching groups is that: (1) developing a probit model to estimate the relation between covariates and the decision of household participation in land transfer, covariates were the data before land transfer; (2) calculating the propensity score for each household and screening the similar samples based on the matching criteria; (3) re-estimating the model (14) based on the similar samples.
However, transfer decision may be influenced by unobservable variables, the “transferred-in (transferred-out)” variable is the likely cause of the disturbance. Thus, we also mitigate endogeneity concerns by finding instrumental variables. Learning from Tabellini’s (2020) [30] design ideas for shift-share instrument, we interact two sources of exogenous variation to construct an instrumental variable. First, we use the proportion of transferred-in (transferred-out) households in the other villages within the city, excluding the local village (Démurger & Xu, 2011; Kung, 2002; Li et al., 2021) [31,32,33], as the exogenous determinants of households participating in farmland transfer. Second, we use the proportion of households participating in the HSR in each province in 1983 to denote th initial willingness to participate in farmland transfer. This two-step method yields an instrumental variable of farmland transfer, which satisfies two key assumptions: correlation and exogeneity.
4. Empirical Results
4.1. Main Findings
We discuss the results for transferred-out households and compare them with those for non-transfer households and then with those for transferred-in households. We analyze the effect of farmland transfer on income structure and family net income for both groups.
The baseline regression results in Columns (1) and (2) of Table 2 show that transferred-out farmlands have a significant negative effect on agricultural and management incomes. The above results are intuitive, as the inputs of transferred-out households in agricultural production have reduced. We compare our results with those of Chamberlin and Ricker-Gilbert (2016) [20] and Zhang et al. (2018) [18], who also find that transferred-out farmlands reduce agricultural income. Besides, we see a significant increase in the wage income of transferred-out households relative to non-transfer households (Column [5]). This suggests that transferred-out households increase non-agricultural labor inputs. Similarly, transferred-out households have a higher property income compared with non-transfer households (Column [4]), and transfer income does not significantly differ between transferred-out and non-transfer households (Column [3]). Overall, our findings suggest that transferred-out farmlands increase wage and property incomes, do not affect transfer income, and decrease management income, eventually leading to a significant increase in family net income. The impact of the other control variables on different income sources is consistent with Zhang et al. (2018) [18] and Li et al.’s (2019) [16] research conclusions.
We find that transferred-in households (Table 3) have higher agricultural and management incomes than non-transfer households, suggesting that the gains in agricultural profit exceed the farmland rents paid by transferred-in households. Moreover, property income does not significantly differ between transferred-in and non-transfer households. This suggests that transferred-in households may not have invested heavily in agricultural production. We see a significant increase in transfer income, significant at the 1% level, which suggests that the state will provide financial subsidies for large-scale households (Zhang et al., 2018) [18]. Therefore, transferred-in farmlands have a significant positive effect on transfer income, though, in general, they have a significant negative effect on family net income. One possible explanation is that the decline in the wage income of transferred-in households significantly exceeds the decline in their management income.
In comparing Table 2 with Table 3, it can be seen that land transfer is positively related to the income of the transferred-out farmers, while it is negatively related to the transferred-in farmers, showing evidence that is consistent with Hypothesis 1. It seems to imply that transferred-in farmers face greater external constraints. To confirm whether income differences exist before households participate in farmland transfer, we design different time windows to compare income differences across agricultural households. We set the time when households participate in the farmland transfer as t and take t − 2 as the base period (data interval of two years) to test any possible significant difference between the two groups before the farmland transfer. Table 4 shows that, in most cases, there are no significant differences between the two groups, and the regression results are reliable. However, the wage and family incomes of transferred-out households show a relatively clear growth trend before the farmland transfer, which requires further test for robustness.
4.2. Robustness Test
4.2.1. Using the Matching Sample to Re-Estimate the Effect of Land Transfer
The PSM method is used for sample screening before participating in the farmland transfer. First, we build the logit regression equation of the transfer decision. Under this method, we select variables that have significant differences between the two groups of samples and do not change with time as covariables to measure the propensity score. Next, the (1:1) nearest neighbor matching (without putting back) is used to generate the propensity score of each variable. And, we exclude the samples that do not meet the common support domain. The PSM balance test results are presented in Table A3 (Appendix A), and the kernel density functions are presented in Figure A1 (Appendix A). Overall, there is no significant difference in the covariables between the control and treatment groups. Finally, we re-estimate the model (14) using the matching sample.
Table 5 presents the regression results after PSM. The effect of transferred-out farmlands on transfer income changes from positive to negative but remains insignificant. We find that the effect of transferred-out farmlands on management, property, and wage incomes is consistent with the benchmark regression, and the effect on family net income is still significant. In the case of transferred-in households, the effect of farmland transfer on transfer income is insignificant. The effect on the other types of income does not change, and there is still a significant negative effect on family net income. The regression results suggest that selection bias exists, but its effect on the income effect is weak.
4.2.2. Instrumented Results
We use the method described in the previous section to construct the instrumental variable and name percentage. We select age, education level, sex of the household head, family size, year dummy variables, and city dummy variables as the independent variables of the first-stage regression. Table 6 presents the regression results of the two-stage least squares, which show that in the first stage, the instrumental variables have a significant impact on farmland transfer decisions. The weak identification test shows that the variables are valid and reasonable.
The regression results of the instrumental variable model are generally consistent with the benchmark regression results, except for a change in significance in a few categories. The effect of transferred-out farmlands on management income changes from significant to insignificant but remains negative. In the case of transferred-in households, the effect on family income remains negative but insignificant. The benchmark regression, PSM regression, and instrumental variable model results suggest that the self-selection problem exists and may lead to a mis-estimation of the actual income effects.
4.3. External Constraints Analysis
The analyses in Section 4.1 and Section 4.2 indicate that while the economic performance of transferred-out households improves significantly, transferred-in households do not experience significant income improvements, and, to some extent, their income even decreases. The results imply that transferred households may actually be exposed to external constraints, in line with hypothesis 1. As such, we will focus on answering two questions in this section: firstly, is it true that transferred-in farmers face higher external constraints; and secondly, what are the external constraints?
To verify whether transferred-in households do face higher constraints, we test their agricultural productivity, because if there are no frictions transferred-in farmers will increase the input of labor and land, leading to higher outputs. If the productivity of transferred-in farmers does not improve significantly, plausibly constraints exist. Following the measurement method of Beveren (2012) [34], we replace the dependent variable with agricultural TFP. TFP results from the Cobb–Douglas production function. Panel A of Table 7 presents the estimation for whether transferred-in farmlands affect agricultural households’ agricultural productivity. The coefficient of Column (1) is negative but not significant, suggesting that agricultural productivity does not improve and may even decline owing to inadequate management capacity. A potential concern with the estimation is that there may be differences in agricultural productivity changes across different terrains (hills, plains, and others). We control for various terrains in Columns (2)–(4), and the results barely change. In Columns (2)–(4), we include interactions between transferred-in farmlands and terrains. The impact of plains is positive, and the impact of hills and other terrains is negative.
The TFP results confirm the higher constraints faced by transferred-in farmers, and we next focus on answering what the constraints refer to. Drawing on the discussions in Guirkinger & Boucher (2008) [35], Chand et al. (2011) [36], and Shita et al. (2019) [37], we argue that the possible constraints are land size, capital size, and technological inputs.
Our first concern is the variations in land size of transferred-in farmers. Looking at Panel B in Table 7, we find that, although the average land of transferred-in farmers is four times larger than non-transfer, but the median land in transferred-in households is less than 15 mu. In addition, surprisingly, there is also a downward trend in land size for transferred-in households. Visibly, majority of the transferred-in farmers’ land size is still low and fails to maximize the scale effect (Foster & Rosenzweig,2010; Thapa & Gaiha, 2011) [38,39].
Secondly, we turn to the availability of funds for farmers, because access to finance is perceived as one of the key elements in helping smallholder farmers to improve productivity (Amha & Peck, 2010; Amha, 2011; Khandker & Koolwal, 2014) [40,41,42]. However, like in many developing countries, Chinese rural households also suffer from financing constraints (Dong and Featherstone, 2006; Yu, 2008; Luo, 2004) [43,44,45]. We construct a credit constraint dummy variable, which takes the value of 1 when the agricultural households’ loan demand is greater than the loan obtained and 0 otherwise. As expected, Column (5) of Panel A in Table 7 indicates that transferred-in households are more likely to suffer from credit constraints. Moreover, according to Ali et al. (2014) [46], credit constraints have a negative impact on agricultural production efficiency. This may be one of the reasons the income of transferred-in households cannot increase significantly.
Finally, we are also interested in the technical improvements of the transferred-in farmers. As expected, technical progress is an important factor affecting agricultural productivity, compared to land and capital size (Olagunju & Salimonu, 2010; Dontsop Nguezet et al., 2011; Adofu et al., 2013; Khatun & Haider, 2016) [47,48,49,50]. We used a question from CHFS and CFD to test the technical constraints of transferred-in farmers. The CHFS included the question, “In what ways did you receive agricultural technical advice?” A total of 1404 households responded to this, of which only 174 households received agricultural technical advice. The proportion of transferred-in households among the total households that responded was 30, of which only 3.85% received agricultural technical advice. This suggests that technological improvements have not accompanied the expansion of agricultural production.
These results show that the transferred-in households are restricted by land size, credit and technological production capacity, so they cannot improve agricultural productivity and economic welfare.
5. Conclusions
After 2009, the Chinese government introduced a large-scale farmland titling program. The removal of institutional friction boosted the scale of the market transfers of farmlands. There has been much discussion in the literature on whether such titling programs can improve agricultural households’ social welfare and even productivity (Chari et al., 2021) [10], with mixed evidence that necessitates further explorations for an answer to this question.
Our study highlights the role of external constraints in the effect of farmland transfer on household income, which is reflected in the differences in economic performances between transferred-in and transferred-out households. Transferred-in households face a dearth of agricultural technology and capital, while transferred-out households place a higher focus on the constraints of off-farm employment.
Employing the longitudinal data of 6994 Chinese rural households from the CHFS and CFD, this study revealed an asymmetric income effect of farmland transfer. Transferred-out farmlands have a significant negative effect on agricultural and management incomes, but a positive effect on property and wage incomes, resulting in an increase in family net income. For transferred-in households, the effects of agricultural and management incomes are significantly positive, but wage income decreases significantly, eventually leading to a negative effect on family net income. The study also provides direct evidence of the asymmetric income effect by analyzing labor reallocation and agricultural productivity. A further analysis indicates that farmland transfer facilitates labor reallocation, but limitations such as credit constraints and technological production capacity do not allow such transfers to improve the agricultural productivity of transferred-in households. Instead, they suffer a decline in family net income, with no benefits from labor reallocation. By contrast, with non-agricultural income being higher than its agricultural counterpart, transferred-out households benefit significantly from labor reallocation.
Thus, the study recommends that the government should strengthen financial support for agriculture and the promotion of agricultural technology to help transferred-in households improve their production efficiency level to ultimately promote income growth. Contrary to the findings of Zhang et al. (2018) [18] and Peng et al. (2020) [8], this study does not find a positive income effect of farmland transfer on transferred-in households. The detailed evidence suggests that transferred-in households face severe external constraints, as well as technical and financial constraints, that worsen their economic performance. This result also suggests potential scope for further farmland reform.
However, this paper still has some limitations: (1) restricted by data availability, we can only use publicly available data from CHFS and CFD for 2013, 2015, and 2017, affecting the external validity of findings; (2) To be acknowledged, our evidence is not strictly causal, as we were unable to find a counterfactual sample when individuals are not participating in land transfer; (3) relevant questions remain to be answered further, such as whether land transfer can deepen the labor division and why transferred-in farmers face higher constraints.
Author Contributions
Conceptualization, L.K. and D.C.; methodology, L.K.; software, L.K.; validation, S.C., Y.L. and D.C.; formal analysis, L.K.; investigation, D.C.; resources, L.K.; data curation, S.C.; writing—original draft preparation, L.K.; writing—review and editing, S.C.; visualization, Y.L.; supervision, D.C.; project administration, D.C. All authors have read and agreed to the published version of the manuscript.
Funding
This research received no external funding.
Data Availability Statement
This research uses data from Chinese Family Database (CFD) of ZheJiang University, and China Household Finance Survey (CHFS) conducted by the Survey and Research Center for China Household Finance at the Southwestern University of Finance and Economics (SWUFE), China.
Conflicts of Interest
The authors declare no conflict of interest.
Appendix A
Figure A1.
Kernel density of transferred-in and non-transfer households.
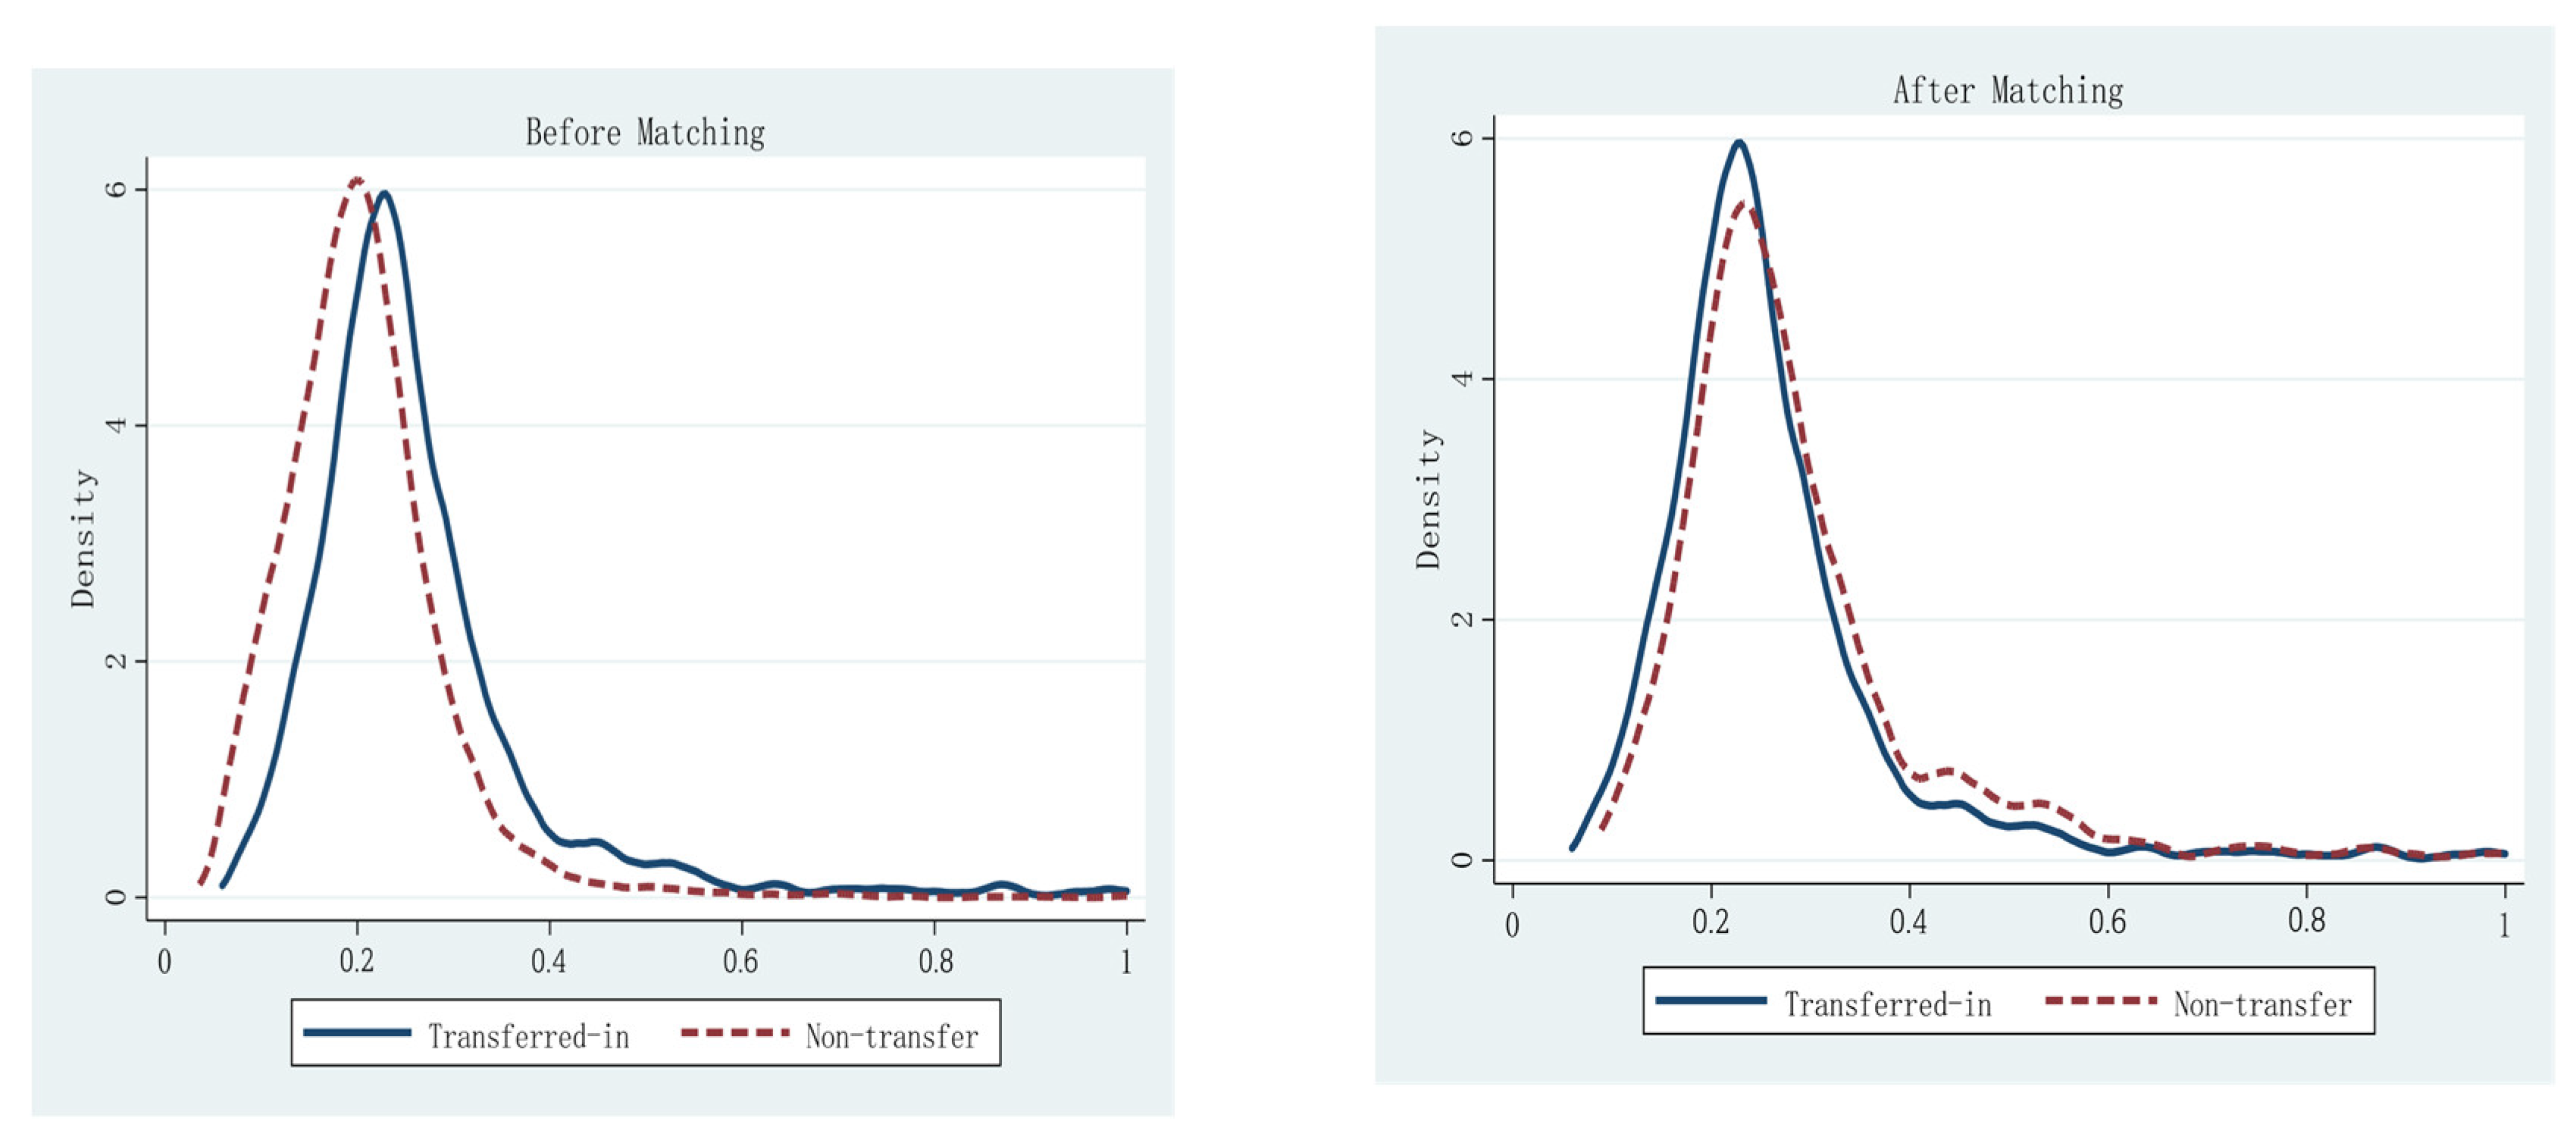
Figure A2.
Kernel density of transferred-out and non-transfer households.
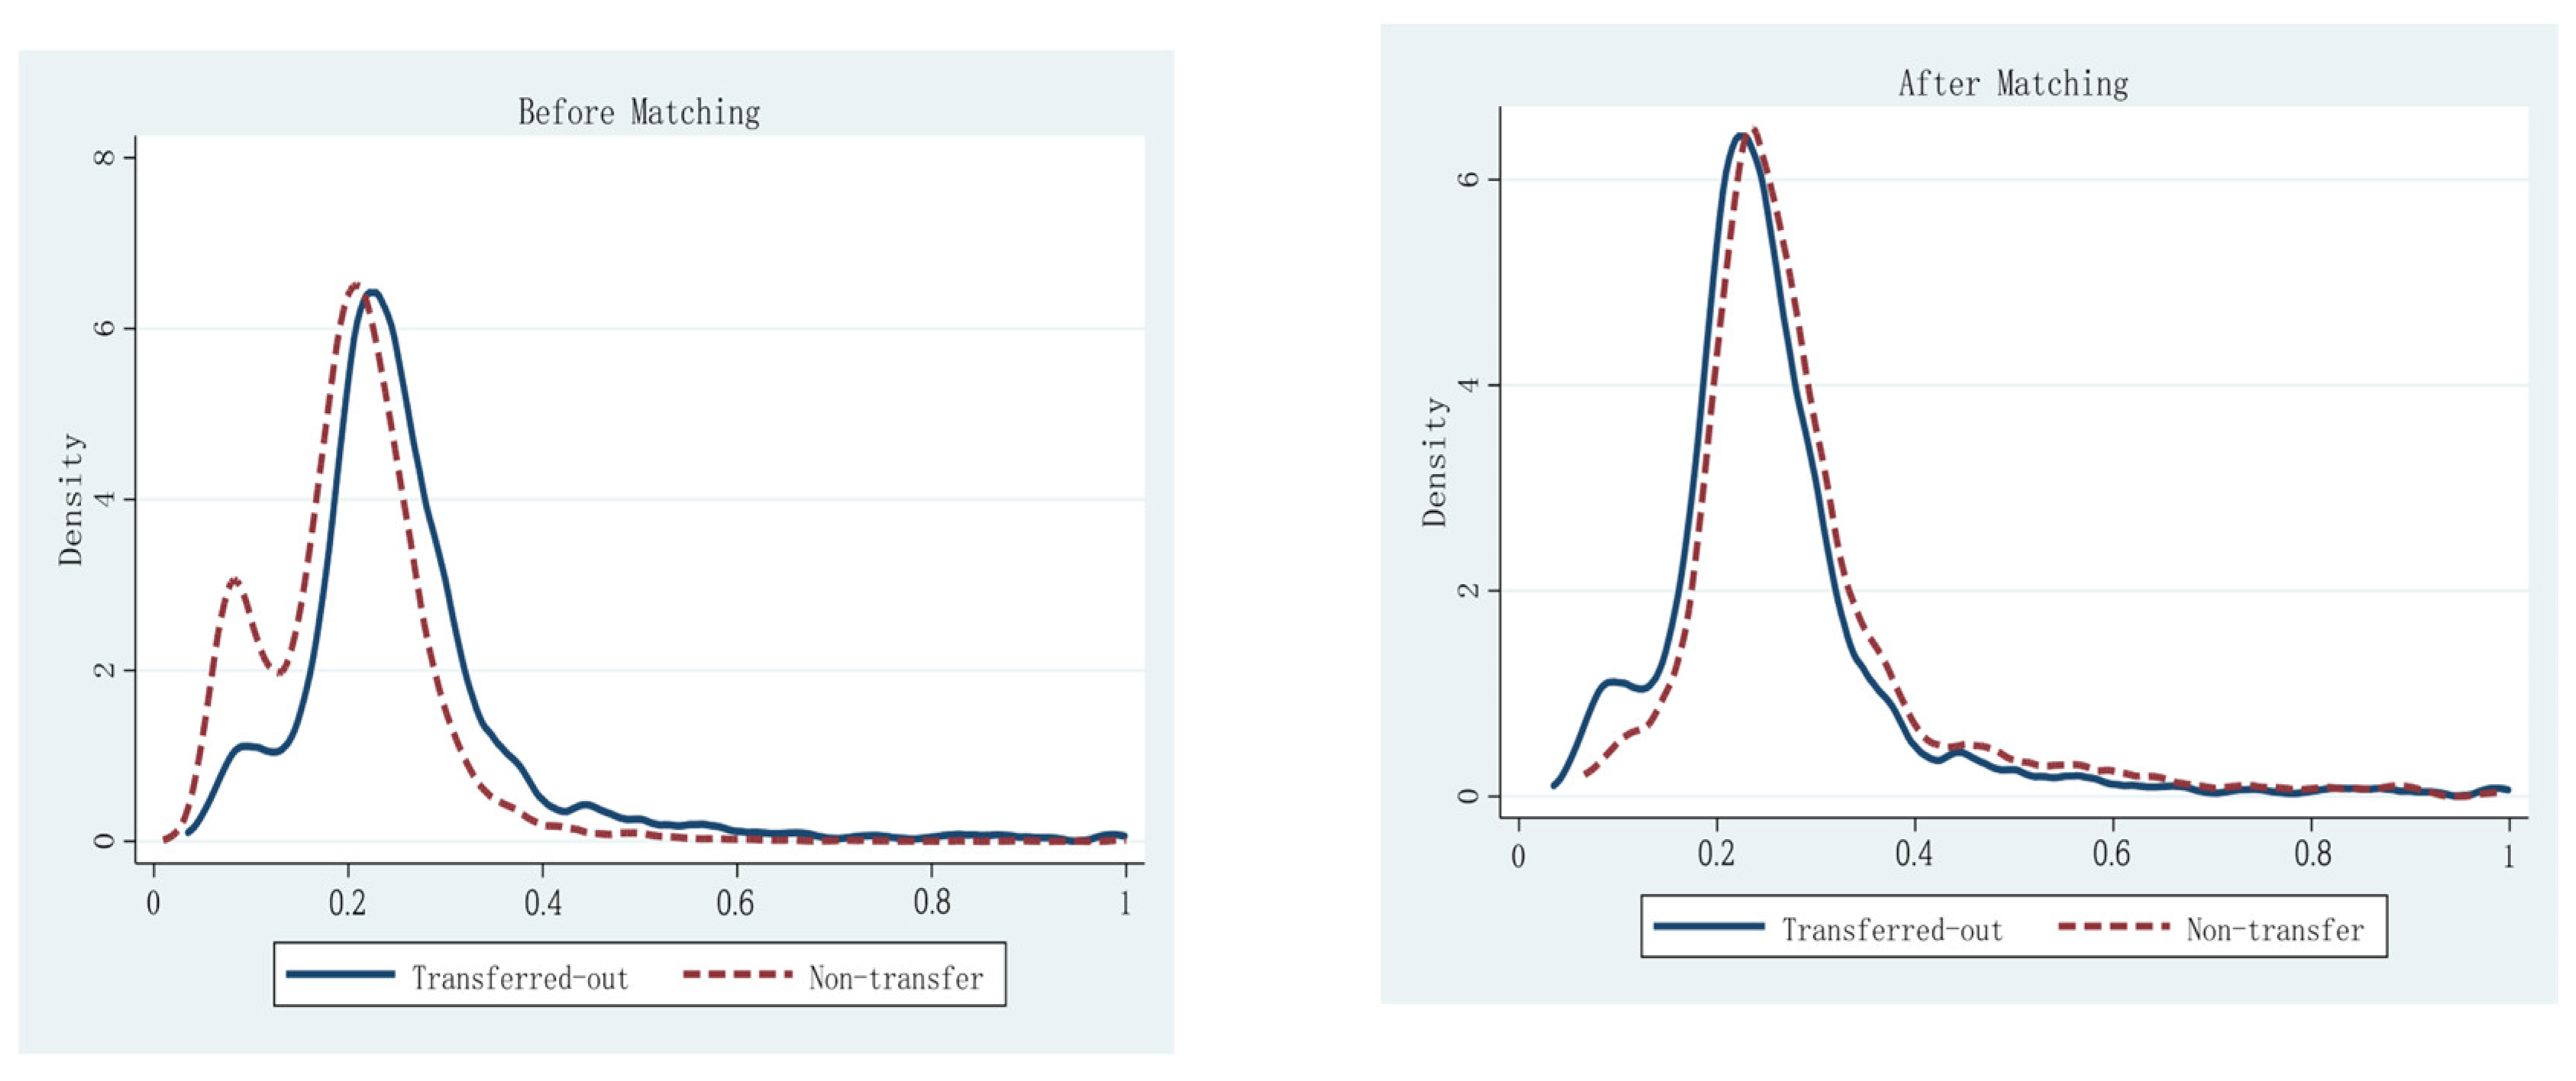
Notes: The figures show the kernel density functions of the treated and control groups, based on the before- and after-matching of the two groups. Clearly, the kernel density functions of the two groups are significantly different before matching. After matching, the kernel density functions of the two groups are quite similar, indicating that the characteristics of the variables in the two groups are similar after matching.

Table A1.
Sample distribution.
| Transferred-Out | Transferred-In | Transfer | ||||
|---|---|---|---|---|---|---|
| Number | Proportion | Number | Proportion | Number | Proportion | |
| 2013 | 520 | 7.69% | 644 | 9.53% | 1164 | 17.22% |
| 2015 | 778 | 11.52% | 779 | 11.53% | 1557 | 23.05% |
| 2017 | 891 | 13.19% | 531 | 7.86% | 1422 | 21.05% |
Notes: The table shows the changes in the number and proportion of various types of rural households. The total number of households is 6756. Some households have both transferred-in and transferred-out farmlands, meaning their management awareness has improved.
Table A2.
Variable definition and summary statistics (N = 6756).
| Variable | Description | Mean | S.D. |
|---|---|---|---|
| Dependent variables | |||
| lnAgriculture | Net income earned by households from agricultural production (CNY) | 4.539 | 5.641 |
| lnManagement | Sum of income from agricultural production and business (CNY) | 5.244 | 5.797 |
| lnProperty | Income earned by households from their own houses, farmlands, and other properties (CNY) | 2.410 | 2.949 |
| lnTransfer | Sum of grain subsidies, machinery-purchase subsidies, and other transfer payments (CNY) | 6.153 | 3.288 |
| lnWage | Net income earned by households working locally or in other locations (CNY) | 5.432 | 5.185 |
| lnFamilyincome | Family net income. Sum of management, transfer, property, and wage incomes (CNY) | 9.197 | 3.786 |
| Independent variables | |||
| Transferred-out | =1 if the household transfers out the farmland; =0 otherwise | 0.108 | 0.311 |
| Transferred-in | =1 if the household transfers in the farmland; =0 otherwise | 0.096 | 0.295 |
| H_Gender | =1 if the household head is male; = 0otherwise | 0.876 | 0.329 |
| H_Age | Age of the household head (years) | 53.849 | 12.629 |
| H_Edu | Years of schooling of the household head (years) | 7.377 | 3.511 |
| Familysize | Number of household members | 3.973 | 1.793 |
| Labor | Number of household labor force | 2.778 | 1.451 |
| Av_Age | Average age of household members (years) | 42.808 | 14.873 |
| Av_Edu | Average years of schooling of the household members (years) | 7.306 | 2.995 |
| Av_Farmland | Area of farmland per household member (mu) | 1.691 | 3.011 |
| lnAsset | Household net asset (CNY) | 11.094 | 4.566 |
| lnPce | Total household consumption (CNY) | 10.068 | 0.883 |
| Additional variables | |||
| H_Migrant | =1 if the household head is a migrant worker; =0 otherwise | 0.349 | 0.477 |
| H_Agriculture | =1 if the household head engages in agricultural production; =0 otherwise | 0.550 | 0.498 |
| H_Entrepreneurship | =1 if the household head starts a business; =0 otherwise | 0.102 | 0.302 |
| F_Migrant | Number of migrant workers in household i | 0.937 | 1.036 |
| F_Agriculture | Number of laborers engaged in agricultural production in household i | 1.327 | 1.165 |
Notes: This table presents the summary statistics from the CHFS data. The table shows various types of household incomes as dependent variables and household head and family characteristics as control variables. To eliminate possible heteroscedasticity, reduce absolute value, and facilitate calculation, both the dependent variables and some control variables are treated with logarithm.
Table A3.
Balance test results of the explanatory variables before and after propensity score matching.
Table A3.
Balance test results of the explanatory variables before and after propensity score matching.
| Unmatched | Transferred-In | Non-Transfer | Bias % |
Transferred-Out | Non-Transfer | Bias % |
|
|---|---|---|---|---|---|---|---|
| Matched | Mean | Mean | |||||
| H_Gender | U | 0.926 | 0.869 | 18.8 | 0.861 | 0.869 | −2.5 |
| M | 0.926 | 0.931 | −1.6 | 0.860 | 0.855 | 1.6 | |
| H_Age | U | 52.034 | 53.759 | −14.5 | 55.319 | 53.759 | 12.0 |
| M | 52.053 | 52.246 | −1.6 | 55.317 | 55.533 | −1.7 | |
| H_Edu | U | 7.222 | 7.381 | −4.7 | 7.670 | 7.381 | 8.1 |
| M | 7.220 | 7.015 | 6.1 | 7.666 | 7.719 | −1.5 | |
| FamilySize | U | 4.290 | 3.985 | 17.3 | 3.694 | 3.985 | −16.3 |
| M | 4.289 | 4.330 | −2.3 | 3.699 | 3.664 | 1.9 | |
| Labor | U | 3.087 | 2.781 | 22.3 | 2.530 | 2.781 | −16.9 |
| M | 3.086 | 3.126 | −2.9 | 2.534 | 2.528 | 0.4 | |
| Av_Age | U | 39.633 | 42.676 | −22.2 | 45.280 | 42.676 | 16.8 |
| M | 39.644 | 39.668 | −0.2 | 45.227 | 45.582 | −2.3 | |
| Av_Edu | U | 7.178 | 7.309 | −4.6 | 7.584 | 7.309 | 9.0 |
| M | 7.176 | 7.048 | 4.4 | 7.587 | 7.679 | −3.0 | |
| Av_Farmland | U | 2.475 | 1.304 | 36.1 | 2.211 | 1.304 | 29.4 |
| M | 2.454 | 2.528 | −2.3 | 2.124 | 1.988 | 4.4 | |
| lnAsset | U | 10.579 | 11.090 | −10.2 | 11.588 | 11.090 | 11.9 |
| M | 10.593 | 10.530 | 1.3 | 11.585 | 11.579 | 0.1 | |
| lnPce | U | 10.105 | 10.058 | 5.5 | 10.108 | 10.058 | 5.6 |
| M | 10.104 | 10.070 | 4.1 | 10.109 | 10.137 | −3.2 | |
Notes: The table shows the changes in the mean deviation of the explanatory variables between the treatment and control groups before and after matching. After the matching is completed, the variable deviation between the processing and control group is reduced.
References
- Ellis, F.; Freeman, H.A. Rural livelihoods and poverty reduction strategies in four African countries. J. Dev. Stud. 2004, 40, 1–30. [Google Scholar] [CrossRef]
- Haggblade, S.; Hazell, P.; Reardon, T. The rural non-farm economy: Prospects for growth and poverty reduction. World Dev. 2010, 38, 1429–1441. [Google Scholar] [CrossRef]
- Ricker-Gilbert, J.; Chamberlin, J.; Kanyamuka, J.; Jumbe, C.B.; Lunduka, R.; Kaiyatsa, S. How do informal farmland rental markets affect smallholders’ well-being? Evidence from a matched tenant–landlord survey in Malawi. Agric. Econ. 2019, 50, 595–613. [Google Scholar] [CrossRef]
- Kijima, Y.; Tabetando, R. Efficiency and equity of rural land markets and the impact on income: Evidence in Kenya and Uganda from 2003 to 2015. Land Use Policy 2020, 91, 104416. [Google Scholar] [CrossRef]
- Zhang, J.; Mishra, A.K.; Zhu, P.; Li, X. Land rental market and agricultural labor productivity in rural China: A mediation analysis. World Dev. 2020, 135, 105089. [Google Scholar] [CrossRef]
- Deininger, K.; Jin, S.; Xia, F.; Huang, J. Moving off the farm: Land institutions to facilitate structural transformation and agricultural productivity growth in China. World Dev. 2014, 59, 505–520. [Google Scholar] [CrossRef]
- Han, W.; Zhang, Z.; Zhang, X.; He, L. Farmland rental participation, agricultural productivity, and household income: Evidence from rural China. Land 2021, 10, 899. [Google Scholar] [CrossRef]
- Peng, K.; Yang, C.; Chen, Y. Land transfer in rural China: Incentives, influencing factors and income effects. Appl. Econ. 2020, 52, 5477–5490. [Google Scholar] [CrossRef]
- Jin, S.; Jayne, T.S. Land rental markets in Kenya: Implications for efficiency, equity, household income, and poverty. Land Econ. 2013, 89, 246–271. [Google Scholar] [CrossRef]
- Chari, A.; Liu, E.M.; Wang, S.Y.; Wang, Y. Property rights, land misallocation, and agricultural efficiency in China. Rev. Econ. Stud. 2021, 88, 1831–1862. [Google Scholar] [CrossRef]
- Chen, C. Untitled land, occupational choice, and agricultural productivity. Am. Econ. J. Macroecon. 2017, 9, 91–121. [Google Scholar] [CrossRef]
- Restuccia, D.; Rogerson, R. The causes and costs of misallocation. J. Econ. Perspect. 2017, 31, 151–174. [Google Scholar] [CrossRef]
- Adamopoulos, T.; Restuccia, D. Land reform and productivity: A quantitative analysis with micro data. Am. Econ. J. Macroecon. 2020, 12, 1–39. [Google Scholar] [CrossRef]
- Adamopoulos, T.; Brandt, L.; Leight, J.; Restuccia, D. Misallocation, selection, and productivity: A quantitative analysis with panel data from China. Econometrica 2022, 90, 1261–1282. [Google Scholar] [CrossRef]
- Gao, X.; Shi, X.; Fang, S. Property rights and misallocation: Evidence from land certification in China. World Dev. 2021, 147, 105632. [Google Scholar] [CrossRef]
- Li, R.; Li, Q.; Lv, X.; Zhu, X. The land rental of Chinese rural households and its welfare effects. China Econ. Rev. 2019, 54, 204–217. [Google Scholar] [CrossRef]
- Nguyen, T.T.; Tran, V.T.; Nguyen, T.T.; Grote, U. Farming efficiency, cropland rental market and income effect: Evidence from panel data for rural Central Vietnam. Eur. Rev. Agric. Econ. 2021, 48, 207–248. [Google Scholar] [CrossRef]
- Zhang, L.; Feng, S.; Heerink, N.; Qu, F.; Kuyvenhoven, A. How do land rental markets affect household income? Evidence from rural Jiangsu, PR China. Land Use Policy 2018, 74, 151–165. [Google Scholar] [CrossRef]
- Geng, N.; Gao, Z.; Sun, C.; Wang, M. How do farmland rental markets affect farmers’ income? Evidence from a matched renting-in and renting-out household survey in Northeast China. PLoS ONE 2021, 16, e0256590. [Google Scholar] [CrossRef]
- Chamberlin, J.; Ricker-Gilbert, J. Participation in rural land rental markets in Sub-Saharan Africa: Who benefits and by how much? Evidence from Malawi and Zambia. Am. J. Agric. Econ. 2016, 98, 1507–1528. [Google Scholar] [CrossRef]
- Chavas, J.P.; Shi, G.; Meng, X. Land rental market and rural household efficiency in China. Environ. Dev. Econ. 2021, 27, 103–119. [Google Scholar] [CrossRef]
- Zhao, X. Land and labor allocation under communal tenure: Theory and evidence from China. J. Dev. Econ. 2020, 147, 102526. [Google Scholar] [CrossRef]
- De Janvry, A.; Emerick, K.; Gonzalez-Navarro, M.; Sadoulet, E. Delinking land rights from land use: Certification and migration in Mexico. Am. Econ. Rev. 2015, 105, 3125–3149. [Google Scholar] [CrossRef]
- Gao, L.; Sun, D.; Ma, C. The impact of farmland transfers on agricultural investment in China: A perspective of transaction cost economics. China World Econ. 2019, 27, 93–109. [Google Scholar] [CrossRef]
- Min, S.; Waibel, H.; Huang, J. Smallholder participation in the land rental market in a mountainous region of Southern China: Impact of population aging, land tenure security and ethnicity. Land Use Policy 2017, 68, 625–637. [Google Scholar] [CrossRef]
- Su, B.; Li, Y.; Li, L.; Wang, Y. How does nonfarm employment stability influence farmers’ farmland transfer decisions? Implications for China’s land use policy. Land Use Policy 2018, 74, 66–72. [Google Scholar] [CrossRef]
- Aguilar-Støen, M.; Taylor, M.; Castellanos, E. Agriculture, land tenure and international migration in rural Guatemala. J. Agrar. Chang. 2016, 16, 123–144. [Google Scholar] [CrossRef]
- Zhang, D.; Wang, W.; Zhou, W.; Zhang, X.; Zuo, J. The effect on poverty alleviation and income increase of rural land consolidation in different models: A China study. Land Use Policy 2020, 99, 104989. [Google Scholar] [CrossRef]
- D’Agostino, R.B., Jr. Propensity score methods for bias reduction in the comparison of a treatment to a non-randomized control group. Stat. Med. 1998, 17, 2265–2281. [Google Scholar] [CrossRef]
- Tabellini, M. Gifts of the immigrants, woes of the natives: Lessons from the age of mass migration. Rev. Econ. Stud. 2020, 87, 454–486. [Google Scholar] [CrossRef]
- Démurger, S.; Xu, H. Return migrants: The rise of new entrepreneurs in rural China. World Dev. 2011, 39, 1847–1861. [Google Scholar] [CrossRef]
- Kung, J.K.S. Off-farm labor markets and the emergence of land rental markets in rural China. J. Comp. Econ. 2002, 30, 395–414. [Google Scholar] [CrossRef]
- Li, J.; Zhang, C.; Mi, Y. Land titling and internal migration: Evidence from China. Land Use Policy 2021, 111, 105763. [Google Scholar] [CrossRef]
- Beveren, I.V. Total factor productivity estimation: A practical review. J. Econ. Surv. 2012, 26, 98–128. [Google Scholar] [CrossRef]
- Guirkinger, C.; Boucher, S.R. Credit constraints and productivity in Peruvian agriculture. Agric. Econ. 2008, 39, 295–308. [Google Scholar] [CrossRef]
- Chand, R.; Prasanna, P.A.L.; Singh, A. Farm size and productivity: Understanding the strengths of smallholders and improving their livelihoods. Econ. Political Wkly. 2011, 46, 5–11. [Google Scholar]
- Shita, A.; Kumar, N.; Singh, S. The impact of technology adoption on agricultural productivity in Ethiopia: ARDL approach. Indian J. Econ. Bus. 2019, 19, 255–262. [Google Scholar]
- Foster, A.D.; Mark, R.R. Is There Surplus Labour in Rural India? Centre Discussion Paper No 991; Economic Growth Centre, Yale University: New Haven, CT, USA, 2010. [Google Scholar]
- Thapa, G.; Gaiha, R. Smallholder farming in Asia and the Pacific: Challenges and opportunities. IFAD Conf. New Dir. Smallhold. Agric. 2011, 24, 25. [Google Scholar]
- Amha, W.; Peck, D. Agricultural Finance in Ethiopia: Diagnostic and Recommendation; A Draft Report Submitted to Bill and Melinda Gates Foundation (BMGF); AEMFI: Addis Ababa, Ethiopia, 2010. [Google Scholar]
- Amha, W. Meeting the financial needs of smallholder farmers in Ethiopia. In African Smallholders. Food Crops, Markets and Policy; CABI: Wallingford, UK, 2011; pp. 156–188. [Google Scholar]
- Khandker, S.R.; Koolwal, G.B. Does Institutional Finance Matter for Agriculture? Evidence Using Panel 131 Data from Uganda[J]. Social Science Electronic Publishing, 2014, 21(6):1145–1150.
- Dong, F.; Featherstone, A.M. Technical and scale efficiencies for chinese rural credit cooperatives: A bootstrapping approach in data envelopment analysis. J. Chin. Econ. Bus. Stud. 2006, 4, 57–75. [Google Scholar] [CrossRef]
- Yu, C. Entrepreneurship and Credit Constraints: Evidence from Rural Households in China[J]. Retrieved July,2008, 26:2013.
- Luo, M. Rural financial services: The supply and demand situation, issues and strategies. Rural Financ. Credit. Infrastruct. China 2004, 354–360. [Google Scholar]
- Ali, D.A.; Deininger, K.; Duponchel, M. Credit Constraints, Agricultural Productivity, and Rural Nonfarm Participation: Evidence from Rwanda; World Bank Policy Research Working Paper 6769; World Bank: Wahington, DC, USA, 2014. [Google Scholar]
- Olagunju, F.I.; Salimonu, K.K. Effect of Adoption Pattern of Fertilizer Technology on Small Scale Farmer’s Productivity in Boluwaduro Local Government. World Rural Obs. 2010, 2, 23–33. [Google Scholar]
- Paul Martin Dontsop, N.; Diagne, A.; Victor Olusegun, O.; Vivian, O. Impact of improved rice technology (NERICA varieties) on income and poverty among rice farming households in Nigeria: A local average treatment effect (LATE) approach. Q. J. Int. Agric. 2011, 50, 267–291. [Google Scholar]
- Adofu, I.; Shaibu, S.O.; Yakubu, S. The economic impact of improved agricultural technology on cassava productivity in Kogi State of Nigeria. Int. J. Food Agric. Econ. (IJFAEC) 2013, 1, 63–74. [Google Scholar]
- Khatun, M.F.; Haider, M.Z. Impact of technology adoption on agricultural productivity. J. Agric. Crops 2016, 2, 87–93. [Google Scholar]
Figure 1.
Comparison of the average annual household income. The figure shows the changing trend of the annual average income of various types of households. The horizontal axis represents time (unit: year), and the vertical axis, income (unit: yuan). IN, OUT, and NON represent transferred-in, transferred-out, and non-transfer households, respectively.
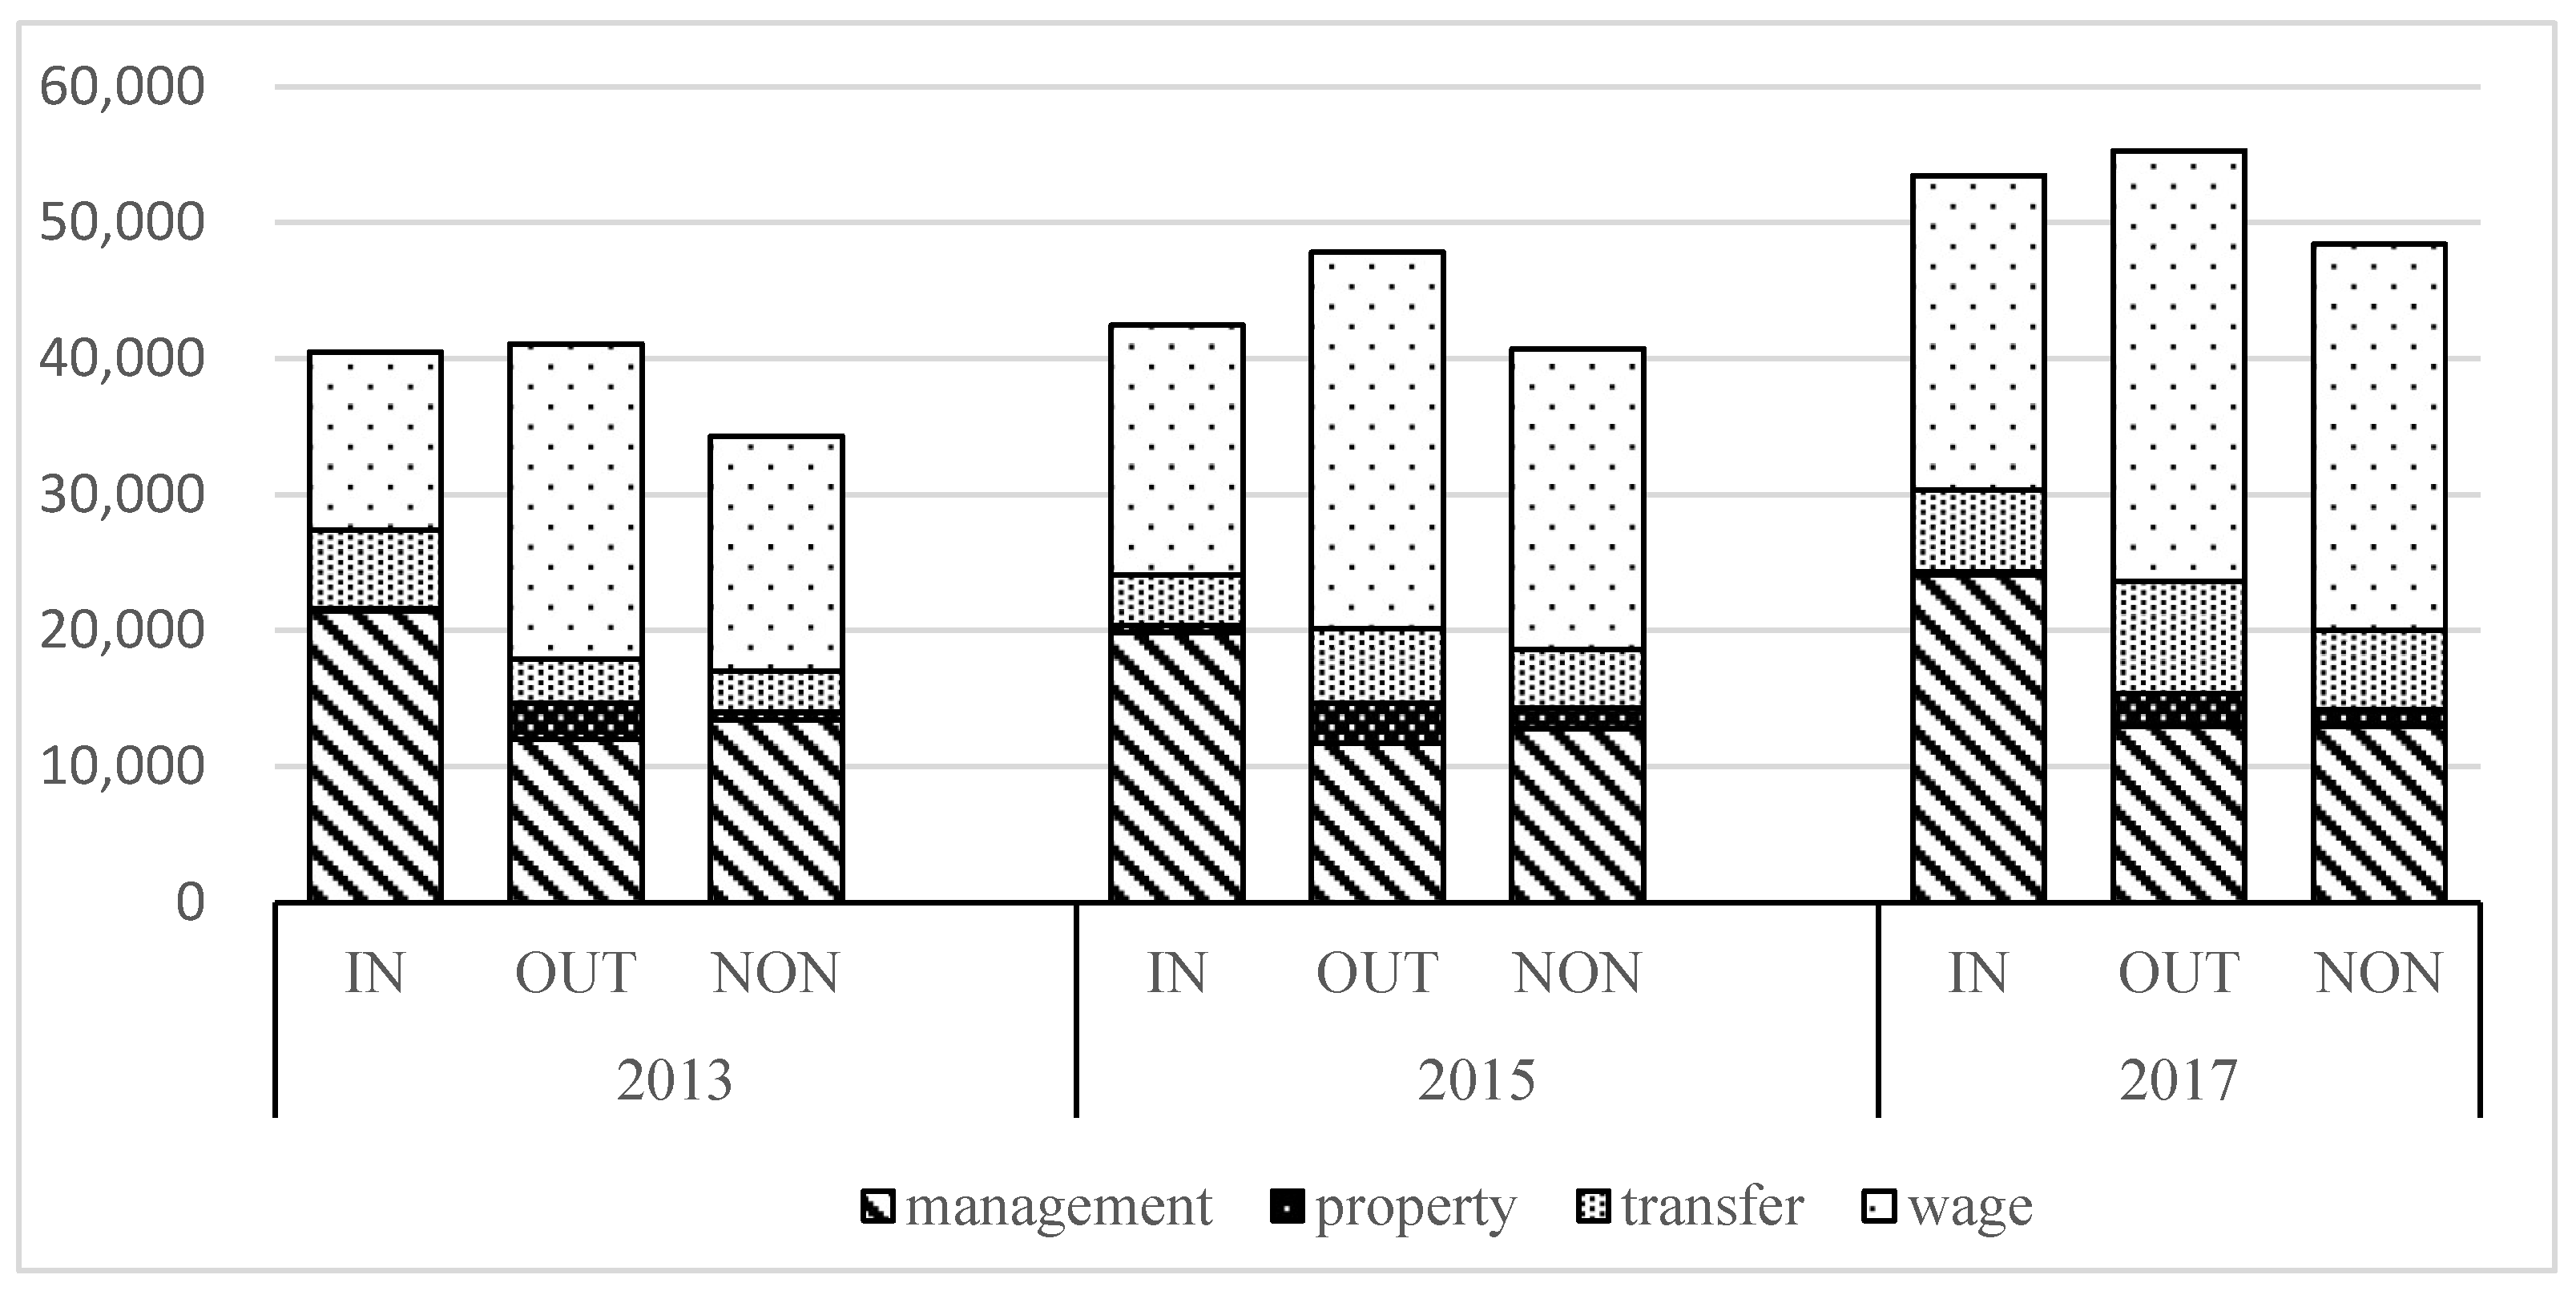
Table 1.
Descriptive statistics and mean differences among three types of households.
| Var | Non-Transfer Households (A) | Transferred-Out Households (B) |
Transferred-In Households (C) |
Differences in Means (A–B) |
Differences in Means (A–C) |
|---|---|---|---|---|---|
| lnAgriculture | 4.4609 | 3.2992 | 6.2698 | 1.1617 *** | −1.8088 *** |
| lnManagement | 5.1452 | 4.4487 | 6.5036 | 0.6966 *** | −1.3584 *** |
| lnProperty | 2.0777 | 3.7362 | 1.8385 | −1.6585 *** | 0.2393 *** |
| lnTransfer | 6.0581 | 6.3157 | 6.2467 | −0.2577 *** | −0.1886 *** |
| lnWage | 5.4827 | 5.8259 | 4.8035 | −0.3432 *** | 0.6793 *** |
| lnFamilyincome | 9.1686 | 9.5648 | 8.8430 | −0.3962 *** | 0.3256 *** |
| H_Gender | 0.8694 | 0.8565 | 0.9217 | 0.0129** | −0.0523 *** |
| H_Age | 53.7594 | 55.4405 | 52.2113 | −1.6811 *** | 1.5481 *** |
| H_Edu | 7.3813 | 7.5340 | 7.1741 | −0.1527 ** | 0.2072 *** |
| Familysize | 3.9848 | 3.6981 | 4.2646 | 0.2868 *** | −0.2798 *** |
| Labor | 2.7813 | 2.5310 | 3.0638 | 0.2503 *** | −0.2825 *** |
| Av_Age | 42.6758 | 45.4622 | 40.0256 | −2.7864 *** | 2.6502 *** |
| Av_Edu | 7.3088 | 7.4486 | 7.1275 | −0.1398 *** | 0.1813 *** |
| Av_Farmland | 1.3041 | 2.0467 | 2.4520 | −0.7426 *** | −1.1478 *** |
| lnAsset | 11.0896 | 11.4745 | 10.6516 | −0.3849 *** | 0.4379 *** |
| lnPce | 10.0582 | 10.0835 | 10.0823 | −0.0253 | −0.0242 |
Notes: The table demonstrates each variable’s mean values and differences for different types of agricultural households. The mean difference is based on non-transfer households. The significant differences in the mean values of most variables may indicate selection bias in farmland transfer decision-making. *** p < 0.01, ** p < 0.05, * p < 0.1.
Table 2.
Effect of transferred-out farmlands on household income.
| (1) | (2) | (3) | (4) | (5) | (6) | |
|---|---|---|---|---|---|---|
| lnAgriculture | lnManagement | lnTransfer | lnProperty | lnWage | lnFamilyincome | |
| Transferred-out | −1.519 *** | −0.990 *** | −0.050 | 2.131 *** | 0.740 *** | 0.409 *** |
| (0.126) | (0.138) | (0.076) | (0.111) | (0.130) | (0.068) | |
| H_Gender | 0.78 *** | 0.822 *** | −0.332 *** | 0.034 | −0.113 | −0.013 |
| (0.110) | (0.145) | (0.091) | (0.089) | (0.115) | (0.097) | |
| H_Age | 0.014 ** | −0.001 | 0.027 *** | −0.006 ** | −0.013 ** | 0.007 * |
| (0.005) | (0.006) | (0.003) | (0.003) | (0.006) | (0.004) | |
| H_Edu | −0.015 | −0.006 | 0.057 *** | 0.047 *** | −0.033 * | 0.021 |
| (0.022) | (0.024) | (0.011) | (0.012) | (0.020) | (0.014) | |
| FamilySize | 0.113 ** | 0.093 * | 0.605 *** | −0.059 ** | 0.034 | 0.111 *** |
| (0.046) | (0.051) | (0.036) | (0.024) | (0.056) | (0.035) | |
| Labor | 0.358 *** | 0.294 *** | −0.538 *** | 0.001 | 0.946 *** | 0.186 *** |
| (0.054) | (0.063) | (0.040) | (0.027) | (0.052) | (0.045) | |
| Av_Age | 0.007 | 0.007 | 0.056 *** | 0.006 ** | −0.051 *** | 0.003 |
| (0.006) | (0.006) | (0.003) | (0.003) | (0.006) | (0.004) | |
| Av_Edu | −0.103 *** | −0.043 | −0.039 ** | 0.092 *** | 0.245 *** | 0.076 *** |
| (0.025) | (0.028) | (0.017) | (0.014) | (0.027) | (0.014) | |
| Av_Farmland | 0.218 *** | 0.156 *** | 0.054 *** | 0.015 | −0.109 *** | −0.016 |
| (0.044) | (0.031) | (0.015) | (0.013) | (0.029) | (0.013) | |
| lnAsset | 0.032 *** | 0.076 *** | 0.009 | 0.097 *** | 0.030 *** | 0.044 *** |
| (0.012) | (0.012) | (0.006) | (0.006) | (0.009) | (0.009) | |
| lnPce | −0.014 | 0.494 *** | 0.321 *** | 0.567 *** | 0.052 | 0.386 *** |
| (0.071) | (0.060) | (0.045) | (0.048) | (0.062) | (0.045) | |
| Year FE | Y | Y | Y | Y | Y | Y |
| Region FE | Y | Y | Y | Y | Y | Y |
| Observations | 14,997 | 14,997 | 14,997 | 14,997 | 14,997 | 14,997 |
| R-squared | 0.172 | 0.129 | 0.18 | 0.267 | 0.288 | 0.101 |
| F-value | 39.77 | 32,87 | 119.36 | 103.28 | 300.85 | 67.87 |
Notes: The table shows the effect of transferred-out farmlands on the various household incomes. The regional effects at the city level are controlled for to control for the impact of different external macro environments. Transferred-in household data are eliminated in this regression. Agricultural income is included in management income. Regional level clustering standard errors are in parentheses. *** p < 0.01, ** p < 0.05, * p < 0.1.
Table 3.
Effect of transferred-in farmlands on household income.
| (1) | (2) | (3) | (4) | (5) | (6) | |
|---|---|---|---|---|---|---|
| lnAgriculture | lnManagement | lnTransfer | lnProperty | lnWage | lnFamilyincome | |
| Transferred-in | 0.956 *** | 0.640 *** | 0.194 *** | 0.047 | −0.897 *** | −0.529 *** |
| (0.153) | (0.150) | (0.068) | (0.065) | (0.126) | (0.102) | |
| H_Gender | 0.797 *** | 0.712 *** | −0.315 *** | −0.018 | −0.004 | 0.015 |
| (0.124) | (0.149) | (0.088) | (0.091) | (0.126) | (0.099) | |
| H_Age | 0.010 * | −0.001 | 0.027 *** | −0.010 *** | −0.008 | 0.010 ** |
| (0.006) | (0.006) | (0.003) | (0.003) | (0.006) | (0.004) | |
| H_Edu | −0.002 | 0.000 | 0.062 *** | 0.029 *** | −0.031 | 0.021 |
| (0.024) | (0.025) | (0.013) | (0.011) | (0.02) | (0.016) | |
| FamilySize | 0.117 ** | 0.103 ** | 0.562 *** | −0.044 ** | 0.000 | 0.087 ** |
| (0.049) | (0.052) | (0.034) | (0.022) | (0.051) | (0.035) | |
| Labor | 0.281 *** | 0.208 *** | −0.466 *** | −0.026 | 1.02 *** | 0.173 *** |
| (0.060) | (0.066) | (0.039) | (0.028) | (0.055) | (0.051) | |
| Av_Age | 0.005 | 0.003 | 0.055 *** | 0.008 *** | −0.043 *** | 0.000 |
| (0.006) | (0.007) | (0.003) | (0.003) | (0.006) | (0.004) | |
| Av_Edu | −0.085 *** | −0.021 | −0.05 *** | 0.106 *** | 0.252 *** | 0.081 *** |
| (0.027) | (0.030) | (0.018) | (0.013) | (0.025) | (0.018) | |
| Av_Farmland | 0.229 *** | 0.179 *** | 0.064 *** | 0.001 | −0.136 *** | −0.017 |
| (0.051) | (0.040) | (0.021) | (0.012) | (0.034) | (0.016) | |
| lnAsset | 0.043 *** | 0.074 *** | 0.011 * | 0.089 *** | 0.038 *** | 0.048 *** |
| (0.012) | (0.012) | (0.006) | (0.005) | (0.009) | (0.010) | |
| lnPce | 0.034 | 0.438 *** | 0.341 *** | 0.588 *** | 0.100 | 0.392 *** |
| (0.076) | (0.066) | (0.048) | (0.052) | (0.065) | (0.053) | |
| Year FE | Y | Y | Y | Y | Y | Y |
| Region FE | Y | Y | Y | Y | Y | Y |
| Observations | 15,093 | 15,093 | 15,093 | 15,093 | 15,093 | 15,093 |
| R-squared | 0.165 | 0.134 | 0.179 | 0.222 | 0.269 | 0.09 |
| F-value | 19.75 | 25.64 | 96.74 | 54.06 | 274.27 | 49.75 |
Notes: The table shows the effect of transferred-in farmlands on the various household incomes. The regional effects at the city level are controlled for to control for the impact of different external macro environments. Transferred-out household data are eliminated in this regression. Agricultural income is included in management income. Regional level clustering standard errors are in parentheses. *** p < 0.01, ** p < 0.05, * p < 0.1.
Table 4.
Event study tests.
| (1) | (2) | (3) | (4) | (5) | (6) | |
|---|---|---|---|---|---|---|
| lnAgriculture | lnManagement | lnTransfer | lnProperty | lnWage | lnFamilyincome | |
| Transferred-in Households | ||||||
| t − 4 | 0.372 | 0.162 | 0.209 | 0.183 | 0.222 | 0.02 |
| (0.312) | (0.307) | (0.183) | (0.177) | (0.339) | (0.215) | |
| t − 2 | ||||||
| t | 0.874 *** | 0.646 *** | 0.263 *** | 0.005 | −0.619 *** | −0.237 * |
| (0.179) | (0.177) | (0.088) | (0.068) | (0.135) | (0.136) | |
| t + 2 | 0.917 *** | 0.586 *** | −0.047 | 0.064 | −0.731 *** | −0.743 *** |
| (0.223) | (0.223) | (0.106) | (0.076) | (0.154) | (0.176) | |
| t + 4 | 0.636 ** | 0.388 | 0.407 *** | 0.149 | −0.856 *** | −0.43 ** |
| (0.261) | (0.261) | (0.11) | (0.103) | (0.207) | (0.168) | |
| Transferred-out Households | ||||||
| t − 4 | −0.314 | −0.053 | −0.071 | 0.154 | 0.557 *** | 0.267 ** |
| (0.202) | (0.207) | (0.143) | (0.126) | (0.216) | (0.113) | |
| t − 2 | ||||||
| t | −1.316 *** | −0.909 *** | 0.041 | 2.679 *** | 0.584 *** | 0.465 *** |
| (0.128) | (0.142) | (0.085) | (0.085) | (0.119) | (0.078) | |
| t + 2 | −1.155 *** | −0.705 *** | −0.037 | 1.341 *** | 0.357 ** | 0.35 *** |
| (0.157) | (0.178) | (0.107) | (0.102) | (0.14) | (0.1) | |
| t + 4 | −1.76 *** | −1.305 *** | −0.052 | 1.026 *** | 0.775 *** | 0.019 |
| (0.209) | (0.233) | (0.135) | (0.149) | (0.188) | (0.129) | |
| Covariates | Y | Y | Y | Y | Y | Y |
| Year FE | Y | Y | Y | Y | Y | Y |
| Region FE | Y | Y | Y | Y | Y | Y |
Notes: Covariates include household head characteristic variables (H_Gender, H_Age, and H_Edu) and household characteristic variables (Family_size, Labor, Av_Age, Av_Edu, Av_Farmland, lnAsset, and lnPce). Time fixed effects and regional fixed effects are controlled in the regression. Regional level clustering standard errors are in parentheses. *** p < 0.01, ** p < 0.05, * p < 0.1.
Table 5.
Re-estimate results for model (14).
| (1) | (2) | (3) | (4) | (5) | (6) | |
|---|---|---|---|---|---|---|
| lnAgriculture | lnManagement | lnTransfer | lnProperty | lnWage | lnFamilyincome | |
| Transferred-out | −1.396 *** | −0.904 *** | −0.109 | 2.243 *** | 0.621 *** | 0.352 *** |
| (0.155) | (0.168) | (0.093) | (0.086) | (0.137) | (0.099) | |
| Transferred-in | 0.683 *** | 0.474 *** | 0.107 | 0.056 | −0.707 *** | −0.543 *** |
| (0.168) | (0.170) | (0.089) | (0.073) | (0.142) | (0.125) | |
| Covariates | Y | Y | Y | Y | Y | Y |
| Year FE | Y | Y | Y | Y | Y | Y |
| Region FE | Y | Y | Y | Y | Y | Y |
Notes: The table shows the regression results using matching sample. Covariates include household head characteristic variables (H_Gender, H_Age, and H_Edu) and household characteristic variables (Family_size, Labor, Av_Age, Av_Edu, Av_Farmland, lnAsset, and lnPce). Time fixed effects and regional fixed effects are controlled in the regression. Regional level clustering standard errors are in parentheses. *** p < 0.01, ** p < 0.05, *** p < 0.1.
Table 6.
Estimation of the instrumental variable model.
| (1) | (2) | (3) | (4) | (5) | (6) | |
|---|---|---|---|---|---|---|
| lnAgriculture | lnManagement | lnTransfer | lnProperty | lnWage | lnFamilyincome | |
| Panel A: Second-Stage Results | ||||||
| Transferred-out | −2.622 *** | −0.796 | −0.664 | 3.538 *** | 1.522 ** | 0.674 * |
| (0.795) | (0.840) | (0.473) | (0.467) | (0.67) | (0.386) | |
| Transferred-in | 4.282 *** | 3.243 *** | 1.026 ** | −761 ** | −2.434 *** | −0.134 |
| (0.997) | (0.941) | (0.439) | (0.377) | (0.698) | (0.54) | |
| Panel B: First-Stage Results | ||||||
| Transferred-out | Transferred-in | |||||
| Percentage | −1.104 *** | −1.499 *** | ||||
| (0.145) | (0.167) | |||||
| K-P F Value | 58.196 | 80.263 | ||||
| Covariates | Y | Y | Y | Y | Y | Y |
| Year FE | Y | Y | Y | Y | Y | Y |
| Region FE | Y | Y | Y | Y | Y | Y |
Notes: The table shows the results of the two-stage regression. Panel A shows the second-stage regression results, and Panel B shows the first-stage regression results. The K-P F Value represents the weak identification test results. The control variables of the second-stage regression are the same as those of the first-stage regression, except for the instrumental variables (percentage). Regional level clustering standard errors are in parentheses. *** p < 0.01, ** p < 0.05, * p < 0.1.
Table 7.
Further analysis of transferred-in households.
| Panel A. Relevant regression results | ||||||
| (1) | (2) | (3) | (4) | (5) | ||
| TFP | TFP | TFP | TFP | Credit Constraints | ||
| Transferred-in | −0.015 | 0.066 *** | ||||
| (0.025) | (0.012) | |||||
|
Transferred-in * hills |
−0.017 | |||||
| (0.040) | ||||||
|
Transferred-in * plains |
0.002 | |||||
| (0.042) | ||||||
|
Transferred-in * others |
−0.065 | |||||
| (0.065) | ||||||
| Covariates | Y | Y | Y | Y | Y | |
| Year FE | Y | Y | Y | Y | Y | |
| Region FE | Y | Y | Y | Y | Y | |
| Panel B. Descriptive statistics of the cultivation scale | ||||||
| Cultivation Scale (Non-transfer) | Cultivation Scale (Transferred-in) | |||||
| Mean | Median | Maximum | Mean | Median | Maximum | |
| 2013 | 7.520 | 5.000 | 315.000 | 29.084 | 14.000 | 580.000 |
| 2015 | 7.609 | 5.000 | 315.000 | 27.543 | 12.000 | 455.000 |
| 2017 | 7.769 | 5.000 | 315.000 | 28.813 | 12.500 | 500.000 |
Notes: The table shows some of the reasons the income of households with transferred-in farmlands cannot increase. Panel A shows the relevant regression results. Column (1) shows the overall impact of transferred-in farmlands on agricultural productivity, and Columns (2), (3), and (4) show the impact in hills, plains, and other areas, respectively. Column (5) shows the impact of transferred-in farmlands on agricultural production efficiency and credit constraints. The control variables are consistent with those in the above regressions. Panel B presents the descriptive statistics of the cultivation scale. The units of the mean, median, and maximum values are mu. Regional level clustering errors are in parenthesisparentheses. *** p < 0.01.
Disclaimer/Publisher’s Note: The statements, opinions and data contained in all publications are solely those of the individual author(s) and contributor(s) and not of MDPI and/or the editor(s). MDPI and/or the editor(s) disclaim responsibility for any injury to people or property resulting from any ideas, methods, instructions or products referred to in the content. |
© 2023 by the authors. Licensee MDPI, Basel, Switzerland. This article is an open access article distributed under the terms and conditions of the Creative Commons Attribution (CC BY) license (https://creativecommons.org/licenses/by/4.0/).
Copyright: This open access article is published under a Creative Commons CC BY 4.0 license, which permit the free download, distribution, and reuse, provided that the author and preprint are cited in any reuse.


