Submitted:
19 April 2023
Posted:
21 April 2023
You are already at the latest version
Abstract
Air pollution is a leading cause of death worldwide, and has a profound impact on the planet's climate and ecosystems. A substantial portion of air pollution is attributable to Ocean Going Vessels (OGVs). In light of this, international regulations have been put in place to mitigate air pollutant emissions from OGVs. While studies have indicated that these regulations can create significant health, environmental, and economic benefits, there remains a research gap regarding their specific impact on enhancing air quality. The aim of this study is to investigate how the implemented regulations have affected air quality in the Southern North Sea. The study found that the international regulations on ship emissions have successfully led to a decline in SO2 emissions from OGVs in the Southern North Sea, which resulted in a reduction of ambient SO2 concentrations inland, leading to positive effects on public health and the environment. However, it was projected that their proportion is tend to increase in the following years. Moreover, the study revealed that Exhaust Gas Cleaning Systems (EGCS) present significant concerns. They were significantly more frequently found to be non-compliant, and more alarmingly, they emit notably higher average levels of SO2. It also turned out that international regulations in the southern North Sea have less effect on the reduction of NOx emissions from OGVs than expected. The NOx emissions from OGVs will even account for an alarming 40% of the total domestic NOx emissions for the Belgian Region by 2030.
Keywords:
MARPOL Annex VI
; emissions from ocean going vessels
; remote emission monitoring
; sulfur dioxide
; nitrogen oxides
; ECA
; air quality measurements.
Highlights
- ▸
- Remote monitoring for MARPOL Annex VI in Belgium.
- ▸
- Effect of emission regulations from ocean going vessels.
- ▸
- Impact from emissions from ocean going vessels on inland pollution.
- ▸
- Trends of SO2 and NOx emissions from ocean going vessels.
- ▸
- Emissions from ships equipped with Exhaust Gas Cleaning Systems
1. Introduction
99% of the world’s population is exposed to air containing high levels of pollutants that exceed the limits of the World Health Organization (WHO) guidelines [1]. The negative health effects of air pollution are well documented, with an estimated 9 million annual deaths worldwide attributed to exposure to ambient air pollution [2]. Despite significant reductions in emissions for many air pollutants over the past two decades, concentrations of air pollutants in the European Union remain too high. In 2020, the European Environment Agency (EEA) reported that 96% of city residents were exposed to harmful concentrations of particulate matter (PM) [3]. For the Belgian region of Flanders it was estimated that PM is responsible for 300-600 premature deaths per year [4]. Not only PM is a reason for concern, despite a decrease of more than 50% in NOx emissions in the EU since 1990, several European countries still record values exceeding the annual EU limits and all 35 EU member states (MS) record values exceeding WHO guidelines for NOx [3,5].
Ocean Going Vessels (OGVs) emit a range of air pollutants such as SOx, NOx, and PM [6,7,8,9], contributing to 10-15% of global anthropogenic SO2 emissions and 15-20% of NOx emission [10,11]. At the EU level, OGVs are estimated to be responsible for 24% of SO2 and NOx emissions [12]. These emissions have severe health and environmental impacts [13,14,15,16,17]. While land-based sources of air pollution have been regulated for years thus leading to a reduction in their contribution to air pollution [5,18], shipping has long been excluded from regulation. As a result, in 2008, regulations were introduced under the Marine Pollution Convention (MARPOL) of the International Maritime Organization (IMO) to decrease emissions from OGVs, in particular SOx and NOx [19,20]. In addition, MARPOL Annex VI introduced Emission Control Areas (ECAs) with stricter emission limits. [21,22,23,24,25].
As part of MARPOL Annex VI, Regulation 14 sets limits on SOx emissions from OGVs. In 2008, the North Sea and Baltic Sea were declared as Sulfur Emission Control Areas (SECAs) [20,24,25] (Figure S.1A). In the SECA OGVs are required to use compliant fuels or use an exhaust gas cleaning system (EGCS) [26,27,28,29]. Outside the SECA, sulfur limits have been tightened in 2020 by the so-called “Global Sulfur Cap” [30] [30] (Figure S1B) and “Carriage Ban” [31]. SOx emission regulations have been implemented in both EU and Belgian legislation [32,33,34,35]. The EU SOx directive led to the implementation of mandatory inspection numbers and the creation of Thetis EU – the port inspection database managed by the European Maritime Safety Agency (EMSA) for the exchange of inspection and monitoring results [36].
Regulation 13 of MARPOL Annex VI introduces the NOx emission limits [24,37,38]. In 2021 a NOx Emission Control Area (NECAs) came into force in the North Sea and Baltic Sea [20,22] (Figure S1A). The NOx emission limits are expressed as the weighted amount of NOx emission (g) per Brake Horse Power (BHP) on the crankshaft (kWh). Based on the Keel Laying Date (KLD), the merchant fleet is divided in 4 tiers. The emission limit per tier is furthermore based on the Engine Rated Speed (ERS or n). Certification is done before and after installation of the engines on board, based on test procedures described in the NOx Technical Code [39]. These procedures are based on a weighted averages of 5 different test cycles with 4 to 5 engine loads and corresponding weighting factors (Table S1) [39,40].
2. Methods
2.1. Belgian Coastguard Aircraft and Sniffer Sensor
The research was executed in the Southern North Sea, an area renowned for its high maritime traffic density [43,44]. The Scientific Service of the Management Unit of the Mathematical Models of the North Sea (MUMM) of the Royal Belgian Institute of Natural Sciences (RBINS) is one of the 17 Belgian coastguard partners [45]. MUMM is assigned with the monitoring and enforcement of MARPOL regulations in the Belgian North Sea area and neighboring waters, in the so-called Bonn Agreement (BA) Quadripartite Zone of Joint Responsibility (BAQPZJR) [45]. The Belgian coastguard aircraft, owned by RBINS, was used for this study. The aircraft is a Britten Norman Islander (BN2) equipped with modern avionics and a remote sensing system from Optimare (Bremerhaven, Germany). In 2015 the aircraft was equipped with a sniffer sensor system, developed by Chalmers University and built by FluxSense (Gothenburg, Sweden) [46].
2.1.1. Sniffer Sensor
The sniffer sensor consists of a set of different sensors and equipment mounted in a 19” housing (Figure S.2). The most important units are (i) a Thermo Trace Level Ultraviolet fluorescence sensor, used for the measurement of SO2 in ppb (unitless); (ii) a Bioscience Licor Nondispersive Infrared NDIR sensor, used for the measurement of CO2 in ppm (unitless); (iii) an Ecotech Serinus 40 chemiluminescence sensor for the measurement of NOx; (iv) a custom designed hydrocarbon kicker; (v) three powerful vacuum pumps (one for the SO2 and CO2 sensor, one for the hydrocarbon kicker and one for the NOx sensor; (vi) pressure and flow regulators; (vii) a log computer; (viii) a combined Automatic Identification System (AIS) and Global Positioning System (GPS) receiver; (ix) an Aeronautical Radio INC. (ARINC) module and; (x) a particle filter (1 µm) installed at the air-inlet of the sniffer sensor and on the other side connected to a stainless-steel sampling tube (3/8”) installed on the bottom of the aircraft [47].
2.1.2. FSC Measurements
The FSC can be calculated based on the ambient and the exhaust plume’s SO2 and CO2 [47,48,49,50,51,52,53,54,55]. To retrieve the amount of kg burned fuel, the amount of C was multiplied with the carbon fuel content of 87% [49,51].
When the NOx sensor was installed in 2020, this formula was modified to correct for the NO cross sensitivity of the SO2 sensor and was adapted by subtracting the measured SO2 with the NO amount in the plume, multiplied by the cross sensitivity factor (CSNO).
The general modus of the NOx sensor during surveillance operations was set to NOx. To estimate the NO concentration from the measured NOx concentrations a default NO/NOx In Stack Ratio (ISR) of 80% was used [47] [55].
Nevertheless, the NO/NOx ratio is however highly variable [56,57]. Therefore by default the NOx mode was used, in case the initial FSC exceeded the operational threshold (Tops), the sensor was set to NO mode and two new measurements were made.
The FSC measurement was found to have a negative bias that consisted of an absolute component or offset (b) and a relative component or slope (a) [50]. To determine these factors three special gas mixtures, containing SO2 and CO2 in different levels were used to imitate exhaust plume of different FSC levels (Figure 1).
2.1.3. NOx Measurements
The NOx emission factor (EFNOx) in g NOx/kg fuel are calculated similarly to the FSC using the background and plume NOx and CO2 concentrations [51,53,56,58].
For the calculation of the NOx emission in g NOx/kWh, the NOx emission factor (g NOx/kg fuel) are then multiplied by the Specific Fuel Consumption (SFC).
Typically, the SFC ranges from 0.16 kg/kWh to 0.24 kg/kWh [11,48,59,60,61,62,63,64,65,66,67]. An average SFC of 0.2 kg/kWh is used by default. If the TOPS is exceeded, radiocommunication with the OGV is established to obtain the fuel consumption and power data to improve the accuracy of the EF measurement.
2.1.4. Measurement Quality, Uncertainty and Reporting Thresholds
Only high quality measurements were retained, based on following requirements: (i) unquestionable linking of the plume to the OGV; (ii) comparable response times of the SO2, NOx and CO2 gas sensors; (iii) sufficient plume sampling time; (iv) high Signal to Noise Ratio (SNR); and (v) absence of interference from other sources [50]. In addition a Sniffer Quality Management System (SQMS) was composed describing the Standard Operational Procedures (SOPs) for the execution of the flights, the maintenance of the system and the management of the data [47,50,56].
The uncertainty for the FSC measurements was assessed based on three levels of FSC [50]. Improvements were made in the SO2 measurement uncertainty from 2020 onwards, the NO cross-sensitivity of the SO2 sensor was eliminated. Furthermore, a custom-designed Hydrocarbon kicker was introduced to remove the VOCs from the airflow and the measurement bias was eliminated [47]. The uncertainty of the NOx measurement was calculated based on three levels of NOx per tier level for both OGVs with an ERS < 130 rpm and for OGVs with an ERS > 500 rpm (Table S.3) [56].
Uncertainties were than used for establishing operation threshold levels (Tops) for reporting non-compliant OGVs. Three colors were assigned as flags to categorize the alert level. The yellow flag indicates the lowest alert level with a confidence interval (CI) of 68% (σ = 1). The orange flag has a higher alert level with a CI of 95% (σ = 1.96). The red color flag is reserved for the most severe pollution alerts and are based on a 99% CI (σ = 2.576) (Table 1). If a first measurement suggested possible non-compliance, a second measurement was taken, except in cases where it was not feasible for operational reasons [47,50,51].
2.2. Thetis-EU
The EU Sulphur Directive led to the creation of Thetis-EU, an online database utilized for exchanging inspection results. The European Maritime Safety Agency (EMSA) manages and hosts the database. Thetis-EU is accessible to inspectors across all EU MS, including Norway and Iceland. However, due to Brexit, the UK no longer has access to the database [35,68].
2.2.1. Keel Laying Date
Information on the keel laying date (KLD) is crucial for determining the tier level in assessing NOx compliance. This KLD data was acquired based on merging two database sources: 1) the Global Integrated Shipping Information System (GISIS) of the International Maritime Organization (IMO) and; 2) Thetis-EU of the European Maritime Safety Agency (EMSA). The GISIS database was used to gather information on OGVs larger than 75 meters with built year and IMO number, while EMSA provided the accurate KLD and MMSI information [56].
2.2.2. EGCS Data
Thetis-EU also includes information on EGCS, which was obtained from EMSA after a formal request from the Belgian National Competent Authority (NCA). The data is however based on the port inspections executed by the EU MS and is therefore non-exhaustive: there were several instances where OGVs have been observed to be equipped with EGCS that were not documented in the EMSA data [47,69].
2.3. Inland Air Quality Measurement Data
2.3.1. Inland Coastal Data and Non-Coastal Data
Air quality data from 41 inland measurement stations managed by the Flemish Environmental Agency (VMM) was collected to assess the impact of OGVS emissions on inland air quality [70]. The stations were classified into two categories: 1) coastal or port stations and 2) non-coastal or non-port stations. Data was collected for the period of 2008-2022. The difference between the two categories stands in proportion to the air pollution contribution from the maritime transport sector. However, it should be noted that this difference also includes a significant contribution from industry and energy sources, as these facilities are largely located in port areas, this may particularly impact SO2.
2.3.2. Trend Analysis by Emission Source
To conduct a trend analysis by emission source, data from VMM was used [70]. This data consists of emissions data categorized by source for the period spanning from 2000 to 2020. Moreover, a short-term linear regression trend was created for each SO2 and NOx source based on the data from recent years with omitting 2020 as this was impacted by the COVID global pandemic. For most sources, the period used for the linear regression was either 2010-2019 or 2015-2019. Regarding shipping, the forward trends for SO2 and NOx were established by combining: 1) the trend of the difference between coastal and non-coastal stations between 2016 and 2022 (slope = a, intercept = b) with 2) and the projected increase in shipping (2.1% annually) [71]. For the SO2 trend, an additional correction factor for the FSC non-compliance (c) was added, this was based on the correlation between the increase in SO2 emissions from shipping and FSC non-compliance. This factor ranged between 1.06 and 1.08 for 2021 and 2022.
2.4. Statistical Analysis
The normality of the emission measurement data was evaluated using a Kolmogorov-Smirnov test, which showed that the data did not follow a normal distribution (P < 0.05). Consequently, non-parametric tests were utilized. A two-tailed Kolmogorov-Smirnov test was used to compare the distributions of measurements obtained between different groups (temporal periods, Tier levels, EGCS, …), statistical significance was determined at P < 0.05. To assess the difference in compliance rates between the two distributions, a two-sided chi-square test was used, with statistical significance defined as P < 0.05 [72,73]. When discussing Type I errors, they refer to false positives, while Type II errors refer to false negatives.
3. Results and Discussion
From 2015 onwards, the Royal Belgian Institute of Natural Sciences (RBINS) has been conducting airborne surveillance operations for the monitoring of Regulation 14 of MARPOL Annex VI concerning sulphur emissions from OGVs[47,50,74]. The RBINS expanded its monitoring efforts in 2020 to include Regulation 13 of MARPOL [47,56]. The collected dataset contains 6954 FSC measurements and 2353 NOx measurements and therefore comprises the largest set of airborne OGV emission measurements to date.
3.1.1. Belgian Airborne Monitoring Dataset
During the monitoring period from July 2015 to November 2022, the RBINS conducted 414 flights and 645 operational flight hours, making approximately 10446 low passes in the exhaust plumes of 7536 OGVs, measuring 6954 OGVs’ FSC and 2353 OGVs' NOx emission [47,50,56,74]
The predominant type of measured OGVs were container OGVs (31%), followed by tanker OGVs (29%), general cargo and bulk carrier OGVs (20%) and passenger and Roll On Roll Off (RORO) OGVs (15%;). Regarding NOx monitoring, the majority of monitored OGVs were Tier I OGVs (52.6%); followed by Tier II OGVs (37.5%); Tier 0 OGVs (9.6%) and Tier III OGVs (0.3%).
The standard operating procedures (SOPs) specified a minimum ship length of 100 m, although smaller OGVs were occasionally included. The average length of the monitored OGVs was 214 m (Figure S.4) and only OGVs that were on-route were measured, with an average speed of 12.7 knots (Figure S.5). The majority of the monitored OGVs had a port of destination in Belgium (30%), Netherlands (24%), the UK (10%), and Germany (7%), with the main ports of Antwerp (22%), Rotterdam (17%), and Zeebrugge (5%) (Figure S.6). The most frequently observed flag states were Liberia (11%), Panama (13%), and Marshal Island (10%) (Figure S.7), which corresponds to the global fleet distribution [75].
For the data collected between 2015 and 2019, no correction for the NO cross sensitivity was to be made. Therefore the data between 2015 and 2019 was corrected to allow for a long-term analysis together with to the measurement results from 2020. For this purpose, the FSC values without NO correction (FSC) and the FSC values with NO correction (FSC) for the period 2020-2022 were used to conduct a linear regression (Figure 2). The regression values (a = 0.93; b = 0.02. and r = 0.98) were consequently used to correct the 2015-2019 FSC measurement data (Figure 2).
3.1.2. Average FSC and Compliance Trends
The improved measurement quality and reduced measurement uncertainty in 2020 allowed for more accurate measurements of the FSC [47]. To enable long-term trend analysis, the measurements for the 2015-2019 period were first corrected for their systematic bias. Based on the corrected FSC data, it was found that throughout the monitoring period 2015-2022, the average FSC of the measured OGVs remained relatively consistent (Figure 3A). However when examining temporal trends, it was discovered that the average FSC significantly decreased from 0.083% to 0.068% after the implementation of the Global Cap in 2020 (P < 0.01). The improved accuracy in 2020 reduced the OGV compliance threshold from 0.15% FSC to 0.13% FSC. Therefore, the FSC measurements from 2015 to 2019 were re-categorized according to the 2020 thresholds. While these thresholds are not suitable for individual OGV compliance re-assessments for 2015-2019, they can be used for long-term compliance analysis. The overall compliance rate spanning from 2015 to 2022 was 92.8%, increasing from 83.3% in 2015 to over 95.1% in 2019 (Figure 3B). After the introduction of the Global Cap in 2020, compliance rates continued to rise, reaching a maximum of 98.0% in 2021, but then decreased to 95.1% in 2022. Comparing the non-compliance rates of 2018-2019 (6.1%) with 2020-2022 (3.1%) showed a significant decrease (P < 0.001), indicating the effectiveness of the Global Cap. Non-compliance rates per flag state (OGV’s nationality) were proportionate to the number of observations per flag state, although in contrary to what was expected it was found that flag states like BE, UK, and HK had higher non-compliance rates than the “flags of convenience”, i.e. flags of convenience are countries with favorable regulations and lower taxes, allowing OGV owners to avoid stricter regulations and labor standards in their home countries (Figure S.7).
During the monitoring period from 2015 to 2022, there was a significant increase in the number of OGVs equipped with Exhaust Gas Cleaning Systems (EGCS). At the start of the monitoring in 2015, less than 1% of OGVs had an EGCS. However, as a result of the implementation of the Global Cap, by the end of 2022, approximately 30% of the global fleet was equipped with an EGCS [76]. The effect of this trend was examined by comparing the average FSC and non-compliance rates for EGCS and non-EGCS OGVs. It was found that EGCS OGVs had significantly higher FSC levels (0.097% FSC) compared to non-EGCS OGVs (0.076% FSC) (P < 0.001). Also the non-compliance rate was found to be significantly higher for EGCS OGVS (9.4%) compared to non-EGCS OGVs (6.9%) (P = 0.0302). Furthermore, the analysis revealed both a very high relative contribution and very high absolute emission values for non-compliant EGCS OGVs. In the period 2015-2019, 11 out of 102 red flags were related to EGCS OGVs (11%), whereas from 2020 onward, out of the 20 observed red flags, 16 were related to EGCS OGVs (80%). This indicates that EGCS OGVs not only result in higher amounts of non-compliance, but of equal concern was that they were found to emit substantially higher levels of SO2 once identified as non-compliant. This trend can be attributed to certain international regulations, with MARPOL Annex VI Regulation 13 that allowed the use of EGCS systems in the first place. The introduction of the Global Cap, resulted subsequently in more EGCS OGVs operating outside ECAs. While the average FSC and non-compliance decreased with the introduction of the Global Cap, it also lead to a wider use of EGCS OGVs and which, based on this analyses, resulted in higher SO2 emissions and non-compliance rates. It should be noted that this adverse effect on air quality is in addition to other environmental concerns arising from the discharge of washwater from EGCS [28,77,78,79].
3.1.3. Real World NOx Emissions and Compliance Trends
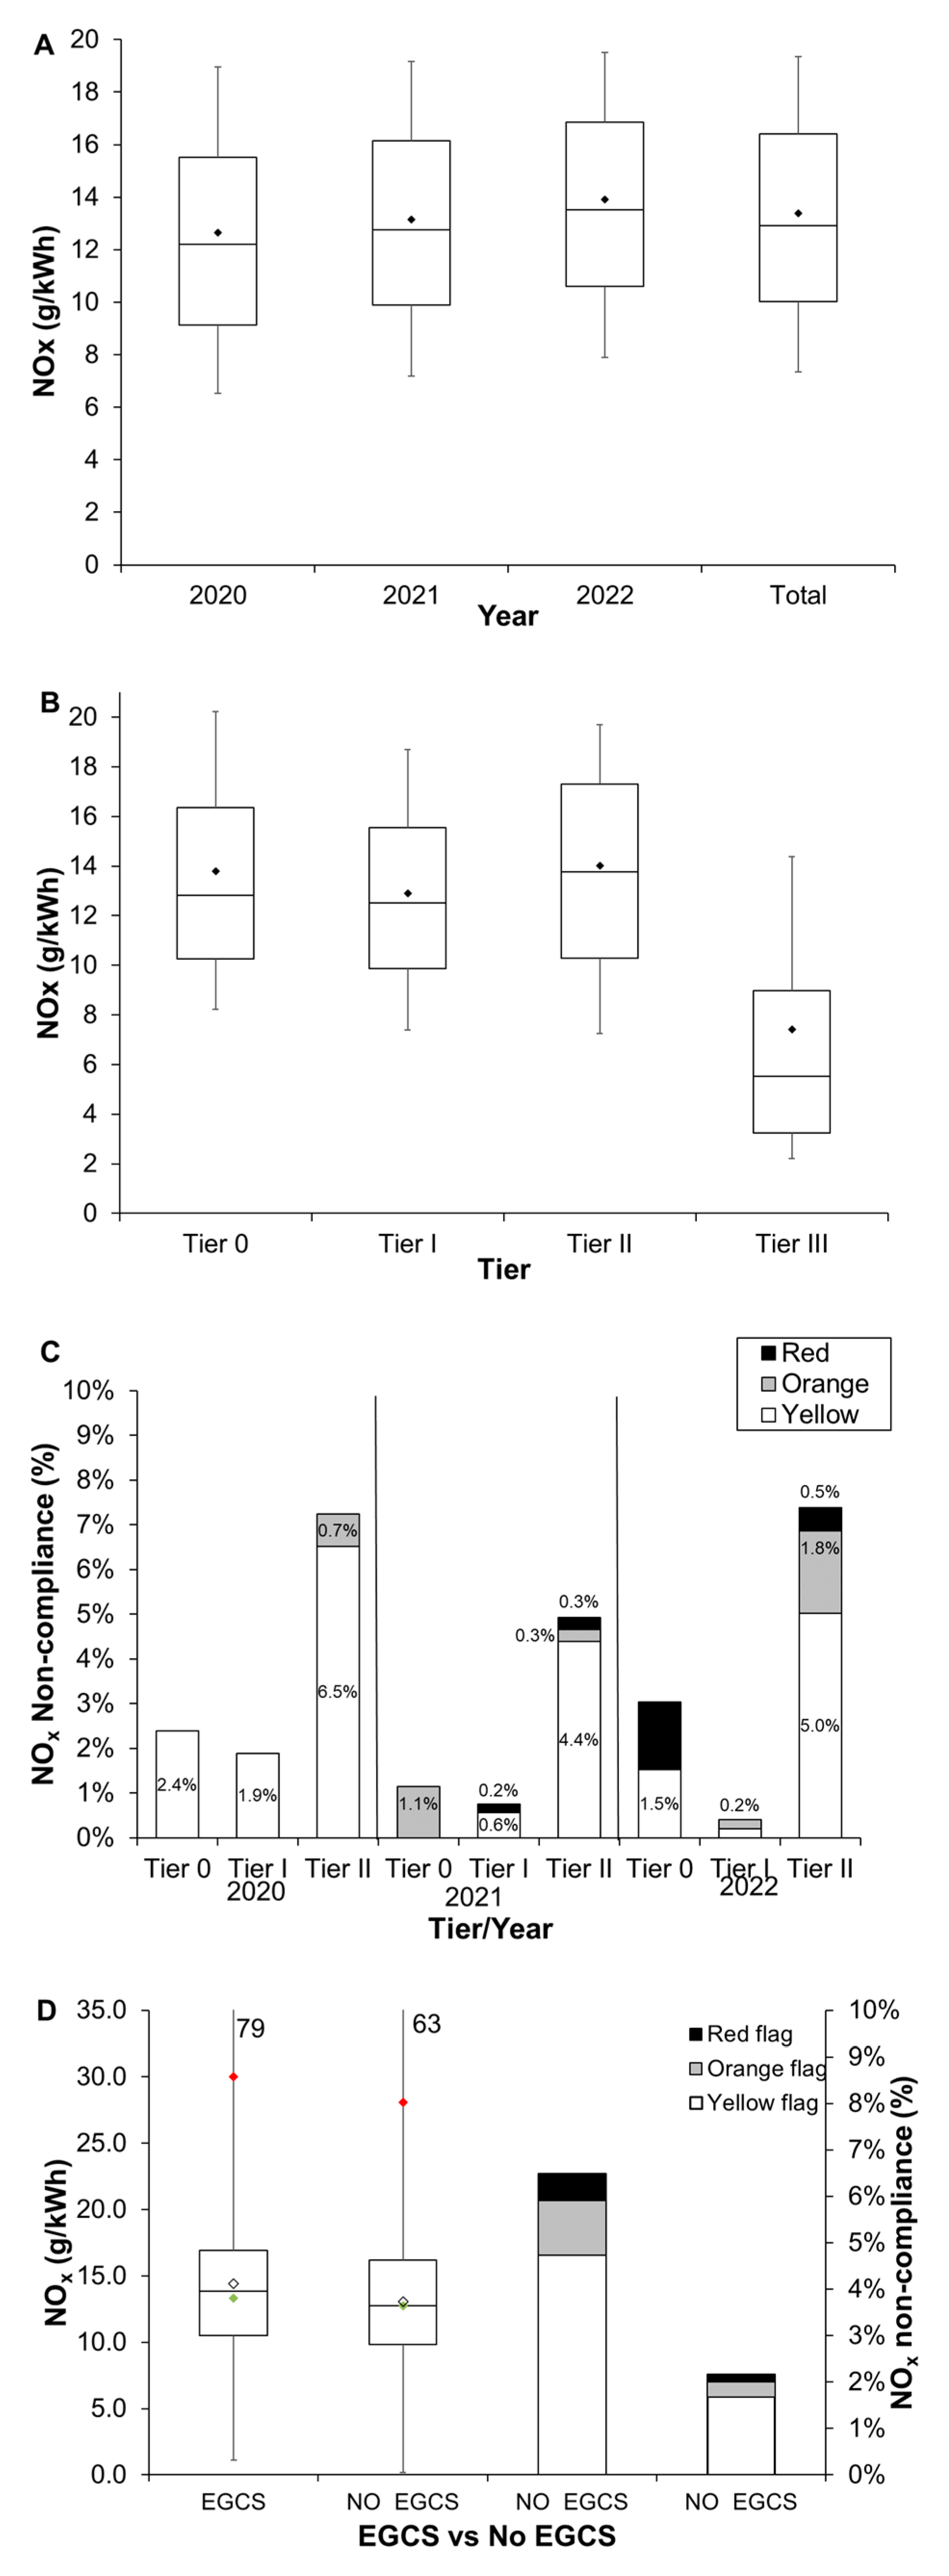
The airborne monitoring of NOx emissions from OGVs began a year before the implementation of the NECA in 2021, this allowed to assess the impact of the new regulations on real-world NOx emissions and compliance to regulation 13 of MARPOL Annex VI. It was found that neither the average NOx emission level nor the non-compliance rate were reduced after the NECA was introduced. In fact, there was an observed significant increase in the average NOx emissions from OGVs from 12.6 to 13.5 g NOx/kWh (P < 0.001) (Figure 6A). Also the non-compliance rated increased from 3.7% to 3.9%, although this difference was not found to be significant (P = 0.8).
The previously discovered trend that Tier II OGVs had a higher average NOx emission and non-compliance rate compared to Tier I [56] was re-confirmed by including the data from 2022 (Figure 6B,C). This is a result of the validation method for engine certification in the NOx Technical Code which defines two engine cycles for main engines based on four different engine states for the calculation of the weighted average (Table S.1). This means that an engine is considered compliant as long as the weighted average is below the limit, even if emissions at certain engine states exceed the limit. Tier II engines were found to have higher NOx emissions in the lower engine states due to fuel optimization, while Tier I engines have more constant emission levels with engine load[56]. As lower engine states are often used in coastal shipping lanes with heavy traffic density, this results in Tier II OGVs emitting more NOx in areas most prone to significant environmental and health impacts. Furthermore, currently for main engine states below 25% there are no emission limits in place and 23% of the observed non-compliant OGVs had an engine load below 25% and therefore were not regulated (Figure 4).
Tier III engines have a not-to-exceed (NTE) limit for all engine states, set at 150% of the emission limit, making it easier to assess compliance as it doesn’t require an assessment of the weighted average. However, only 7 Tier III OGVs (0.3%) have been monitored so far. This is concerning as many OGVs that were built after 2021, when the Tier III limits came into force, but also those that are planned still have a KLD before 2021, which means that they may still follow the Tier II limits. It was discovered that only 21% of the merchant OGVs larger than 5000GT, built in 2021 and 2022 had a KLD in or after 2021 and were certified as Tier III.
Figure 5.
Difference between Built Year and Keel Laying Date over time.
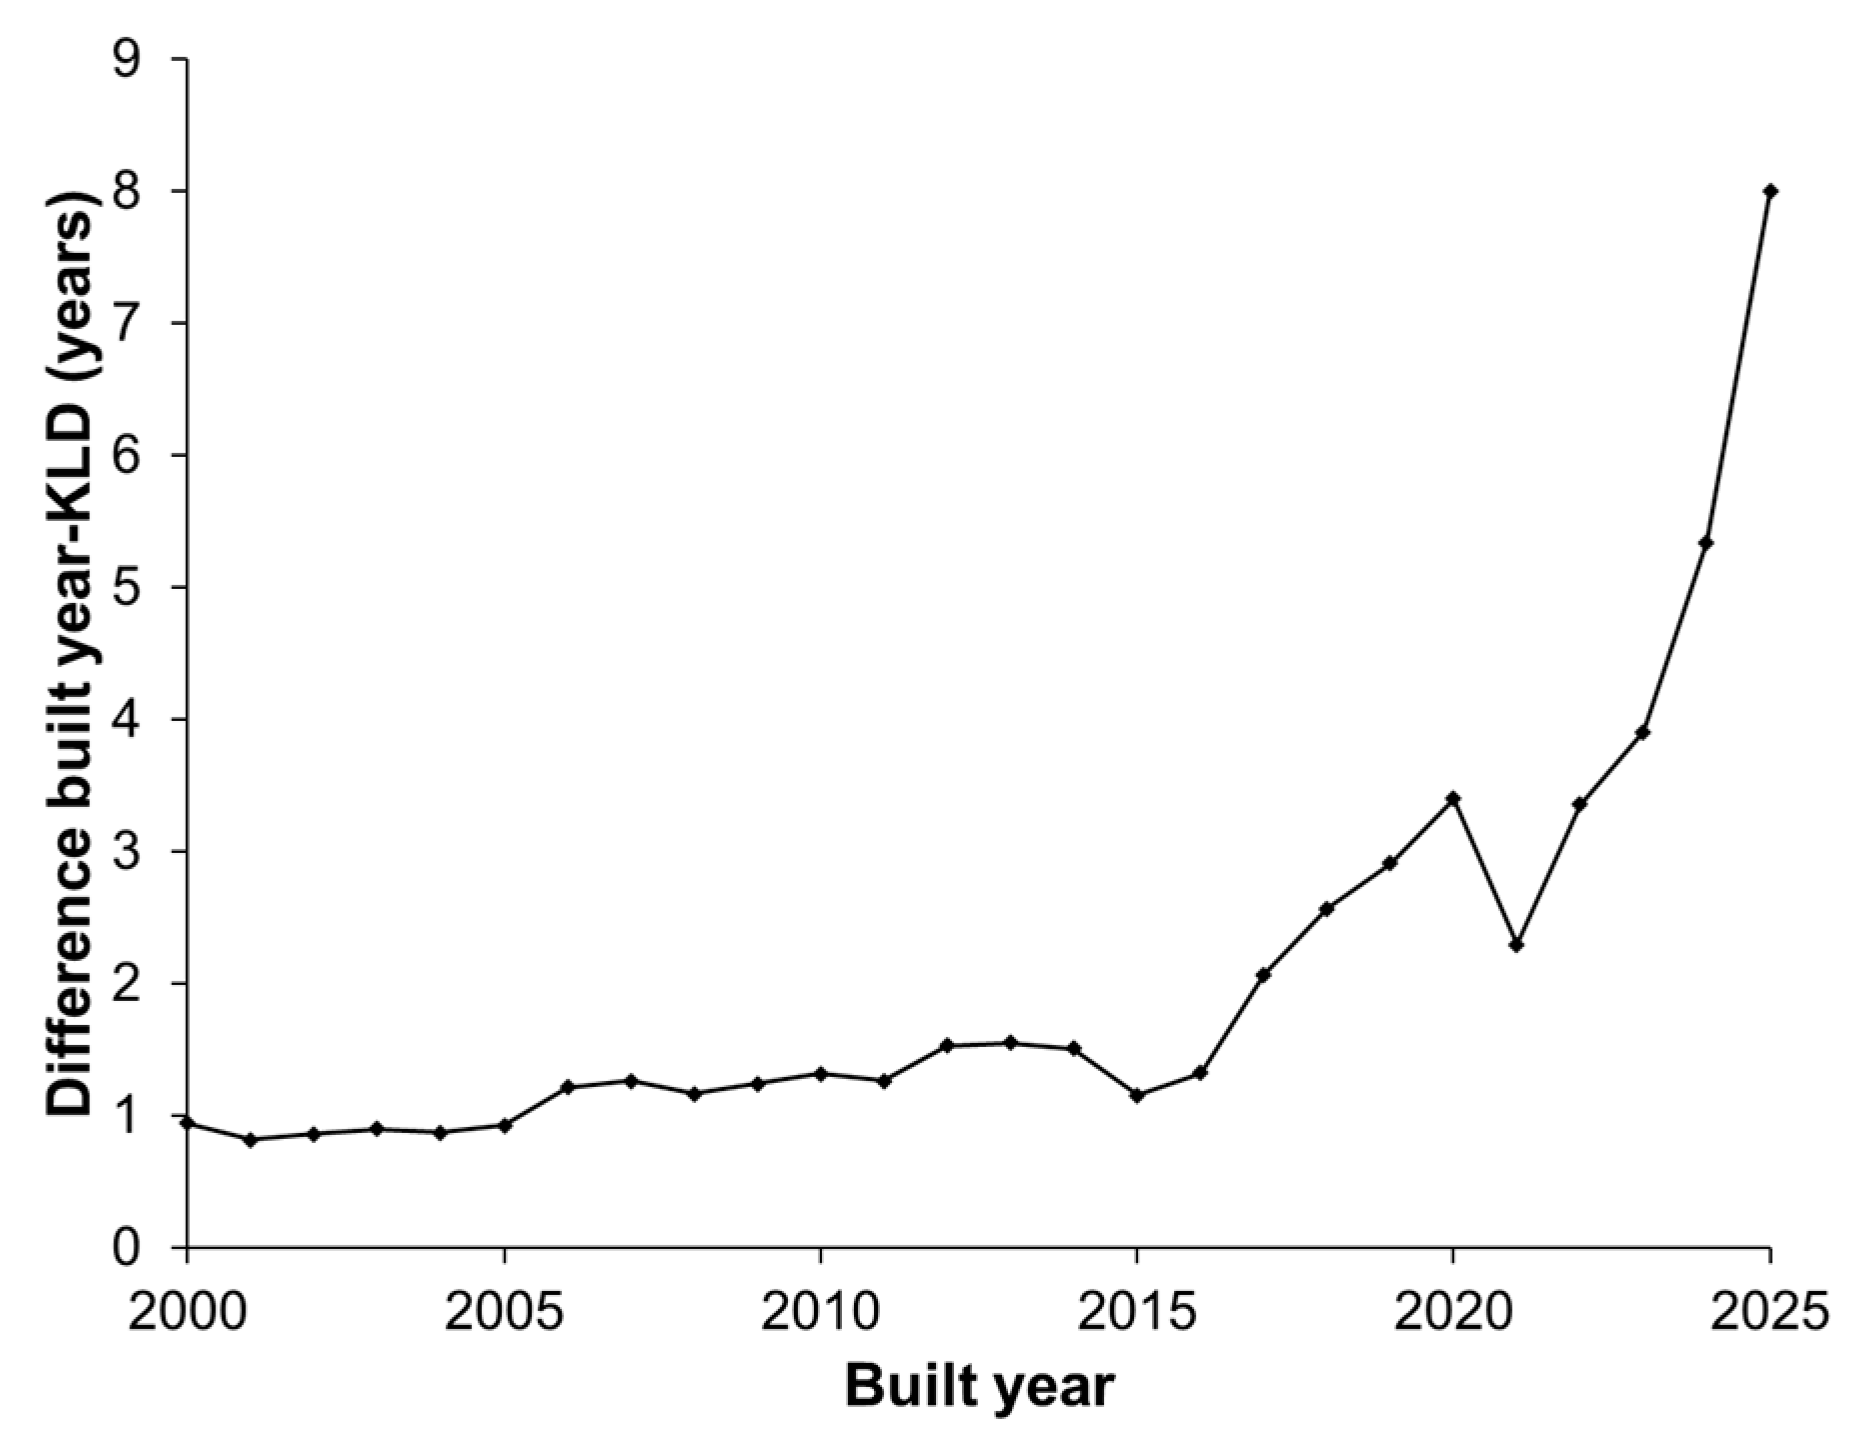
It cannot be overstated that this delay will have a substantial impact on the environment and public health [13,56]. Another remarkable discovery was that 43% of the limited number of observed Tier III OGVs were found to be non-compliant, this is in line with the observations made during the EU-funded Horizon 2020 project "Shipping Contributions to Inland Pollution Push for the Enforcement of Regulations" (SCIPPER) [80]. The analysis provided clear evidence of the inefficacy and even counterproductive nature of the international maritime NOx emission regulations in reducing actual emissions from OGVs in the ECA.
To evaluate how an EGCS affects NOx emissions, an analysis was conducted on the average NOx emission levels and compliance rate to NOx emission standards between EGCS OGVs and non-EGCS OGVs. The findings revealed that EGCS-equipped OGVs had an average NOx emission level of 14.4 g NOx/kWh, which was significantly higher than the 13.1 g NOx/kWh for non-EGCS OGVs (P < 0.001). Furthermore, the non-compliance rate for EGCS OGVs was significantly higher at 6%, compared to 2% for non-EGCS OGVs (P < 0.001) (Figure 6D). These results were consistent across all monitoring years and for both Tier I and Tier II (Figure S.8). These results confirm previous research that indicated the (minor) effect of EGCS on NOx emission levels [77].
Figure 6.
Boxplot with median, 10, 25, 75, 90% percentiles, and average NOx emissions per year (A) and per tier level (B). NOx non-compliance per tier and per year (Tier III is not represented due to the absence of Tier III data in 2020 and 2021).
Figure 6.
Boxplot with median, 10, 25, 75, 90% percentiles, and average NOx emissions per year (A) and per tier level (B). NOx non-compliance per tier and per year (Tier III is not represented due to the absence of Tier III data in 2020 and 2021).
3.1.4. Impact Emissions from OGVs on Belgian Inland Air Quality
By analyzing the annual average SO2 and NOx concentrations conducted in air quality monitoring stations located in coastal or port areas compared to those not situated in such areas the relative importance of air pollution from OGVs was elaborated. It was of no surprise that both SO2 and NOx concentrations were substantially higher in coastal/port areas, although declining concentrations were generally observed for both SO2 and NOx at all stations (Figure 7).
The difference in SO2 concentration between coastal/port and non-coastal/port stations was found to slightly decrease between 2008 and 2016, but later started to re-increase slightly, (Figure 7, left). Clear reductions were observed in 2010, 2013, 2015, and 2016, which can be attributed to the implementation of international SO2 emission limits for OGVs. However, the reduction in 2013 can be neglected as it was linked to a short-term increase in pollution for non-coastal stations due to inland pollution sources [70].
Regarding the difference in NOx concentration between coastal/port and non-coastal/port stations, a very stable trend was observed over the last decade (Figure 7, right). This indicates that emissions from OGVs have not decreased over time and were not substantially impacted by the introduction of the NECA in 2021. Consequently, emissions from OGVs are increasingly contributing to the total inland NOx pollution.
The SO2 analysis categorized by emission source clearly indicate the impact of the introduction of the SECA and subsequent reductions in maximum allowed FSC in 2010 and 2015 (Figure 8A). However, the future trend analysis also suggests that the contribution of SO2 emissions from OGVs to the total SO2 emissions in the Flemish region is expected to increase to approximately 7% by 2030.
Regarding NOx emission sources, the impact of international shipping regulations was found to be less profound. The contribution of NOx emissions from OGVs to inland NOx in the Flemish region shows an upward trend. The establishment of the NECA in 2021 has had no significant impact on this trend, it is even projected that by 2025 the NOx emission contribution from OGVs will surpass any other source and contribute to 40% of all NOx emissions for the Flemish region by 2030 (Figure 8B). These results largely corroborate the findings of previous large-scale studies that modelled the shipping contribution to inland pollution [30,31,81,82,83,84,85]
4. Conclusions
This study showed that the implementation of Regulation 14 of MARPOL Annex VI and the assignment of the North Sea Emission Control Area, have had a significant impact on the reduction of SO2 emissions from OGVs. In addition, the introduction of the Global Sulphur Cap has further reduced SO2 emissions, significantly reducing the contribution of shipping to domestic SO2 pollution in Belgium, from over 10% in the early 2000s to 3% in 2015. The implementation of the Global Sulphur Cap also coincided with an improvement in compliance levels, which can also be partly attributed to the increased implementation of remote monitoring by North Sea coastal states. The effective implementation of clear regulations, monitoring and enforcement practices at various policy levels (IMO, EU, Belgium) has proven to be successful in addressing SO2 emissions from OGVs.
However, it was observed that SO2 emissions from OGVs are expected to rise to 7% by 2030. Unfortunately, the Global Sulphur Cap has led to increased use of EGCS, as average SO2 emissions from EGCS equipped OGVs have been found to be considerably higher than those OGVs without EGCS. Moreover, non-compliance is significantly more common in EGCS-equipped OGVs and even FSC values appear to be particularly high when non-compliance is found in EGCS equipped OGVs.
On the other hand, the study found that Regulation 13 of MARPOL Annex VI had no beneficial effect on the average reduction of NOx emissions from OGVs. On the contrary, due to the way regulations are structured, the study demonstrated that real-world average NOx emissions from OGVs are increasing. This trend, in combination with the expected growth in maritime transport, will make OGVs the largest contributor to NOx emissions by 2025. By 2030, OGVs are estimated to be responsible for 40% of total domestic NOx emissions in Belgium. Finally, this study showed that EGCS not only increased SO2 emissions, but also resulted in higher average NOx emissions and increased non-compliance with NOx regulations.
Supplementary Materials
The following supporting information can be downloaded at the website of this paper posted on Preprints.org, Figure S.1. Emission Control Area (ECA) as defined by MARPOL Annex VI (A). Limits on the Fuel Sulfur Content of marine fuels according to the MARPOL Annex VI regulation 14 (B). NOx emission limits according to MARPOL Annex VI Regulation 13 (C).; Figure S.2. Schematic overview of the updated sniffer sensor system, with NOx sensor and HC kicker.; Figure S.3. Distribution of the observed OGVs according to OGV type.; Figure S.4. Distribution of the observed OGVs ac Figure S.6. Distribution of 20 most observed countries (A) and ports of destination, based on the AIS information transmitted by the OGVs (B).cording to OGV length (m). Figure S.5. Distribution of the speed of the observed OGVs.; Figure S.7. Non-compliance for FSC (A) and NOx (B) according to flag state. The left non-compliance rate (%) is based on the non-compliance rate per flag state, the right percentage is the proportion of the number of non-compliant OGVs per flag state compared to the overall number of observed non-com.; Figure S.8. Difference in compliance levels for OGCS OGVS versus non-EGCS OGVs for Tier I (left) and Tier II (right) OGVS.; Table S.1. Test cycles and weighting factors according to the NOx Technical code.; Table S.2. SO2 and CO2 concentrations of the ordered plume simulation mixtures and effective FSC value.; Table S.3. Intra-Assay Coefficient of Variability, freedom of degrees and total uncertainty for FSC and NOx.
Author contributions: Conceptualization, Ward Van Roy; Data curation, Ward Van Roy; Formal analysis, Ward Van Roy; Funding acquisition, Ward Van Roy, Kobe Scheldeman and Ronny Schallier; Investigation, Ward Van Roy; Methodology, Ward Van Roy; Project administration, Ward Van Roy; Resources, Ward Van Roy, Jean-Baptiste Merveille, Kobe Scheldeman, Annelore Van Nieuwenhove and Benjamin Van Roozendael; Software, Ward Van Roy; Supervision, Ronny Schallier and Frank Maes; Validation, Ward Van Roy; Visualization, Ward Van Roy; Writing – original draft, Ward Van Roy; Writing – review & editing, Ward Van Roy and Frank Maes.
Funding/Support: The sniffer has been partially funded by the European Commission through the Connecting Europe Facility (CEF) program (2014 EU TM 0546 S). The NOx sensor has been funded by the Belgian minister in charge of the North Sea.
Data availability: The Belgian airborne monitoring dataset is available on: https://doi.org/10.24417/bmdc.be:dataset:2687
Acknowledgements
The pilots of the Belgian Defense Airforce Component: Geert Present, Alexander Vermeire, Pieter Janssens and Dries Noppe are gratefully appreciated for the safe and highly professional performance of the Belgian surveillance flights. The Belgian ministry of the North Sea is gratefully acknowledged for the funding of the NOx sensor. Acknowledgement to the European Directorate General for Mobility and Transport (DG-MOVE) for the funding of the sniffer sensor. The European Maritime Safety Agency (EMSA) is gratefully acknowledged for providing the KLD data and EGCS data. The authors wish to thank Christophe Swolfs and Bart Colaers from the Federal Public Service for Mobility and Transport for their help on their help in obtaining the Thetis-EU data. The authors wish to thank Albina Mjaki from the Brussels Institute of Environment (BIM) for her help with the calibration of the reference gasses. Finally we wish to thank Jan Adams and Leen Verlinden from the Flemish Agency for Environment (VMM) for the provision of the hydrocarbon kickers and the SO2 and NOx air quality monitoring data. Finally, we wish to thank Rebecca Gualandi for proofreading the manuscript.
Conflicts of Interest
The authors declare no conflict of interest.
References
- Cromar, K.; Lazrak, N. Risk Communication of Ambient Air Pollution in the WHO European Region: Review of Air Quality Indexes and Lessons Learned; Copenhagen, 2023. [Google Scholar]
- Burnett, R.; Chen, H.; Szyszkowicz, M.; Fann, N.; Hubbell, B.; Pope, C.A.; Apte, J.S.; Brauer, M.; Cohen, A.; Weichenthal, S.; et al. Global Estimates of Mortality Associated with Long-Term Exposure to Outdoor Fine Particulate Matter. Proceedings of the National Academy of Sciences 2018, 115, 9592–9597. [Google Scholar] [CrossRef] [PubMed]
- EEA Air Quality in Europe 2022. Available online: https://www.eea.europa.eu/publications/air-quality-in-europe-2022 (accessed on 18 April 2023).
- Byčenkienė, S.; Khan, A.; Bimbaitė, V. Impact of PM2.5 and PM10 Emissions on Changes of Their Concentration Levels in Lithuania: A Case Study. Atmosphere (Basel) 2022, 13, 1793. [CrossRef]
- EEA Indicator Assessment - Nitrogen Oxides (NOx) Emissions. Available online: https://www.eea.europa.eu/data-and-maps/indicators/eea-32-nitrogen-oxides-nox-emissions-1/assessment.2010-08-19.0140149032-3 (accessed on 11 April 2022).
- Corbett, J.J.; Fischbeck, P.S.; Pandis, S.N. Global Nitrogen and Sulfur Inventories for Oceangoing Ships. Journal of Geophysical Research Atmospheres 1999, 104, 3457–3470. [Google Scholar] [CrossRef]
- Corbett, J.J.; Wang, C.; Winebrake, J.J.; Green, E. Allocation and Forecasting of Global Ship Emissions ANNEX Allocation and Forecasting of Global Ship Emissions Prepared for the Clean Air Task Force; 2007.
- Corbett, J.J.; Fischbeck, P.S. Emissions from Ships. Science (1979) 1997, 278, 823–824. [Google Scholar] [CrossRef]
- Corbett, J.J.; Koehler, H.W. Updated Emissions from Ocean Shipping. J Geophys Res 2003, 108. [Google Scholar] [CrossRef]
- IMO Third IMO GHG Study 2014 Executive Summary and Final Report; 2015.
- Faber, J.; Hanayama, S.; Zhang, S.; Pereda, P.; Bryan Comer; Elena Hauerhof; Wendela Schim van der Loeff; Tristan Smith; Yan Zhang; Hiroyuko Kosaka; et al. In Fourth IMO GHG Study 2020 Full Report; London, 2021.
- EMSA Tackling Emissions - Air Pollutants. Available online: https://www.emsa.europa.eu/tackling-air-emissions/air-pollutants.html (accessed on 18 April 2023).
- Zhang, Y.; Eastham, S.D.; Lau, A.K.; Fung, J.C.; Selin, N.E. Global Air Quality and Health Impacts of Domestic and International Shipping. Environmental Research Letters 2021, 16, 084055. [Google Scholar] [CrossRef]
- Sofiev, M.; Winebrake, J.J.; Johansson, L.; Carr, E.W.; Prank, M.; Soares, J.; Vira, J.; Kouznetsov, R.; Jalkanen, J.P.; Corbett, J.J. Cleaner Fuels for Ships Provide Public Health Benefits with Climate Tradeoffs. Nat Commun 2018, 9. [Google Scholar] [CrossRef] [PubMed]
- Liu, H.; Fu, M.; Jin, X.; Shang, Y.; Shindell, D.; Faluvegi, G.; Shindell, C.; He, K. Health and Climate Impacts of Ocean-Going Vessels in East Asia. Nat Clim Chang 2016, 6, 1037–1041. [Google Scholar] [CrossRef]
- Viana, M.; Rizza, V.; Tobías, A.; Carr, E.; Corbett, J.; Sofiev, M.; Karanasiou, A.; Buonanno, G.; Fann, N. Estimated Health Impacts from Maritime Transport in the Mediterranean Region and Benefits from the Use of Cleaner Fuels. Environ Int 2020, 138. [Google Scholar] [CrossRef] [PubMed]
- World Health Organization. Air Quality Guidelines : Global Update 2005 : Particulate Matter, Ozone, Nitrogen Dioxide, and Sulfur Dioxide.; World Health Organization, 2006; ISBN 9289021926.
- Schwarzkopf, D.A.; Petrik, R.; Matthias, V.; Quante, M.; Yu, G.; Zhang, Y. Comparison of the Impact of Ship Emissions in Northern Europe and Eastern China. Atmosphere (Basel) 2022, 13, 894. [Google Scholar] [CrossRef]
- IMO International Convention for the Prevention of Pollution from Ships 1973, as Modified by the Protocol of 1978 Relating Thereto (Adopted 17 February 1978 (MARPOL), in Force 2 October 1983) 1340 UNTS 61, as Amended; International Maritime Organization, 1978.
- IMO Protocol of 1997 to Amend the International Convention for the Prevention of Pollution from Ships of 2 November 1973, as Modified by the Protocol of 17 February 1978, London, 1997, into Force on 19 May 2005 and Amended (Revised MARPOL Annex VI), Resolution MEPC.176(58) Adopted on 10 October 2008, in Force on 1 July 2010; International Maritime Organization, London, 1997.
- IMO Status Of IMO Treaties : Comprehensive Information on the Status of Multilateral Conventions and Instruments in Respect of Which the International Maritime Organization or Its Secretary-General Performs Depositary or Other Functions. Available online: https://www.imo.org/en/About/Conventions/Pages/StatusOfConventions.aspx (accessed on 15 April 2023).
- MEPC List of Special Areas, Emission Control Areas and Particularly Sensitive Sea Areas; Marine Environmental Protection Committee: International Maritime Organization, 2018; pp. 1–5;
- MEPC Amendments to the Annex of the Protocol of 1997 to Amend the International Convention for the Prevention of Pollution from Ships, 1973, as Modified by the Protocol of 1978 Relating Thereto. Amendments to MARPOL Annex VI (Designation of the Baltic Sea and the North Sea Emission Control Areas for NOX Tier III Control), Resolution MEPC.268(71) Adopted on 7 July 2017, in Force on 1 January 2019; Marine Environment Protection Committee: International Maritime Organization, London, 2017.
- MEPC Proposal to Designate the North Sea as an Emission Control Area for Nitrogen Oxides (Submitted by Belgium et al.), Resolution MEPC.70/5/Rev.1; Marine Environment Protection Committee: International Maritime Organization, London, 2016; pp. 1–71.
- MEPC Amendments to the Annex of the Protocol of 1997 to Amend the International Convention for the Prevention of Pollution from Ships, 1973, as Modified by the Protocol of 1978 Relating Thereto (Designation of the United States Caribbean Sea Emission Control Area and Exemption of Certain Ships Operating in the North American Emission Control Area and the United States Caribbean Sea Emission Control Area under Regulations 13 and 14 and Appendix VII of MARPOL Annex VI), Resolution MEPC 202(62); Marine Environment Protection Committee: International Maritime Organization, London, 2011; pp. 2–13.
- MEPC Amendments to the Annex of the Protocol of 1997 to Amend the International Convention for the Prevention of Pollution from Ships, 1973, as Modified by the Protocol of 1978 Relating Thereto; Marine Environment Protection Committee: International Maritime Organization, 2010; pp. 1–11.
- MEPC Amendments to the Annex of the Protocol of 1997 to Amend the International Convention for the Prevention of Pollution from Ships, 1973, as Modified by the Protocol of 1978 Relating Thereto, Resolution MEPC.132(53), Adopted on 22 July 2005; Marine Environmental Protection Committee: International Maritime Organization, London, 2005; pp. 1–16.
- Endres, S.; Maes, F.; Hopkins, F.; Houghton, K.; Mårtensson, E.M.; Oeffner, J.; Quack, B.; Singh, P.; Turner, D. A New Perspective at the Ship-Air-Sea-Interface: The Environmental Impacts of Exhaust Gas Scrubber Discharge. Front Mar Sci 2018, 5. [Google Scholar] [CrossRef]
- MEPC 2015 Guidelines for Exhaust Gas Cleaning Systems, Resolution MEPC.259(68) Adopted on 15 May 2015, Superseded by the 2021 Guidelines for Exhaust Gas Cleaning Systems, Resolution MEPC.340(77) Adopted on 26 November 2021 for EGCS Installed on Ships Constructed or Delivered on or after 1 June 2021, or the Actual Delivery of EGCS to the Ship on or after 1 June 2021.; Marine Environment Protection Committee: International Maritime Organization, London, 2015; pp. 1–23.
- Johansson, L.; Jalkanen, J.-P.; Kukkonen, J. Global Assessment of Shipping Emissions in 2015 on a High Spatial and Temporal Resolution. Atmos Environ 2017, 167, 403–415. [Google Scholar] [CrossRef]
- Jalkanen, J.-P.; Johansson, L.; Kukkonen, J. A Comprehensive Inventory of Ship Traffic Exhaust Emissions in the European Sea Areas in 2011. Atmos Chem Phys 2016, 16, 71–84. [Google Scholar] [CrossRef]
- MEPC Effective Date of Implementation of the Fuel Oil Standard in Regulation 14.1.3 of MARPOL Annex VI, Resolution MEPC.280(70) Adopted on 28 October 2016; Marine Environment Protection Committee: International Maritime Organization, London, 2016; pp. 1–3.
- MEPC Amendments to the Annex of the Protocol of 1997 to Amend the International Convention for the Prevention of Pollution from Ships, 1973, as Modified by the Protocol of 1978 Relating Thereto (Prohibition on the Carriage of Non-Compliant Fuel Oil for Combustion Purposes for Propulsion or Operation on Board a Ship), Resolution MEPC.305(73) Adopted on 26 October 2018, in Force on 1 March 2020; Marine Environment Protection Committee: International Maritime Organization, London, 2018; pp. 1–5.
- EU Directive 2005/35/EC on Ship-Source Pollution and on the Introduction of Penalties for Infringements, OJ L 255/11, 30.09.2005; See Revision of Directive 2005/35/EC at at HHttps://Www.Europarl.Europa.Eu/Legislative-Train/Theme-a-European-Green-Deal/File-Revision-of-the-Ship-Source-Pollution-Directive.
- EU Directive (EU) 2016/802 of the European Parliament and of the Council of 11 May 2016 Relating to a Reduction in the Sulphur Content of Certain Liquid Fuels, 12.05.2016; The European Parliament and the Council of the European Union, 2016; pp. 58–78.
- Royal Decree Koninklijk Besluit Inzake Milieuvriendelijke Scheepvaart BS 21.08.2020 (Chapter 4 on Sulphur), Amended by KB 4 November 2020, BS 17.11.2020 (Adding Chapter 6 on NOx); Belgisch Staatsblad, 21/08/2020: Belgium, 2020; pp. 63339–63386.
- Royal Decree Koninklijk Besluit (KB) van 27 April 2007 Betreffende de Voorkoming van Luchtverontreiniging Door Schepen En de Vermindering van Het Zwavelgehalte van Sommige Scheepsbrandstoffen. Belgisch Staatsblad (BS), 08.05.2007, Amended by KB of 19 December 2014, BS 24.12.2014 and KB of 20 December 2019, BS 30.12.2019. This KB Has Been Cancelled and Replaced by KB of 15 Juli 2020 Inzake Milieuvriendelijke Scheepvaart; Belgisch Staatsblad, 27/04/2007: Belgium, 2007; pp. 25199–25203.
- EU Commission Implementing Decision (EU) 2015/253 of Laying down the Rules Concerning the Sampling and Reporting under Council Directive 1999/32/EC as Regards the Sulphur Content of Marine Fuels, OJ L 41/55, 17.02.2015. References to the Repealed Directive 1999/32/EC Shall Be Construed as References to Directive 2016/802 (Art. 19 Directive 2016/802); The European Commission, 2015; pp. 45–59; 16 February.
- MEPC Amendments to the Annex of the Protocol of 1997 to Amend the International Convention for the Prevention of Pollution from Ships, 1973, as Modified by the Protocol of 1978 Relating Thereto (Procedures for Sampling and Verification of the Sulphur Content of Fuel Oil and the Energy Efficiency Design Index (EEDI)), Resolution MEPC.324(75) Adopted on 20 November 2020, in Force on 1 April 2022; Marine Environmental Protection Committee: International Maritime Organization, London, 2020.
- MEPC Amendments to the Annex of the Protocol of 1997 to Amend the International Convention for the Prevention of Pollution from Ships, 1973, as Modified by the Protocol of 1978 Relating Thereto (2021 Revised MARPOL Annex VI), Resolution MEPC.328(76), in Force on 1 November 2022; Marine Environmental Protection Committee: International Maritime Organization, 2022.
- MEPC Amendments to the Technical Code on Control of Emission of Nitrogen Oxides from Marine Diesel Engines (NOx Technical Code 2008), Resolution MEPC.177(58) of 10 October 2008, in Force on 1 July 2010; Marine Environmental Protection Committee: International Maritime Organization, London, 2008.
- MEPC Amendments to the Annex of the Protocol of 1997 to Amend the International Convention for the Prevention of Pollution from Ships, 1973, as Modified by the Protocol of 1978 Relating Thereto (Revised MARPOL Annex VI), Resolution MEPC.176(58) of 10 October 2008, in Force on 1 July 2010; Marine Environment Protection Committee: International Maritime Organization, London, 2008; pp. 1–46.
- Lagring, R.; Degraer, S.; de Montpellier, G.; Jacques, T.; Van Roy, W.; Schallier, R. Twenty Years of Belgian North Sea Aerial Surveillance: A Quantitative Analysis of Results Confirms Effectiveness of International Oil Pollution Legislation. Mar Pollut Bull 2012, 64, 644–652. [Google Scholar] [CrossRef] [PubMed]
- Lagring, R.; Degraer, S.; de Montpellier, G.; Jacques, T.; Van Roy, W.; Schallier, R. Twenty Years of Belgian North Sea Aerial Surveillance: A Quantitative Analysis of Results Confirms Effectiveness of International Oil Pollution Legislation. Mar Pollut Bull 2012, 64, 644–652. [Google Scholar] [CrossRef] [PubMed]
- Royal Decree Law. Article 4.2.4.5. of the Belgian Shipping Code (Wet Tot Invoering van Het Belgisch Scheepvaartwetboek) of 01.08.2019; Belgisch Staatsblad: Belgium, 2019; pp. 75432–75808.
- Mellqvist, J.; Beecken, J.; Conde, V.; Ekholm, J. Surveillance of Sulfur Emissions from Ships in Danish Waters, Report to the Danish Environmental Protection Agency; Copenhagen, Denmark, 2017.
- Van Roy, W.; Van Nieuwenhove, A.; Scheldeman, K.; Van Roozendael, B.; Schallier, R.; Mellqvist, J.; Maes, F. Measurement of Sulfur-Dioxide Emissions from Ocean-Going Vessels in Belgium Using Novel Techniques. Atmosphere (Basel) 2022, 13, 1756. [Google Scholar] [CrossRef]
- Balzani Lööv, J.M.; Alfoldy, B.; Gast, L.F.L.; Hjorth, J.; Lagler, F.; Mellqvist, J.; Beecken, J.; Berg, N.; Duyzer, J.; Westrate, H.; et al. Field Test of Available Methods to Measure Remotely SOx and NOx Emissions from Ships. Atmos Meas Tech 2014, 7, 2597–2613. [Google Scholar] [CrossRef]
- Van Roy, W.; Schallier, R.; Van Roozendael, B.; Scheldeman, K.; Van Nieuwenhove, A.; Maes, F. Airborne Monitoring of Compliance to Sulfur Emission Regulations by Ocean-Going Vessels in the Belgian North Sea Area. Atmos Pollut Res 2022, 13. [Google Scholar] [CrossRef]
- Van Roy, W.; Schallier, R.; Scheldeman, K.; Van Roozendael, B.; Van Nieuwenhove, A.; Maes, F. Airborne Monitoring of Compliance to Sulfur Emission Regulations by Ocean-Going Vessels in the Belgian North Sea Area. Atmos Pollut Res 2022, 13. [Google Scholar] [CrossRef]
- Beecken, J.; Mellqvist, J.; Salo, K.; Ekholm, J.; Jalkanen, J.P. Airborne Emission Measurements of SO2, NOx and Particles from Individual Ships Using a Sniffer Technique. Atmos Meas Tech 2014, 7, 1957–1968. [Google Scholar] [CrossRef]
- Mellqvist, J.; Ekholm, J.; Salo, K.; Beecken, J. Identification of Gross Polluting Ships to Promote a Level Playing Field Withing the Shipping Sector; 2014.
- Beecken, J.; Mellqvist, J.; Salo, K.; Ekholm, J.; Jalkanen, J.P.; Johansson, L.; Litvinenko, V.; Volodin, K.; Frank-Kamenetsky, D.A. Emission Factors of SO2, NOx and Particles from Ships in Neva Bay from Ground-Based and Helicopter-Borne Measurements and AIS-Based Modelling. Atmos Chem Phys 2015, 15, 5229–5241. [Google Scholar] [CrossRef]
- Beecken, J.; Irjala, M.; Weigelt, A.; Conde, V.; Mellqvist, J.; Proud, R.; Deakin, A.; Knudsen, B.; Timonen, H.; Sundström, A.-M.; et al. SCIPPER Project D2.1 Review of Available Remote Systems for Ship Emission Measurements; 2019.
- Alföldy, B.; Lööv, J.B.; Lagler, F.; Mellqvist, J.; Berg, N.; Beecken, J.; Weststrate, H.; Duyzer, J.; Bencs, L.; Horemans, B.; et al. Measurements of Air Pollution Emission Factors for Marine Transportation in SECA. Atmos Meas Tech 2013, 6, 1777–1791. [Google Scholar] [CrossRef]
- Van Roy, W.; Scheldeman, K.; Van Nieuwenhove, A.; Van Roozendael, B.; Schallier, R.; Vigin, L.; Maes, F. Airborne Monitoring of Compliance to NOx Emission Regulations from Ocean-Going Vessels in the Belgian North Sea Area. Atmos Pollut Res 2022, 13. [Google Scholar] [CrossRef]
- Weigelt, A. Sulphur Emission Compliance Monitoring of Ships in German Waters – Results from Five Years of Operation. In Proceedings of the Shipping and the Environment, Symposium on Scenarios and Policy Options for Sustainable Shipping (POL); BSH: Goteborg, October 8 2019.
- Krause, K.; Wittrock, F.; Richter, A.; Busch, D.; Bergen, A.; Burrows, J.P.; Freitag, S.; Halbherr, O. Determination of NOx Emission Rates of Inland Ships from Onshore Measurements. Atmos Meas Tech 2023, 16, 1767–1787. [Google Scholar] [CrossRef]
- Berg, N.; Mellqvist, J.; Jalkanen, J.P.; Balzani, J. Ship Emissions of SO 2 and NO 2: DOAS Measurements from Airborne Platforms. Atmos Meas Tech 2012, 5, 1085–1098. [Google Scholar] [CrossRef]
- Cheng, C.W.; Hua, J.; Hwang, D.S. Nox Emission Calculations for Bulk Carriers by Using Engine Power Probabilities as Weighting Factors. J Air Waste Manage Assoc 2017, 67, 1146–1157. [Google Scholar] [CrossRef] [PubMed]
- Pirjola, L.; Pajunoja, A.; Walden, J.; Jalkanen, J.P.; Rönkkö, T.; Kousa, A.; Koskentalo, T. Mobile Measurements of Ship Emissions in Two Harbour Areas in Finland. Atmos Meas Tech 2014, 7, 149–161. [Google Scholar] [CrossRef]
- Asariotis, W.J.R.; Assaf, M.; Ayala, G.; Ayoub, A.; Benamara, H.; Chantrel, D.; Hoffmann, J.; Larouche-Maltais, A.; Premti, A.; Rodríguez, L.; et al. Review of Maritime Transport 2020.; 2020.
- WINGD Low-Speed Engines 2017 Simply a Better Different; 2017.
- WINGD Engine Selection for Very Large Container Vessels; Winterthur, 2016.
- MAN B&W MAN B&W G95ME-C9.2-GIIMO Tier II Project Guide. 0.5 2014, 346.
- MAN B&W MAN B&W S90ME-C8.2-GI IMO Tier II Project Guide. 0.5 2014, 1–362.
- Acomi, N.; Cristian Acomi, O. The Influence of Different Types of Marine Fuel over the Energy Efficiency Operational Index. In Proceedings of the Energy Procedia; Elsevier Ltd., 2014; Volume 59, pp. 243–248. [Google Scholar]
- European Maritime Safety Agency Https://Www.Emsa.Europa.Eu/Thetis-Eu.Html.
- EMSA Thetis-EU.
- VMM Air Quality Measurements in Flanders Available online:. Available online: https://www.vmm.be/lucht/stikstof/uitstoot-stikstofoxiden (accessed on 19 January 2023).
- UNCTAD Https://Unctad.Org/Rmt2022 Available online:. Available online: https://unctad.org/rmt2022 (accessed on 28 March 2023).
- Gardner, M.J.; Altman, D.G. Estimating with Confidence. BMJ 1988, 296. [Google Scholar] [CrossRef]
- Sprinthall, R.C. Basic Statistical Analysis (9th Edition), 9th ed; 2011. [Google Scholar]
- Van Roy, W.; Merveille, J.-B.; Scheldeman, K.; Van Nieuwenhove, A.; Van Roozendael, B.; Schallier, R.; Maes, F. The Role of Belgian Airborne Sniffer Measurements in the MARPOL Annex VI Enforcement Chain. Atmosphere (Basel) 2023, 14, 623. [Google Scholar] [CrossRef]
- UNCTAD STAT Https://Unctadstat.Unctad.Org/EN/Index.Html.
- Ship and Bunker Scrubber Equipped Tonnage Now 30% of Boxship Capacity.
- Winnes, H.; Fridell, E.; Moldanová, J. Effects of Marine Exhaust Gas Scrubbers on Gas and Particle Emissions. J Mar Sci Eng 2020, 8. [Google Scholar] [CrossRef]
- Dulière, V.; Baetens, K.; Lacroix, G. Potential Impact of Wash Water Effluents from Scrubbers on Water Acidification in the Southern North Sea; 2020.
- Teuchies, J.; Cox, T.J.S.; Van Itterbeeck, K.; Meysman, F.J.R.; Blust, R. The Impact of Scrubber Discharge on the Water Quality in Estuaries and Ports. Environ Sci Eur 2020, 32. [Google Scholar] [CrossRef]
- SCIPPER SCIPPER Project Finds High Nitrogen Oxides Emissions of Tier III Vessels from Remote Measurements in North European Seas; 2023.
- Majamäki, E.; Jalkanen, J.-P. SCIPPER Project D4.2 Updated Inventories on Regional Shipping Activity and Port Regions; 2021.
- Jalkanen, J.-P.; Johansson, L.; Kukkonen, J.; Brink, A.; Kalli, J.; Stipa, T. Extension of an Assessment Model of Ship Traffic Exhaust Emissions for Particulate Matter and Carbon Monoxide. Atmos Chem Phys 2012, 12. [Google Scholar] [CrossRef]
- Jalkanen, J.-P.; Brink, A.; Kalli, J.; Pettersson, H.; Kukkonen, J.; Stipa, T. A Modelling System for the Exhaust Emissions of Marine Traffic and Its Application in the Baltic Sea Area. Atmos. Chem. Phys 2009, 9, 9209–9223. [Google Scholar] [CrossRef]
- Jonson, J.E.; Jalkanen, J.P.; Johansson, L.; Gauss, M.; Denier van der Gon, H.A.C. Model Calculations of the Effects of Present and Future Emissions of Air Pollutants from Shipping in the Baltic Sea and the North Sea. Atmos Chem Phys 2015, 15. [Google Scholar] [CrossRef]
- Seppälä, S.D.; Kuula, J.; Hyvärinen, A.-P.; Saarikoski, S.; Rönkkö, T.; Keskinen, J.; Jalkanen, J.-P.; Timonen, H. Effects of Marine Fuel Sulfur Restrictions on Particle Number Concentrations and Size Distributions in Ship Plumes in the Baltic Sea. Atmos Chem Phys 2021, 21, 3215–3234. [Google Scholar] [CrossRef]
Figure 1.
Correction using a linear regression (in red line) of FSC measurements of three special plume simulation mixtures (black ♦).
Figure 1.
Correction using a linear regression (in red line) of FSC measurements of three special plume simulation mixtures (black ♦).
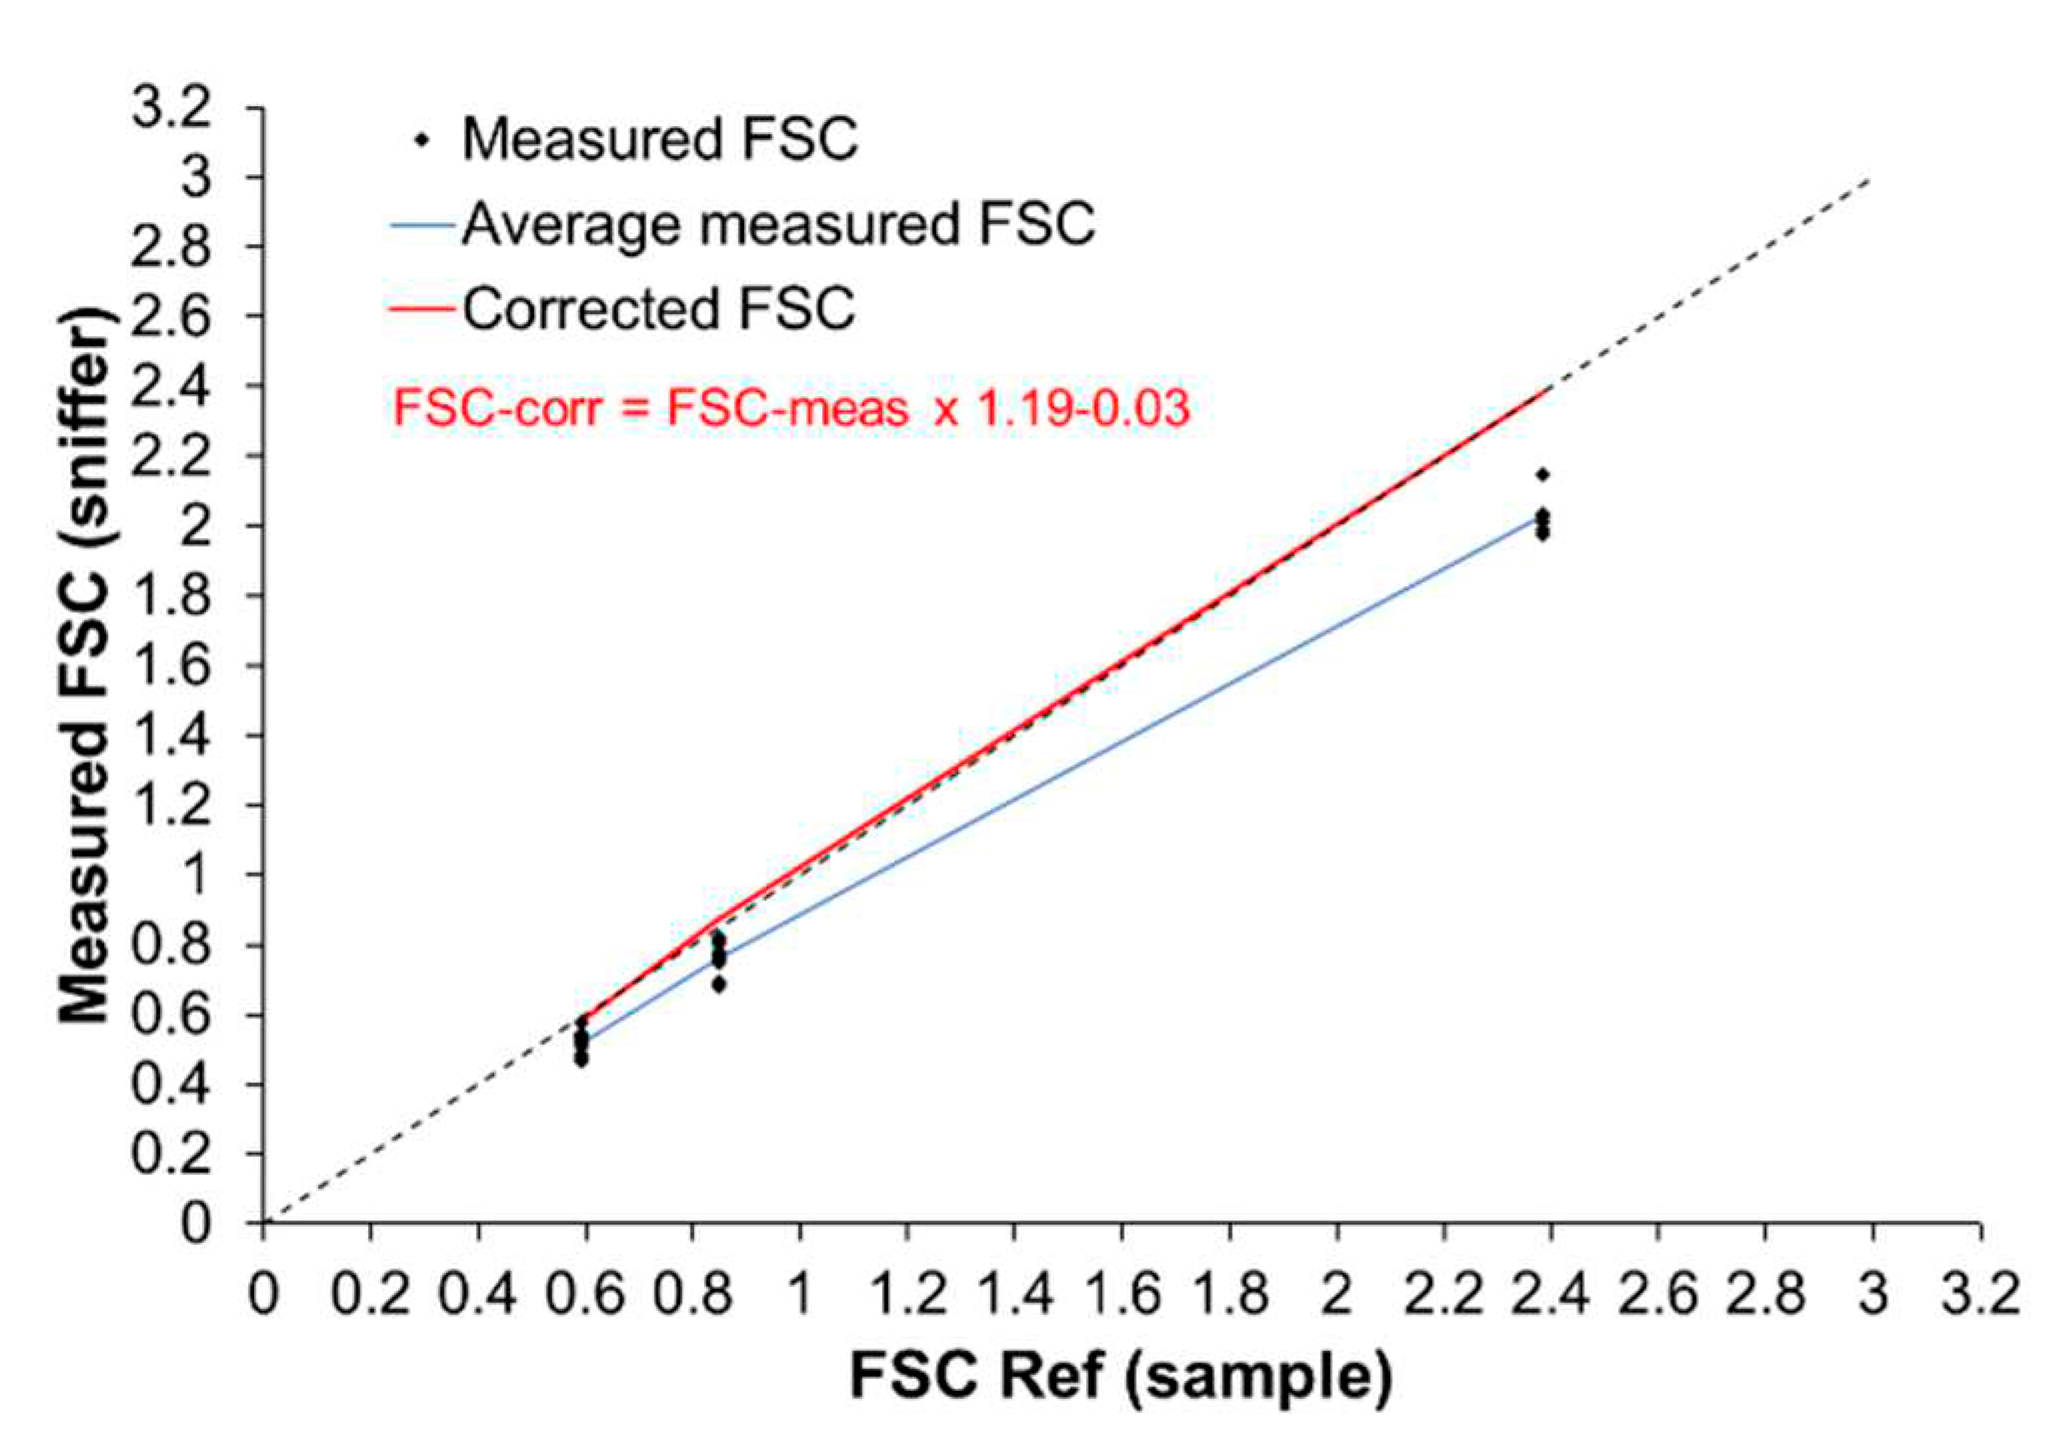
Figure 2.
Linear regression between the FSC including the NO cross sensitivity and the FSC without NO cross sensitivity.
Figure 2.
Linear regression between the FSC including the NO cross sensitivity and the FSC without NO cross sensitivity.
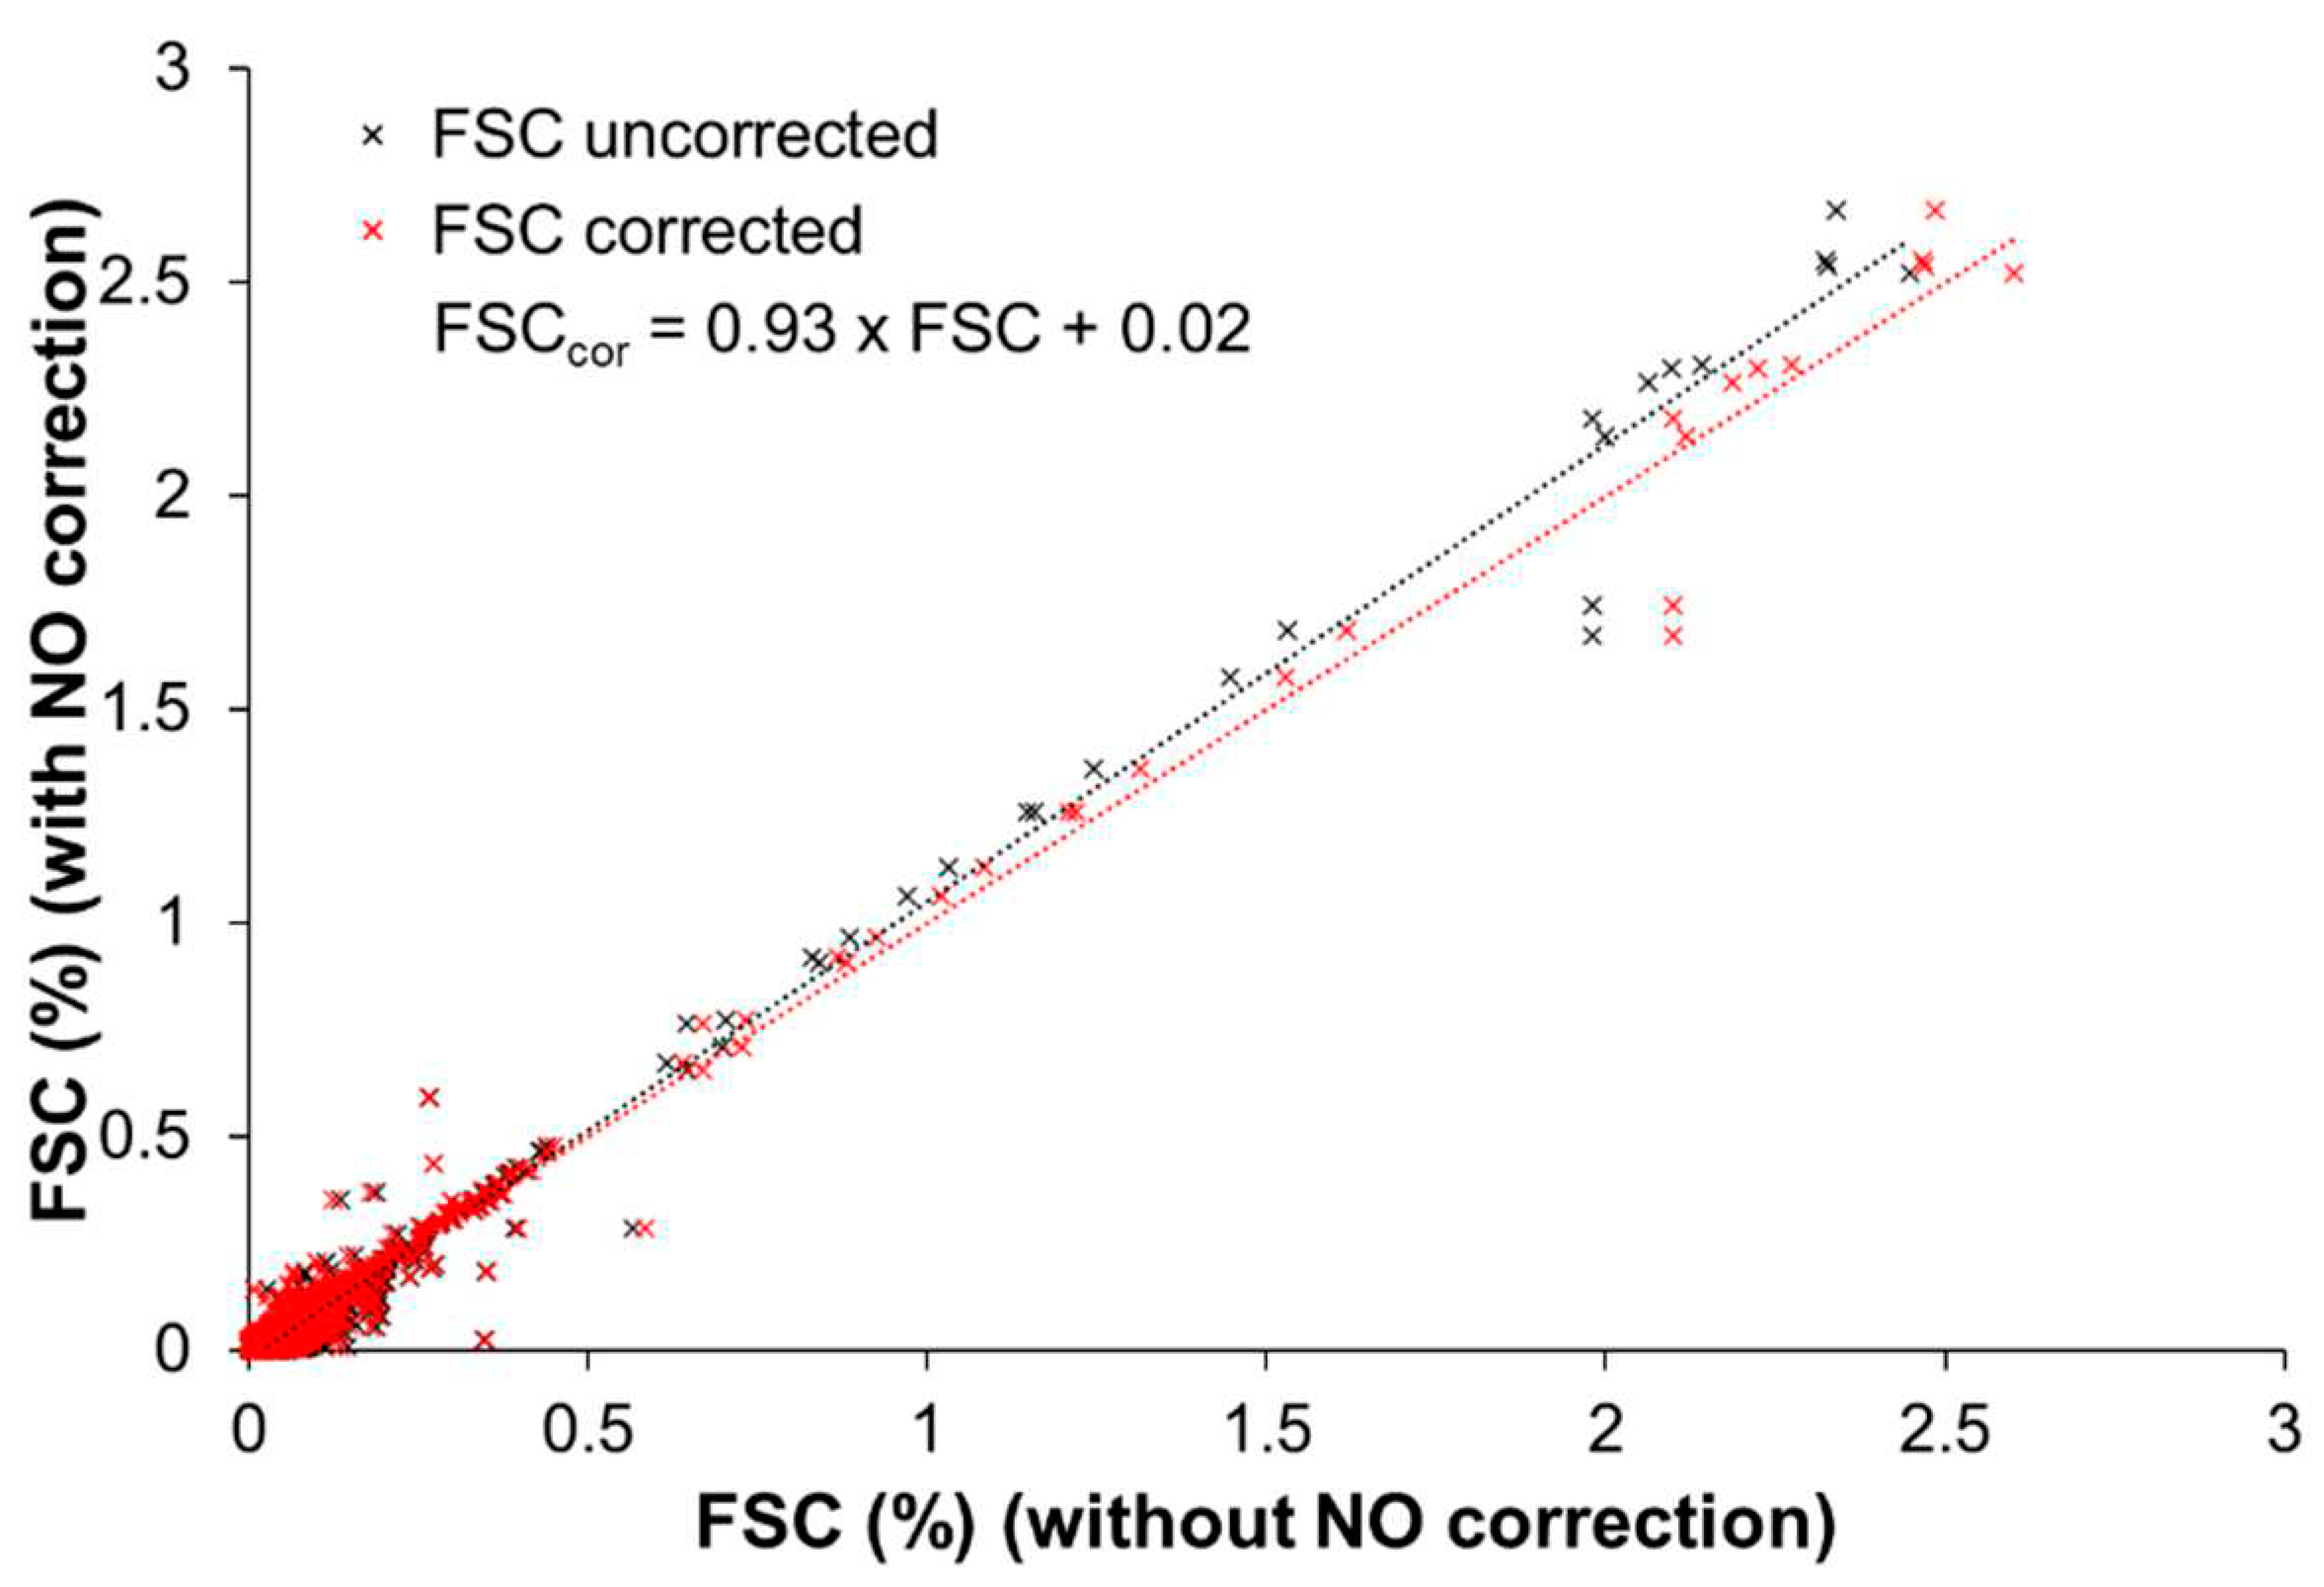
Figure 3.
Evolution of the average corrected FSC concentration from 2015-2022 with median, 10, 25, 75 and 90% percentiles and average FSC per year (♦), with average FSC for the period before and after 2020 (red line) (A). Non-compliance evolution based on the corrected FSC data for 2015-2019 (B). Average, median, 25 and 75 percentile boxplots for monitored FSC for EGCS OGVs and non EGCS OGVs. The overall average is provided in black (♦) The average non-compliant FSC is provided in red (♦) the average compliant FSC is provided in green (♦).(C). Compliance rate of EGCS OGVs compared to OGVs without EGCS (D).
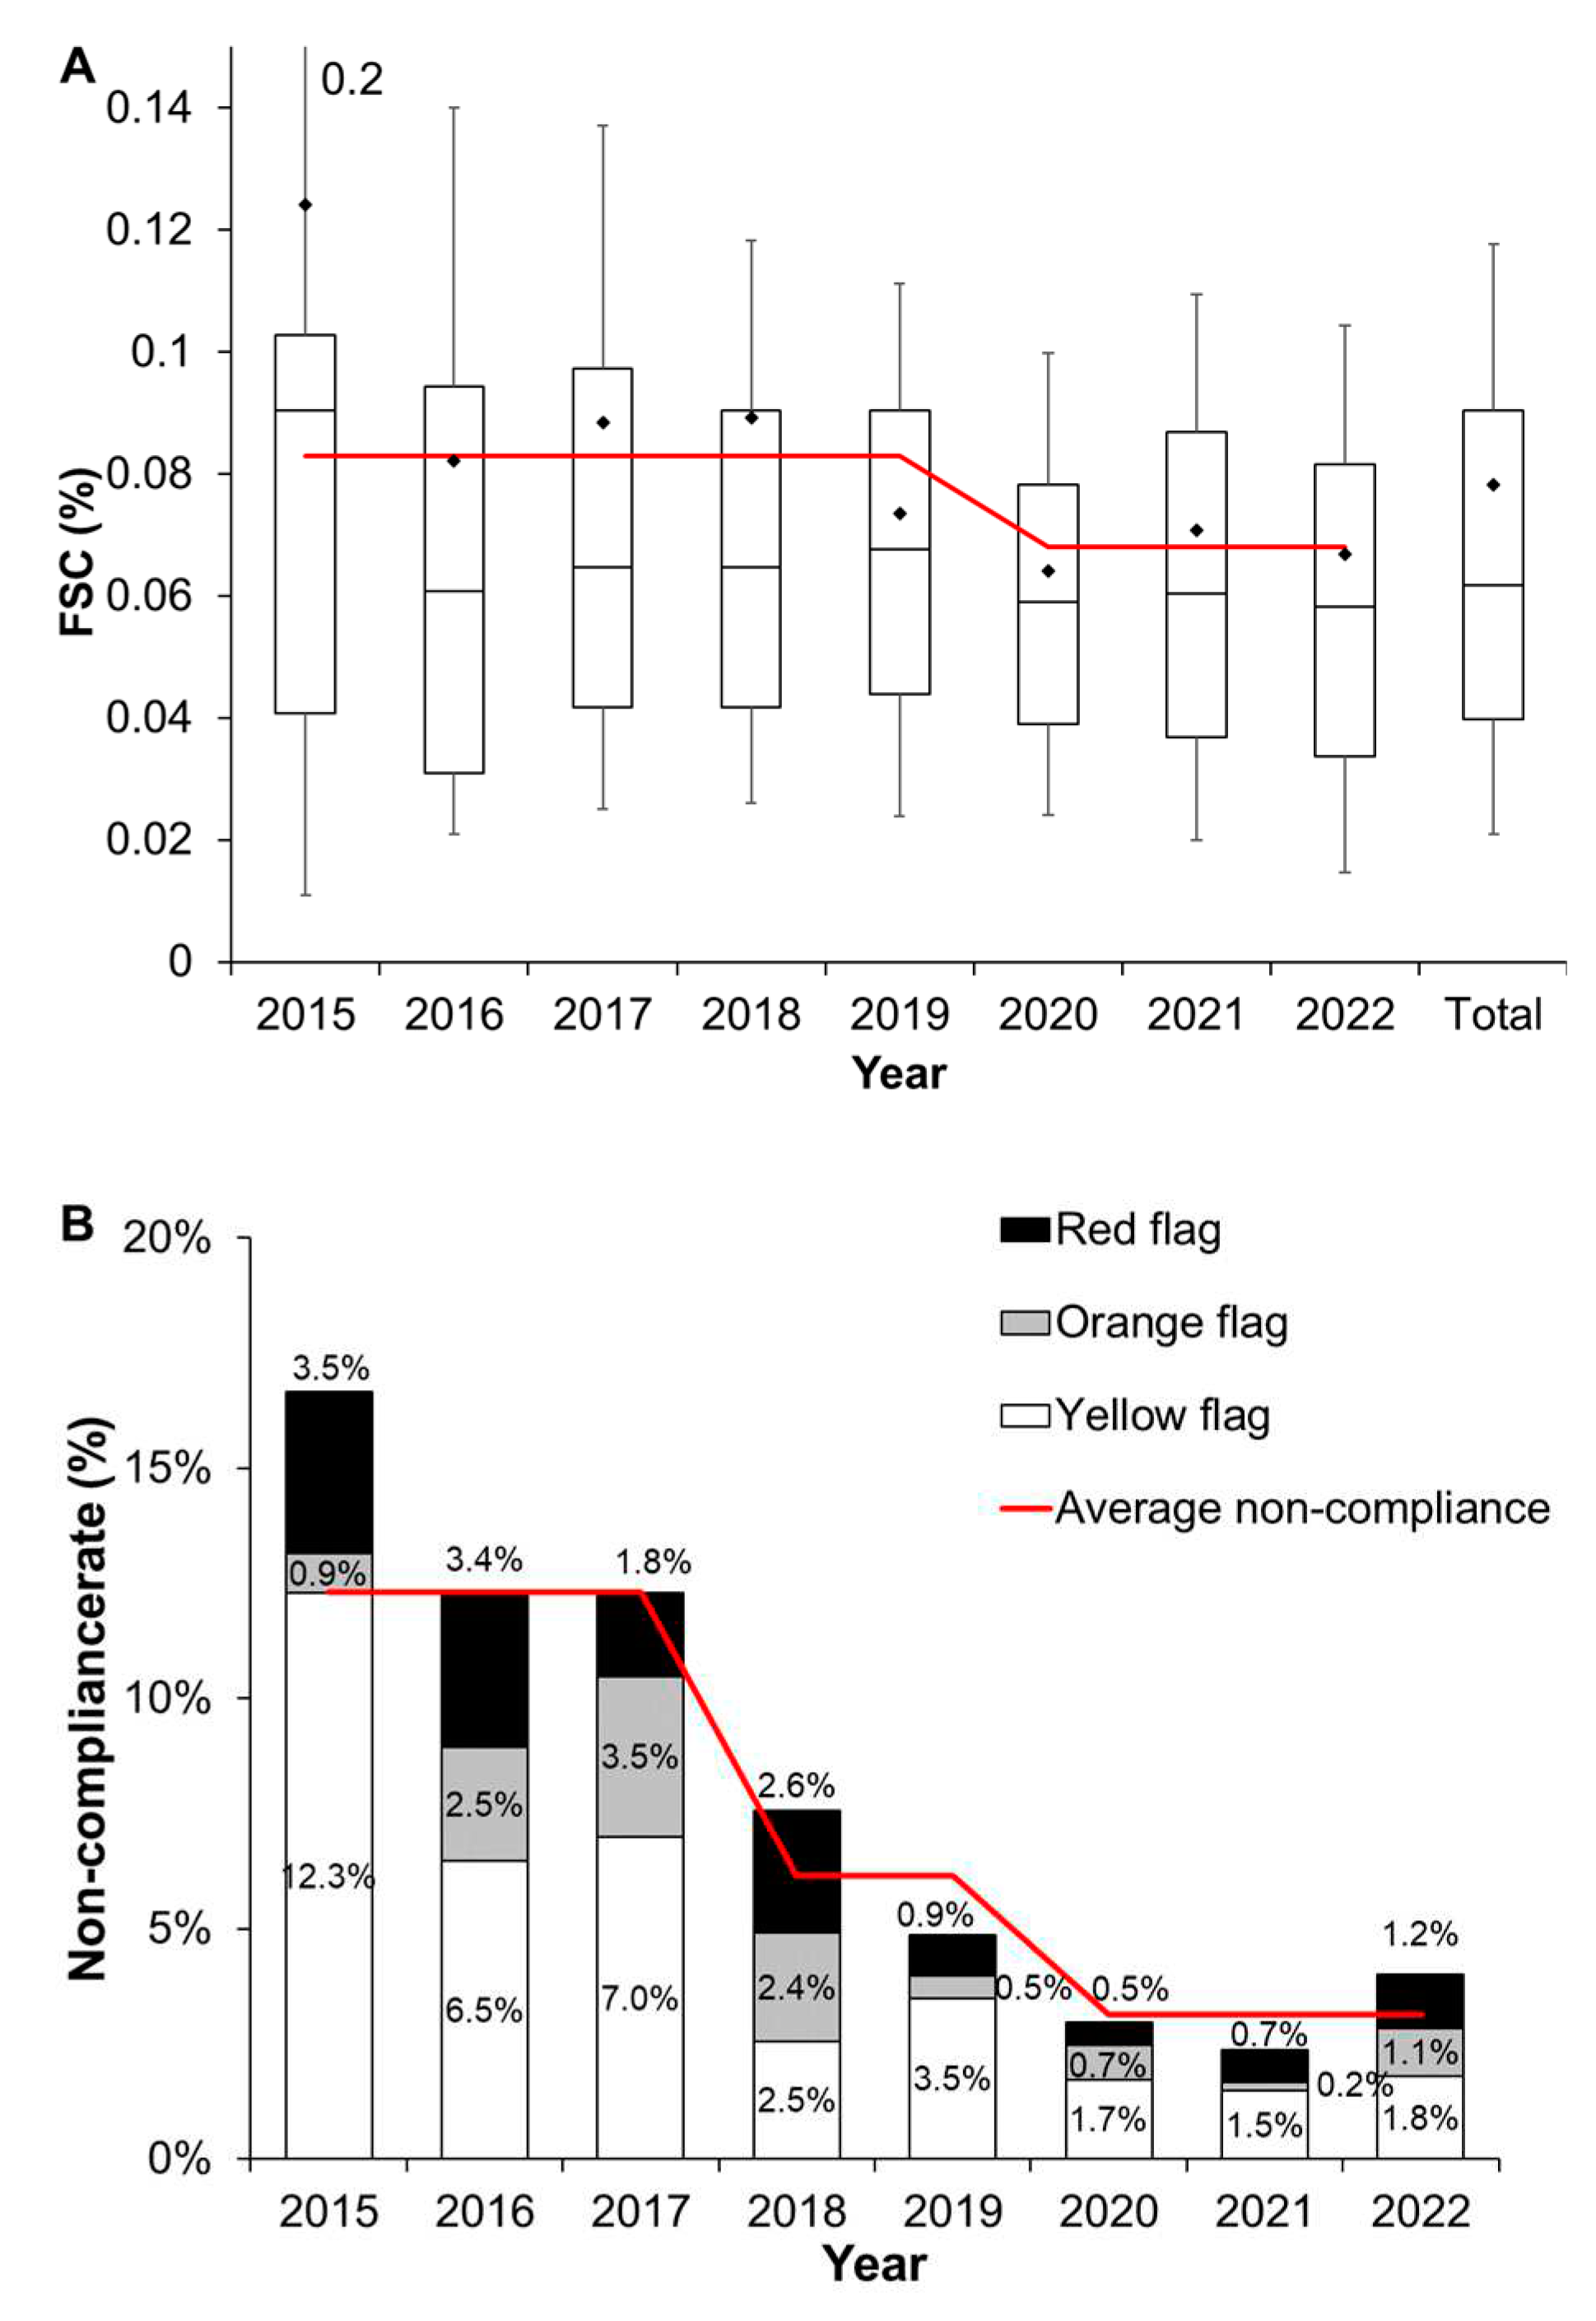
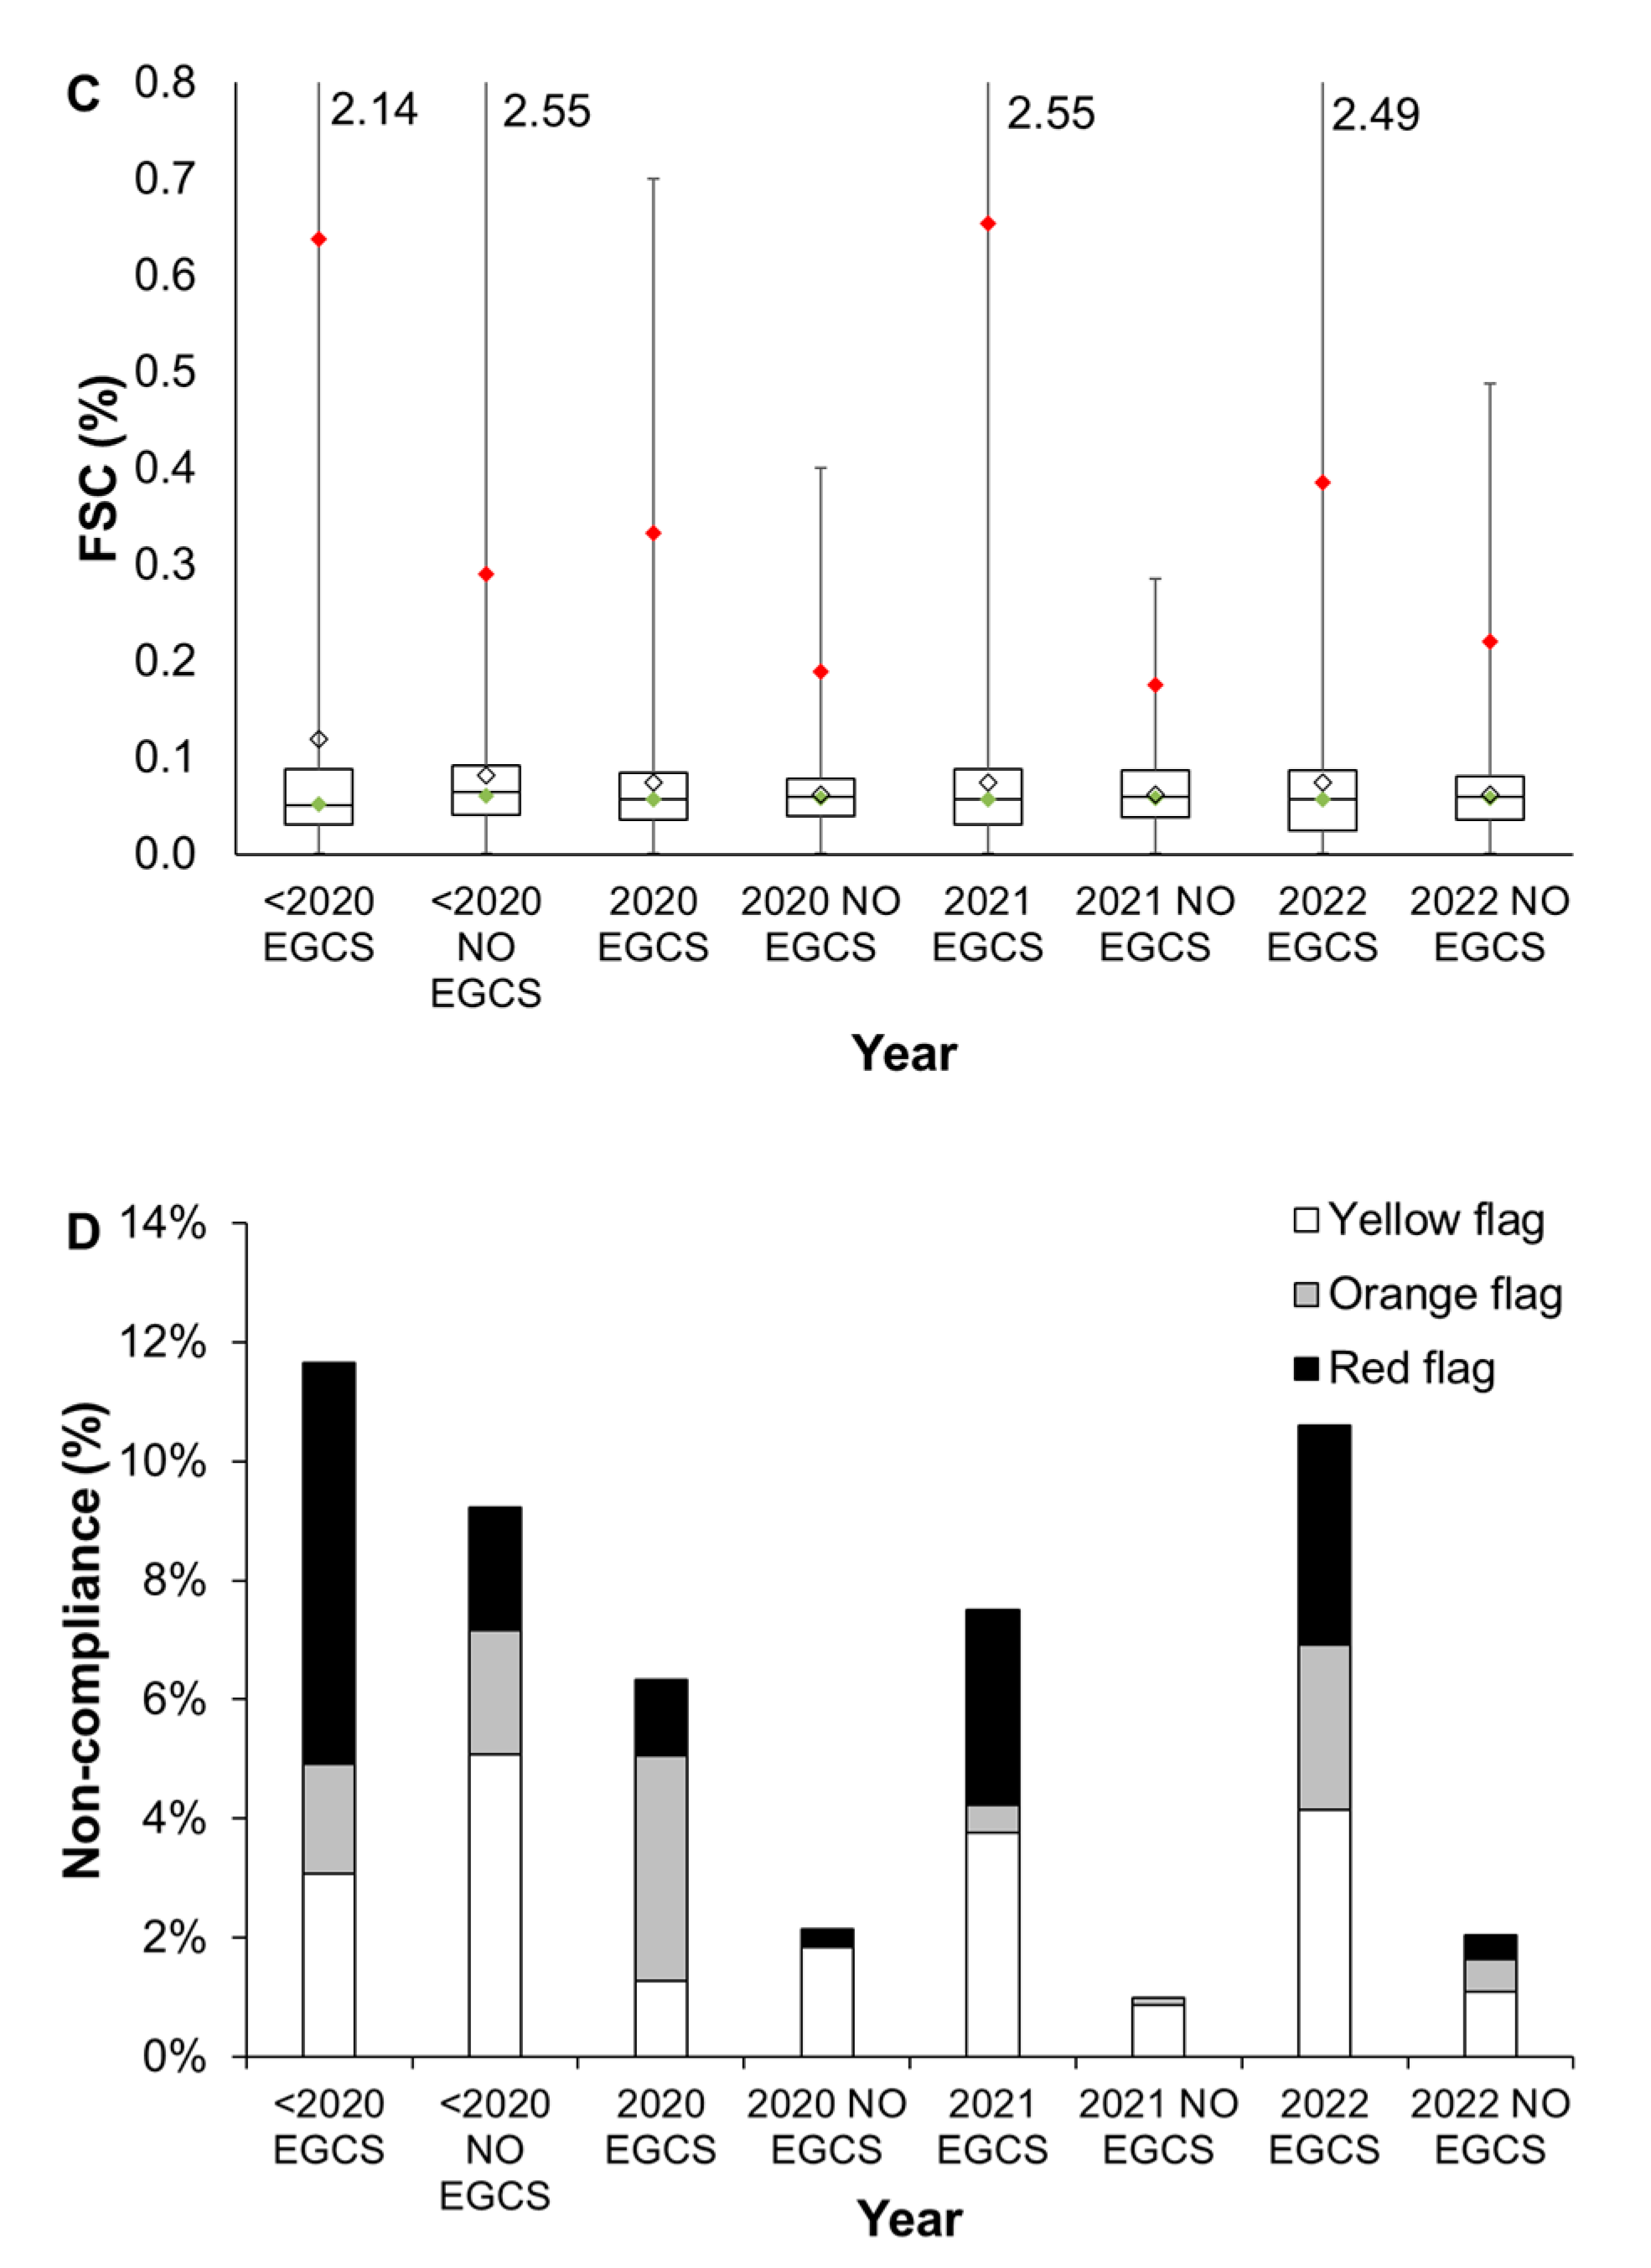
Figure 4.
Distribution of the engine load of the observed non-compliant OGVs for NOx.
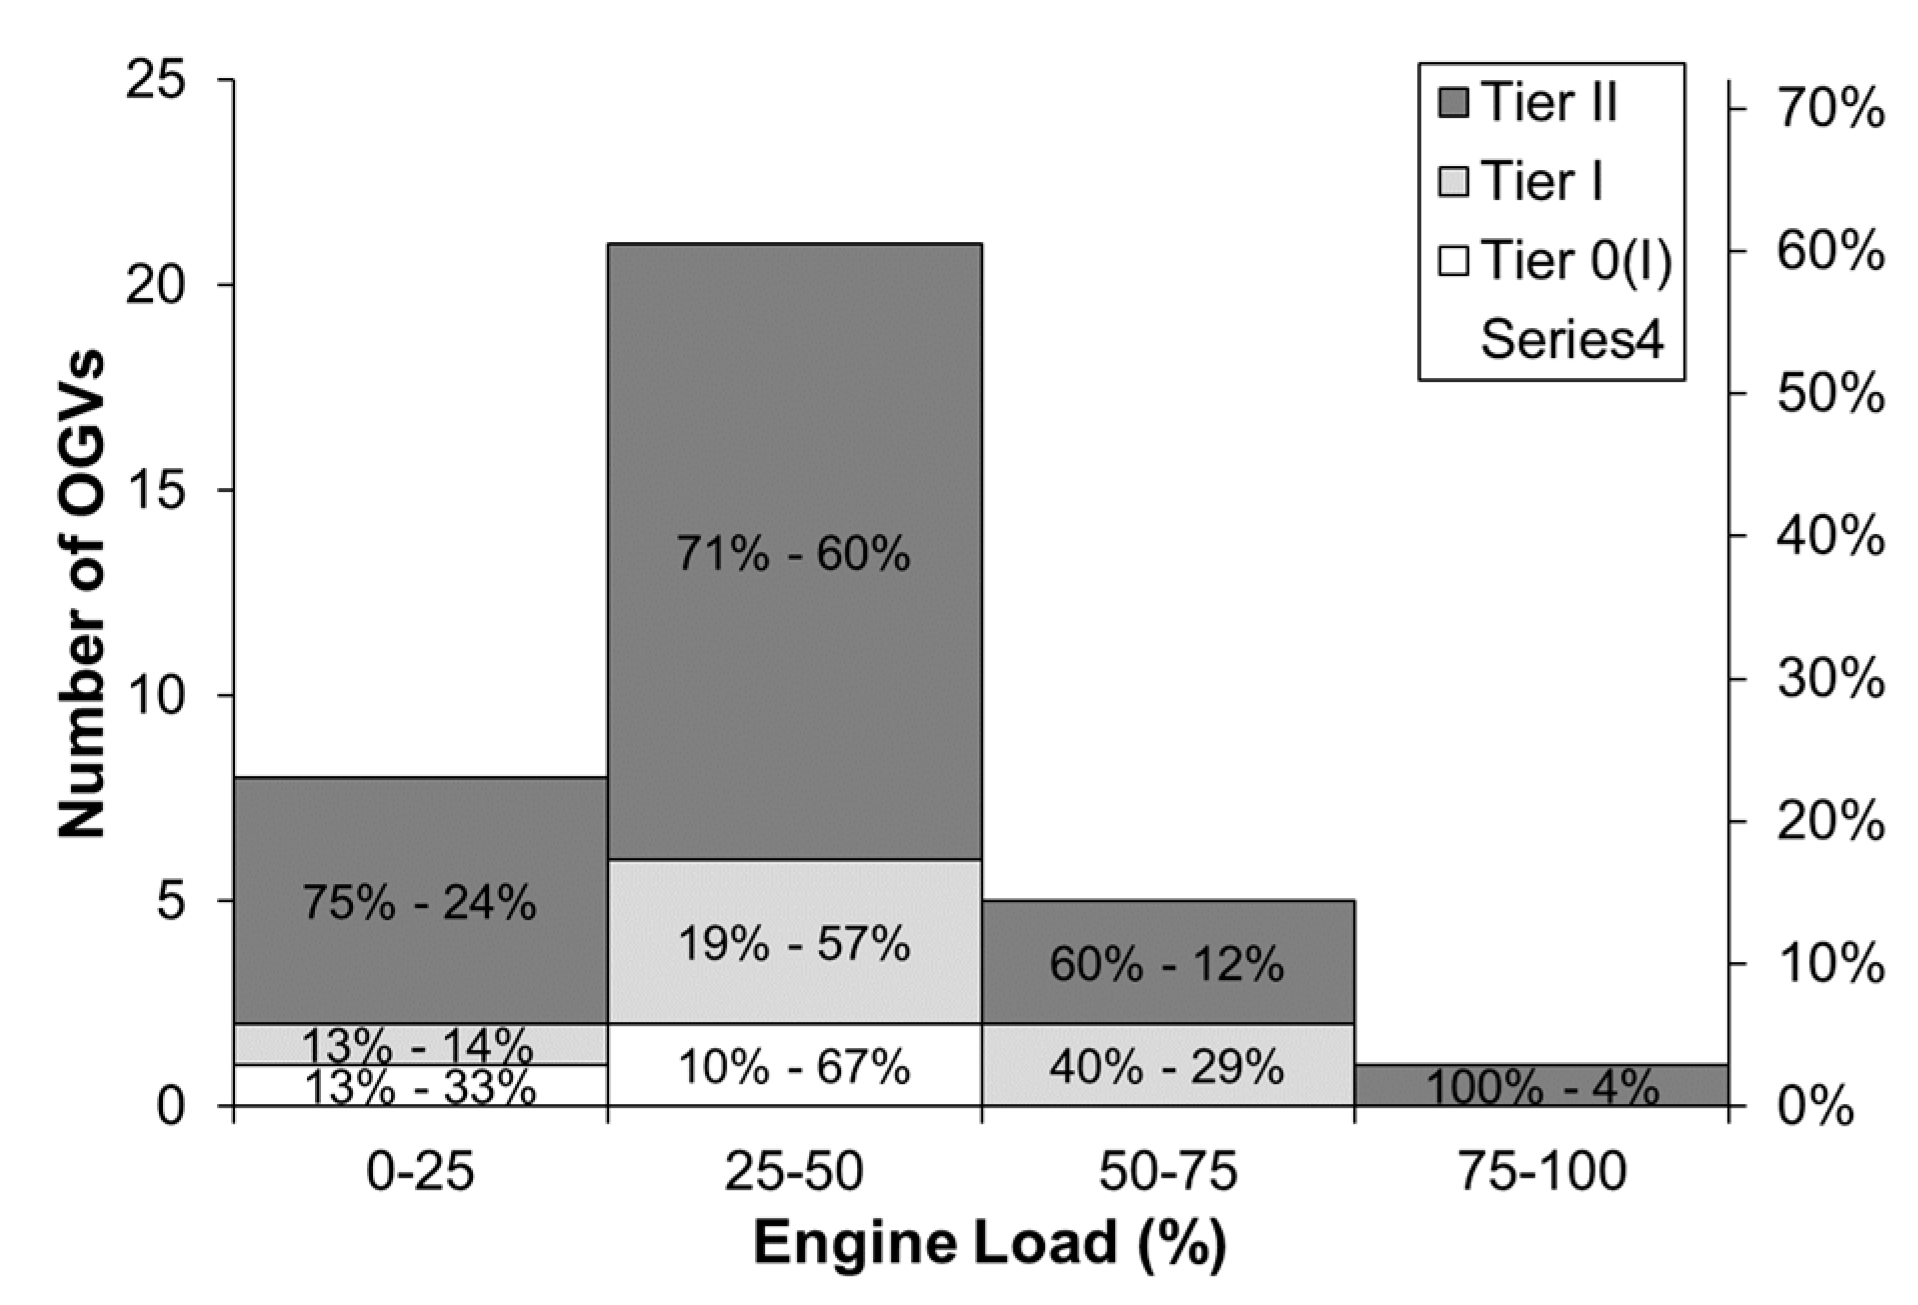
Figure 7.
Evolution of measured SO2 (left) and NOx (right) concentrations for inland coastal and non-coastal air quality measurements stations in Flanders (data obtained from VMM) [70].
Figure 7.
Evolution of measured SO2 (left) and NOx (right) concentrations for inland coastal and non-coastal air quality measurements stations in Flanders (data obtained from VMM) [70].
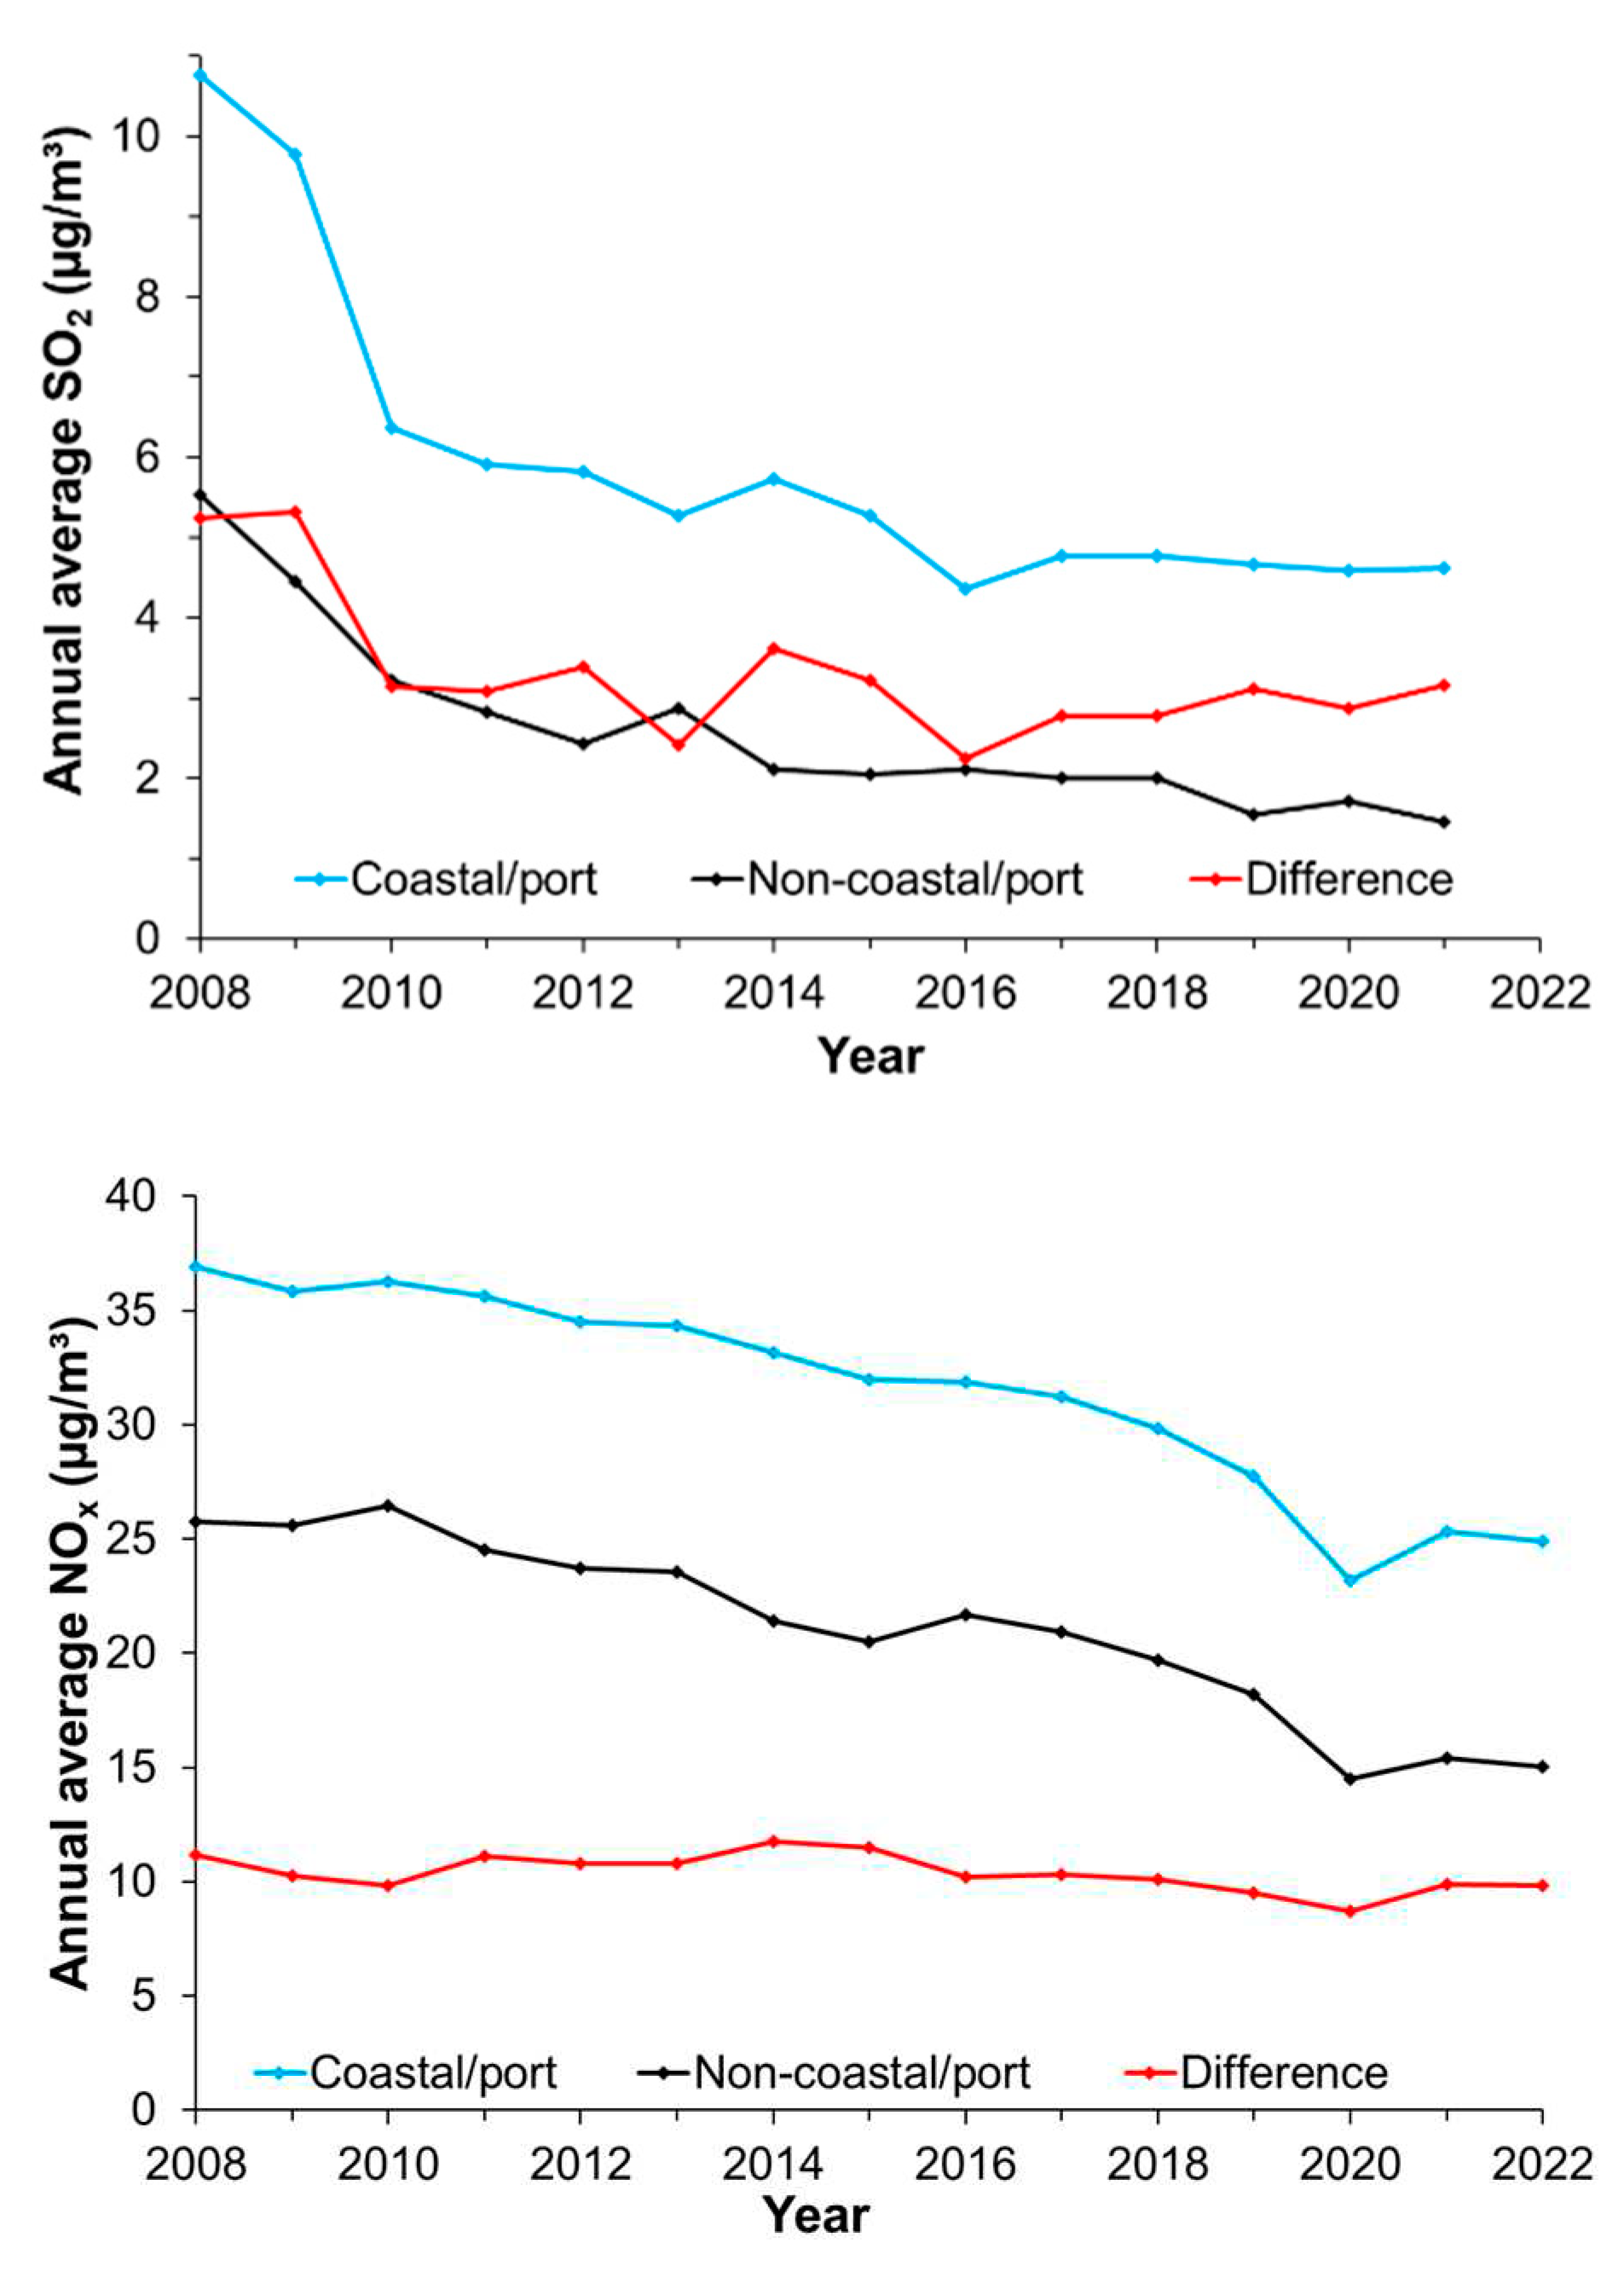
Figure 8.
Evolution of SO2 (A) and NOx (B) emissions from different sources for the region of Flanders with future trend unitll 2030 and contribution of shipping (data from 2000-2020 obtained from VMM)[70].
Figure 8.
Evolution of SO2 (A) and NOx (B) emissions from different sources for the region of Flanders with future trend unitll 2030 and contribution of shipping (data from 2000-2020 obtained from VMM)[70].
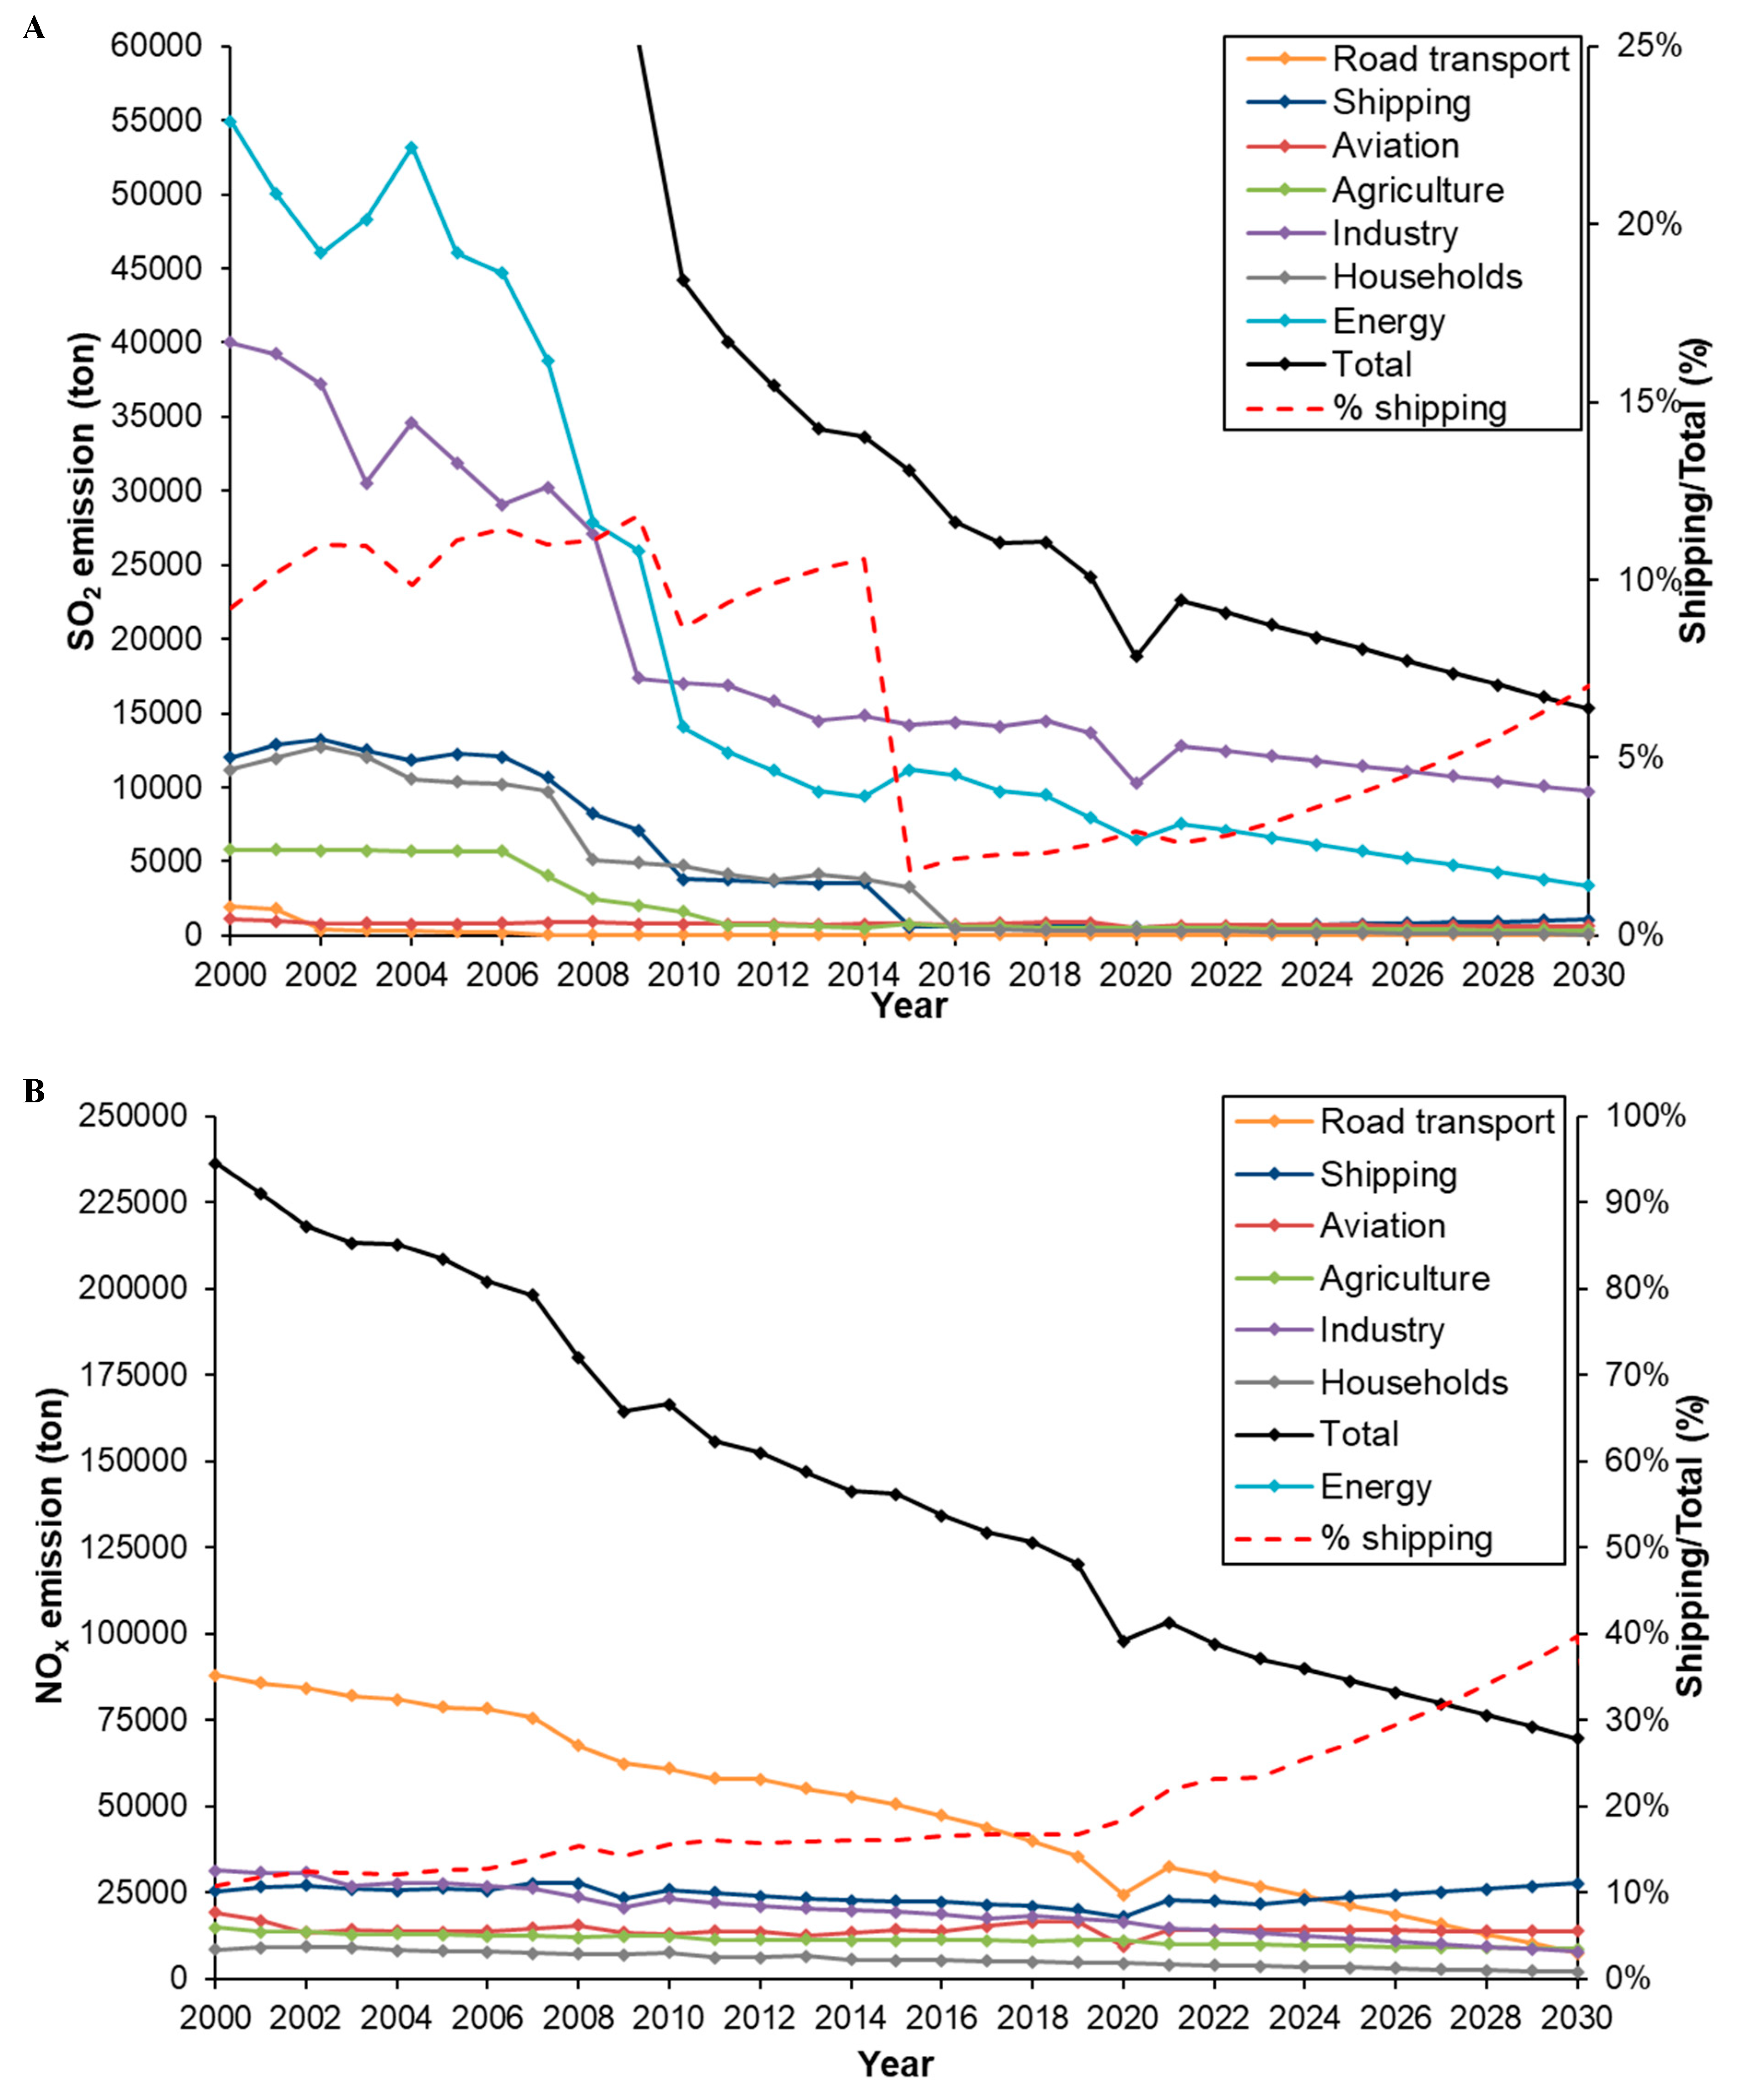

Table 1.
Alert flag thresholds for FSC as from 2015-2022 and for NOx from 2020-2022.
| Color flag | σ | U | CI | Sulfur limit | T | Tops | |||
| 2015-2019 | Yellow | 1 | 30% | 68% | 0.10% | 0.145% | 0.15% | ||
| Orange | 1.96 | 35% | 95% | 0.11% | 0.174% | 0.20% | |||
| Red | 2.576 | 43% | 99% | 0.15% | 0.275% | 0.40% | |||
| 2020-2022 | Yellow | 1 | 25% | 68% | 0.10% | 0.13% | 0.13% | ||
| Orange | 1.96 | 38% | 95% | 0.11% | 0.18% | 0.20% | |||
| Red | 2.576 | 48% | 99% | 0.15% | 0.29% | 0.30% | |||
| 2020-2022 (with n = 2) | Yellow | 1 | 18% | 68% | 0.10% | 0.12% | 0.12% | ||
| Orange | 1.96 | 27% | 95% | 0.11% | 0.15% | 0.15% | |||
| Red | 2.576 | 34% | 99% | 0.15% | 0.23% | 0.25% | |||
| Tier | LTier | Color flag | NTE | σ | U | T | Tops-20 | Tops-22 | |
| Tier I* | 17 | Yellow | 15% | 1 | 19.8% | 21.2 | 25 | 25 | |
| Orange | 20% | 1.96 | 44.5% | 31.8 | 35 | 35 | |||
| Red | 50% | 2.576 | 58.5% | 53.2 | 60 | 55 | |||
| Tier II | 14.4 | Yellow | 15% | 1 | 19.8% | 17.9 | 20 | 20 | |
| Orange | 20% | 1.96 | 44.5% | 26.9 | 30 | 30 | |||
| Red | 50% | 2.576 | 58.5% | 45.0 | 50 | 45 | |||
| Tier III | 3.4 | Yellow | 50% | 1 | 19.8% | 5.4 | 7 | 6 | |
| Orange | 60% | 1.96 | 44.5% | 7.5 | 9 | 8 | |||
| Red | 65% | 2.576 | 58.5% | 8.9 | 12 | 9 | |||
Disclaimer/Publisher’s Note: The statements, opinions and data contained in all publications are solely those of the individual author(s) and contributor(s) and not of MDPI and/or the editor(s). MDPI and/or the editor(s) disclaim responsibility for any injury to people or property resulting from any ideas, methods, instructions or products referred to in the content. |
© 2023 by the authors. Licensee MDPI, Basel, Switzerland. This article is an open access article distributed under the terms and conditions of the Creative Commons Attribution (CC BY) license (http://creativecommons.org/licenses/by/4.0/).
Copyright: This open access article is published under a Creative Commons CC BY 4.0 license, which permit the free download, distribution, and reuse, provided that the author and preprint are cited in any reuse.


