
Submitted:
20 April 2023
Posted:
21 April 2023
You are already at the latest version
Abstract
Abstract: The purpose of this study is to explore, from the perspective of government interven-tion, behavioral logic and game relationship among farmers, service organizations and the gov-ernment in the pest and disease control outsourcing system, as well as the endogenous motiva-tion of each subject. The results indicate that the stronger the willingness of each subject, the faster the stable state of joint pest and disease control among the three parties can be formed; In the case of implementing a single policy tool, the convergence rate of each party that imple-ments the regulatory policy alone is fast but may be unstable, while the rate is slow but more stable when a guidance- or incentive-based policy is solely applied; The effect of policy tool combination is much better than that of a single policy tool applied. The simultaneous imple-mentation of the three types of policy tools can form a policy system with both positive and negative mechanisms, which can maximize complementary and superposition effect.
Keywords:
Government intervention
; Pest and disease control outsourcing
; Evolutionary game
; Simulation analysis
; Policy instruments
1. Introduction
As an important production factor to control agricultural pests and diseases, chemical pesticides have played an indelible role in recovering agricultural losses and ensuring stable and abundant yields. However, due to decentralized operation and limited awareness and capability, small farmers are unable to master professional knowledge required for pesticide application, which leads to widespread pesticide abuse [1]. As revealed by the Ministry of Agriculture and Rural Affairs, the utilization rate of pesticides in China’s three staple foods was 40.6% in 2020 1. China is the world’s largest producer and consumer of pesticides, but its long-term excessive and inefficient use of pesticides has aggravated agricultural non-point source pollution, which has undermined the quality of arable land and the health of workers, and eaten away social welfare from agricultural economic growth [2]. Also, a series of risk hazards, like produce quality and safety, and ecological environment degradation, have been induced [3]. Practical dilemmas, such as “pesticide overdependence” and “increasing ecological imbalance”, need to be solved urgently. With the gradual deepening of specialized labor division, the separability of agricultural production and management activities has been continuously enhanced, and the development of producer services has offered a new path to help pesticide reduction and increase efficiency. However, compared with farming and harvesting practice where specialized services are relatively mature and standardized, the service quality of pest and disease control outsourcing (hereafter referred to simply as PDCO) is difficult to assess in a timely manner, the operational effects can only be seen afterwards, and its implementation is usually irreversible, thus causing complexity and uncertainty [4]. At present, the PDCO is adopted at a relatively low rate, about 41.9% coverage for the three major food crops in 20202. While governments at all levels pour in a lot of resources and energy to make up the shortcomings of producer services, they are constrained by different demands and behavior-oriented conflicts of all interest subjects; the development of PDCO is consequently sluggish, making it difficult to play its role in ensuring produce quality and safety and consolidating ecological benefits. Based on the above situation, the clarification of the behavioral logic and game relationship among the government, service organizations and farmers in the PDCO system can help to break the practical dilemma and accelerate the popularization and application of modern pest and disease control measures.
It has become the focus of recent discussions between the governments and academic circles how the restraining effect of the existing policies can be fully exerted on the production behavior of relevant subjects and how such policies can promote the transformational mode of modern agriculture, namely, from the extensive pattern, which relies on chemical elements, to the green and high-quality production mode. The policy research on how to guide farmers to apply pesticides scientifically and improve the involvement in agricultural production outsourcing has been overwhelming. But there is a relative lack of research results at home and abroad on the outsourcing behaviors of pest and disease control based on the policy level. Many scholars have verified the positive effects of farmers’ participation in social services on pesticide reduction behaviors through empirical studies [5-9], and put forward policy suggestions to promote farmers’ adoption of the outsourcing based on their respective priorities. For example, Ying and Xu stressed the need to strengthen training and guidance for professional farmers in pest and disease control [5]; Sun et al. suggested that incentives should be provided to large-scale farmers while highlighting the need to ensure relevant government subsidies should be transferred to farmers rather than outsourcing organizations [6]. However, the existing literature has rarely addressed the mechanisms of government and related policies on the outsourcing behaviors in agricultural pest and disease control. Duan et al. only introduced the variable of "whether or not to receive technical training" when exploring the factors influencing the outsourcing in technology-intensive links, but the results showed that the guidance policy for technical training provided by the government had no effect on the adoption of outsourced pest and disease control services by farmers [10]. Zheng and Zhao, based on the conventional game analysis framework, confirmed that the government’s intervention in pest risk control system could effectively reduce the cost of pest and disease control for all parties. In addition, the study found that subsidies or penalties could regulate outsourcing organizations’ market behaviors [11].
To sum up, the existing academic results provide a useful reference for this study to explore governmental actions in PDCO, but there is still room for more exploration. Firstly, the studies on PDCO often ended up with policy recommendations, with the failure to evaluate the effects of various policies. Secondly, the existing literature focuses on the behavioral responses of farmers, but few researchers have included government, service organizations and farmers into the same analytical framework, inevitably causing a lack of related research on modern pest and disease control systems. Thirdly, each game player constantly improves its own strategy through dynamic cost-benefit adjustment, and traditional game studies ignored such a dynamic process, so the picture of the change process of each player’s strategy at different policy levels tends to become ambiguous. In view of this, this study attempts to extend the above studies. First, based on the scientific division of different control policy tools for PDCO, the mechanism of these policies on PDCO is to be clarified. Secondly, from the perspective of an effective control subject, the dynamic relationship of the tripartite game model, which consists of a government, outsourcing organizations and farmers, for PDCO, and the equilibrium stability of the strategy combination, are to be constructed, together with further exploration into the endogenous motivation of each subject in PDCO. Finally, numerical simulation analysis is to be conducted to obtain the dynamic mechanism for different initial willingness of all subjects and for different combinations of policy tools on these subjects, in order to deeply reveal the evolutionary characteristics of decision-making behaviors of multiple interest subjects in China’s agricultural pest and disease control system, thus hopefully providing theoretical reference for the construction of a policy system for efficient PDCO.
2. Materials and Methods
2.1. Analysis of the path and mechanism of policy tools to regulate PDCO
The PDCO involves three subjects: farmers, service organizations and the governments, and a logical relationship is formed among the stakeholders as shown in Figure 1. First, farmers, who are decision makers of pesticide application, are not sensitive to the perception of ecological benefits in pest and disease control, but will weigh the economic benefits to determine application amount and operation mode. Secondly, agricultural socialized service organizations, as the promotion subject of PDCO, face the constraints of asset specificity and professional and technical level of their service personnel, and they are prone to breed "opportunistic behaviors" when considering the goal of maximizing their operating benefits in actual service process. In addition, the government plays a vital role in regulating farmers’ use of chemical inputs [12]. In order to ensure the quality and safety of agricultural products and protect the ecological environment, the government has implemented a number of policy tools to promote outsourcing services for pest and disease control.
The essential attribute of regulation exists in its "binding nature" [13]. According to the related research conducted by Zhao et al. [13], Wang et al. [14]and Huang et al. [15], combined with actual policy measures implemented by the Chinese agricultural and rural authorities in PDCO, the policy tools implemented by the government are classified into three types according to impact path and mechanism setting of policy tools, with the regulatory path and mechanism shown in Figure 2.
The first type is the guidance-based policy. The government implements a guidance-based policy to provide technical guidance, training, publicity and education to farmers and service organizations, so that both can develop their production awareness and master production techniques. In doing so, the government can effectively transmit information to strengthen the awareness and participation of farmers and organizations in outsourcing agricultural pest and disease control. In 2020, Premier Li Keqiang signed the Decree of the State Council, requiring relevant departments at or above the county level to provide technical training and guidance for specialized pest and disease control service organizations in the published Regulation on the Prevention and Control of Crop Disease and Pests. In December 2022, the Ministry of Agriculture and Rural Affairs of the People’s Republic of China held a national video training course on the prevention and control of wheat and rape diseases and insect pests, aiming to enhance the awareness and knowledge skills of grass-roots agricultural technicians and farmers, and improve the prevention and control capacity.
The second is the incentive-based policy. Such policies are implemented with an aim to provide market-based incentives to organizations and farmers to change relative prices of production factors, to generate income effects, and ultimately to choose control methods as advocated by the government. Farmer’ adoption of positive pest and disease control services provided by service organizations can produce environmental effects, which can be shared by others, and some economists, who follow the Pigou’s tradition, advocate government intervention and subsidies to internalize the positive externalities of environmental improvements [16]. If the organization provides positive PDCO services, it needs to purchase more professional equipment and machinery, equip higher quality service personnel, and invest more time and energy in the service. The government will provide corresponding machinery purchase subsidies or loan subsidies for the positive control services of the organization. If farmers purchase PDCO services, the government will provide incentives for farmers’ outsourcing control attitude and provide corresponding service subsidies or pesticide subsidies to farmers. In 2017, the state introduced the subsidy policy for agricultural production trusteeship, which was intended to be an incentive tool, with the aid of subsidy, to make up for the weakness of agricultural production trusteeship [17].
The third involves regulatory policy. Such policies regulate the non-standard conduct of the subjects through coercive means, which, in return, urge them to participate in modern pest and disease control. Under the decentralized management pattern, there are a large number of small farmers in China, and the non-point source pollution caused by pesticide application by the farmers is in a hidden and scattered state, so it is difficult and costly for the government to control it [18]. Therefore, considering the difficulties in practical governance, regulatory policies in this study are only used to regulate service organizations. When a service organization provides negative services, the government will charge a fine to it, restrain its negative service behavior by increasing the service cost of the organization, and promote the organization to provide positive and effective services in the reverse direction. However, negative prevention and control services provided by the organizations, which have been regulated and punished, are considered as uncertain events. The reason is that the information on ineffective services of the organizations cannot be easily accessible in a timely and effective manner. In addition, due to economic performance assessment, some village leaders may ignore or shield unscientific pesticide application by service organizations.
2.2. Problem description and model setting
There exists a typical principal-agent relationship for farmers to choose PDCO services, which is limited by asymmetric information and conflicting interests among the main subjects; as a result, a dynamic evolutionary game appears when decision makers face such choices. The classical game theory requires acting subjects to be fully rational and to have complete information when making decisions, but that is difficult to be met in reality. Evolutionary game is different from classical game that focuses on static equilibrium and comparative static equilibrium, but emphasizes dynamic equilibrium. Therefore, in evolutionary game, participants are not required to be completely rational, and the conditions of complete information are not required. This study assumes that farmers, outsourcing organizations and the government all have bounded rationality. All three stakeholders have two behavioral strategies: among them, farmers can choose outsourcing control or self control, which is recorded as ; a service organization can provide positive or negative pest and disease control services, which is recorded as ; and a government behavior strategy involves the application or non-application of policy tools, which are noted as . It is assumed that the total number of farmers, service organizations and local governments remains relatively stable in a given region. At the time T, the probability of farmers choosing outsourcing control strategy is , and ; the probability of the service organization choosing active control service strategy is , and ; and the probability of the local government choosing to apply policy tools and strategies is , and .
2.2.1. Setting of the profit and loss variables for the farmers
When farmers control pests and diseases on their own, the cost and the benefit are and respectively, and . If farmers purchase outsourced services, they will need to pay service fees . If positive services are purchased, they will help apply pesticides scientifically, thus promoting the improvements in crop yield and quality, and helping to improve farmers’ production efficiency, at which point farmers gain additional benefits , while no additional benefits will be gained if negative services are purchased.
2.2.2. Setting of the profit and loss variables for the service organization
When the service organization provides a negative service, the production and operation cost is . If a positive service is provided, the production and operation cost will increase on top of negative prevention and control . Regardless of the services provided, the organization will benefit and gain as long as the farmer adopts the outsourced service. When a negative service is provided to and adopted by the farmer, the service organization will suffer from reputational damage for providing such a service .
2.2.3. Setting of the profit and loss variables for the government
The cost for the government to implement the outsourcing control policy of pest and disease control is taken as . In addition, when providing a guidance-based policy, the government provides technical promotion trainings, publicities and education activities to outsourcing organizations and farmers by the unit and respectively, with a unit input being , assuming that the benefits of the service organization and the farmer are equal to what the government contributes. When an incentive-based policy is provided, if the service organization provides positive services and the farmer purchases such outsourced control, the government will offer both and subsidy, respectively. When providing a regulatory policy, if the outsourcing organization provides negative services, the government charges it the penalty , assuming , and the probability of being regulated and penalized is . When the state introduces relevant policy tools, it needs to take into account the pricing that will not affect market services, so this paper assumes . In addition, farmers’ adoption of positive control services provided by service organizations is beneficial to the improvement of ecological environment, and the government obtains ecological benefits . However, if the government fails to curb the negative control behavior of service organizations, the loss of trust and reputation from the public will result. At this point of time, the total loss of the government is , and . When the three parties cooperate in pest and disease control, the special subsidies and incentives given by the superior government to the local government amount to .
2.3. Model building and strategy solution
Based on the model hypothesis, the game payment matrix of three subjects involved in agricultural pest and disease control under different strategies is constructed from the perspective of government intervention, as shown in Table 1.
When farmers choose outsourced control strategy and self-control strategy in pest and disease control, the expected returns are:
The average expected returns from pest and disease control for farmers are.
Then, the replicator dynamics equation for the farmer’s behavioral strategy is
Similarly, the replicator dynamics equations for the service organization and government behavior strategies are obtained as
3. Results and Discussion
3.1. Analysis of the stability of the strategy of the three game subjects
3.1.1. Analysis of the stability of farmers’ strategies
Taking the derivation of the farmer’s replicator dynamics equation with respect to , we can obtain:
According to the stability theorem of the differential equation, the probability of farmers choosing outsourced control is in a stable state and must meet and . Therefore, when , and , at this time whatever value takes is in the evolutionary stable state; when , and , at this time is the farmer’s evolutionary stabilization strategy; conversely, and when , at which point is the farmers’ evolutionary stabilization strategy. The evolution phase diagram of farmers is shown in Figure 3:
Figure 3 shows that the probability of farmers steadily choosing outsourced control and self control are the volumes of and , respectively. Through computation, we can obtain:
Inference 1: the probability of farmers’ stable choice of outsourced prevention and control is positively correlated to the government’s guidance and incentive supports and to the additional benefits brought by positive control services, but negatively to service costs .
Demonstration: according to the expression of the probability that the farmer chooses to outsource the control, the first-order partial derivatives of each element can be obtained as , , and . Therefore, the increase of and or the decrease of can increase the probability of farmers choosing outsourced control.
Reference 1 suggests that the guarantee of farmers’ economic benefits can promote their choice of outsourced control. First, the government implements guidance-based policies to change farmers’ perceptions and awareness, while the related price of the services is changed through subsidies, which, in turn, stimulates farmers to evolve towards outsourced control; secondly, farmers gain additional benefits by adopting positive control services, which is directly contributive to the outsourced control; and thirdly, the reduction in the cost of outsourced control services cuts down farmers’ operating expenses, which also helps to promote the choice of outsourced control.
Inference 2: in the evolution process, the probability X of farmers choosing to outsource the prevention and control will increase with the probability Y of service organizations providing positive services and with the probability Z of government applying policy tools.
Demonstration: according to the stability analysis of farmer’s strategy, indicates that is negatively correlated to Z. When , is the evolutionary stabilization strategy for farmers; conversely, when , is the evolutionary stabilization strategy for farmers. Thus, as Y and Z gradually increase, the stabilization strategy of farmers evolves from self-control to outsourced control.
Reference 2 suggests that enhancing the probability of service organizations to provide positive control services and that of the government to apply policy tools will help farmers choose outsourced control as a stabilization strategy. Government departments can not only positively promote service organizations to provide positive services through guidance- and incentive-based tools, but also increase the service cost for organizations with the help of regulatory penalties, which in turn inhibits their negative service behaviors. Namely, the government’s application of policy tools can help form a positive and orderly market for efficient services, and enhance the probability of service organizations to provide positive control services; farmers can gain additional benefits from these services, thus further driving them to choose outsourced control.
3.1.2. Analysis of the stability of service organizations
The derivation of the replicator dynamics equation for the service organization with respect to can obtain:
Similarly, according to the stability theorem of differential equations, when , , and , at this time whatever value Y takes is in an evolutionary stable state; when , , and , at this time is the evolutionary stable strategy; when , , and , at which point is the evolutionary stabilization strategy. The evolutionary phase diagram of the service organization is shown in Figure 4:
Figure 4 shows that the probability of stability section of positive and negative control services is volume and , respectively. Through computation, we can obtain:
Inference 3: the probability of service organizations stabilizing their choice of positive control services is positively correlated to government-directed support, incentive subsidies and regulatory penalties and reputation loss when negative services are provided, and negatively to the increased cost of positive services relative to negative services .
Demonstration: according to the expression of the probability of service organization choosing positive control services , the first-order partial derivative of each element is obtained as , , . Thus, either an increase in and or a decrease in can increase the probability that a service organization will choose positive control services.
Inference 3 suggests that ensuring the operating benefits of service organizations can promote service organizations to choose positive control services. First, the government enables the organizations to master advanced techniques and improve their professionalism through guidance-based policies, while the incentive-based policies guarantee that organizations can receive subsidies when they positively serve, thus prompting them to provide positive control services. In addition, regulatory penalties increase the cost of negative services and help to reduce opportunistic behavior. Secondly, the greater the loss of reputation of service organizations in providing negative services, the more difficult it is to secure their operating profits, which, in turn, motivates them to provide positive and effective services. Thirdly, the greater the difference between the costs of positive and negative services, the greater the room for service organizations to provide negative services profitably, and consequently, the organizations may take risks and choose to provide negative service to seek high profits.
Inference 4: in the evolution process, the probability Y of service organizations providing positive control services increases with the probability X of farmers outsourcing the services and with the probability Z of government applying policy tools.
Demonstration: through the stability analysis on service organization strategies, indicates that is negatively correlated to Z. When , is the evolutionary stabilization strategy for farmers; conversely, when , is the evolutionary stabilization strategy for farmers. Thus, as X and Z gradually increase, the stabilization strategy of the outsourcing organization evolves from negative to positive control services.
Inference 4 suggests that increasing the probability that farmers choose outsourced control and that the government applies policy tools can prompt service organizations to provide positive control services as a stabilization strategy. Therefore, to promote the formation and healthy development of agricultural PDCO market, and to ensure that service organizations provide positive and effective services, it is necessary for the governments to implement policy tools to guide and motivate farmers to raise production awareness, reduce service costs, and adopt outsourced control.
3.1.3. Analysis of the stability of the government’s strategies
Taking the derivative of the government’s replication dynamic equation with respect to , we can obtain:
Similarly, according to the stability theorem of differential equations, in the case of , when , , and , at this time whatever value takes is in an evolutionary stable state; when ,,, at this time is the evolutionary stable strategy ; when , , is the evolutionary stabilization strategy. The evolutionary phase diagram of the government is shown in Figure 5.
Figure 5 shows that when , the probability that the government stably chooses the application or non-application of policy tools is the volume of and , respectively. Through computation, it can be obtained that:
In addition, when , the probability of government stabilizing the application or non-application of policy tools is shown in the volume of and in Figure 5 respectively, but at this time , while the volume formula for and includes , thus the discussions on farmers’ evolutionary strategies at becoming meaningless. To sum up, only the relevant cases at the time of will be discussed subsequently.
Inference 5: the probability of the government’s stable selection of policy tool application is positively correlated to the reputation loss when negative services from service organizations are not regulated, to the revenue from fines on negative services, and to special subsidies and incentives earned in the tripartite concerted control, but negatively to the total cost of implementing regulatory policies , to inputs in promoting guidance-based policies , and to subsidies and when implementing incentive-based policies.
Demonstration: according to the expression of the probability of the government’s stabilizing the application of policy tools, the first-order partial derivatives of each element are obtained as follows: , , , , , , , and . Therefore, the increase of , , and or the decrease of , , , and can all increase the probability of the government choosing to apply policy tools.
Inference 5 suggests that the key to the government’s application or non-application of policy tools is limited by fiscal pressures. The greater the reputation loss caused by the government’s inaction in the service organization’s negative control, and the higher the amounts of special subsidies and rewards given by higher authorities, the more it can motivate the government to strictly implement policy tools. In addition, setting a heavier penalty amount and greater penalty probability for negative services from service organizations can promote strict fulfillment of policy tools by government regulators. However, the higher the cost of implementing regulatory policies, the higher the inputs into the settings of incentive- and guidance-based policies, and the higher the financial burden of the government faces, which in turn reduces the probability of applying policy tools.
Inference 6: in the evolution process, the probability Z of government applying policy tools decreases with the increase of the probability X (of farmers outsourcing control services) and with the probability Y (of service organizations providing positive control services).
Demonstration: from the analysis on government strategy stability, when , indicates that is negatively correlated to Y. When , is the government’s evolutionary stability strategy; conversely, when , is its evolutionary stabilization strategy. Thus, as X and Y gradually increase, the government’s stabilization strategy evolves from application to non-application of policy tools.
Inference 6 suggests that increasing the probability that farmers choose to outsource control services and that service organizations adopt positive control services can both prompt the government to opt for non-application of policy tools as a stabilization strategy. After the probability that farmers choose outsourcing and that service organizations opt for positive control services reaches a certain level, government departments choose not to use policy tools as a stabilization strategy, in order to improve capital utilization and reduce financial burden. Therefore, when farmers and service organizations can effectively promote benign operation of PDCO, the government chooses not to intervene in PDCO system.
3.2. Stability analysis of equilibrium point of three-party evolutionary game system
From the replicator dynamics equation of the behavioral strategies of farmers, service organizations and the government, the replicator dynamics system for the three main players in agricultural pest and disease control can be obtained.
The Jacobian matrix of agricultural pest and disease control:
According to Lyapunov’s first methodology, when all eigenvalues of Jacobian matrix are negative, the equilibrium point is the asymptotic stability point; when at least one of the eigenvalues of Jacobian matrix is positive, the equilibrium point is unstable. However, when Jacobian matrix has zero eigenvalue and all the other eigenvalues are negative, the stability of the point cannot be determined. When , 8 equilibrium points from replicator dynamics system for agricultural pest and disease control can be obtained. The evolution of mixed equilibrium points is not considered here, because the mixed equilibrium points must have the characteristic value of 0, which does not fit the evolutionary stability strategy. (ESS, evolutionarily stable strategy). Combined with the profit and loss variables settings and descriptions of the three subjects, the stability analysis of equilibrium point is shown in Table 2. From Table 2 it is easy to obtain that at the equilibrium points (0, 0, 0), (0, 1, 0), (0, 1, 1), (1, 0, 0) and (1, 0, 1) there exists at least one positive eigenvalue, therefore these five equilibrium points are not evolutionarily stable strategies.
Inference 7: When the condition ① is met, (0, 0, 1) in the replicator dynamics system is the equilibrium point.
Demonstration: under the condition ① , the equilibrium points of (0, 0, 1) have negative eigenvalues , thus at this time (0, 0, 1) is the asymptotically stability point of the system.
Inference 7 shows that when the cost difference between a positive service and a negative service is higher than the sum of the government’s guidance, subsidies, rewards and penalties, it indicates that potential benefits obtained by the organization from the government for the positive service cannot cover its increased cost, so it chooses to provide negative ones. For farmers, because of negative control services provided by service organizations, they cannot receive additional benefits from yield and quality, and the government’s guidance and incentive supports can hardly offset the service cost of outsourced control, as a result they turn to self control after comprehensive consideration of economic benefits. At this point of time, although the government applies policy tools, the guidance, rewards and penalties from policy tools are low, which has little effect on changing the behavior of farmers and outsourcing organizations.
Inference 8: when the condition ② is satisfied, (1, 1, 0) in the replicator dynamic system is the equilibrium point.
Demonstration: under the condition ② the equilibrium points (1, 1, 0) have negative eigenvalues, and thus at this time (1, 1, 0) is asymptotically stable points of the system.
Inference 8 shows that, when the sum of the cost in implementing the government’s PDCO policy is greater than the supports and rewards from the superior government, that is, when the government sets the guidance- and incentive-based policy tools at a higher level of support, the government will eventually not intervene in pest and disease control system through evolutionary game, and at the same time, both farmers and service organizations can achieve an ideal pest and disease control state on their own, indicating that both farmers and service organizations can gain higher benefits from it. After a benign and effective market operation system has been formed between farmers and service organizations, the government will no longer impose policy tools in consideration of fiscal savings.
Inference 9: when the condition ③ is satisfied, (1, 1, 1) in the replicator dynamic system is the equilibrium point.
Demonstration: under the condition ③, the eigenvalues of the equilibrium point (1, 1, 1) are all negative, thus at this point (1, 1, 1) is asymptotically stabilization points of the system.
Inference 9 shows that when the sum of government expenditures on policy tools is less than that of special subsidies and rewards from higher-level governments, that is, the regulation of policy tools is relatively small, the government can effectively regulate the behaviors of farmers and organizations by applying policy tools. This suggests that a "gradual and incremental" policy tool will not impose a fiscal burden on the government, and will guarantee market order free from disturbance. The “one-step but anticlimactic" policy tool may quickly achieve a good governance, but it will cause serious financial pressure to government departments, and most importantly, it may disrupt the order on the service market, thus not conducive to the stable and sustainable development of modern pest and disease control system.
3.3. Numerical simulation and analysis
In order to assess the validity of the evolutionary stability analysis, the model is assigned numerically in combination with the realistic situation, and the numerical evolutionary simulation analysis is carried out using Matlab2021a. The values of the profit and loss parameters are assigned as shown in Table 3.
3.3.1. Simulation analysis of the effect of initial willingness on stabilization strategy
Figure 6 simulates the effect of simultaneous changes in the initial willingness of the three subjects on the ultimately stable evolution results. It can be concluded that the initial willingness of the three parties is at a lower level (0.4), it eventually evolves into (0, 0, 1). At this point the convergence rate is fastest for farmers, intermediate for the government, and slowest for service organizations. When the initial willingness of the three subjects is increased to 0.6 and 0.8, the final evolution result is (1,1,1). A detailed analysis of the evolutionary process at these two willingness levels reveals that the higher the initial willingness, the faster the convergence rate of the three parties to 1, and the earlier the state of the three-party collaborative pest and disease control can be achieved. In the process of evolution, the convergence rate of farmers is slightly faster than that of service organizations, while the government is at the slowest rate. Thus, it can be seen that when the initial willingness of all parties is low, although the government applies policy tools to try to regulate the behaviors of other two parties, the effect of the policy tools remains invisible. After the initial willingness of all parties reaches a certain level, the application of policy tools by the government can effectively coordinate the behavioral choices of farmers and service organizations, thus contributing to the formation of a good outsourcing environment for pest and disease control.
3.3.2. Simulation analysis of the impact of single policy tool on stabilization strategies
The initial willingness of the three parties is set 0.6, and the impact of implementing only a single policy tool on the final stabilization evolutionary outcome is compared and analyzed, and the changes of each parameter and the evolution result are shown in Figure 7. When the three policies are at a low level, i.e., , , , and , , , and = 19, the final evolution of results is ( 0, 0, 1); and when the level of guidance, incentive and regulation is further improved, it can effectively promote the tripartite subjects to collaborate in efficient pest and disease control, which eventually evolves to (1, 1, 1). The reason for this is that at a low policy level, the government support is difficult to offset the increased cost when farmers and service organizations choose positive externality behaviors, and in order to maximize profits, each will choose negative externalities with higher returns. Previous studies have established the results of a single guidance-based policy [19-21], regulatory policy [22,23] and incentive-based policy [24], analyzed the ameliorative effects of farmers’ excessive pesticide application, and confirmed that the above policies were particularly important for regulating safe application behaviors. In addition, Jiao and Liu, Han et al. agreed that subsidies for key production links could effectively enhance the participation behavior of land trusts. However, none of the above studies analyzed how the effect of each policy tool changed when the implementation intensity changed from weak to strong.
In the evolutionary convergence process of the three subjects, regulatory-type policies have the fastest convergence rate, and the evolution of guidance- and incentive-based policies is relatively slow. This is due to the low cost in implementing regulatory policies, and driven by coercive means to achieve the goal quickly, but the implementation of the policy alone has not yet fundamentally solved technical and financial constraints faced by other subjects in practice, which may lead to the difficulty in maintaining the cooperation status in a long term. At present, the Chinese government attaches great importance to the implementation of guidance- and incentive-based policies in agricultural pest and disease control. Guidance-based policies can change the selection behavior of participating subjects from the very beginning through technical training and other means, while incentive-based policies, similar to agricultural production trust subsidies, effectively solve the problem of financial constraints of other subjects. In this way, the cooperation is in a more stable state, although the evolution of each subject is relatively slower after the implementation of guidance- and incentive-based policies.
3.3.3. Simulation analysis of the impact of policy tool combinations on stabilization strategies
The implementation of one certain policy consists of a series of combined policy tools, and this part explores the impact of the combination of policy tools on the final stable evolutionary outcome of each subject, followed by the analysis on complementary relationship and superposition effects among policy tools. The initial willingness of the three parties is set 0.6, and the changes and evolution results of other parameters are shown in Figure 8. Compared with the application of a single policy tool, the absence of (0, 0, 1) evolutionary state after the combination of the three types of policy tools suggests that the policy inefficiencies, which may be faced in the implementation of single policy tool, can be effectively eliminated after the superposition of policy tools. In previous studies, some scholars tried to reveal the superposition effect of various policies by incorporating them into a unified framework. Hruska, Wang et al. found that regulatory, guidance-, and incentive-based policies all regulate farmers’ application behaviors [12,14]. Huang et al. found that there were differences in the effects of various policies [15].
When the regulatory policy is paired with the guidance- or incentive-based policies, it evolves to (1, 1, 1) under low, medium and high parameter settings, and the evolution of each party to 1 accelerates as the parameter setting value increases. In contrast, the combination of guidance- and incentive-based policies evolves to (1, 1, 1) at low and medium levels of parameter setting, and to a more optimal state (1, 1, 0) when the parameter is set at a high level, i.e., farmers and service organizations can reach an ideal pest and disease control state on their own without government intervention , and the evolutionary state of the combination of the three types of policy instruments is the same as the evolutionary state when the guidance-based policy is combined with the incentive-based one, but the evolutionary rates of farmers and service organizations are higher at this time. In addition, when the three types of policy tools are implemented simultaneously, a policy system with both positive and negative mechanisms can be formed. The reverse push from regulatory policies can further strengthen positive effects of guidance- and incentive-based policies, maximizing complementary and superposition effects among the policies. The simultaneous implementation of the three types of policy tools thus enables farmers and service organizations to achieve an optimal governance state for pest and disease control as quickly as possible.
4. Conclusions
In this paper, the dynamic relationship of the tripartite game model of farmers, service organizations and the government regarding PDCO, together with the equilibrium stability of the strategy combination, were constructed and deeply analyzed. The study has reached the conclusions as follows:
Firstly, the stronger the willingness of each subject, the faster the stable state of joint tripartite pest and disease control can be formed. And after the initial willingness increases to a certain level, the effect of government policy tools changes from an inefficient or even ineffective state to an efficient one.
Secondly, in the case of implementing a single policy tool, when the policy support is increased to a certain level, it can effectively promote tripartite subjects to collaborate for modern pest and disease control. The convergence rate of each party that implements the regulatory policy alone is fast but may be unstable, while the rate is slow but more stable when a guidance- or incentive-based policy is solely applied.
Thirdly, the effect of policy tool combination is much better than that of a single policy tool applied. When the tools are combined in pairs, the combination of guidance- and incentive-based policies is more effective than other two combinations. And with the simultaneous implementation of the three types of policy tools, the complementary and superposition effects among the policy tools can be maximized.
Based on the above findings, certain insights on policies have thus been obtained.
Firstly, an agricultural PDCO demonstration base can be establish to play a leading role for a demonstration purpose. The results of the study confirmed that the stronger the initial willingness of each subject to participate, the more conducive it was to quickly form a stable state of joint pest and disease control among the three parties. To this end, while continuously strengthening guidance-based policy tools, it is also necessary to establish agricultural PDCO demonstration bases as a means to further drive forward the promotion and application of modern pest and disease control measures, which is considered to be contributive to pesticide reduction and efficiency and to produce quality and safety. By setting up demonstration bases to give full play to their leading role, farmers and service organizations can truly realize the additional benefits brought by the positive externality behavior of agricultural pest and disease control, so as to choose the right operation mode.
Secondly, the complementary and superposition effect among policy tools should be stressed, and detailed implementation rules for agricultural PDCO policies should be adequately formulated according to local conditions. Each type of policy tool may have certain disadvantages while performing specific functions. Therefore, the policy tools should complement one another to exert the superposition effect. Specific to different regions and groups, it is advisable to formulate policy tools that meet individual characteristics and needs of farmers and service organizations, with the focus placed on the implementation of guidance- and incentive-based policies, when regulatory policy tools are appropriately provided as well. For example, for regions with low development level of PDCO, we should focus on implementing guidance-based policy to strengthen the cognitive level of farmers and service organizations. For poor farmers, we should focus on implementing incentive-based policy to ease the financial constraints they face when purchasing PDCO services. For regions with high level of PDCO development but low level of regulation, we should focus on implementing regulatory policies. However, the support of various policies should be provided at a proper level, and the normal pricing mechanism should not be disrupted. In addition, the government should flexibly adjust its policy implementation, combination mode and policy details in accordance with the strategic choices of other subjects.
Thirdly, the market governance of PDCO services should be strengthened, and the information asymmetry between farmers and service organizations is to be eliminated. In order to realize the complementary effect of the government and the market, a professional management association for crop pest and disease control services should be set up, relevant management measures be formulated, and various rules and regulations, contracts and pricing mechanisms be established and improved. Above all, the pest and disease control service organizations should be assessed and put on record, so as to improve the entry threshold of pest and disease control services. The operation process should be standardized, and farmers’ worries about production risks be eased with quality services. Besides, the supervision platform of PDCO can be set up to supervise and control the service process.
Finally, the brand building and traceability system of agricultural products should be strengthened, and sound mechanisms of produce quality and pricing be established. Farmers and service organizations will choose pest and disease control methods with higher production efficiency in the consideration of maximizing their economic effects. Although the implementation of policy tools by the governments can motivate other subjects to choose positive externalities in pest and disease control behaviors, such implementation not only increases the governments’ financial burden, but also may prevent farmers and service organizations from modernizing pest and disease control in the absence of policy regulation. Therefore, more efforts should be devoted to brand building and traceability management of agricultural products, coupled with good quality and pricing mechanisms for agricultural products, so that farmers can realize green production and gain extra benefits from PDCO with pesticide reduction and efficiency, which will help to continuously promote pest and disease control services.
There are still two deficiencies in this study. On the one hand, this paper does not compare and analyze the PDCO two-party evolutionary game model between farmers and service organizations when the government does not intervene. On the other hand, this paper does not carry out relevant analysis from the perspective of typical cases. Therefore, the next step is to build a two-party game model and analyze the behavioral logic of PDCO with some typical cases, which will be our next research direction.
Author Contributions
Conceptualization, Y.B.W. and J.L.; Data curation, J.L.; Formal analysis, Y.B.W., J.L. and P.F.C.; Funding acquisition, Y.B.W.; Investigation, Y.B.W. and J.L.; Methodology, Y.B.W., J.L. and P.F.C.; Project Administration, Y.B.W.; Software, J.L. and P.F.C.; Writing—original draft preparation, J.L.; Writing—review and editing, Y.B.W., J.L. and P.F.C. All authors have read and agreed to the published version of the manuscript.
Funding
This research was funded by the National Social Science Foundation of China (18BJY133), and the Research projects commissioned by the Ministry of Agriculture and Rural Affairs of the People’s Republic of China (15213011; 08200040).
Data Availability Statement
The data in the article are detailed in Section 3.3. All the data used are reflected in the article. If you need other relevant data, please contact the authors.
Conflicts of Interest
The authors declare no conflict of interest.
References
- Huang, J.K.; Qi, l.; Chen, R.J. Technical information knowledge, risk preferences and pesticide application by farmers. Journal of Management World. 2008, 5, 71–76. [Google Scholar]
- Yang, Z.Q. How does education affect agricultural green agricultural productivity? -An empirical study based on different educational forms in rural China. China Soft Science Magazine. 2019, 8, 52–56. [Google Scholar]
- Jiang, J.; Zhou, J.; Sun, R.Y. Study on excessive application of pesticide in vegetable based on damage control mode. Journal of Agrotechnical Economics. 2017, 11, 16–25. [Google Scholar]
- Li, C.L.; Zhang, L.; Zhou, H. Investment in pest control machinery of large-scale farmers and its effect. Journal of Huazhong Agricultural University (Social Sciences Edition). 2022, 3, 58–69. [Google Scholar]
- Ying, R.Y.; Xu, B. Effects of regional pest control adoption on pesticides application. China Population Resources and Environment. 2017, 27, 90–97. [Google Scholar]
- Sun, D.; Michael, R.; Xu, Z. Determinants and impacts of outsourcing pest and disease management: evidence from China’s rice production. China Agricultural Economic Review. 2018, 10, 443–461. [Google Scholar] [CrossRef]
- Yan, A.Q.; Luo, X.F.; Huang, Y.Z. Influence of socialized services on farmers’ pesticide reduction behavior. Journal of Arid Land Resources and Environment. 2021, 35, 91–97. [Google Scholar]
- Shi, Z.H.; Fu, Y. Can socialized service promote farmers to adopt pesticide reduction behavior? Investigation based on the dimension of service specialization. Chinese Journal of Agricultural Resources and Regional Planning. 2022, 1–15. [Google Scholar]
- Zheng, J.G.; Zhang, R.X. Can outsourcing reduce pesticide overuse? -Analysis based on the moderating effect of farmland scale. Journal of Agrotechnical Economics. 2022, 2, 16–27. [Google Scholar]
- Duan, P.; Wang, L.L.; Luo, J.Z. Individual response to and determinants of outsourcing of technology-intensive processes in crop farming: evidence from 631 wheat farmers in Henan and Shanxi provinces. Chinese Rural Economy. 2017, 8, 29–44. [Google Scholar]
- Zheng, S.N.; Zhao, J.H. Game analysis of government intervention in agricultural pest risk prevention and control. Journal of China Agricultural University. 2021, 26, 233–244. [Google Scholar]
- Hruska, A. Government pesticide policy in Nicaragua 1985-89. Global Pesticide Monitor. 1990, 1, 3–5. [Google Scholar]
- Zhao, Y.M.; Zhu, F.M.; He, L.L. Definition, classification and evolution of environmental regulations. China Population Resources and Environment. 2009, 19, 85–90. [Google Scholar]
- Wang, J.H.; Liu, Z.; Li, Q. Governmental behaviour choice in controlling safety risks of agricultural products and the ways for its improvement-taking pesticide using in agricultural production as an example. Chinese Rural Economy. 2015, 11, 52–62+76. [Google Scholar]
- Huang, Z.H.; Zhong, Y.Q.; Wang, X.L. Study on the impacts of government policy on farmers pesticide application behavior. China Population Resources and Environment. 2016, 26, 148–155. [Google Scholar]
- Jayne, T.S.; Mather, D.; Mason, N.; Ricker-Gilbert, J. How do fertilizer subsidy programs affect total fertilizer use in sub-Saharan Africa? crowding out, diversion, and benefit/cost assessments. Agricultural Economics. 2013, 44, 687–703. [Google Scholar] [CrossRef]
- Han, Q.; Liu, Q.L.; Meng, T. Can subsidies for weak links of agricultural production trusteeship improves the farmers willingness of whole-process trusteeship? -A case study on agricultural pest control subsidy. Journal of Huazhong Agricultural University (Social Sciences Edition). 2021, 2, 71–79+178–179. [Google Scholar]
- Yu, Y.L.; Li, Y.; Xue, C.X. Influence of government regulation and community governance on tea farmers behavior of reducing pesticide use. Resources Science. 2019, 41, 2227–2236. [Google Scholar] [CrossRef]
- Wang, J.H.; Ma, Y.T.; Wang, X.L. Agricultural production safety: farmers’ pesticide application knowledge and technical training. China Population Resources and Environment. 2014, 24, 54–63. [Google Scholar]
- Ying, R.Y.; Zhu, Y. The Impact of agricultural technical training on farmers agrochemical use behavior: Evidence from experimental economics. China rural Survey. 2015, 1, 50–58+83+95. [Google Scholar]
- Li, H.; Li, S.P.; Nan, L. Can technical training reduce pesticide overuse? Chinese Rural Economy. 2017, 10, 90–97. [Google Scholar]
- Shumway, C.R.; Chesser, R.R. Pesticide tax, cropping patterns, and water quality in South Central Texas. Journal of Agricultural and Applied Economics. 1994, 26, 224–240. [Google Scholar] [CrossRef]
- Dai, Y.Y.; Xu, X. Study on the farmers behavior in controlling vegetable quality and safety and their influencing factors: based on the regulatory impact of government, market and organization. Journal of Nanjing Agricultural University (Social Sciences Edition). 2012, 12, 48–53+59. [Google Scholar]
- Zhuang, T.H.; Liu, C.; Zhang, H.X. Do agricultural subsidies inhibit behaviors of pesticide application? Rural Economy. 2021, 7, 120–128. [Google Scholar]
| 1 | Data source: The website of the Ministry of Agriculture and Rural Affairs: http://www.moa.gov.cn/xw/bmdt/202101/t20210119_6360102.htm. |
| 2 | Data source: The website of the Ministry of Agriculture and Rural Affairs: http://www.moa.gov.cn/govpublic/ZZYGLS/202107/t20210728_6372984.htm. |
Figure 1.
Logical relationship of subjects in PDCO system.
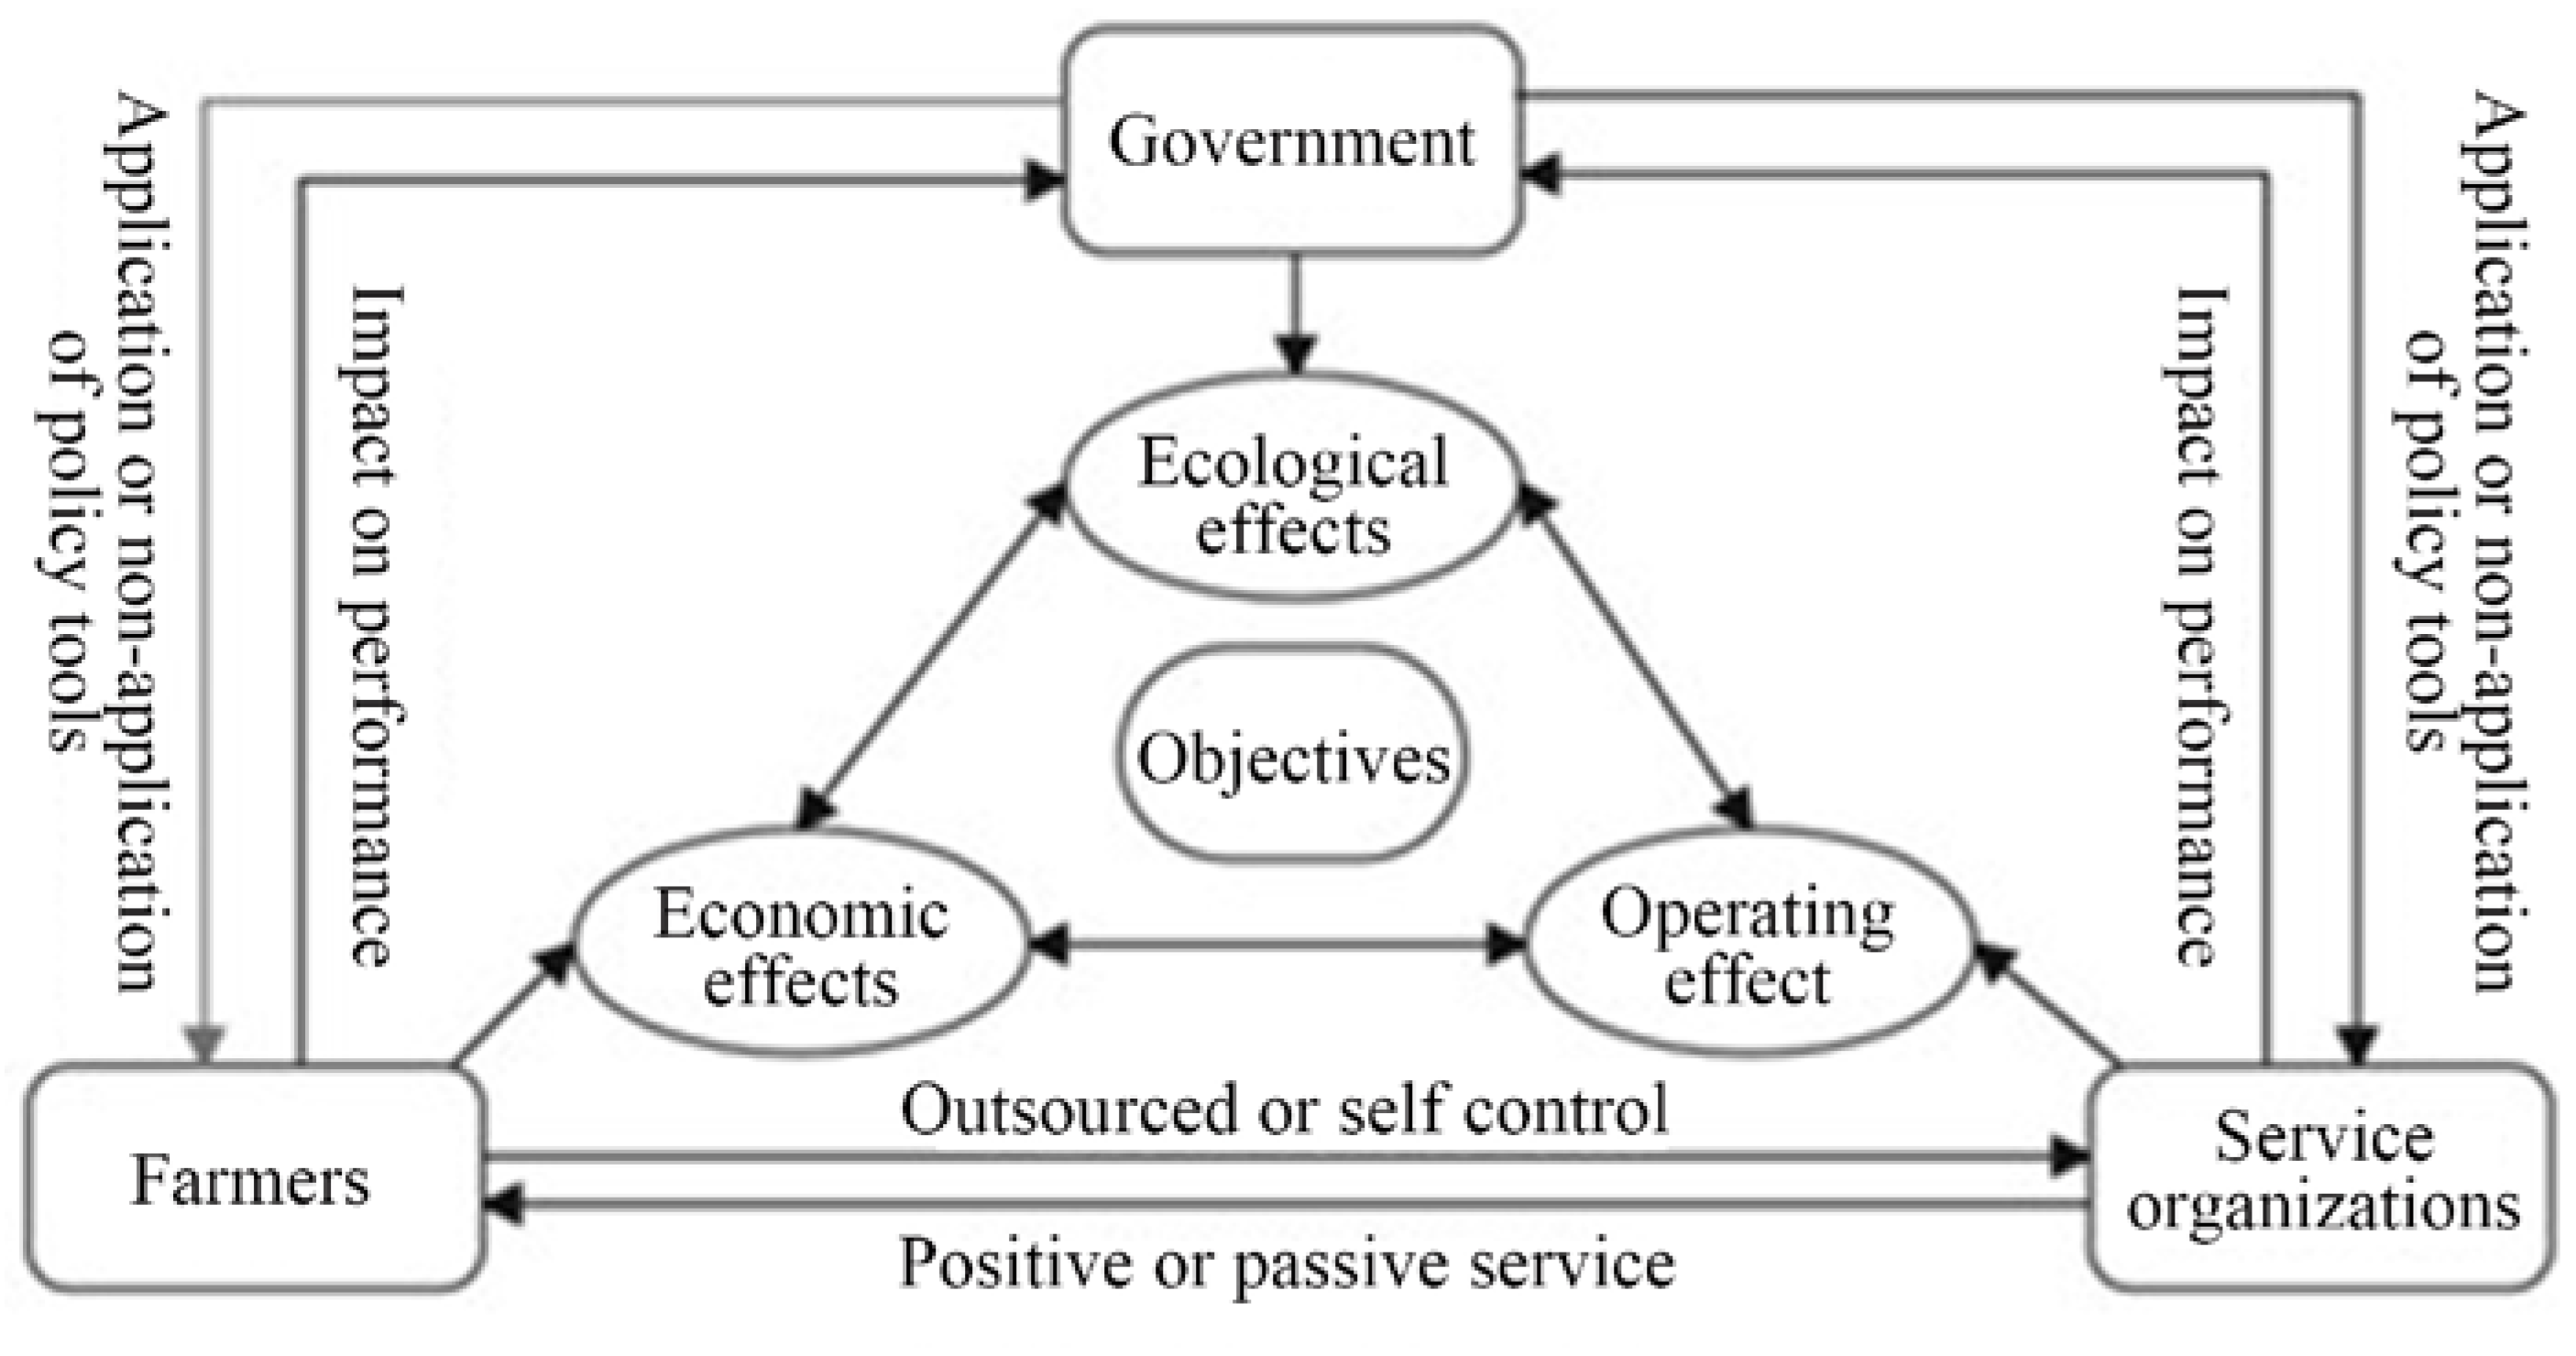
Figure 2.
Path and mechanism of policy tools regulating PDCO.
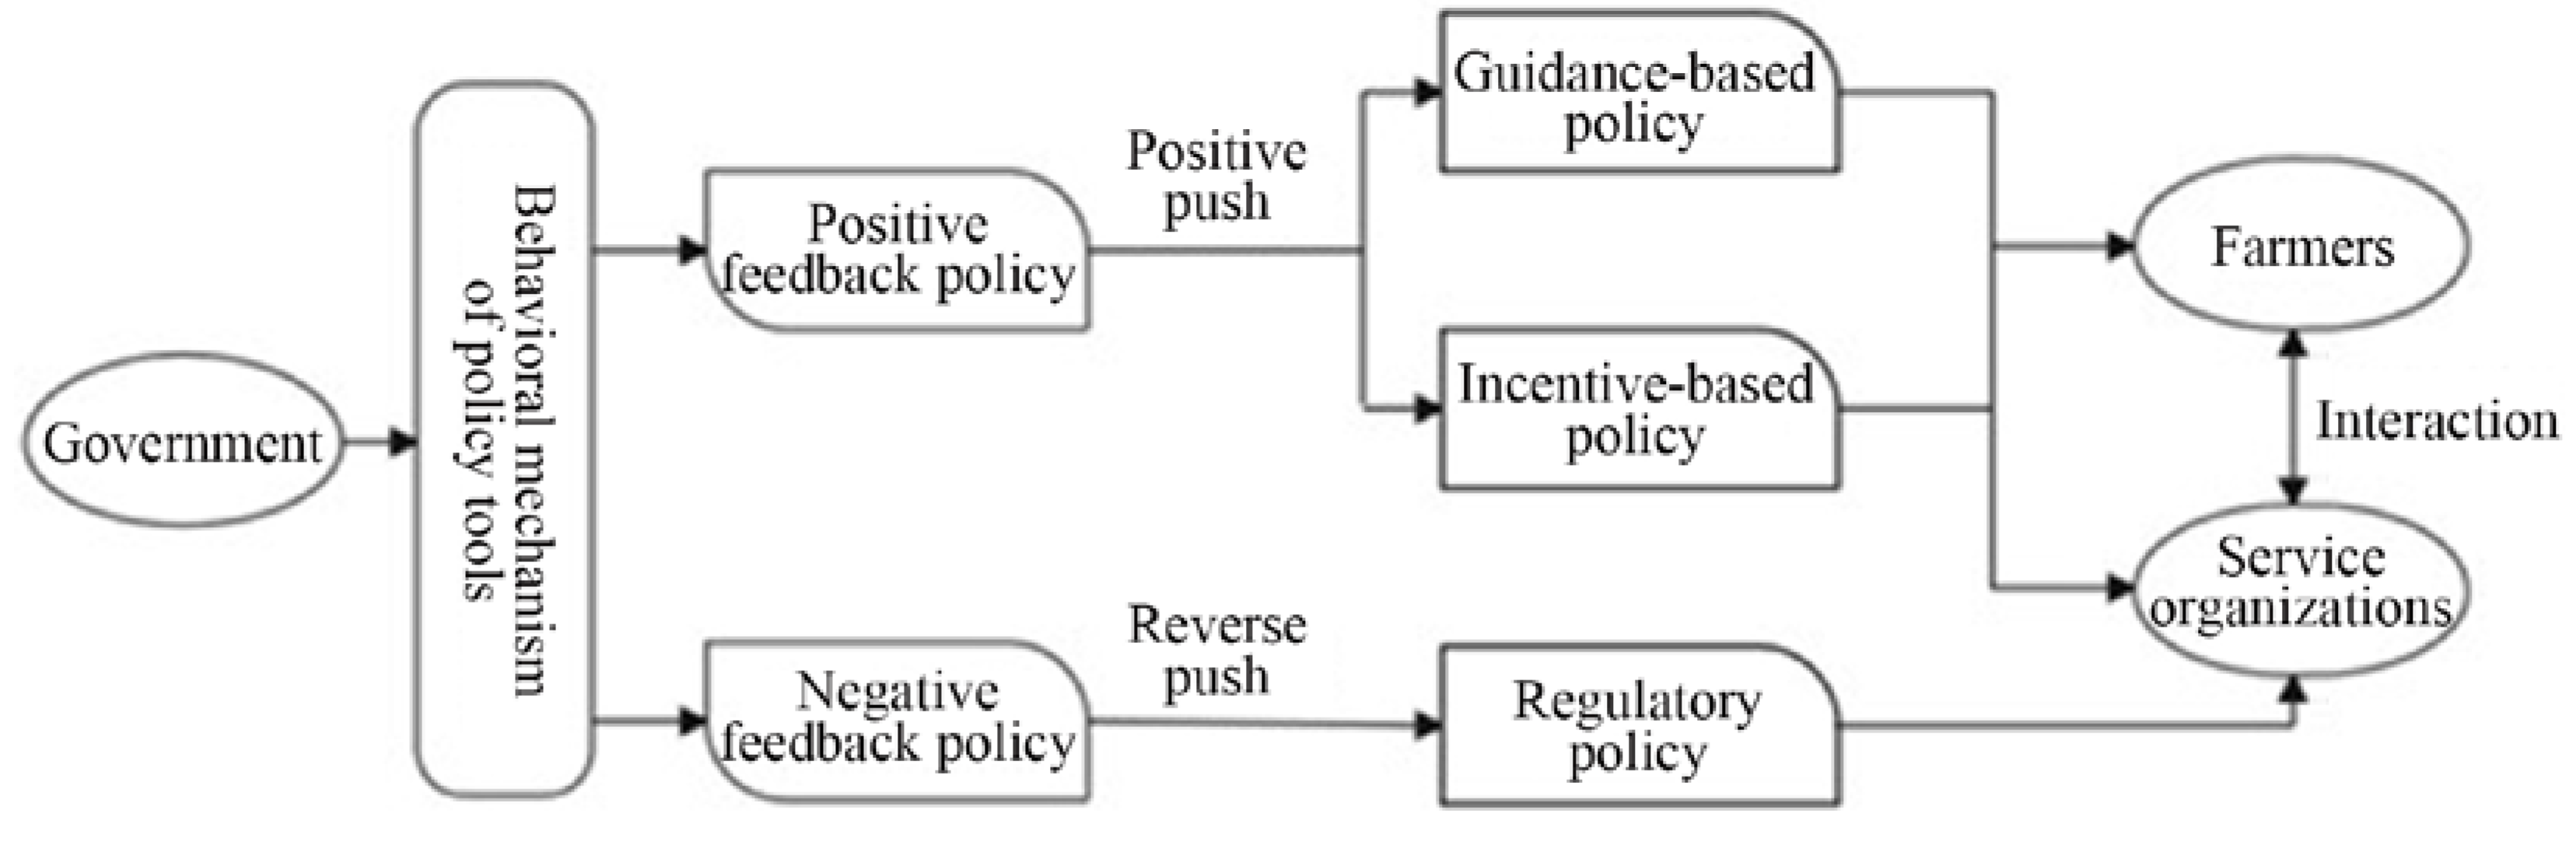
Figure 3.
Phase diagram of farmers evolution. Note: The meaning of parameters is shown in Section 2.2.
Figure 3.
Phase diagram of farmers evolution. Note: The meaning of parameters is shown in Section 2.2.
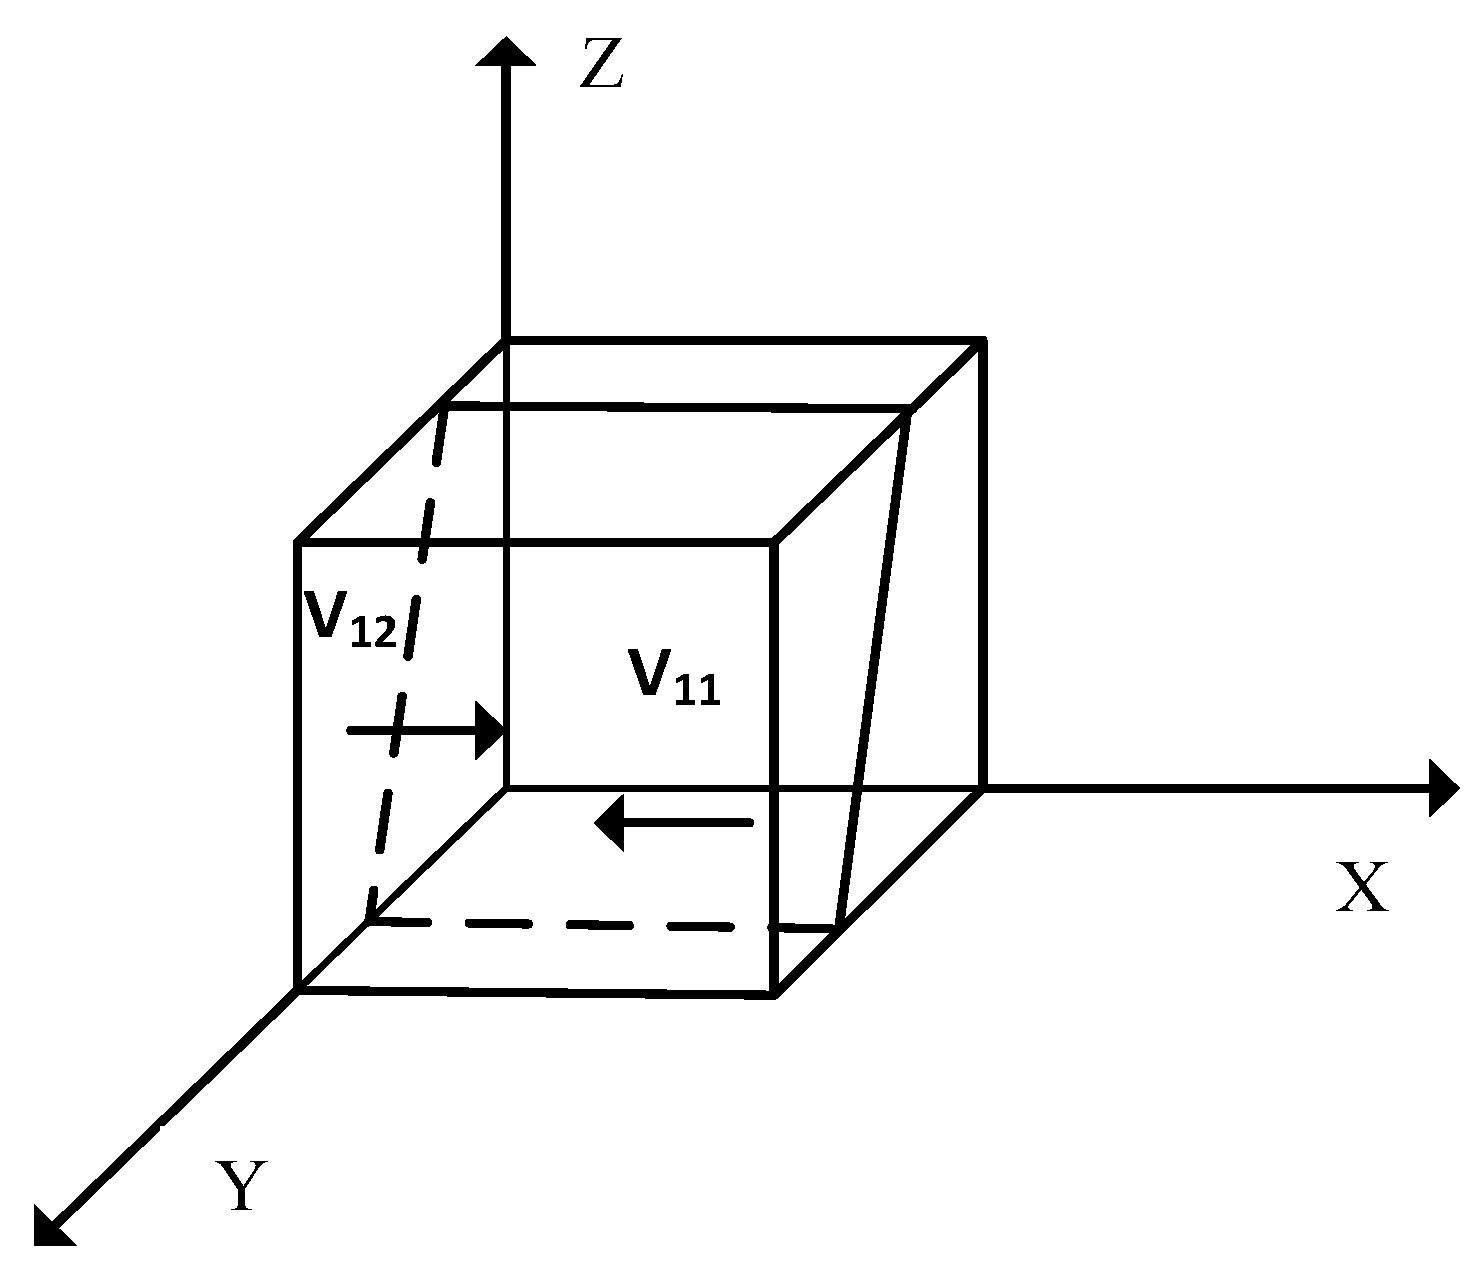
Figure 4.
Phase diagram of the evolution of service organizations. Note: The meaning of parameters is shown in Section 2.2.
Figure 4.
Phase diagram of the evolution of service organizations. Note: The meaning of parameters is shown in Section 2.2.

Figure 5.
Phase diagram of governmental evolution when . Note: The meaning of parameters is shown in Section 2.2.
Figure 5.
Phase diagram of governmental evolution when . Note: The meaning of parameters is shown in Section 2.2.
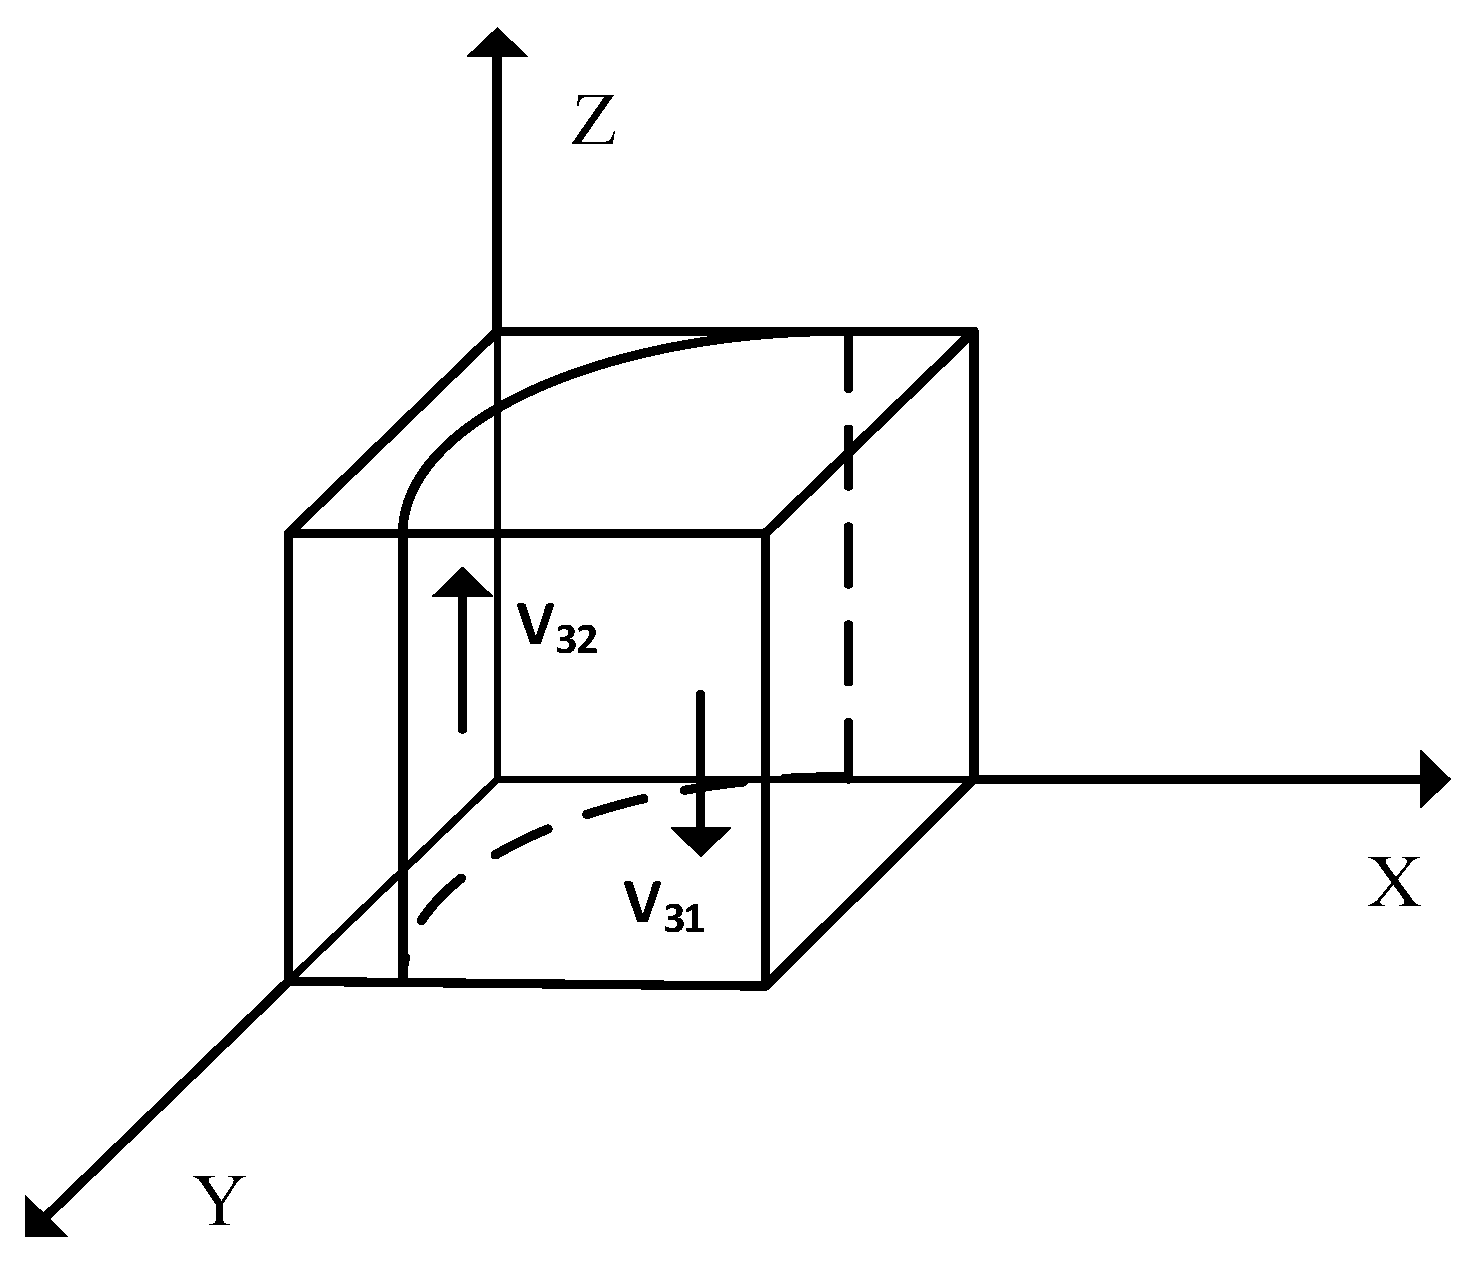
Figure 6.
Effect of initial willingness on the final stable evolutionary outcome. Note: The meaning of parameters is shown in Section 2.2.
Figure 6.
Effect of initial willingness on the final stable evolutionary outcome. Note: The meaning of parameters is shown in Section 2.2.
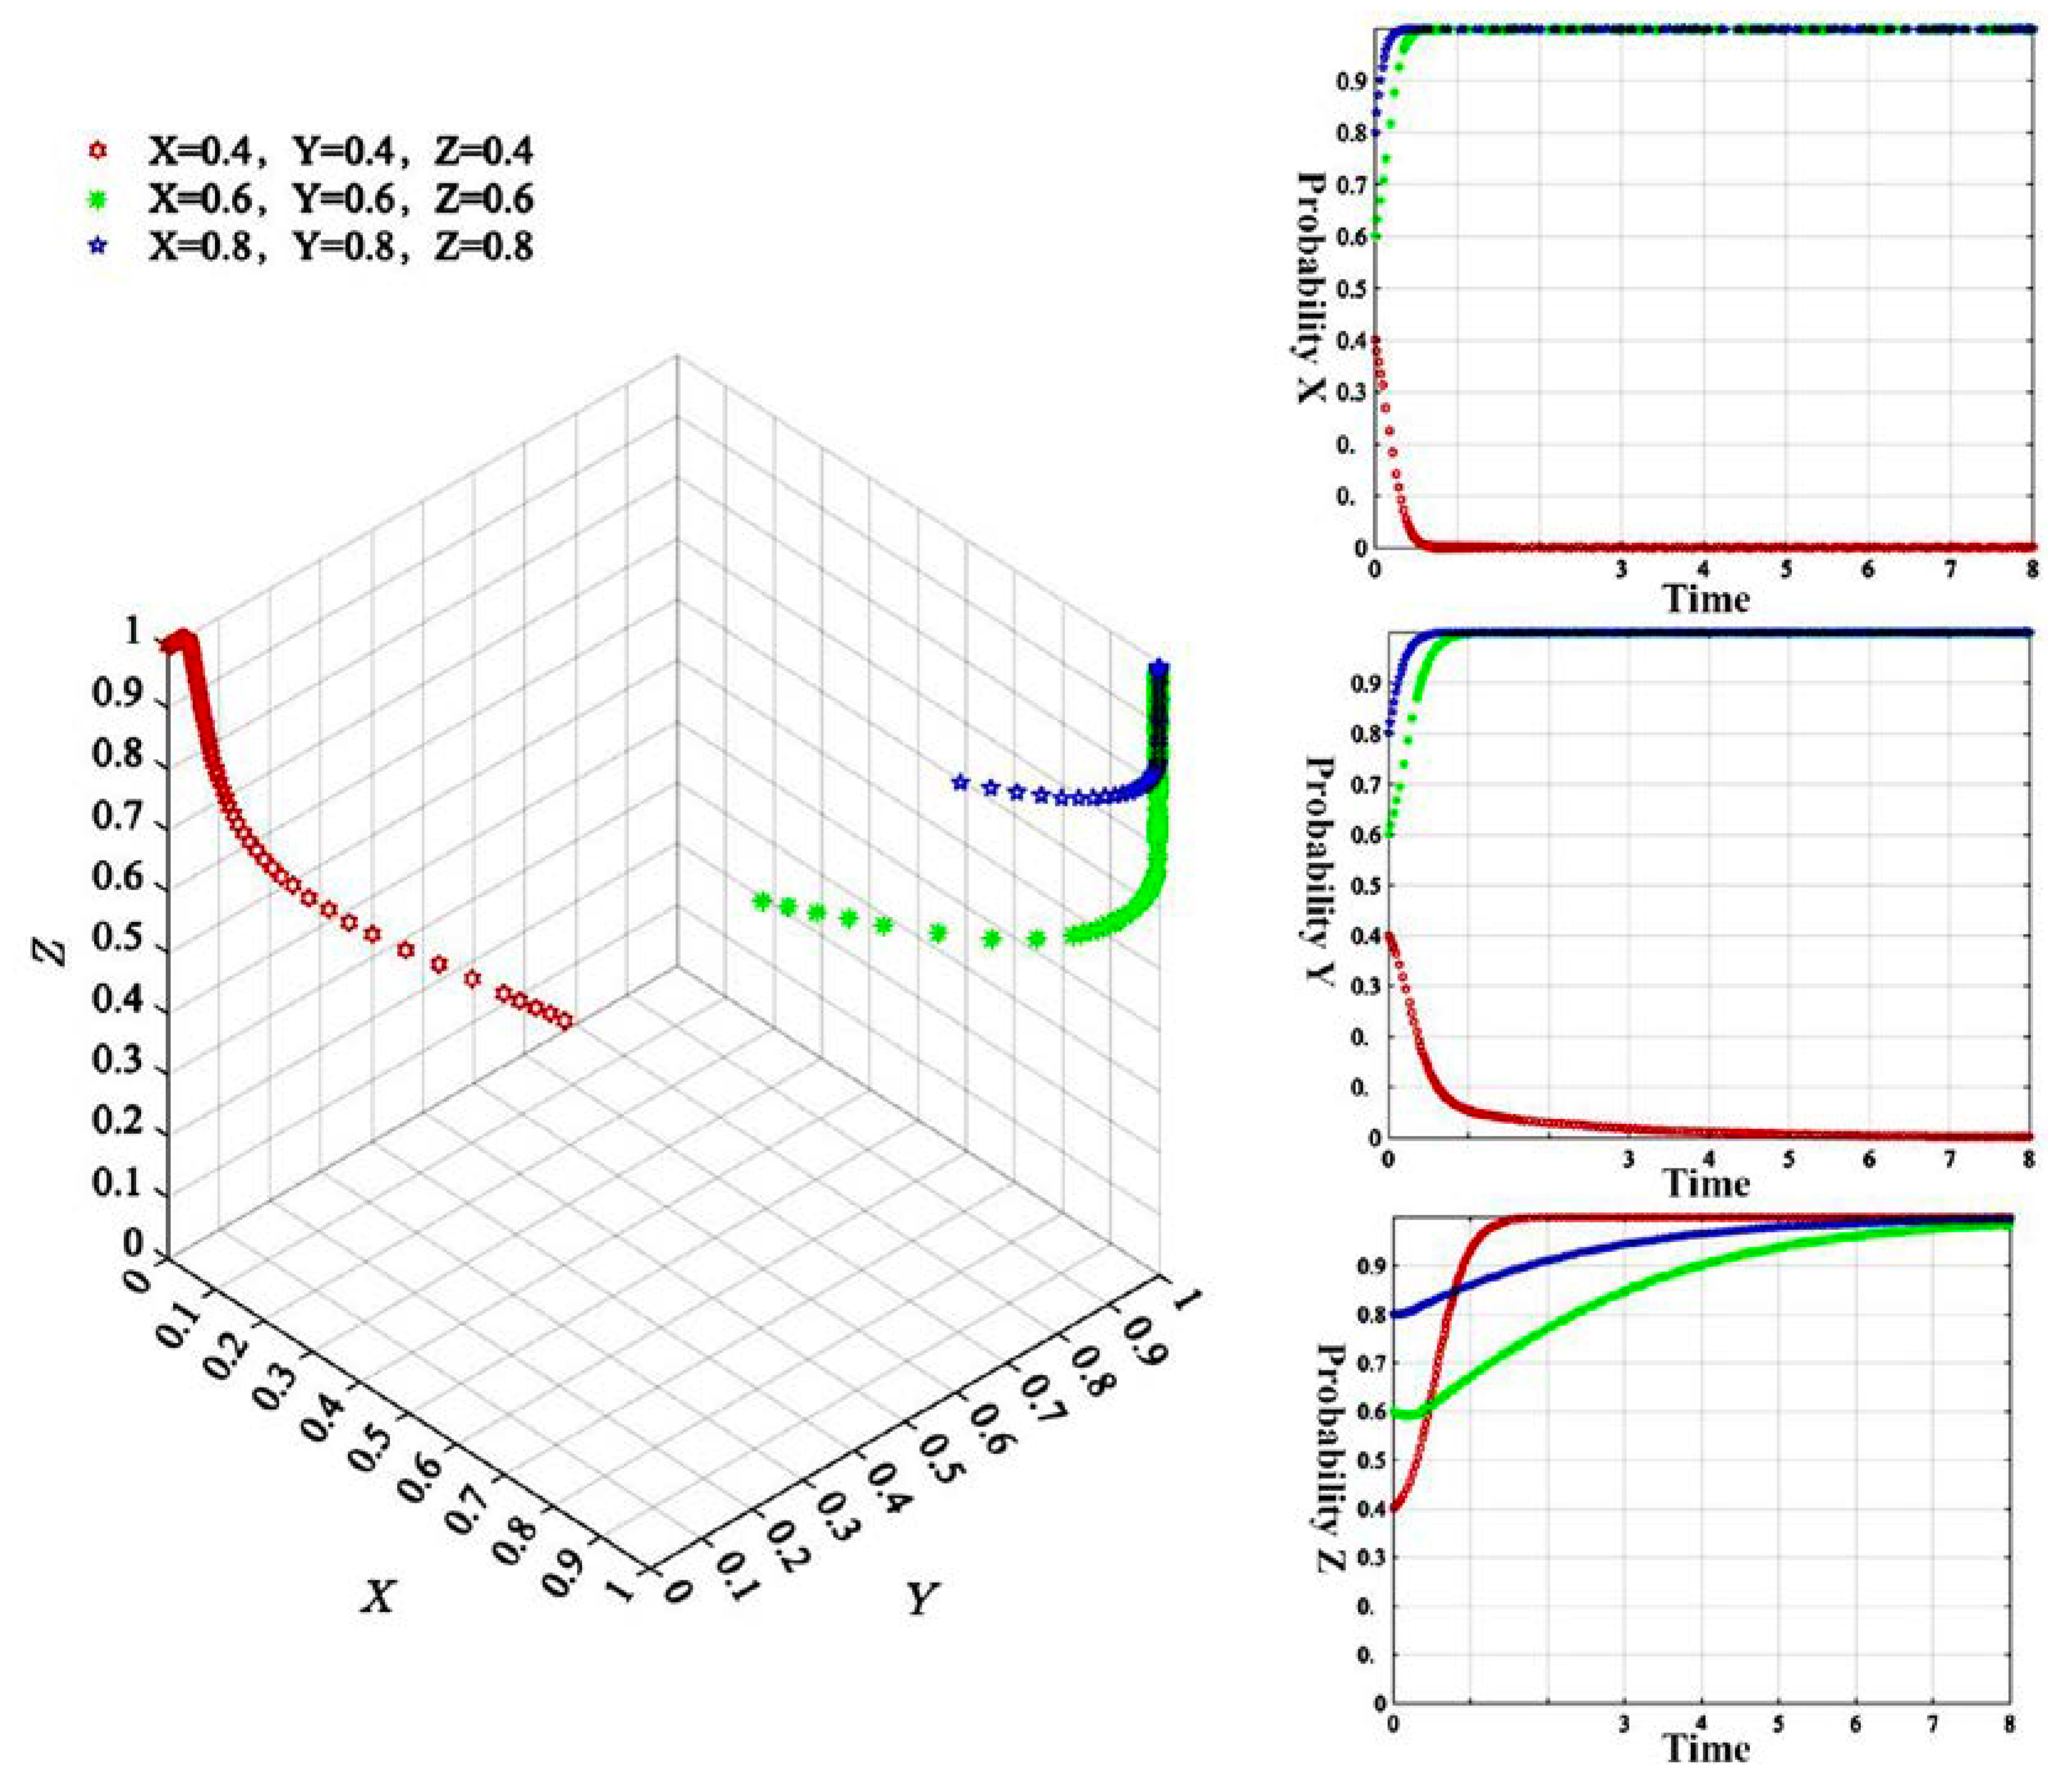
Figure 7.
Impact of single policy tool on the final stabilization evolution. Note: The meaning of parameters is shown in Section 2.2.
Figure 7.
Impact of single policy tool on the final stabilization evolution. Note: The meaning of parameters is shown in Section 2.2.
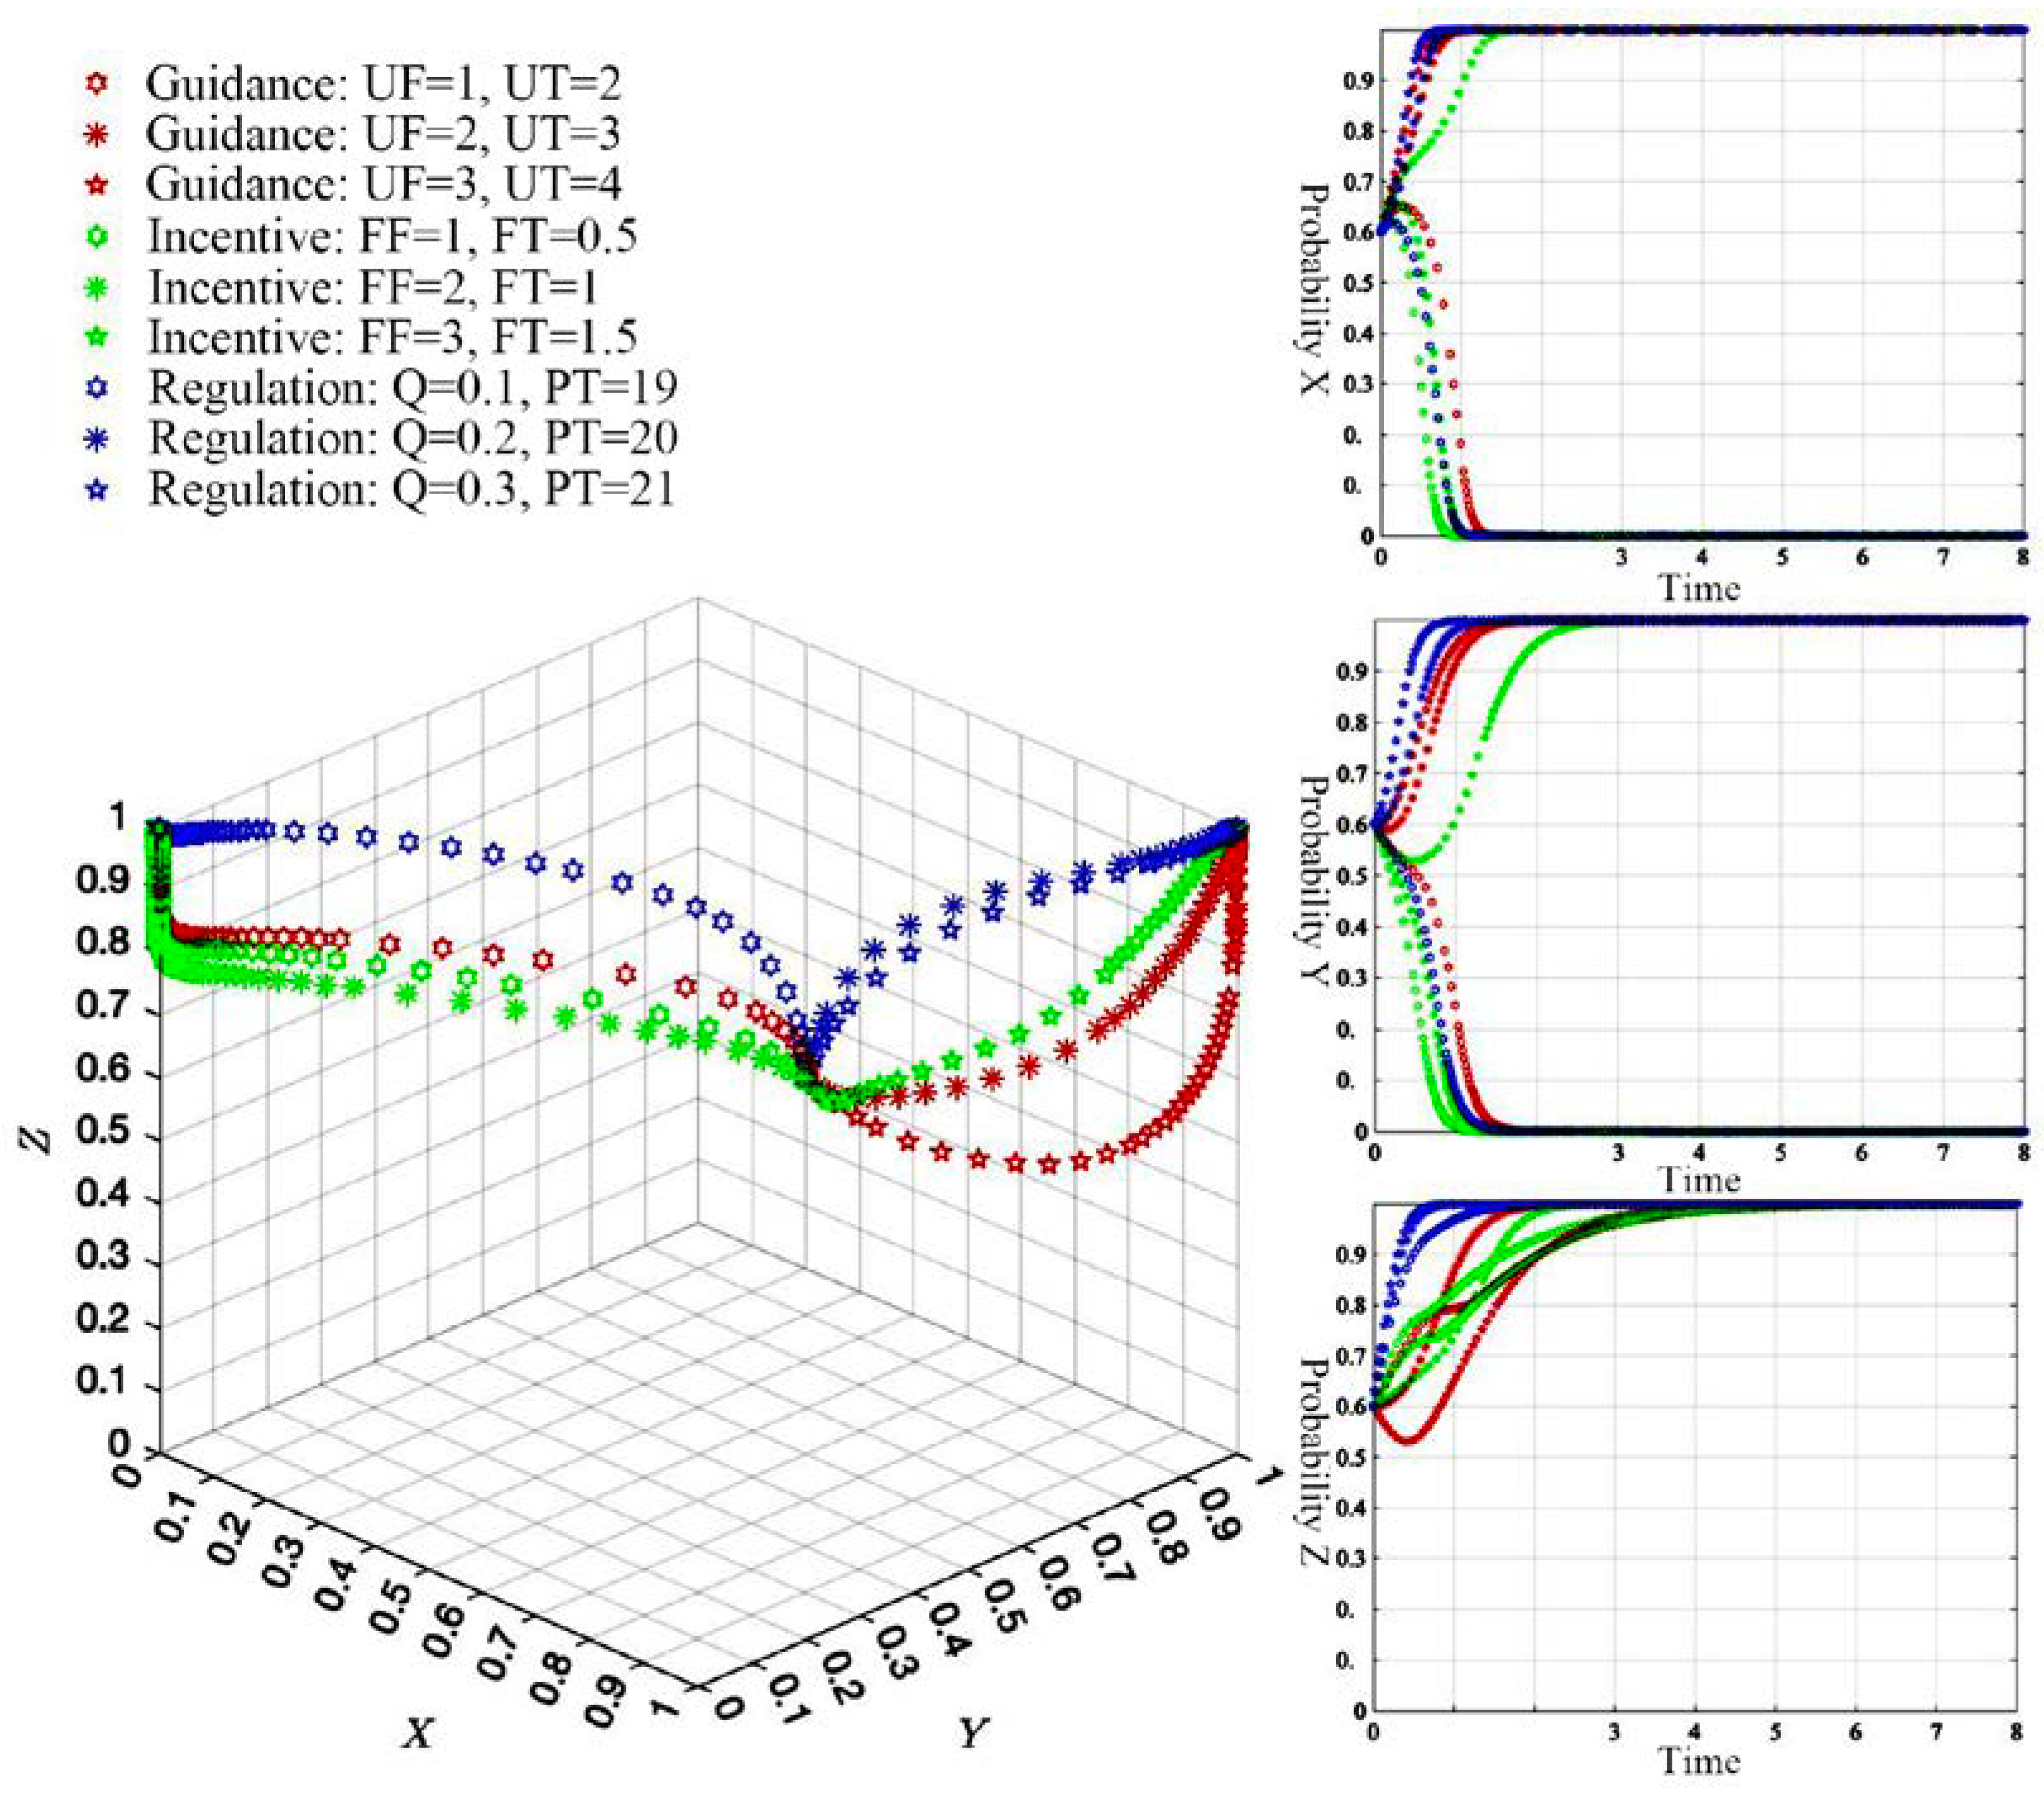
Figure 8.
Impact of the combination of policy tools on the final stabilization evolution. Note: The meaning of parameters is shown in Section 2.2.
Figure 8.
Impact of the combination of policy tools on the final stabilization evolution. Note: The meaning of parameters is shown in Section 2.2.
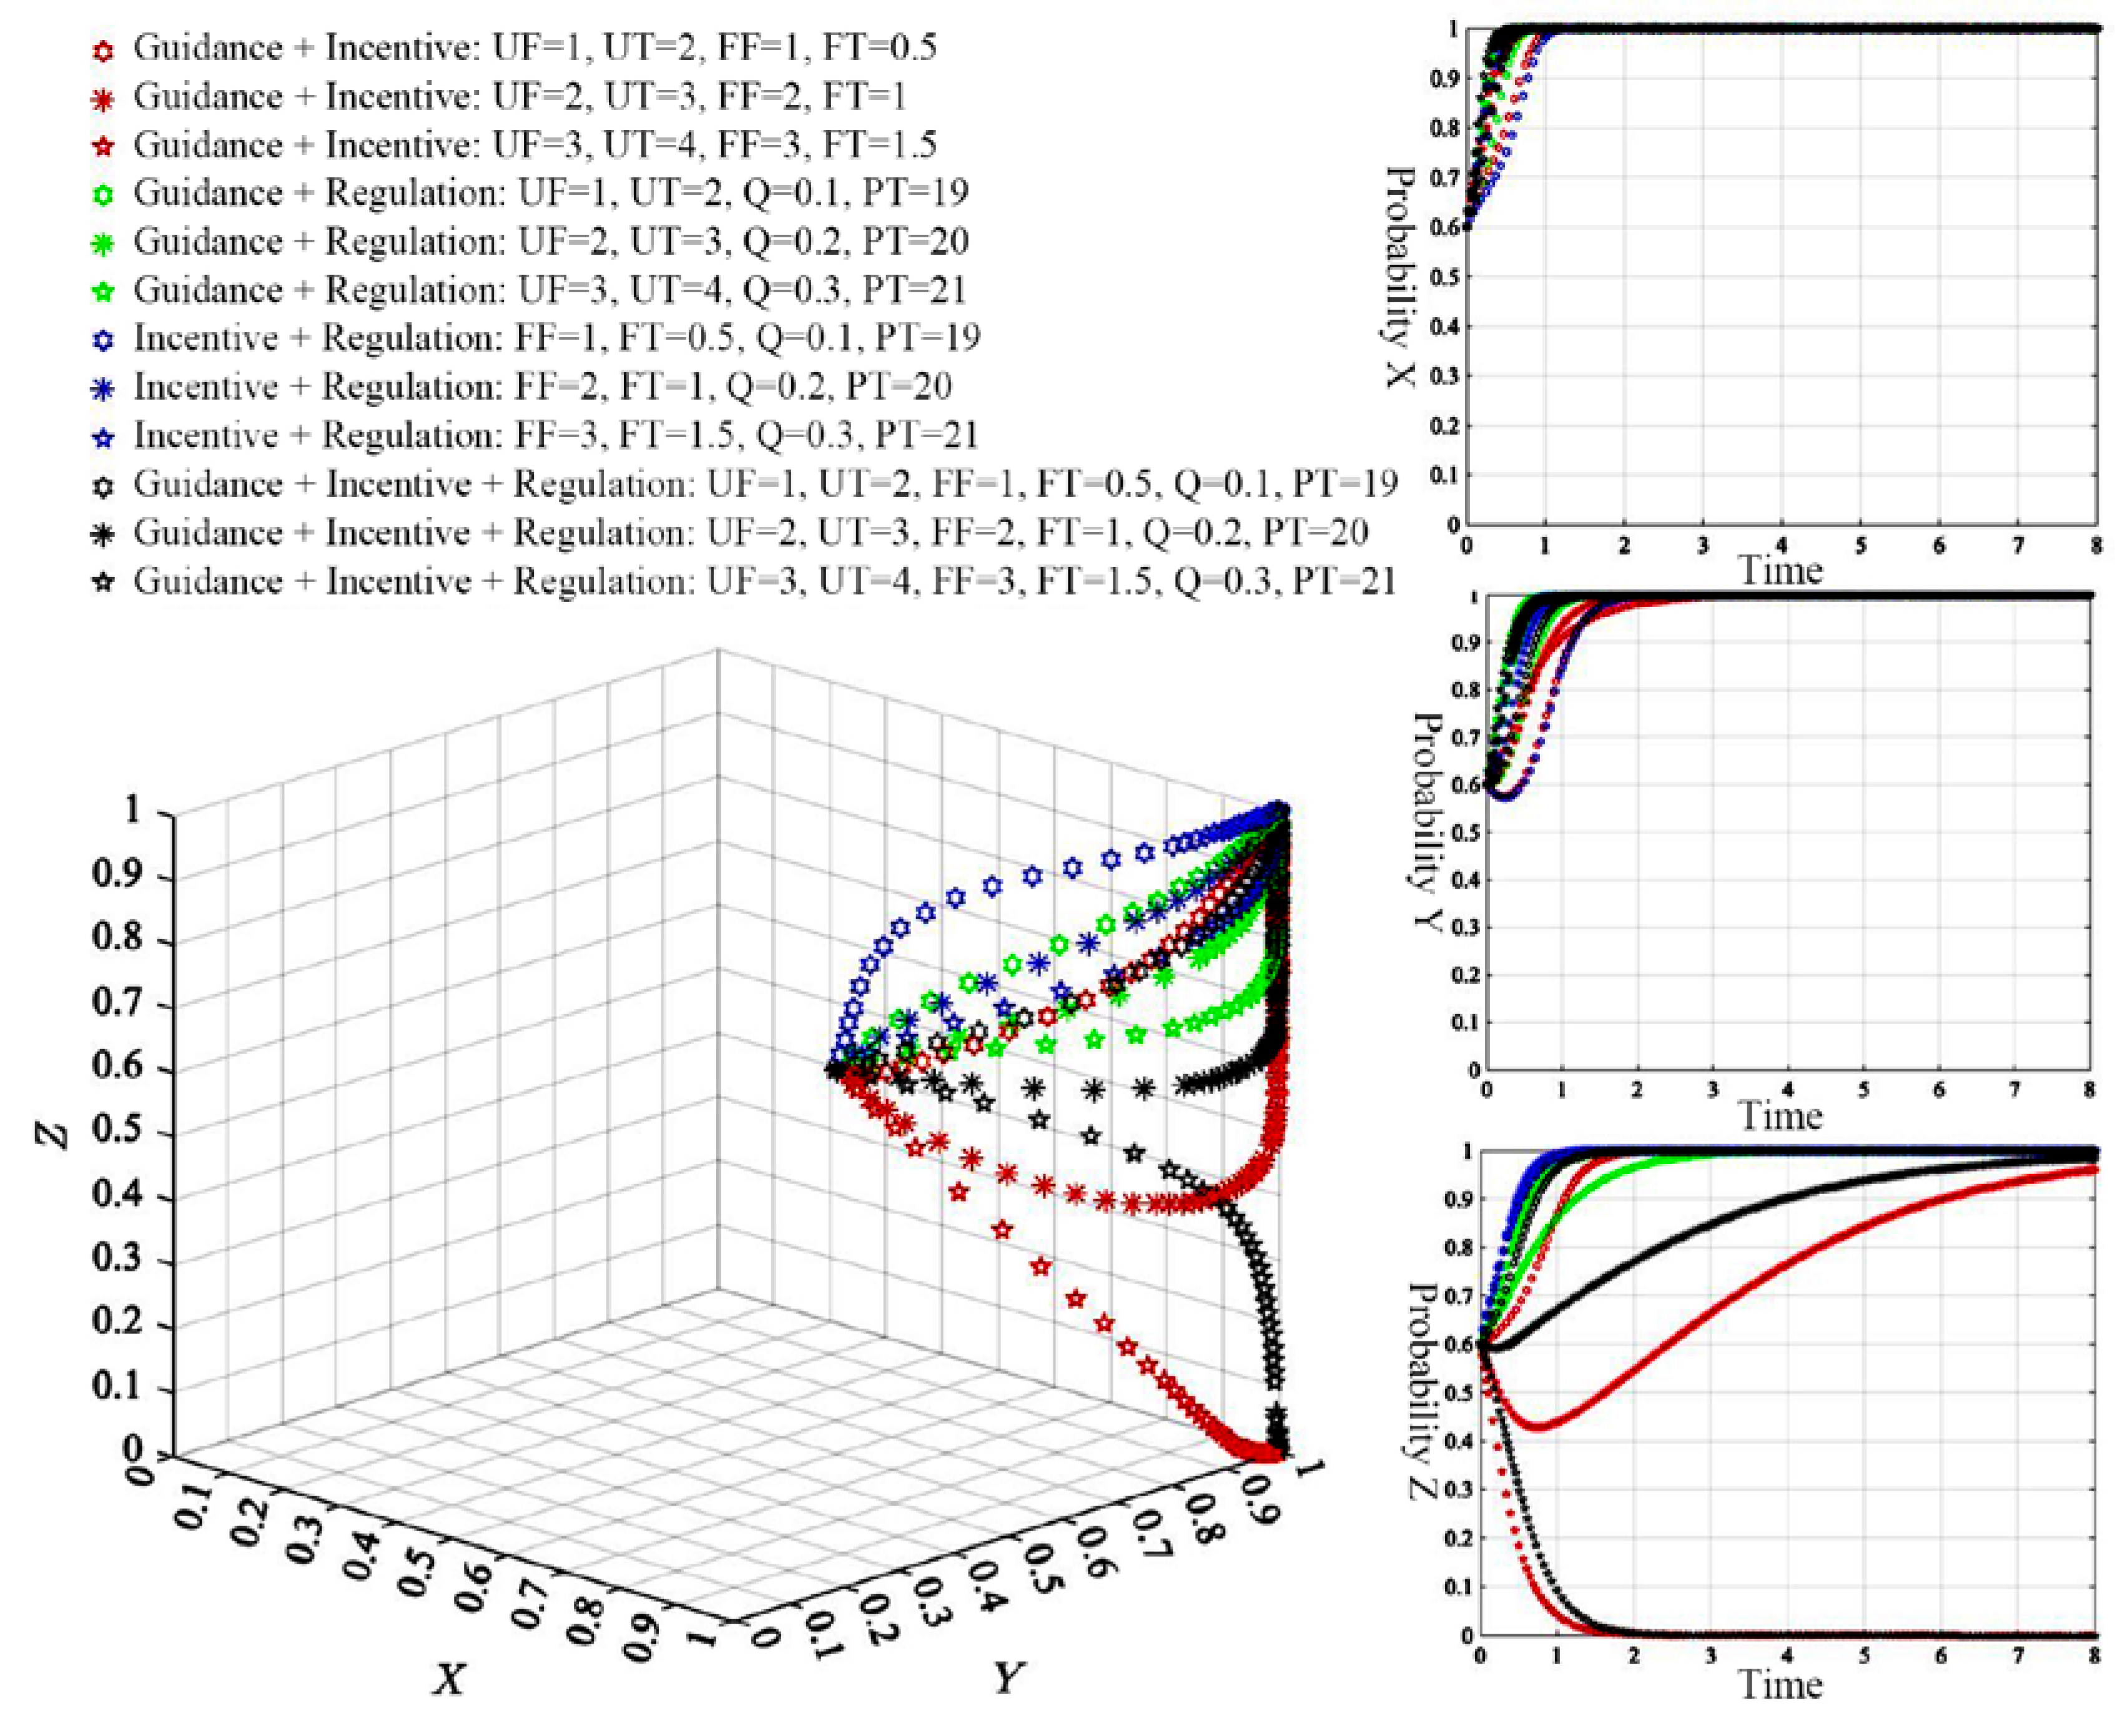

Table 1.
Benefit matrix of the game among farmers, service organizations and the government.
| Gaming party | Government | ||||
|---|---|---|---|---|---|
| ) | ) | ||||
| Farmers | Outsourced prevention and control () |
Service organizations | Positive prevention and treatment services () |
|
|
| Negative prevention and control services () |
|
|
|||
| Farmers | Self prevention and control () |
Service organizations | Positive prevention and treatment services () |
|
|
| Negative prevention and control services () |
|
|
|||
Note: The meaning of parameters is shown in Section 2.2.
Table 2.
Stability analysis of equilibrium points.
| Equilibrium point | Eigenvalue of Jacobian matrix | Stability conclusion | Condition | |
|---|---|---|---|---|
| Real part symbol | ||||
| (0,0,0) | , | (, , ) | Instability point | / |
| (0,1,0) | , , | (, , ) | Instability point | / |
| (0,0,1) |
, , |
(, , ) | ESS | ① |
| (0,1,1) |
, |
(, , ) | Instability point | / |
| (1,0,0) |
, |
(, , ) | Instability point | / |
| (1,1,0) |
, , |
(, , ) | ESS | ② |
| (1,0,1) |
, , |
(, , ) | Instability point | / |
| (1,1,1) |
, , |
(, , ) | ESS | ③ |
| Condition ① : ; Condition ② : ; Condition ③ : . | ||||
Note: indicates that the symbol is uncertain; The meaning of parameters is shown in Section 2.2.
Table 3.
Assignment of profit and loss parameters.
| Parameter | ||||||||||||||
|---|---|---|---|---|---|---|---|---|---|---|---|---|---|---|
| Value | 18 | 32 | 8.5 | 10 | 2 | 1 | 3 | 2 | 1 | 2 | 20 | 0.2 | 3 | 10.5 |
Note: The meaning of parameters is shown in Section 2.2.
Disclaimer/Publisher’s Note: The statements, opinions and data contained in all publications are solely those of the individual author(s) and contributor(s) and not of MDPI and/or the editor(s). MDPI and/or the editor(s) disclaim responsibility for any injury to people or property resulting from any ideas, methods, instructions or products referred to in the content. |
© 2023 by the authors. Licensee MDPI, Basel, Switzerland. This article is an open access article distributed under the terms and conditions of the Creative Commons Attribution (CC BY) license (http://creativecommons.org/licenses/by/4.0/).
Copyright: This open access article is published under a Creative Commons CC BY 4.0 license, which permit the free download, distribution, and reuse, provided that the author and preprint are cited in any reuse.