1. Introduction
Urban traffic is one of the main causes of the presence of pollutants such as nitrogen oxides (NO
X) and particulate matter (PM) in the atmosphere [
1]. Following the increase in international trade, the type of air pollution generated at sea risks being no less worrying than that generated on land [
2]. While for the terrestrial field there are two characteristic emissions of the diesel engine, the same cannot be said of traditional marine engines whose emissions also include SO
X following the use of heavy fuels containing sulphur. For these reasons, discussions on environmental issues have taken hold at an international level which have led to the enactment of Annex VI of MARPOL (Maritime Pollution) [
3] which establishes, among others, a maximum limit of 0.50% m/m of sulphur in fuels, creator of SO
X, which is the pollutant of which this article is concerned.
With the aim of reducing sulphur dioxide, the use of fuels with a low sulphur content would be preferable to scrubbing the burnt gases for reasons of space, but system problems and the increase in the cost of fossil fuels have renewed interest in the development of specific washing systems. A seawater scrubber (SWS) [
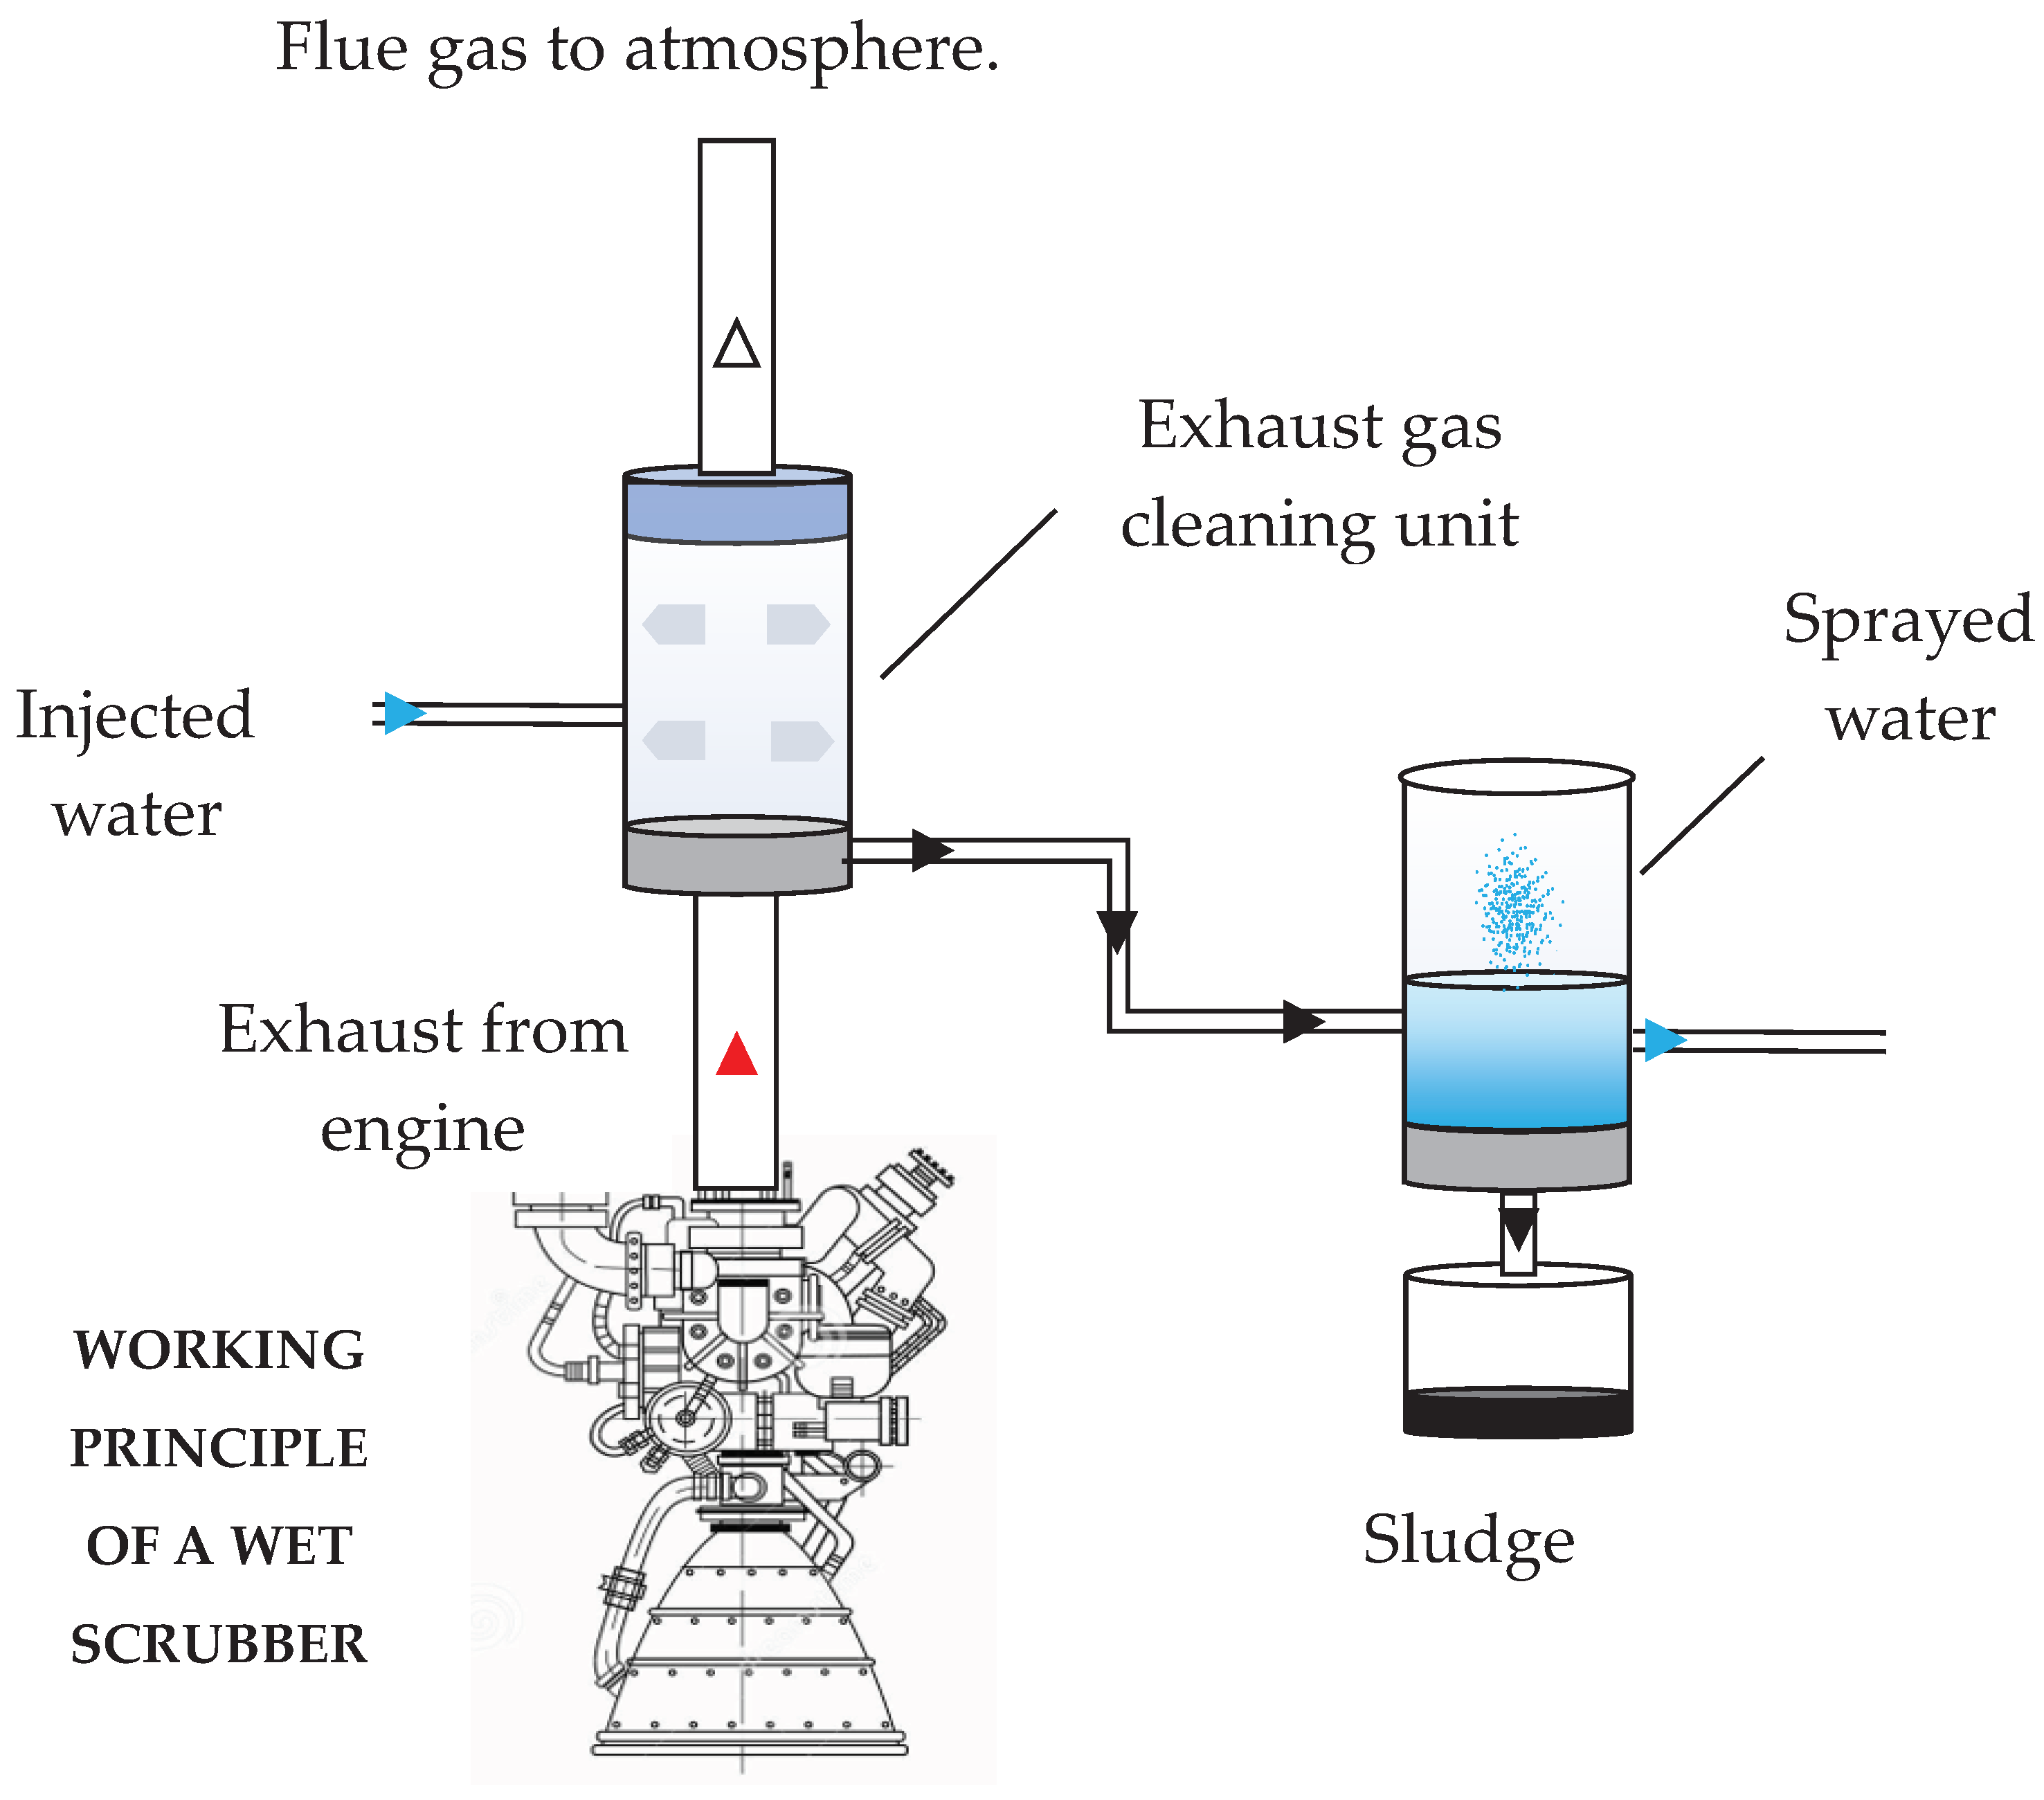
4] is a wet Exhaust Gas Cleaning System (EGCS), for which a schematic representation of the open loop type is shown in Figure
1. The engine exhaust gases are directed towards the scrubbing column, where inside nozzles that introduce sea water in the form of a counter-current spray are set up. Here the absorption process takes place, and the sulphur dioxide molecules are trapped in the water droplets making the gases low in SO
X before reaching the atmosphere. Contaminated droplets are collected at the bottom of the scrubber tower and then treated before being returned to the sea. Depending on the design and scrubbing liquid used, the sulphur dioxide removal efficiency in scrubber towers can reach over 90% [
5].
Figure 1.
Open loop SWS plant scheme
Figure 1.
Open loop SWS plant scheme
Absorption represents the phenomenon at the basis of desulphurization, and over the years various models of both an empirical and numerical nature have been developed to be able to study it and describe its physical and chemical interactions during exposure to exhaust gases [
6,
7,
8,
9,
10,
11,
12]. This article describes a simplified numerical model that simulates the absorption of SO
X by a water spray in a scrubbing process under variable conditions.
2. Absorption operation
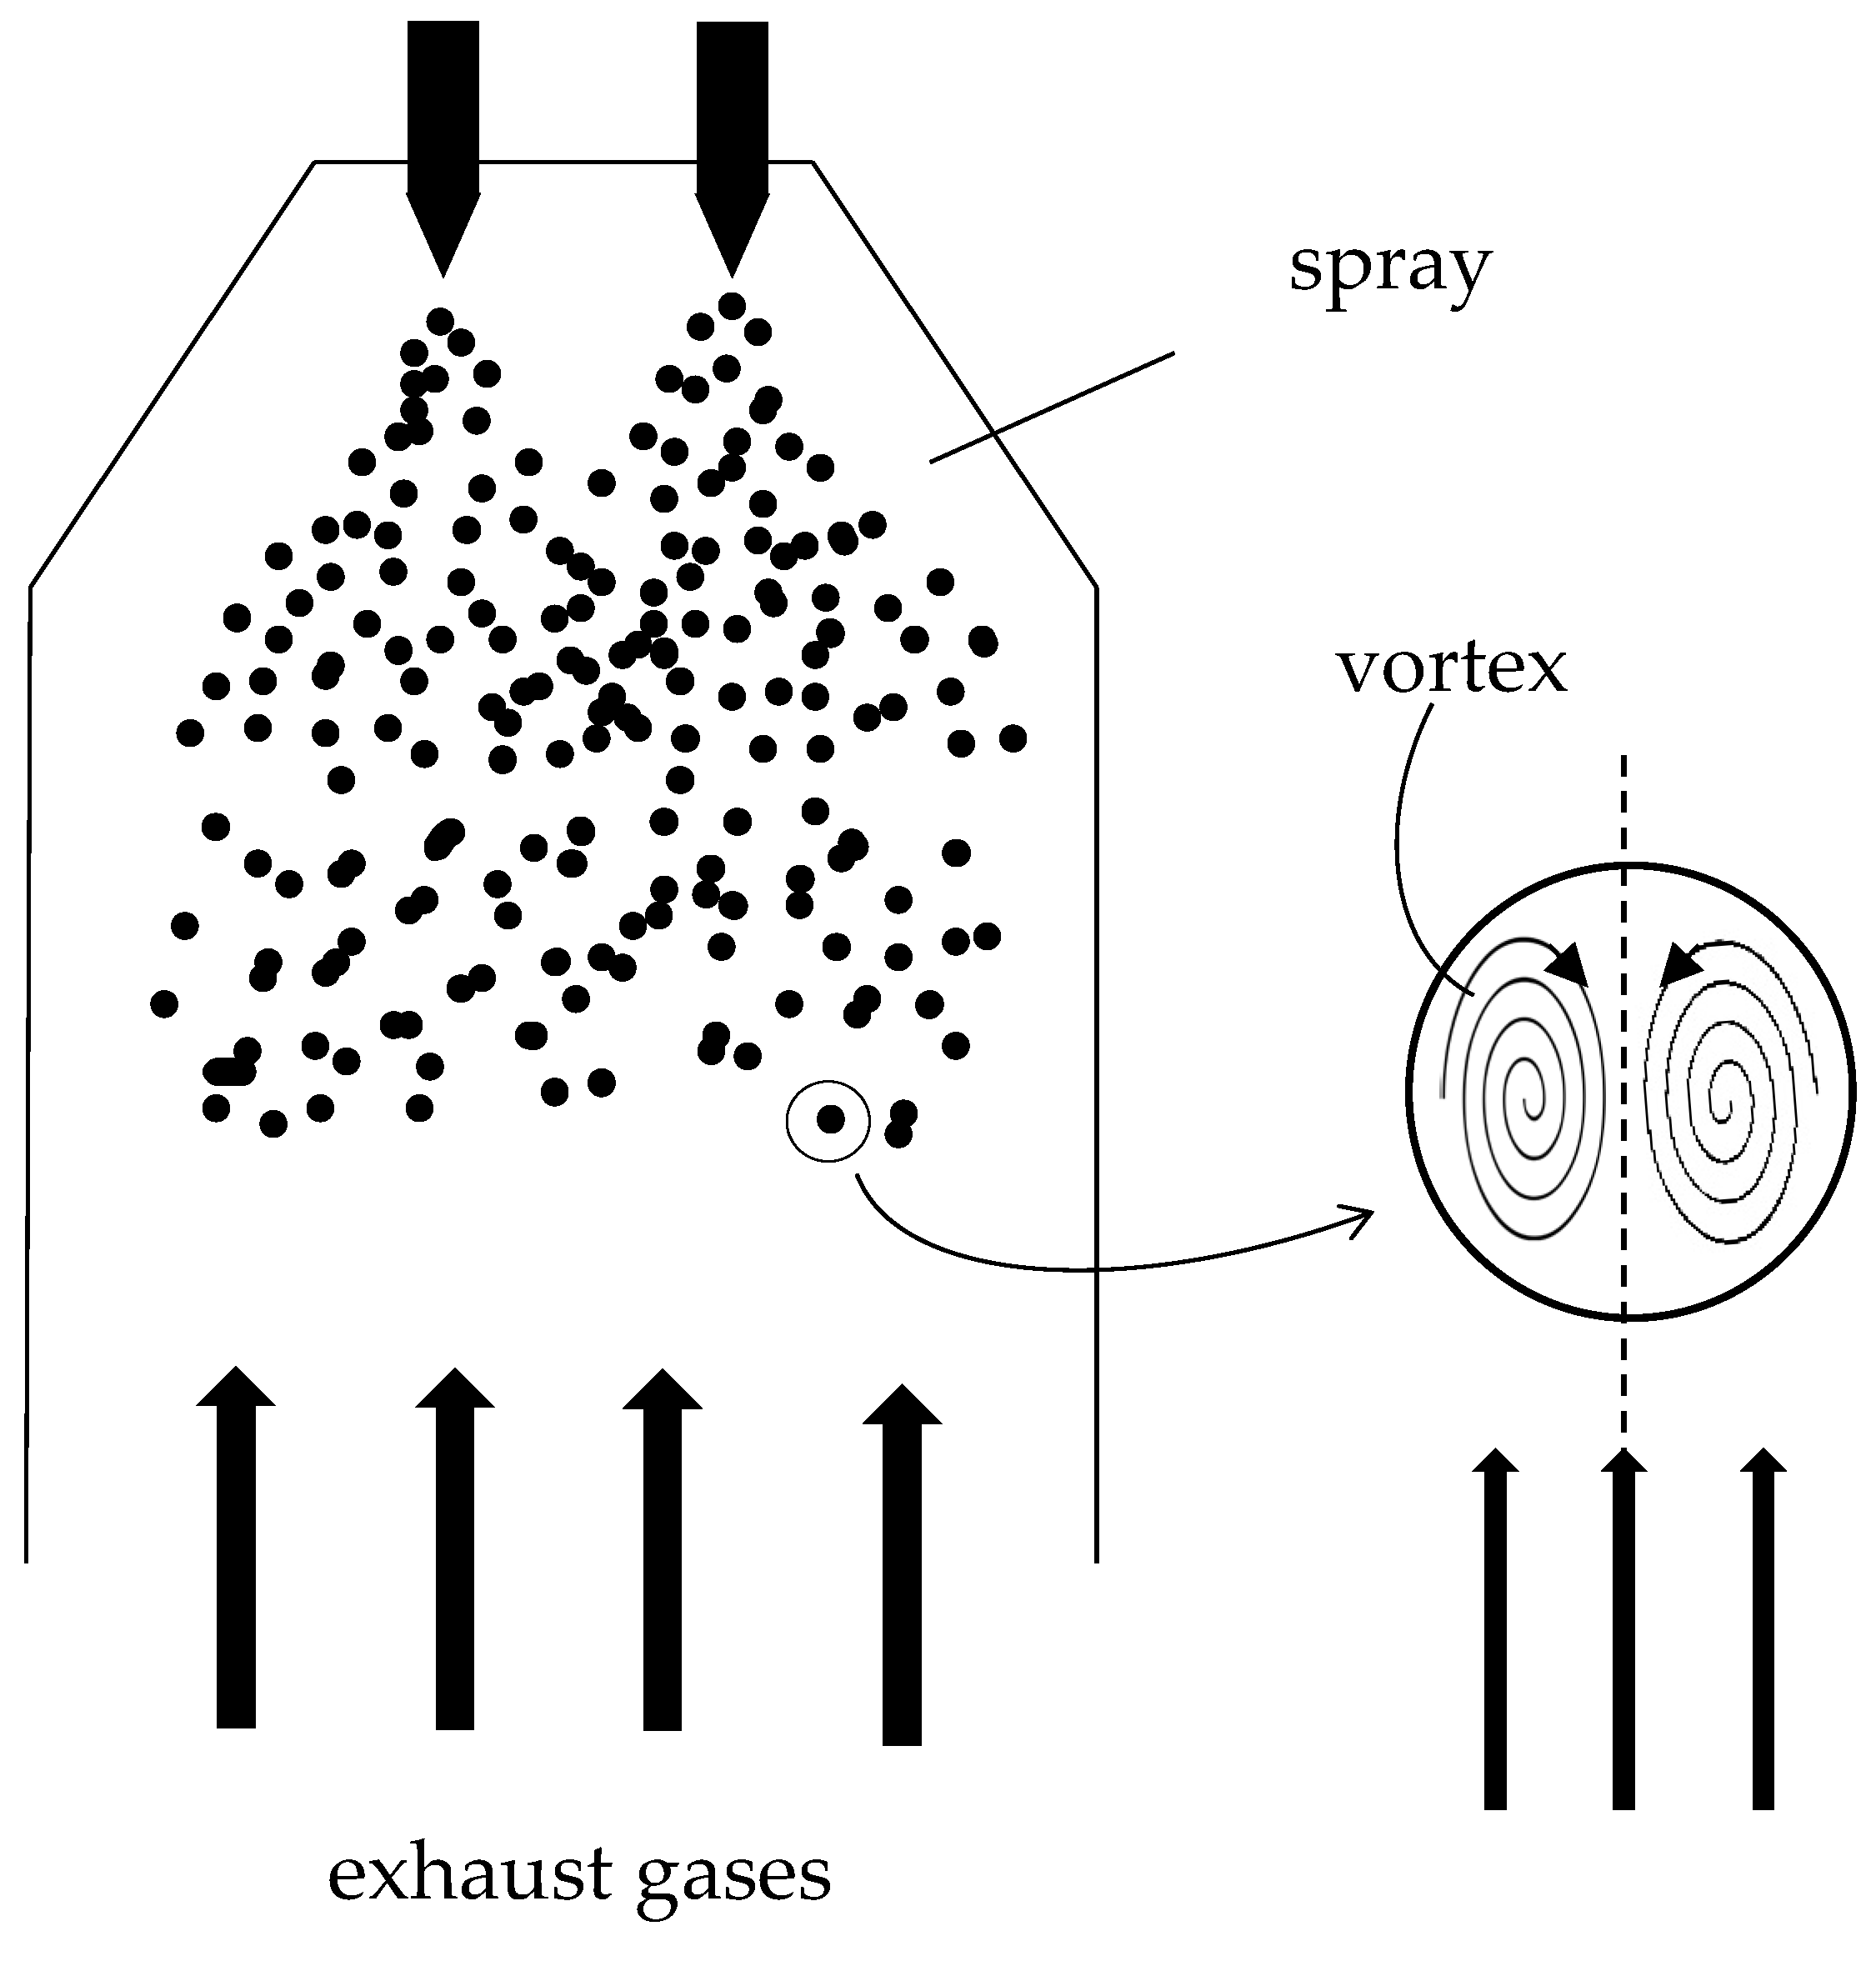
The scheme taken in reference is shown in Figure 3 [
13]. A single drop of sea water has been considered, spherical and falling inside the scrubbing column. The gases leaving the engine combustion chamber are in counter-current with respect to the motion of the drop. The desulphurization mechanism in a seawater scrubber is based on three concomitant phenomena: the dissolution of the SO
2 in the water, the subsequent transport inside the drops [
13,
14] and the chemical reaction between alkalis and dissolved SO
2. The alkalinity of the water is closely linked to the average temperature of the sea and is defined as the sum of the concentrations of the alkaline species contained within it [
15]. The term
represents the preponderant one and it is possible to set it equal to the total alkalinity at 2.4 mmol/kg
H2O [
16,
17].
When the droplet is exposed to a gaseous flow containing sulphur dioxide, a flow of SO
2 is established at the liquid-gas interface following its dissolution governed by Henry's law:
Figure 2.
Schematization of the scrubbing tower.
Figure 2.
Schematization of the scrubbing tower.
with [SO
2(aq)] equilibrium SO
2 concentration in kmol/m
3, p
SO2 partial pressure of sulphur dioxide in atm, k
H Henry's constant in kmol/(atm m
3). The sulphur dioxide dissolved in water accumulates in the peripheral area of the drop causing its saturation at first, thus preventing the entry of new molecules. However, chemical reactions take place between seawater, which contains alkalis, and SO
2 [
8,
17]:
(1.1) represents the dissolution of gaseous SO2 in water, within the limits imposed by Henry's law.
In this way, the sulphur dioxide molecules on the periphery of the drop tend to decrease because they react, allowing new SO
2 to enter. In addition to the chemical mechanism, the Hill’s vortex takes action [
13,
14,
17,
18] due to the shear stress induced by the relative motion between the drop and the gaseous flow in counter current. The swirling motion transports the reacting species inwards and ensures a continuous supply of seawater molecules on the liquid-gas interface ready to react, causing a convective motion of matter. Given the difference in concentration between two contiguous areas of the drop, there is also a diffusive motion of matter, the entity of which is closely linked to the concentration gradient between two close areas.
3. Numerical model
3.1. Started conditions and calculation scheme
The numerical model evaluates the absorption process in a drop of fresh water falling inside the scrubbing column. Once introduced, the droplet is immersed in the flue gas flow characterized by a certain speed, temperature and concentration of sulphur dioxide. The droplet evaporates due to the high temperatures causing a change in volume. The initial conditions assumed are shown in Table 1.
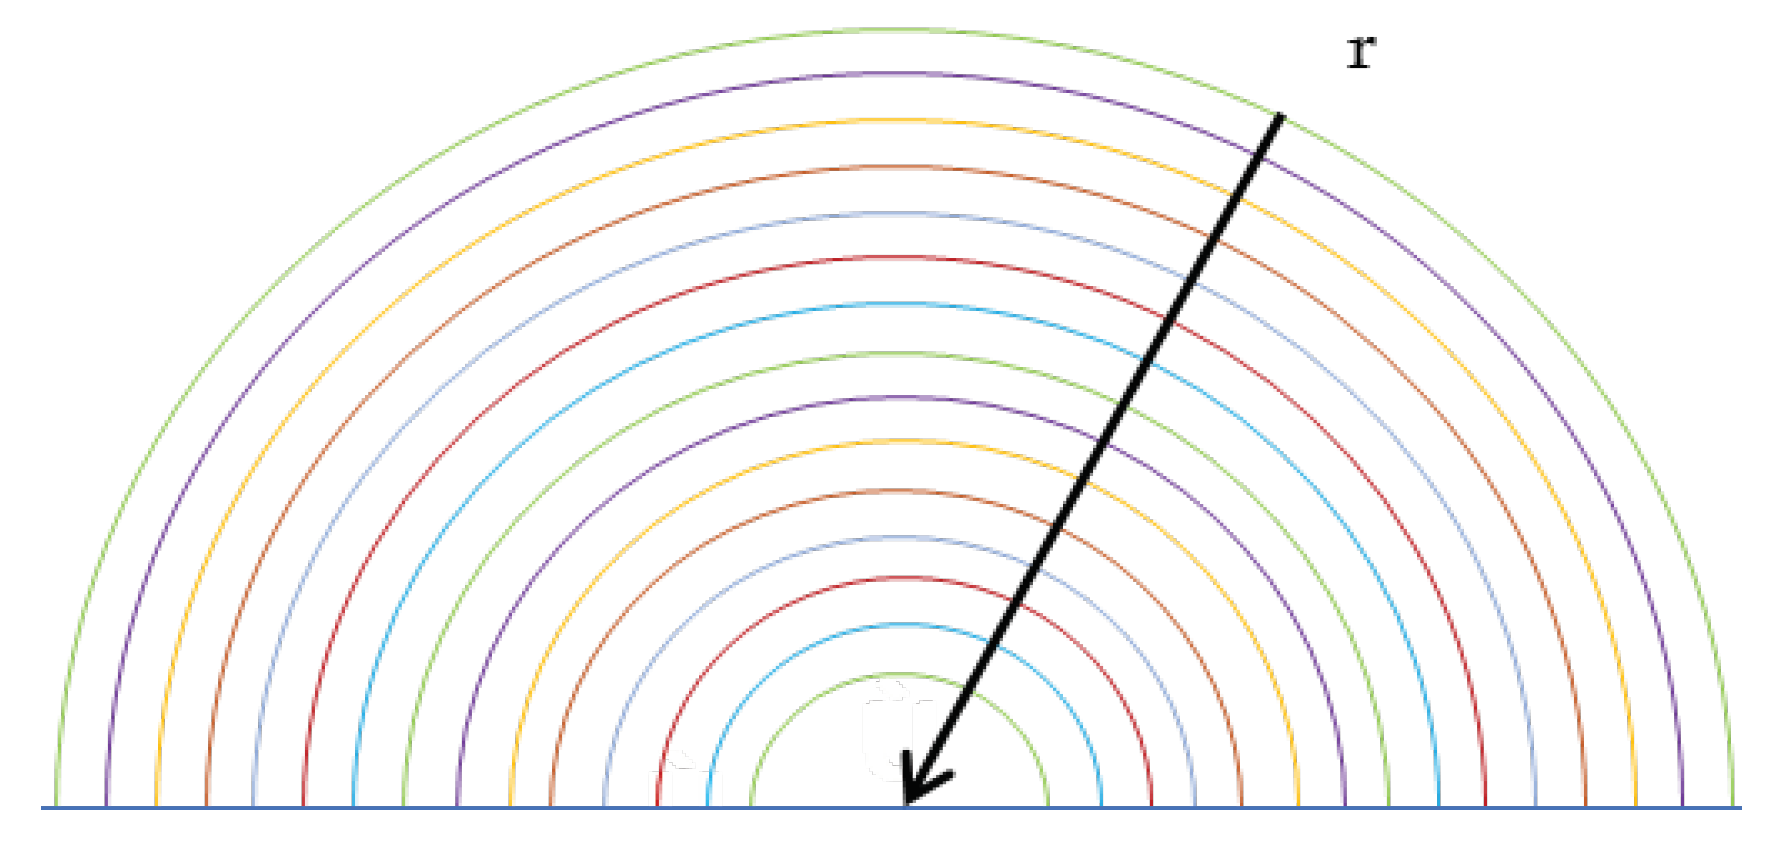
The calculation scheme is represented by half spherical drop divided in a NR number of concentric shells of equal thickness, as shown in Figure 3. The change in concentration is only evaluated radially to have a one-dimensional problem, therefore the Hill vortex is not evaluated. Furthermore, a drop of fresh water, without alkalis, has been considered, and by analysing the written chemical reactions, it has been found that the equilibrium constant of (2.3) equal to 1.4 x 10
-2 kmol/m
3 at 25 °C is much greater of 6.5 x 10
-8 kmol/m
3 of (2.4) at the same temperature, which is why the latter was considered negligible [
19]. In these conditions only (2.1 – 2.3) have been considered, but the instability of H
2SO
3 allows to write a new formulation:
(3) is the reaction considered during the simulation.
Table 1.
Started conditions.
Table 1.
Started conditions.
| Droplet |
Unit |
Values |
| Diameter (t=0) |
[mm] |
1 – 1.5 - 2 |
| Temperature (t=0) |
[K] |
298 |
| SO2 Concentration (t=0) |
[kmol/m3] |
0 |
| Flue Gas |
|
|
| Temperature |
[K] |
500 – 650 - 750 |
| SO2 Concentration (t=0) |
[ppm] |
620 – 720 – 820 - 920 |
| Speed |
[m/s] |
2 |
Figure 3.
Half spherical drop divided in a NR shells.
Figure 3.
Half spherical drop divided in a NR shells.
3.2. Absorption model
The species equation can be used to calculate a substance's concentration variation over time [
11]:
with C concentration of SO2 in kmol/m3, t time in s, u velocity vector of sulphur dioxide molecules inside the droplet in m/s, D diffusion coefficient of SO2 in m2/s, S source term in kmol /m3 s in the examined case. ∇∙(C u) is the convective term, while D∇2C is the diffusive term.
3.2.1. Diffusive term
Given the one-dimensional problem, (3) can be written:
The diffusivity term in (4) and (5) is Fick's second law, i.e. the one that refers to a non-stationary motion [
20]. The minus sign is given by the passage from the highest to the lowest concentration.
In order to further simplify the model, a different formulation is used which takes into account the difference in concentration between two contiguous volumes [
21]:
with N
SO2 molar flow of sulphur dioxide between two contiguous volumes in kmol/m
2 s, C
b concentration term of volume i-1 with respect to volume i under examination, at the same instant, C
a concentration at volume i, following volume i-1 going towards the centre of the drop, k
l is the local mass transfer coefficient of SO
2 in water in m/s, given by [
11,
12]:
with DSO2g diffusivity of sulphur dioxide in bulk gases in m2/s, d droplet diameter, Re Reynolds number and Sc Schimdt number.
The flow of matter entering (6.1) and exiting (6.2) this volume has been assessed by performing a mass balancing in volume i (i=1, ..., NR):
The amount of matter remaining in i in ∆t interval is:
The concentration in i is given by:
with Ai,t the surface through which the incoming and outgoing flows pass at the instant t. Since the thickness of the shell is very small, an approximation was made by assuming that for the same volume Vi,t the inlet and outlet surfaces have the same size at the same instant.
3.2.2. Source term
The source term determines the flow of matter between the bulk gas and the droplet, therefore it acts only on the surface volume. In this case the flow takes place between two different states of matter, therefore different mass transfer coefficients should be considered compared to the previous case. Also, the lack of a Hill vortex suggests a very quick saturation of the surface volume, reducing absorption.
Assuming that the chemical reaction takes place faster than diffusion, not all SO
2 diffuse instantaneously inside the drop but only a small part obtained from the difference between reactants and products of the (3). The equilibrium concentration of the
has been obtained from the equilibrium constant formulation of the reaction (3):
The concentration in aqueous solution of sulphur dioxide is that of saturation regulated by (1):
with k
H equal to 1.2 kmol/m
3 atm under standard conditions and with the law of variation [
22]:
where K
0 is the equilibrium constant at the reference conditions, ∆H
soln is the enthalpy of the solution, T is the temperature in K, and T
0 is the reference temperature (298.15 K).
The concentration of
at equilibrium represents the quantity of SO
2 which reacts in (3), therefore only the remaining part diffuses inside the drop. Assuming that the saturation concentration to the surface volume is reached from the first instant, once the part of SO
2 that goes to react has been subtracted, it is assumed that the drop is able to absorb the same quantity in the following instant, therefore a constant saturation happens on the surface volume. The flow of sulphur dioxide entering at time t is equal to:
Reaction (3) also takes place in the internal volumes of the drop, therefore they have been subtracted by an amount
when the diffusive flux is evaluated too. (8) has been modified:
4. Results
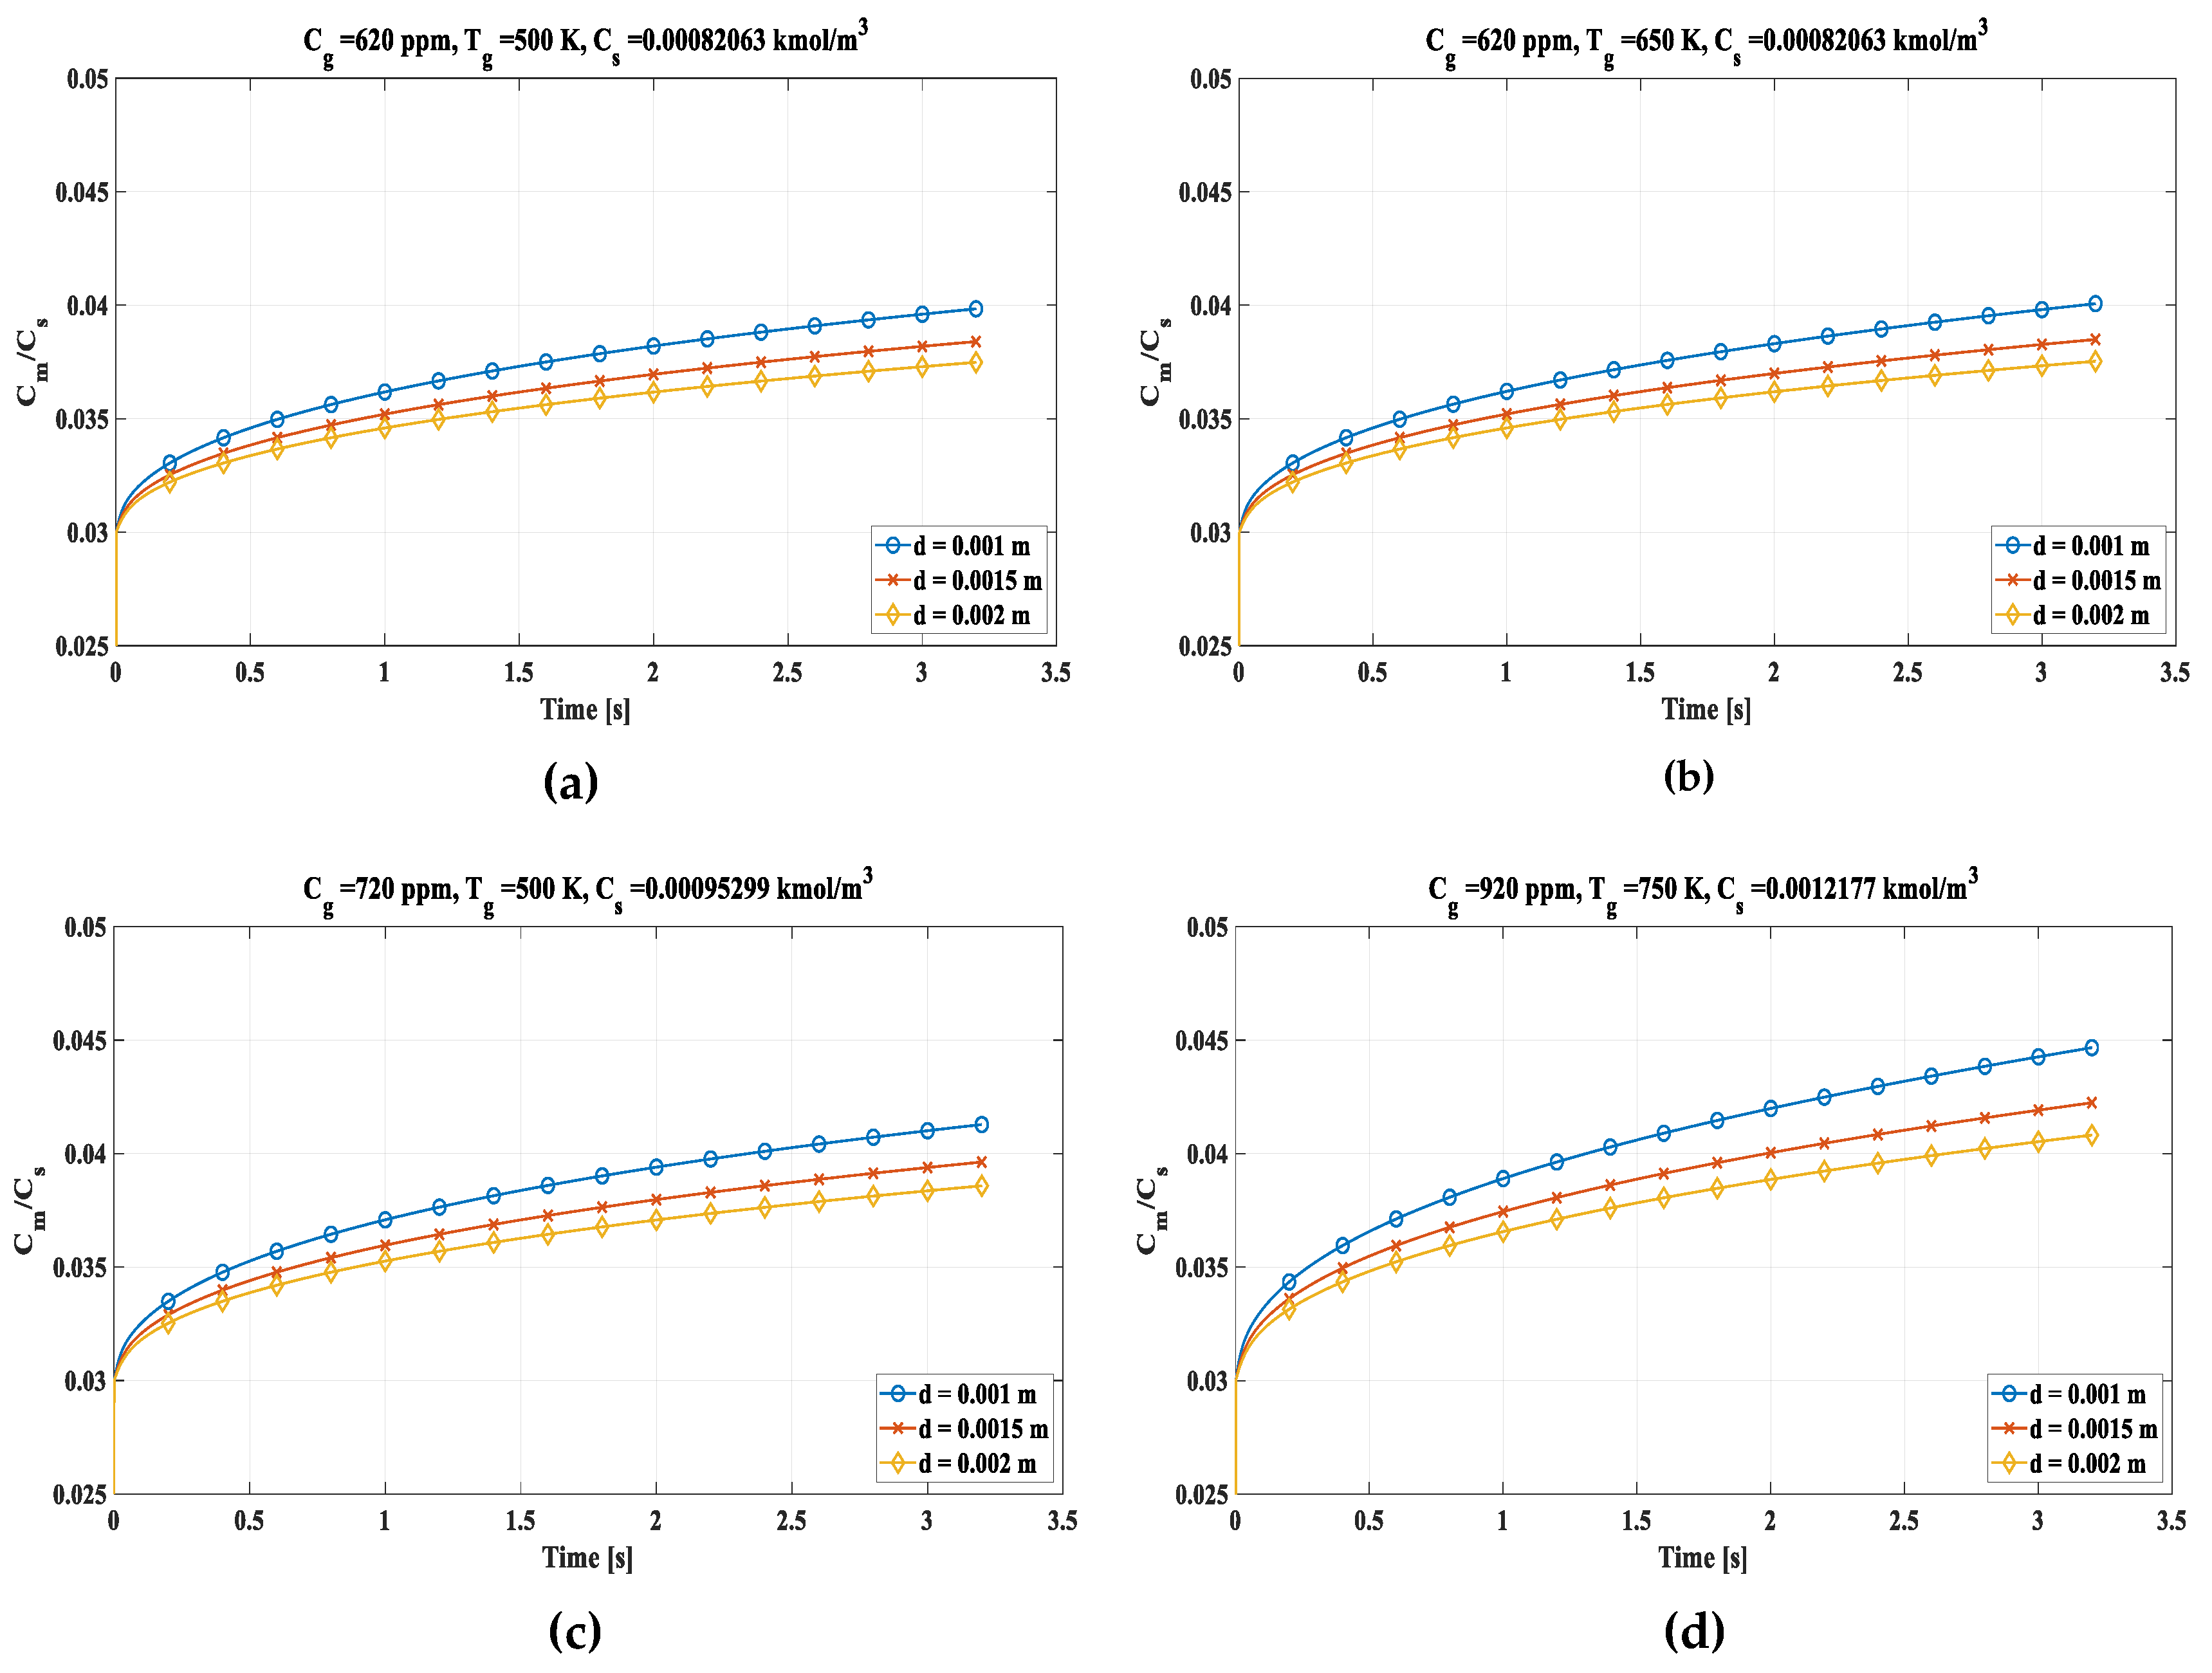
The elaborations were performed with a time interval of 0.0004 s for a total of 3.2 s, therefore 8000 iterations were performed for each case study. The drops were divided into 50 concentric shells.
The average concentration of sulphur dioxide is calculated in relation to the saturation concentration as time varies. The simulation has been performed for different initial conditions (Figure 4). The smaller drops accumulate more SO2 in less time and a variation in the concentration of sulphur dioxide inside the exhaust gases has a greater impact on the quantity absorbed than an increase in temperature of the bulk gases, but in all cases saturation condition is far. Case (a) is representative of the conditions of concentration of SO2 in the gases equal to 620 ppm and temperature of the exhaust gases of 500 K. These are typical values for the exhaust gases of the marine engine. It should be noted that the 1 mm drop has the highest average concentration of SO2. In (b) the exhaust gas concentration is the same as in (a), but the temperature is 650 K. There is a slight increase in the mean concentrations of sulphur dioxide in the droplets due to the faster evaporation of the droplet. In (c) the flue gas temperature is the same as in (a), but the concentration is 720 ppm. The increase in mean concentration is greater than in (b), therefore an increase in concentration of SO2 in the gases is more significant than the increase in temperature. In (d) the most severe case evaluated has been represented, with a sulphur dioxide concentration of 920 ppm and a temperature of 750 K. These are unusual values for flue gases, but the increase in average concentration is the most significant. Also in (d) the saturation concentration is very far. Such low ratio values are due in part to the absence of the Hill vortex and in part to the absence of the alkalis which bind with the SO2, making the absorption phenomenon slow.
Figure 4.
Trend of the ratio between the average concentration Cm and the saturation concentration Cs over time with different initial diameter. (a) SO2 concentration into gas (Cg) = 620 ppm, gas temperature (Tg) = 500 K. (b) Cg = 620 ppm, Tg = 650 K. (c) Cg = 720 ppm, Tg = 700 K. (d) Cg = 920 ppm, Tg = 750 K.
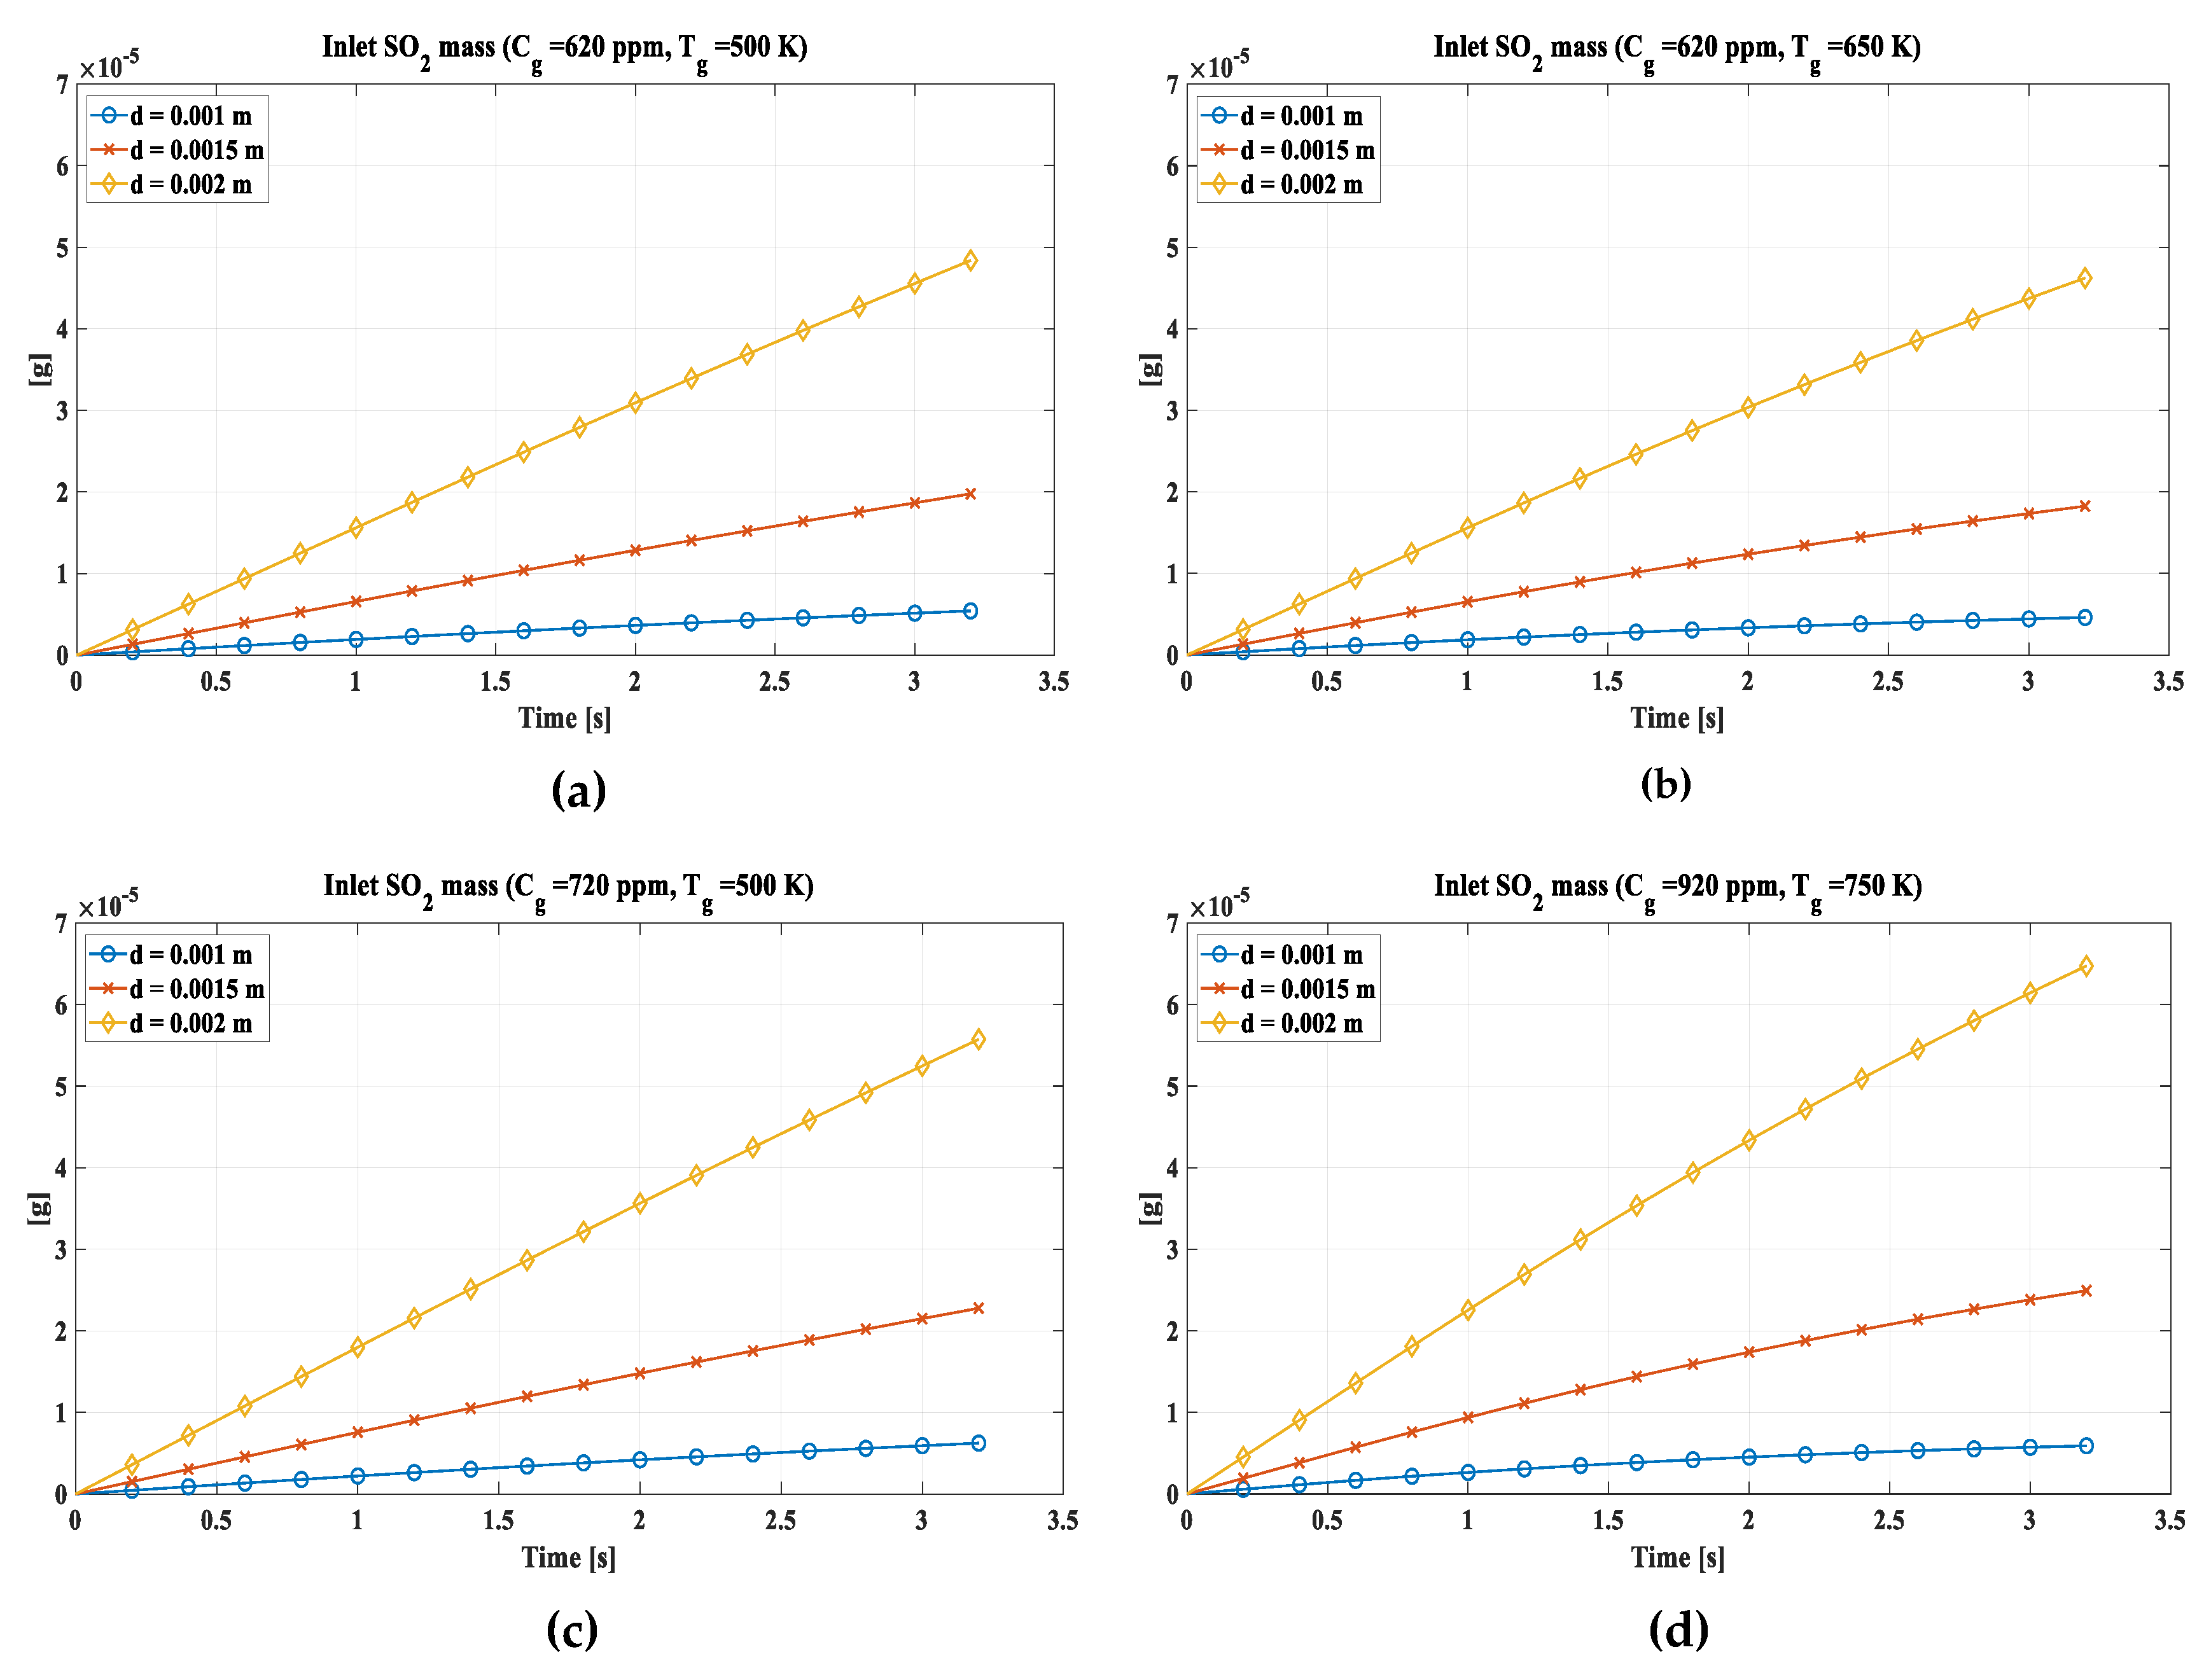
The inputs of sulfur dioxide into the drop as time varied were also evaluated (Figure 5). The trend presents a slight curvature, more accentuated for the higher temperatures evaluated, due to the evaporation of the drop and the consequent decrease in volume which induces the single shell to go into saturation more easily, thus slowing down the entry of SO2. (a) assumes a SO2 concentration in the exhaust gas of 620 ppm and a temperature of 500 K. The 2 mm diameter absorbs almost 5 x 10⁻⁵ g of SO2, while the 1.5 mm diameter absorbs about 2 x 10⁻⁵ g, and the 1 mm one does not reach 10-5 g. This disparity is mainly due to the size of the heat exchange surface, which is higher in the 2 mm drop. In (b), as the temperature increases, the quantity of absorbed SO2 decreases slightly following the evaporation of the drop, therefore the decrease in volume, which limits the inlet. In (c) there is a SO2 concentration of 720 ppm which induces an increase of SO2 absorbed in the drop compared to (a). In (d) the most severe conditions are evaluated with a concentration of 920 ppm and a temperature of 750 K. Here although the temperature has increased leading to a decrease in absorption, the increase in concentration is a predominant phenomenon which in any case leads to an increase in the absorbed SO2.
Figure 5.
Inlet mass of SO2 in a single drop. (a) Cg = 620 ppm, Tg = 500 K. (b) Cg = 620 ppm, Tg = 650 K. (c) Cg = 720 ppm, Tg = 500 K; (d) Cg = 920 ppm, Tg = 750 K.
Figure 5.
Inlet mass of SO2 in a single drop. (a) Cg = 620 ppm, Tg = 500 K. (b) Cg = 620 ppm, Tg = 650 K. (c) Cg = 720 ppm, Tg = 500 K; (d) Cg = 920 ppm, Tg = 750 K.
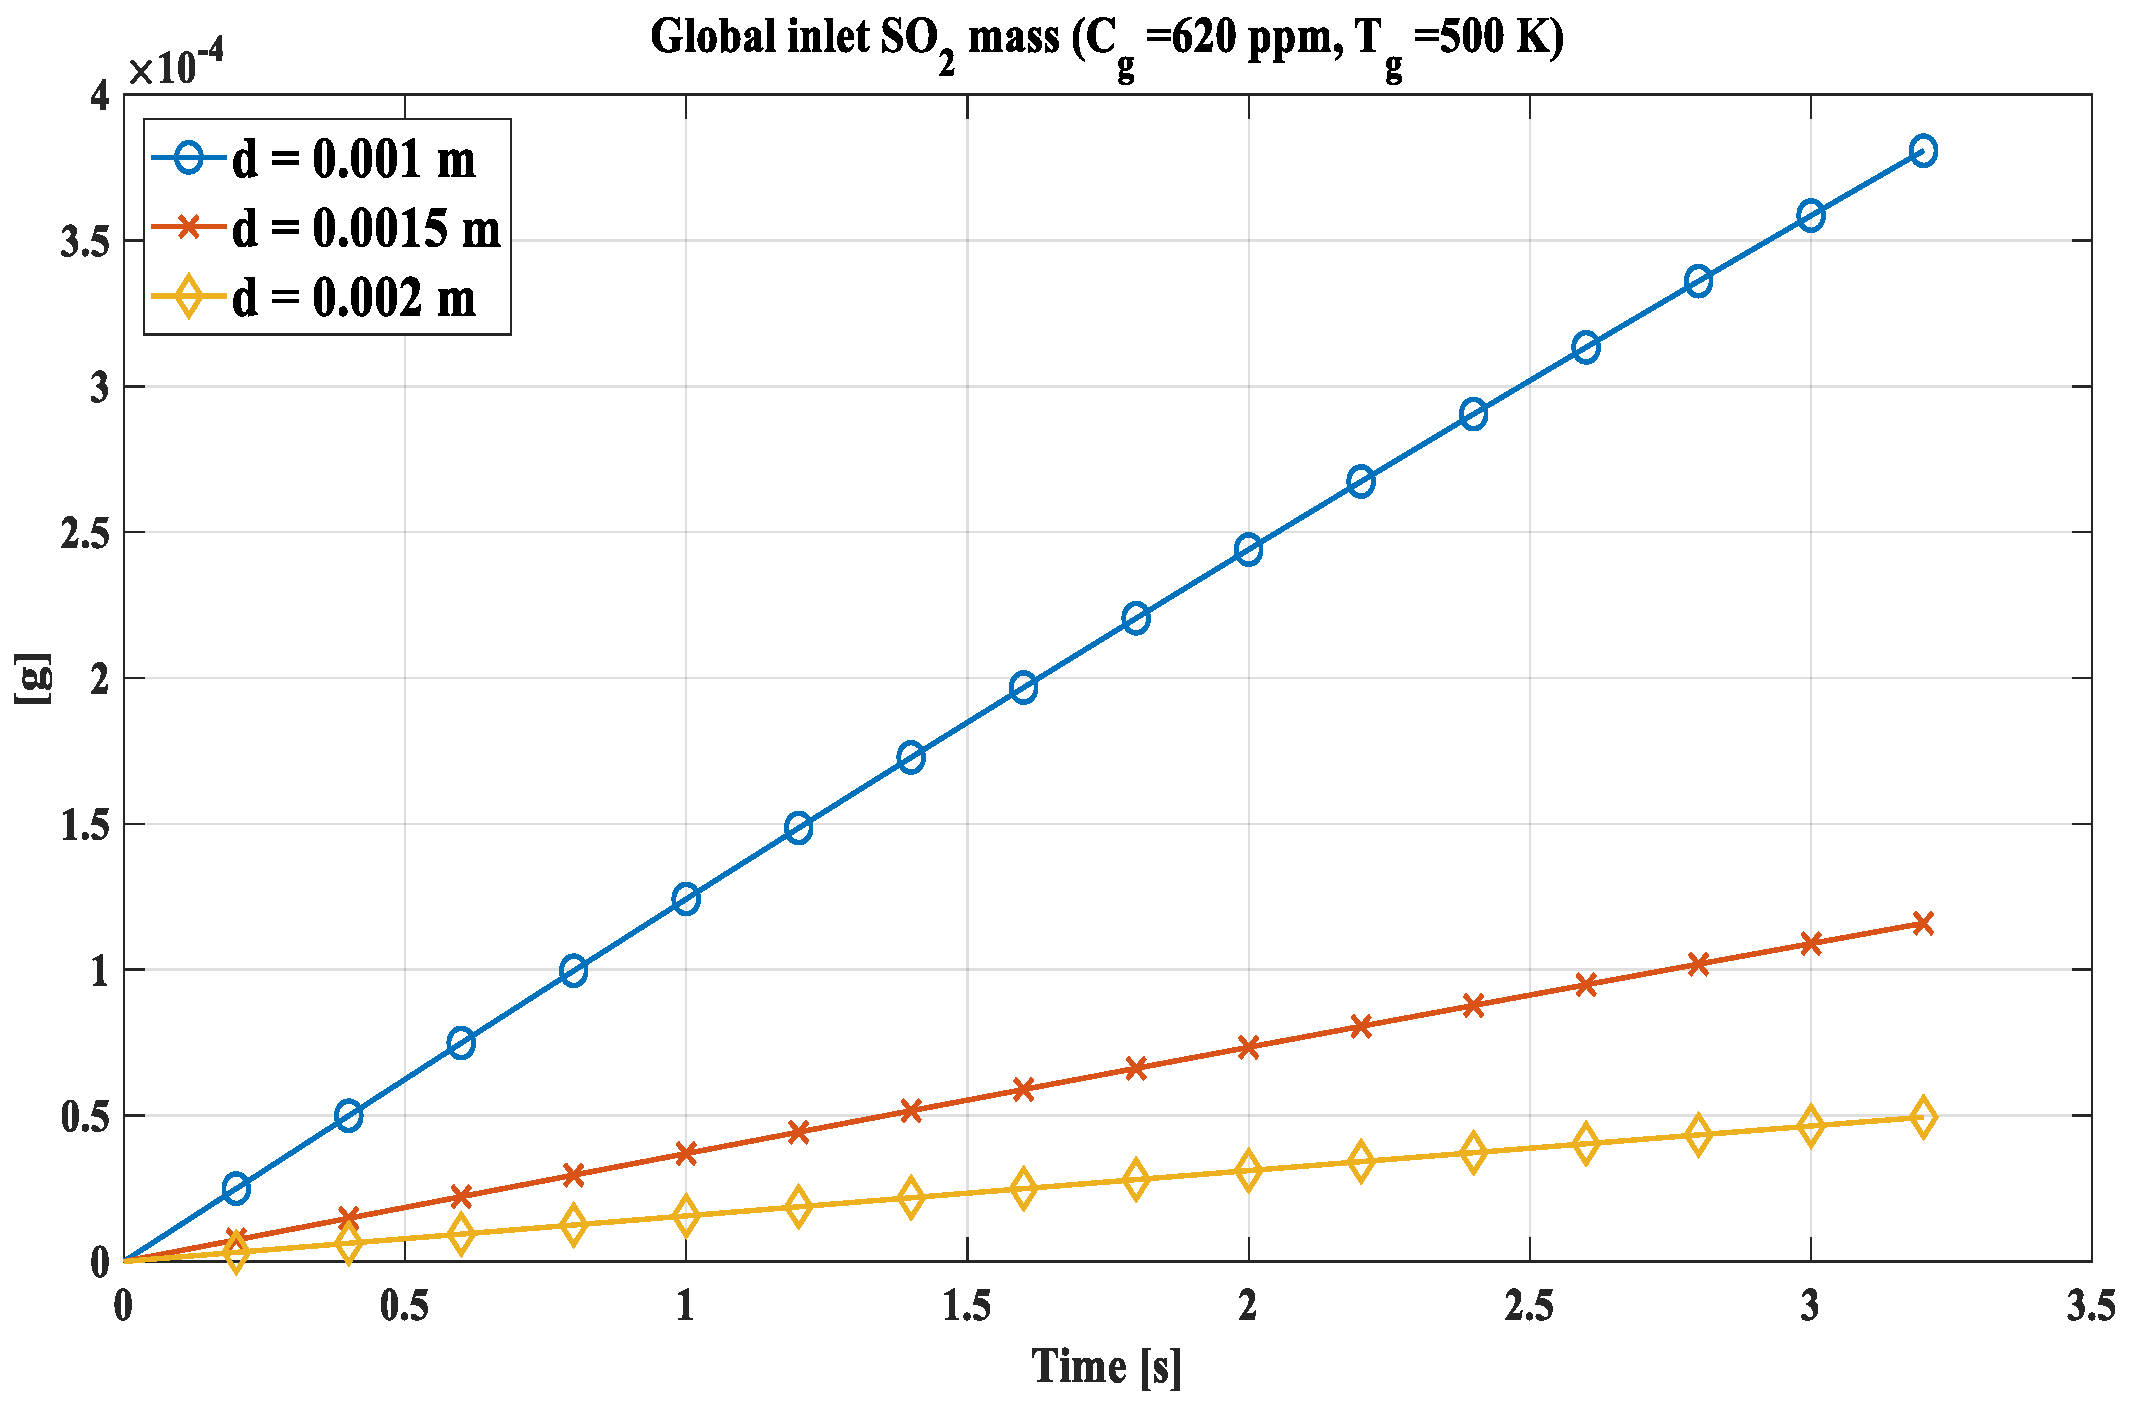
Known the behaviour of the single drop, the calculation has been implemented for a number Ni of drops. Ni represents the number of 1 mm or 1.5 mm droplets required for their mass reach that of a single 2 mm drop. Ni for 1 mm drops is equal to 8, while for 1.5 mm it is 2.3704. In this way it is possible to compare the absorption capacity of the same mass of water introduced into the scrubbing column in the form of different drops. The trend is shown in Figure 6, where the graph is shown for 620 ppm and 500 K, probable values for a stream of exhaust gases.
5. Conclusions
In this article a simplified numerical model has been described for the simulation of the sulphur dioxide absorption phenomenon by a drop of water falling inside a scrubbing column, and completely invested by the exhaust gases of a diesel engine naval type. The absence of Hill’s vortex and a simplified chemical model has been supposed.
Figure 6.
Global inlet SO2 mass for Ni droplets. N1.0= 8; N1.5 = 2.3704.
Figure 6.
Global inlet SO2 mass for Ni droplets. N1.0= 8; N1.5 = 2.3704.
Saturation condition on the whole drop is very far due to the absence of the convective term, thus leading to the saturation of only the outermost shells making the absorption slow. This is also accentuated by the decrease in droplet volume due to evaporation, which increases the average concentrations.
Inherently the mass of SO2 captured, it was found that the Ni drops with the smallest diameter computed are able to absorb more sulphur dioxide for the same mass of water given the greater surface-volume ratio, reaching about 3.8 x 10⁻⁴ g for the 8 drops of 1 mm compared to 4.9 x 10⁻⁵ g of the 2 mm drop at the conditions of SO2 concentration and temperature of 620 ppm and 500 K respectively, representing typical values for naval bulk gases.
References
- İ. A. Reşitoğlu, K. Altinişik, and A. Keskin, ‘The pollutant emissions from diesel-engine vehicles and exhaust aftertreatment systems’, Clean Techn Environ Policy, vol. 17, no. 1, pp. 15–27, Jan. 2015. [CrossRef]
- G. Langella, P. Iodice, A. Amoresano, and A. Senatore, ‘Marine Engines Emission and Dispersion in Fuel Switching Operation: A Case Study for the Port of Naples’, Energy Procedia, vol. 101, pp. 368–375, Nov. 2016. [CrossRef]
- MEPC.320(74): Guidelines for consistent implementation of the 0.50 % sulphur limit under MARPOL Annex VI. Available online: Index of MEPC Resolutions and Guidelines related to MARPOL Annex VI (imo.org).
- Exhaust gas scrubber washwater effluent. Available online: Exhaust Gas Scrubber Washwater Effluent (epa.gov).
- R. K. Srivastava, W. Jozewicz, and C. Singer, ‘SO2 scrubbing technologies: A review’, Environmental Progress, vol. 20, no. 4, pp. 219–228, 2001. [CrossRef]
- C. J. Walcek and H. R. Pruppacher, ‘On the scavenging of SO2 by cloud and raindrops: I. A theoretical study of SO2 absorption and desorption for water drops in air’, J Atmos Chem, vol. 1, no. 3, pp. 269–289, Sep. 1983. [CrossRef]
- C. Walcek, P. K. Wang, J. H. Topalian, S. K. Mitra, and H. R. Pruppacher, ‘An Experimental Test of a Theoretical Model to Determine the Rate at which Freely Falling Water Drops Scavenge SO2 in Air’, Journal of the Atmospheric Sciences, vol. 38, no. 4, pp. 871–876, Apr. 1981. [CrossRef]
- Saboni and S. Alexandrova, ‘Sulfur dioxide absorption and desorption by water drops’, Chemical Engineering Journal, vol. 84, no. 3, pp. 577–580, Dec. 2001. [CrossRef]
- R. Kaji, Y. Hishinuma, and H. Kuroda, ‘SO2 absorption by water droplets.’, J. Chem. Eng. Japan / JCEJ, vol. 18, no. 2, pp. 169–172, 1985. [CrossRef]
- M. R. Talaie, J. Fathikalajahi, and M. Taheri, ‘Mathematical Modeling of SO 2 Absorption in a Venturi Scrubber’, Journal of the Air & Waste Management Association, vol. 47, no. 11, pp. 1211–1215, Nov. 1997. [CrossRef]
- M. I. Lamas, C. G. Rodríguez, J. D. Rodríguez, and J. Telmo, ‘Numerical Model of SO Scrubbing with Seawater Applied to Marine Engines’, Polish Maritime Research, vol. 23, no. 2, pp. 42–47, Apr. 2016. [CrossRef]
- G. Caiazzo, A. Di Nardo, G. Langella, and F. Scala, ‘Seawater scrubbing desulfurization: A model for SO2 absorption in fall-down droplets’, Environmental Progress & Sustainable Energy, vol. 31, no. 2, pp. 277–287, 2012. [CrossRef]
- W.-H. Chen, ‘Air pollutant absorption by single moving droplets with drag force at moderate Reynolds numbers’, Chemical Engineering Science, vol. 61, no. 2, pp. 449–458, Jan. 2006. [CrossRef]
- W.-H. Chen, ‘Unsteady absorption of sulfur dioxide by an atmospheric water droplet with internal circulation’, Atmospheric Environment, vol. 35, no. 13, pp. 2375–2393, May 2001. [CrossRef]
- H.-C. Kim and K. Lee, ‘Significant contribution of dissolved organic matter to seawater alkalinity’, Geophysical Research Letters, vol. 36, no. 20, 2009. [CrossRef]
- Flagiello Domenico, Di Natale Francesco, Lancia Amedeo, and Salo Kent, ‘Effect of Seawater Alkalinity on the Performances of a Marine Diesel Engine Desulphurization Scrubber’, Chemical Engineering Transactions, vol. 86, pp. 505–510, Jun. 2021. [CrossRef]
- G. Caiazzo, (EN) Seawater scrubber for the desulphurization of flue gases produced by a naval engine; numerical analysis, experimentation, comparison with the use of fuels with a low sulfur content, (ITA) Seawater scrubber per la desolforazione di gas combusti prodotti da un motore navale; analisi numerica, sperimentazione, confronto con l'utilizzo di combustibili a basso tenore di zolfo. PhD Thesis, University of Naples ‘Federico II’, Naples, 2011.
- A. S. Simonsen, Modelling and Analysis of Seawater Scrubbers for Reducing SOx Emissions from Marine Engines. PhD Thesis, Aalborg University, 2018.
- L. B. Baboolal, H. R. Pruppacher, and J. H. Topalian, ‘A Sensitivity Study of a Theoretical Model Of SO2 Scavenging by Water Drops in Air’, Journal of the Atmospheric Sciences, vol. 38, no. 4, pp. 856–870, Apr. 1981. [CrossRef]
- R. B. Bird, W. E. Stewart and E. N. Lightfoot. Chapter 17: Diffusivity and the mechanism of mass transport. In Transport Phenomena, 2nd edition; John Wiley & Sons, Inc, United States of America, ANNO??
- T. Bešenić, M. Vujanović, J. Baleta, K. Pachler, N. Samec, and M. Hriberšek, ‘Numerical analysis of sulfur dioxide absorption in water droplets’, Open Physics, vol. 18, no. 1, pp. 104–111, Jan. 2020. [CrossRef]
- R. Sander, ‘Compilation of Henry’s law constants, version 3.99’, Atmospheric Chemistry and Physics Discussions, vol. 14, pp. 29615–30521, Nov. 2014. [CrossRef]
|
Disclaimer/Publisher’s Note: The statements, opinions and data contained in all publications are solely those of the individual author(s) and contributor(s) and not of MDPI and/or the editor(s). MDPI and/or the editor(s) disclaim responsibility for any injury to people or property resulting from any ideas, methods, instructions or products referred to in the content. |
© 2023 by the authors. Licensee MDPI, Basel, Switzerland. This article is an open access article distributed under the terms and conditions of the Creative Commons Attribution (CC BY) license (http://creativecommons.org/licenses/by/4.0/).
