Submitted:
10 April 2023
Posted:
11 April 2023
You are already at the latest version
Abstract
Keywords:
1. Introduction
2. Materials and Methods
2.1. Materials
2.2. Sample preparation
2.2.1. Binary systems
| Code-Name | Reactive Dye component | Cationic Polymer Modifier component |
|---|---|---|
| NR-homo | Novacron Ruby NRS-3B | PVBCTEAM |
| NR-copo | Novacron Ruby NRS-3B | P(VBC-co-VBCTEAM53) |
| RBB-homo | Remazol Brilliant Blue R | PVBCTEAM |
| RBB-copo | Remazol Brilliant Blue R | P(VBC-co-VBCTEAM53) |
2.2.2. Ternary systems
2.3. Analytical techniques
2.3.1. Scanning Electron Microscopy (SEM)
2.3.2. Attenuated Total Reflection Fourier Transform Infrared Spectroscopy (ATR-FTIR)
2.3.3. X-ray Photoelectron Spectroscopy (XPS)
2.3.4. UV-Vis and Fluorescence spectroscopy
3. Results and Discussion
3.1. Characterization of reactive dyes
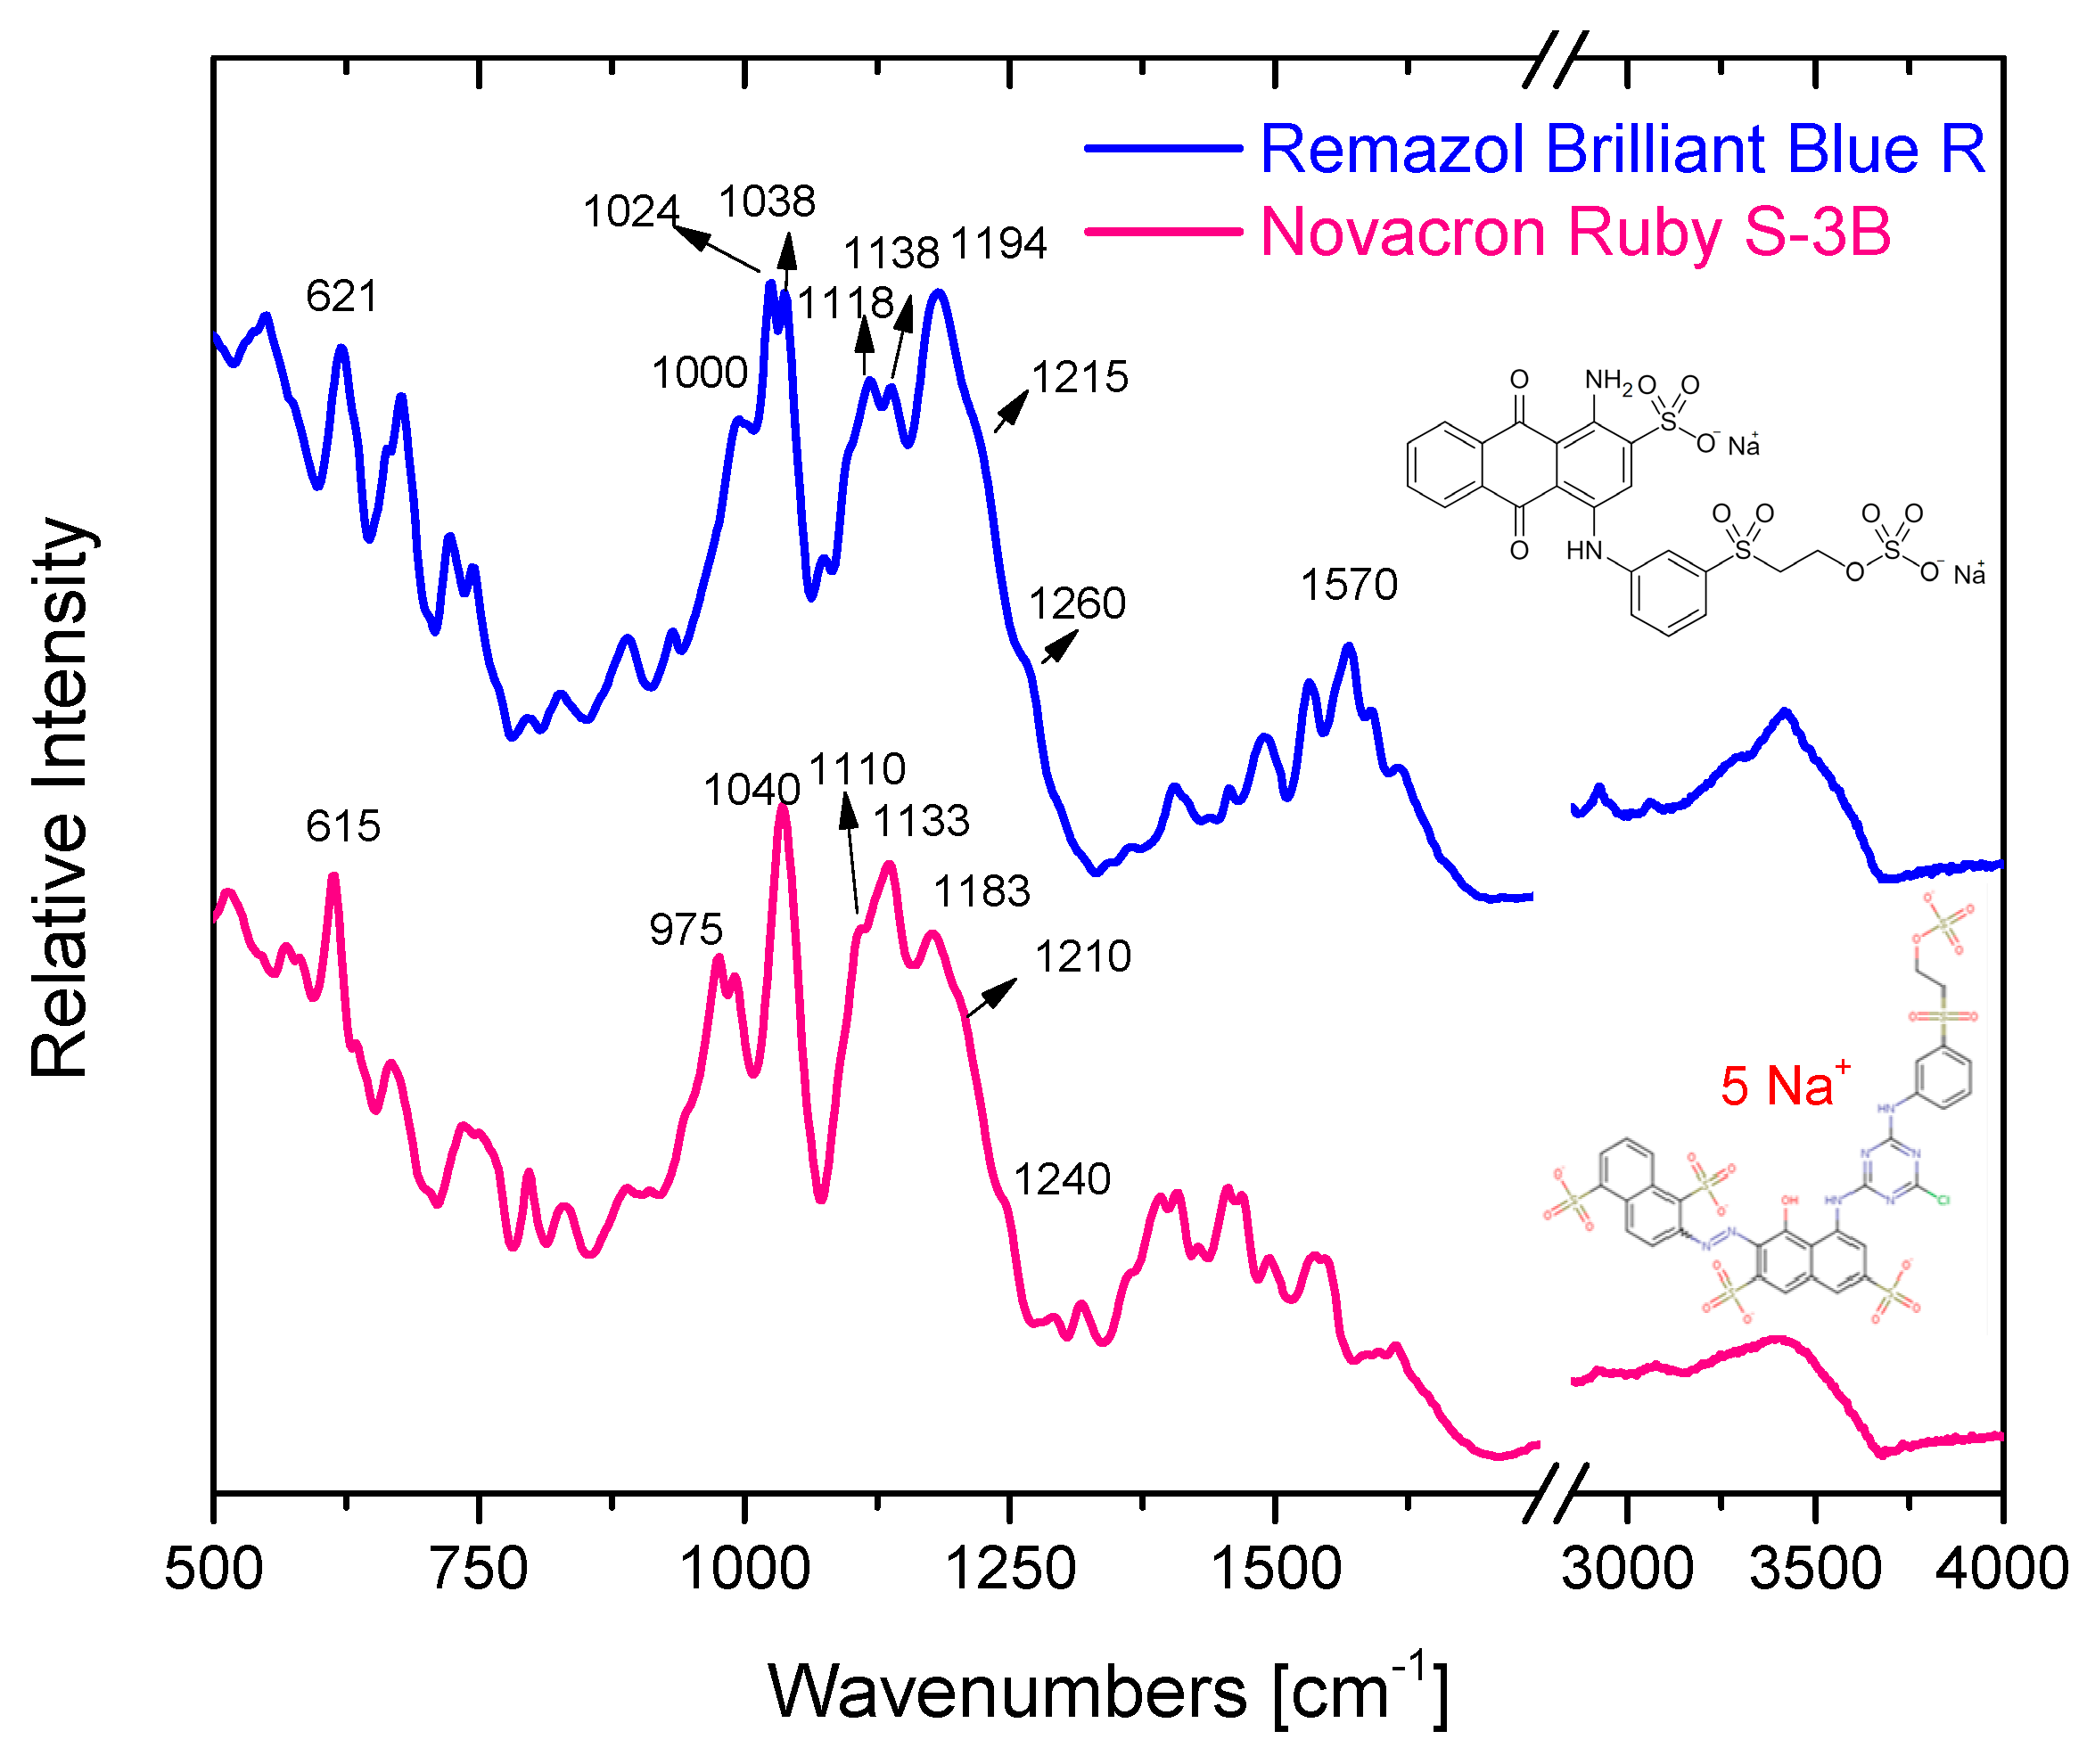
| Ruby | Blue | Assignment |
|---|---|---|
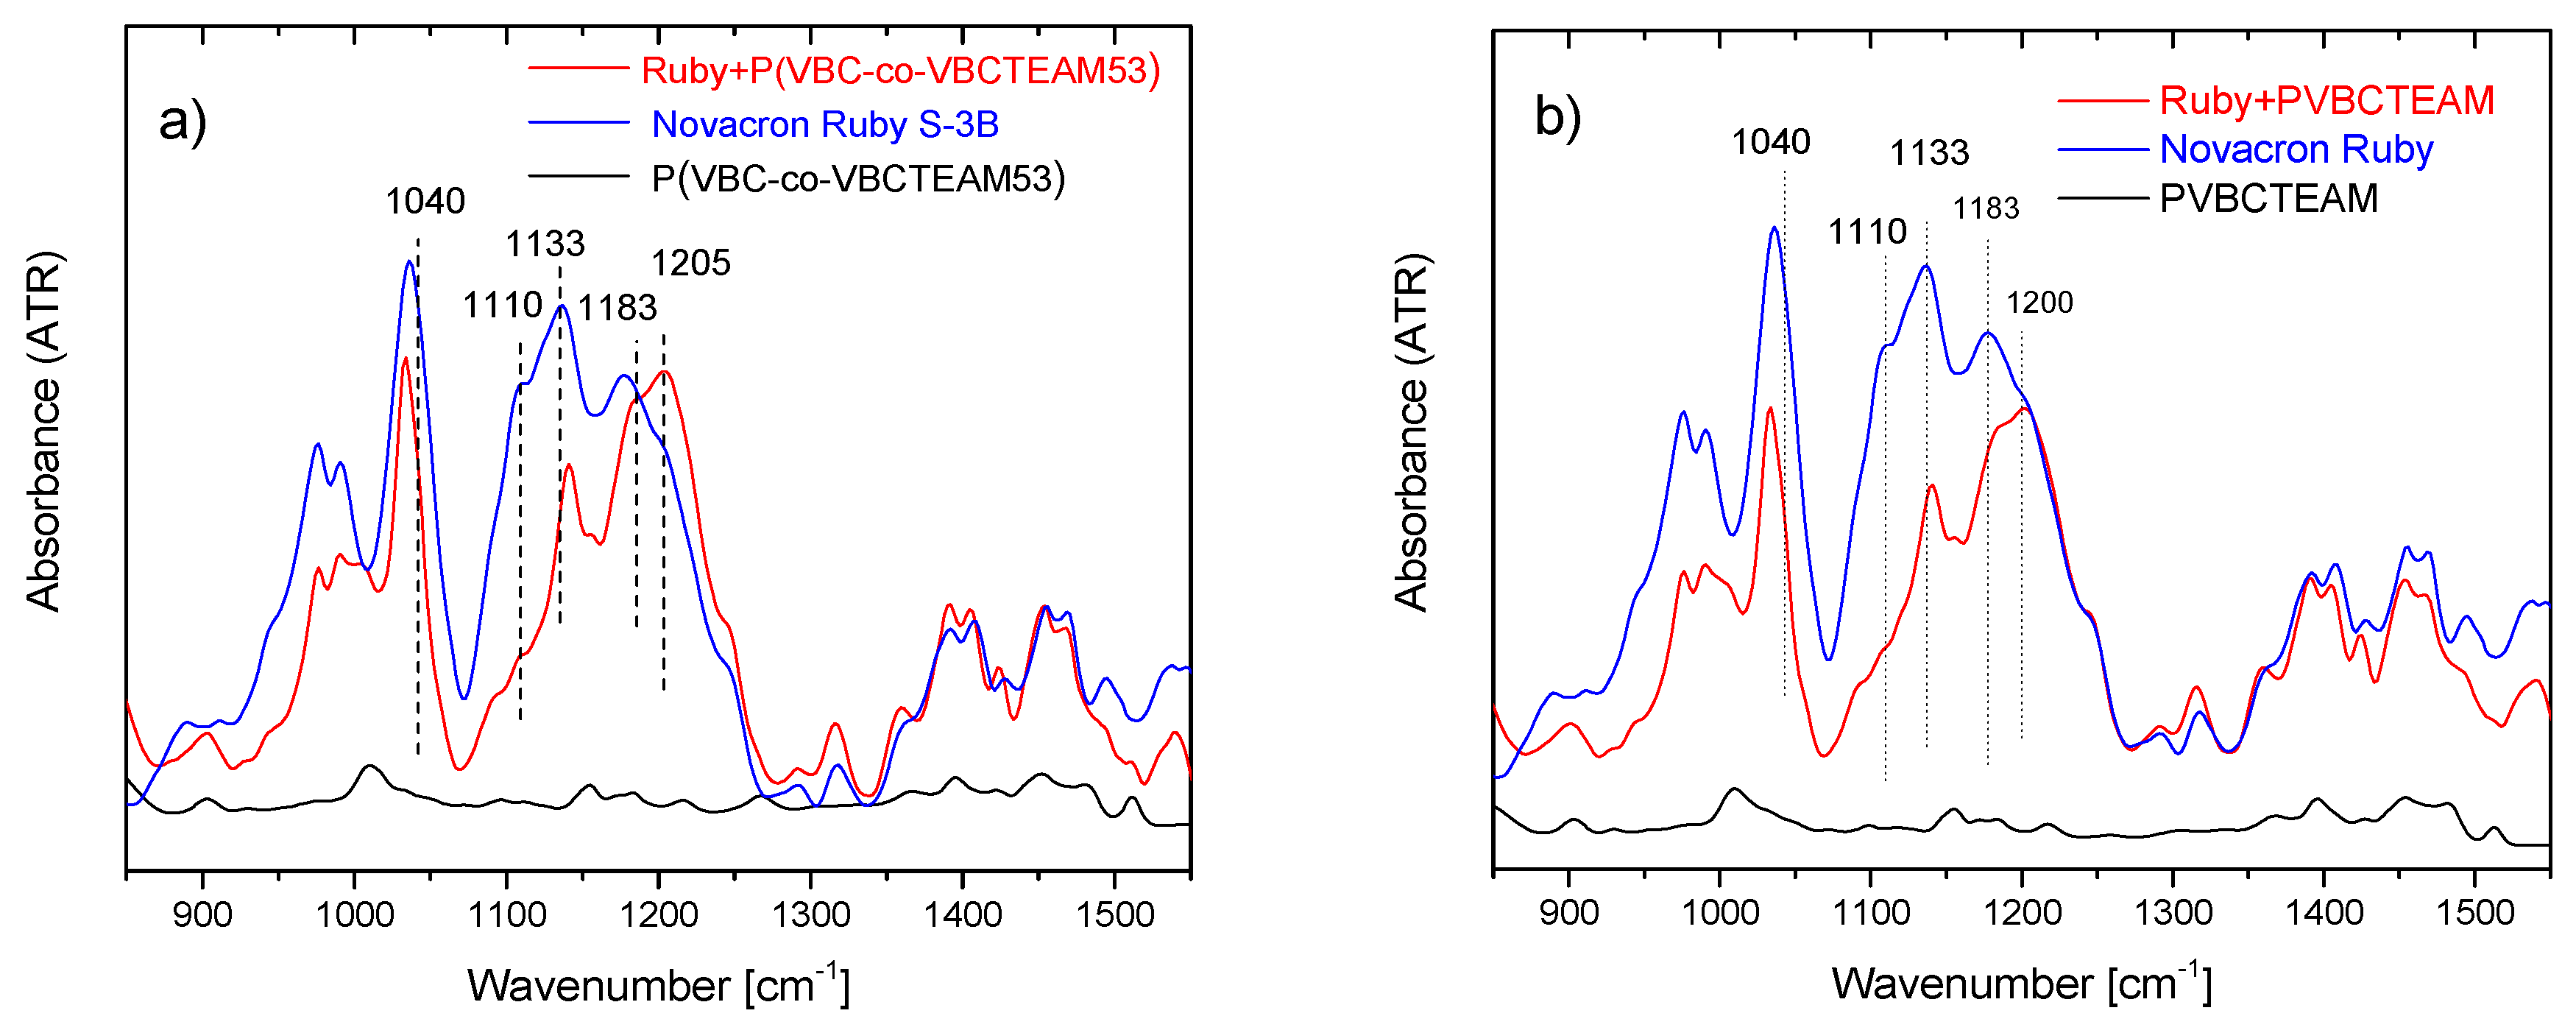
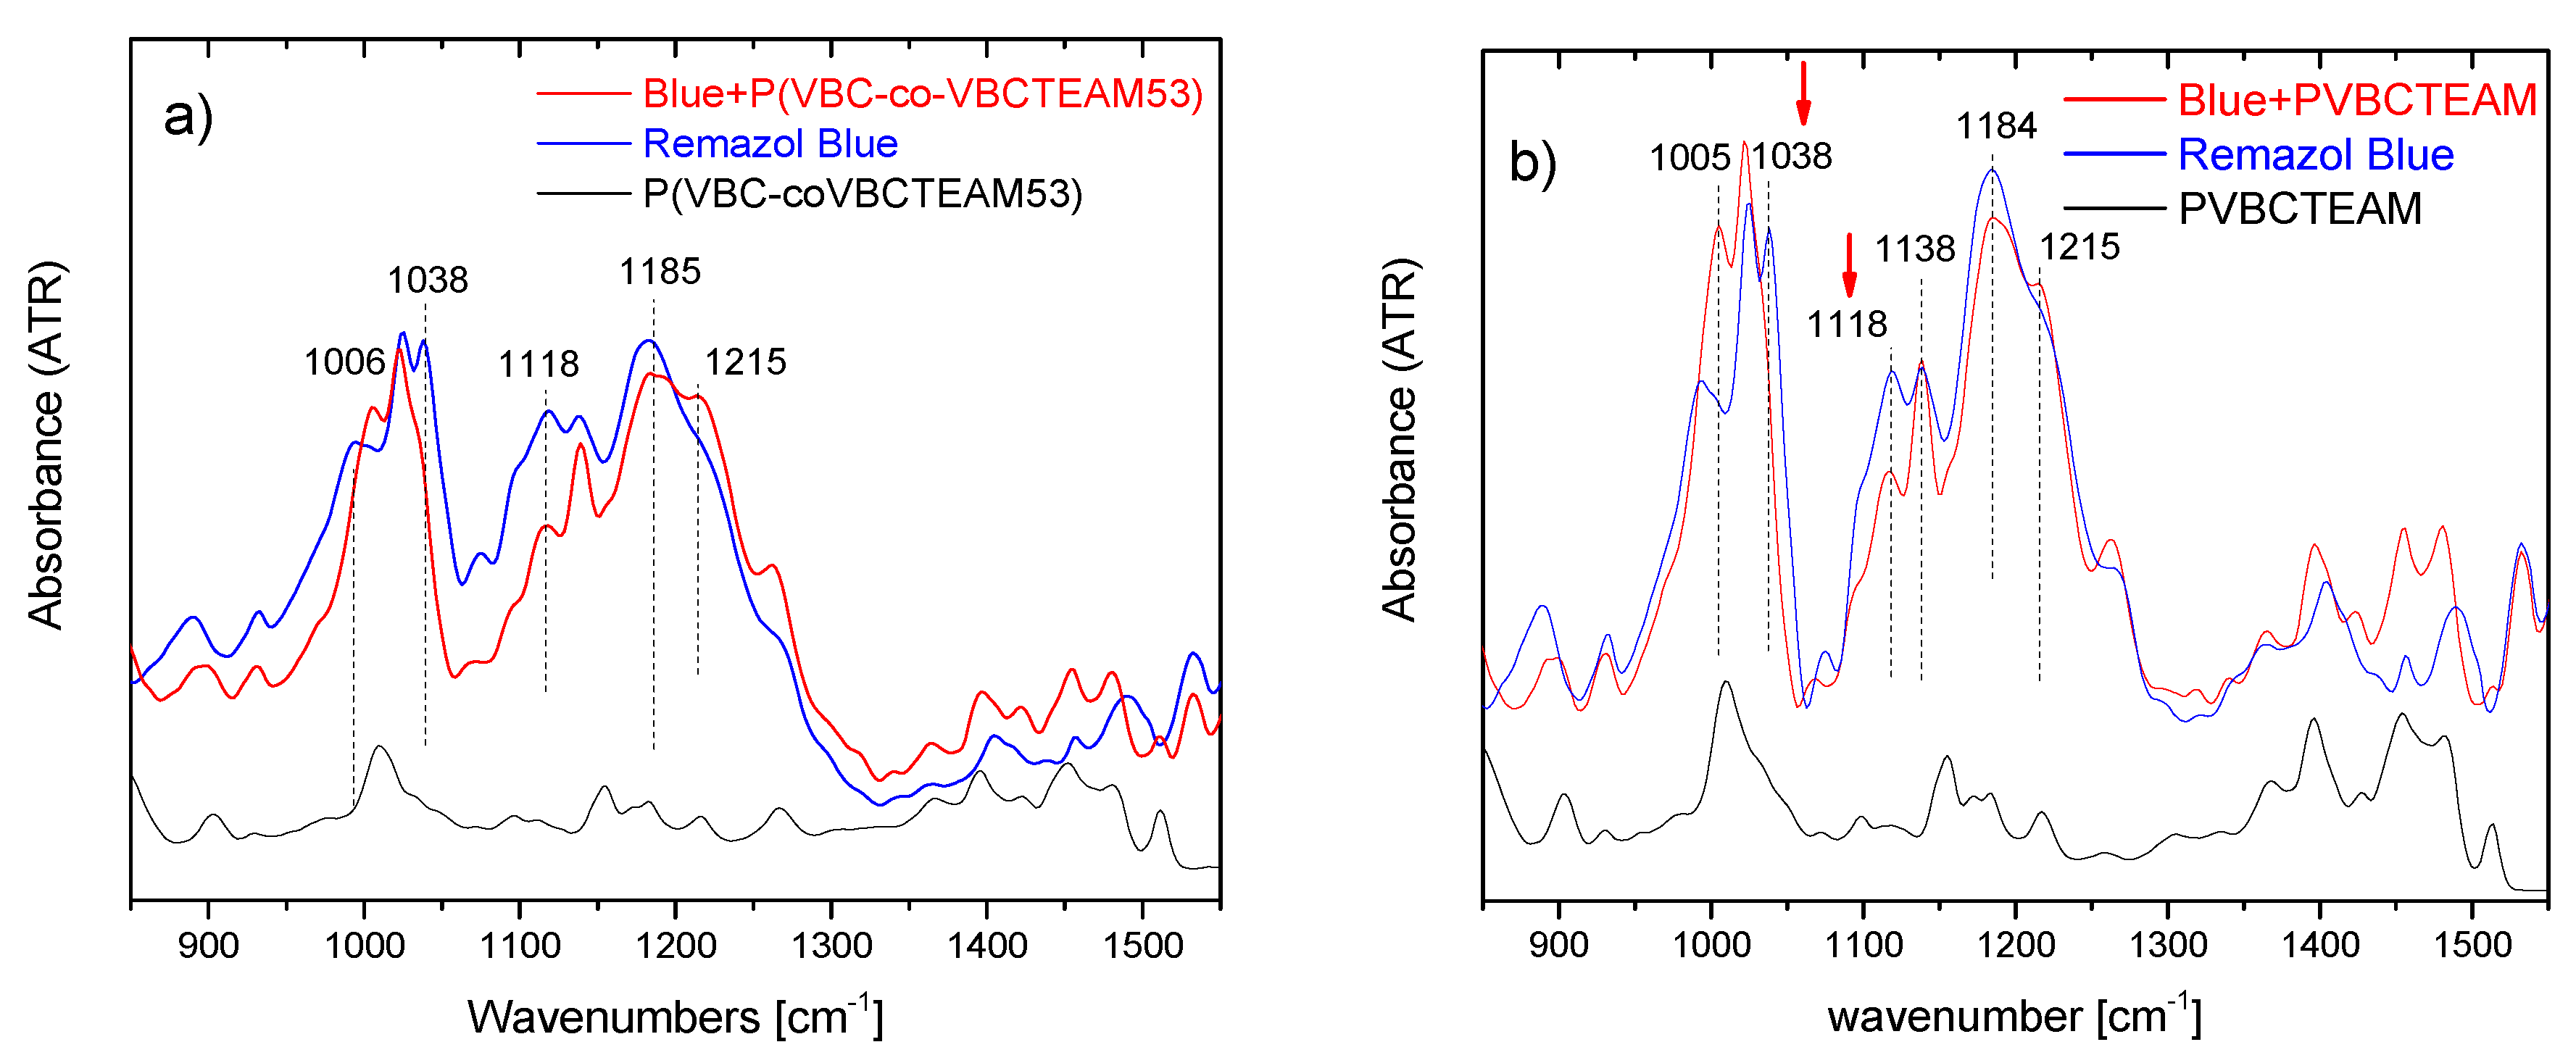
| 975m | ~1000m | ring bending [42] |
| 1040s | 1038s | sym vSO3+ vCC [47,48] |
| 1110m-sh | 1118m-sh | sym SO2 str (of SO4 gr) [42] |
| 1133m-s | 1138m-s | Sym SO2 str of C-SO2-C νCS + νCC + νsSO3 [47,48,49,50,51] |
| 1183s | 1194sh | SO3 asym str [47,48,49,50,51] |
| 1210sh | 1215s | Asym SO2 str (of SO4 gr) [42] |
| 1280sh-m | 1265sh | C-N str [42] |
| 1414w | - | C=N triazine ring str [42] |
| 1615m | 1615m | Ring str [42] |
3.2. Interaction between the cationic modifiers and the reactive dyes
3.2.1. Investigation of dye-polymer aqueous solutions through UV-Vis and fluorescence spectroscopy
3.2.2. Investigation of dye-polymer precipitates through ATR-FTIR spectroscopy
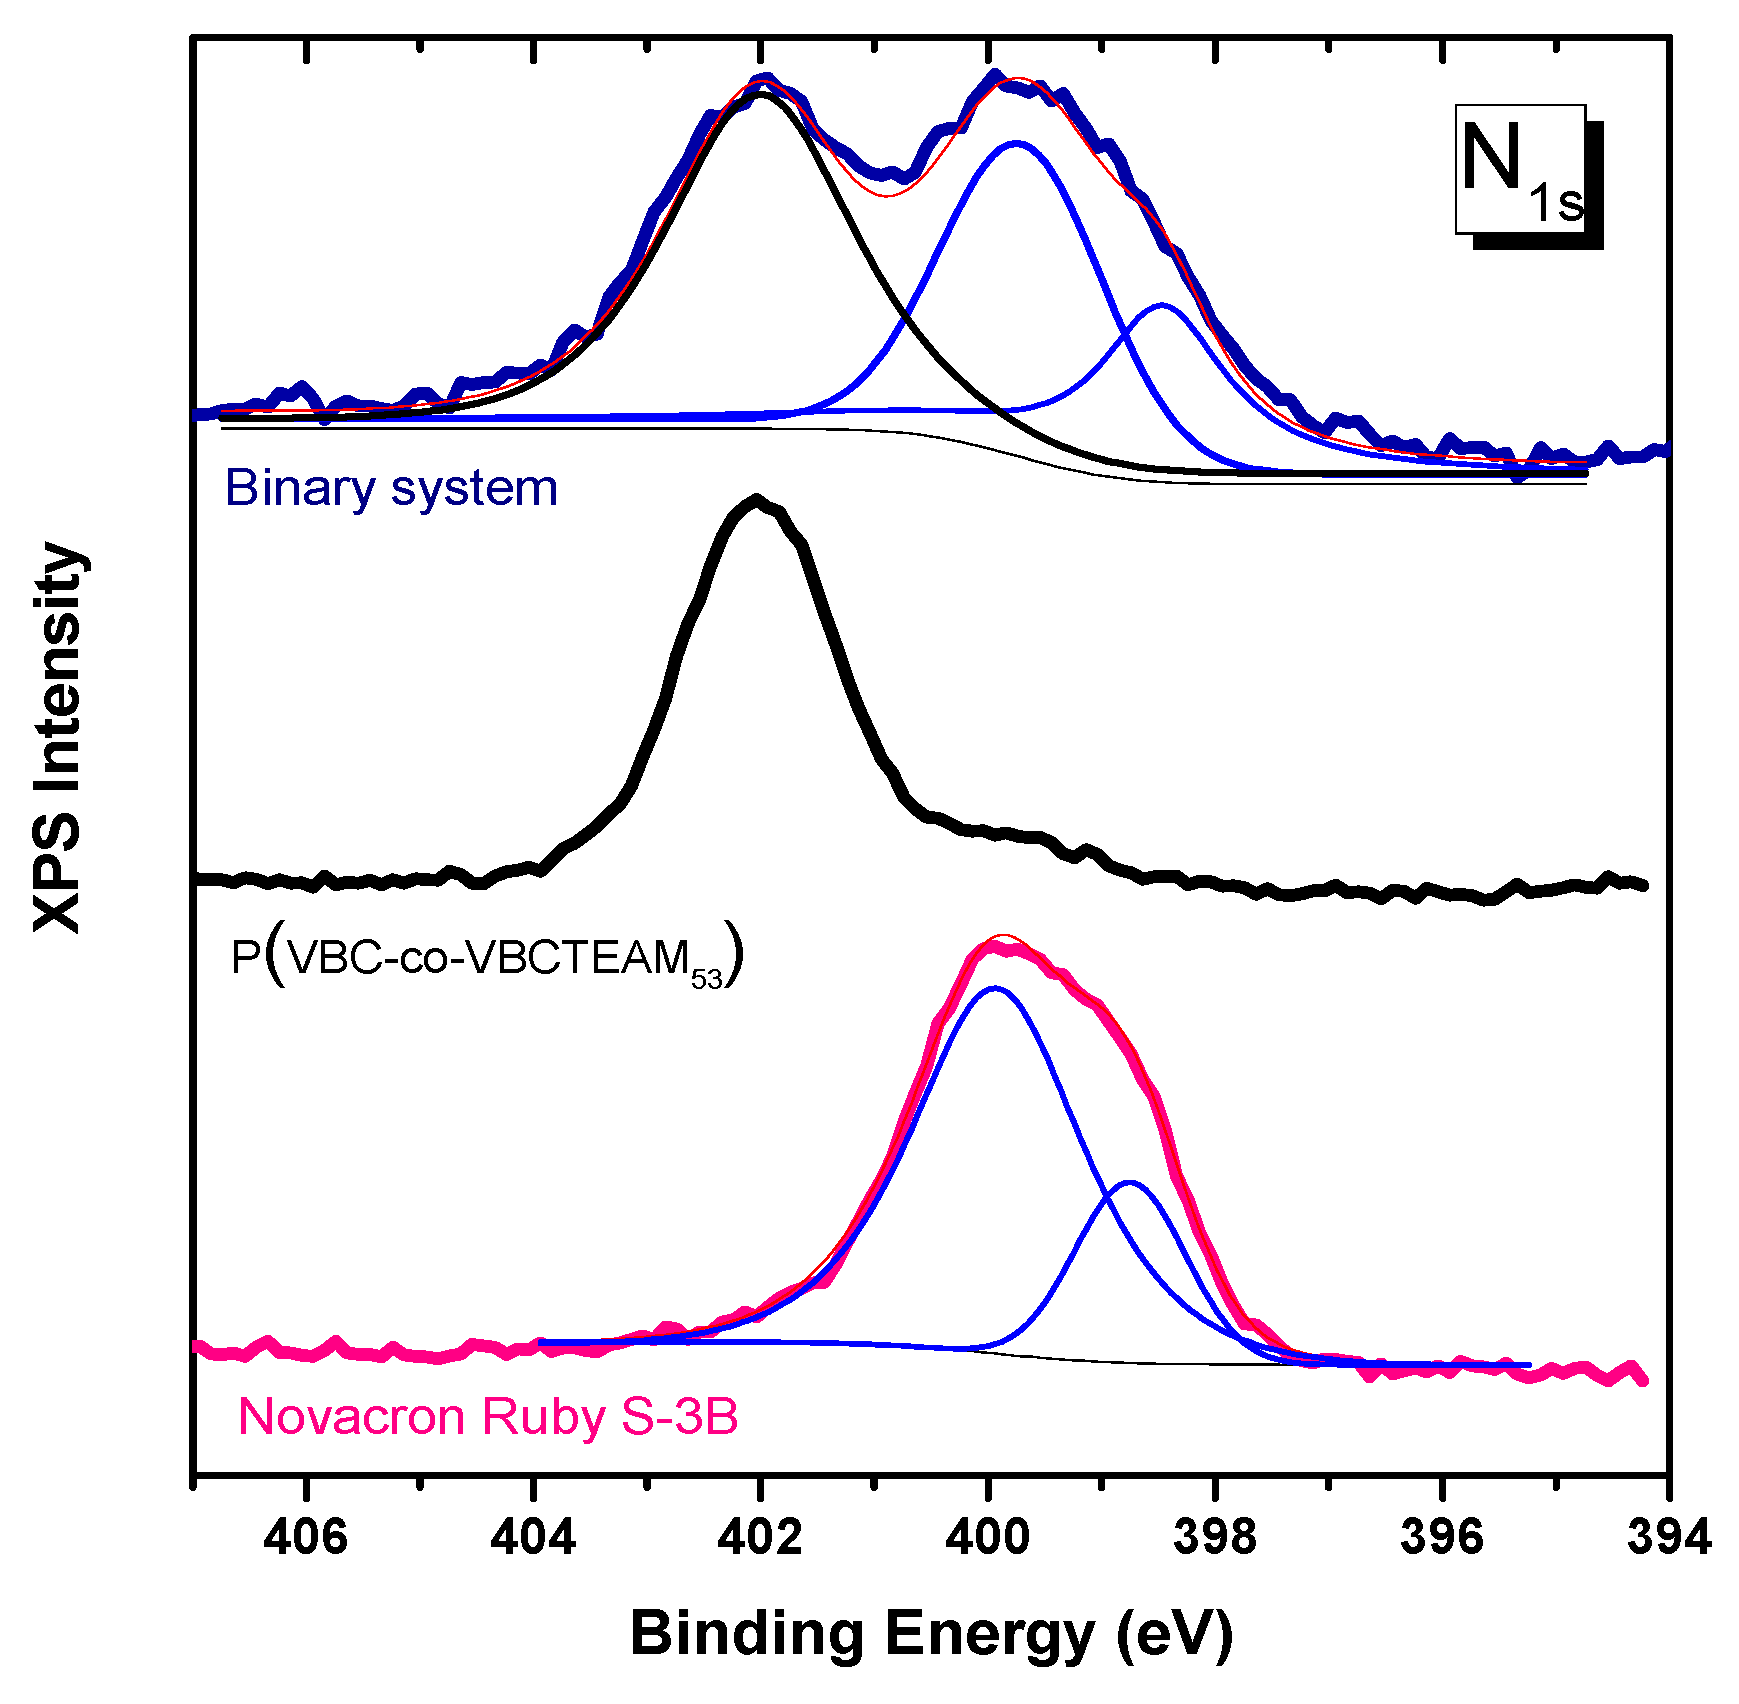
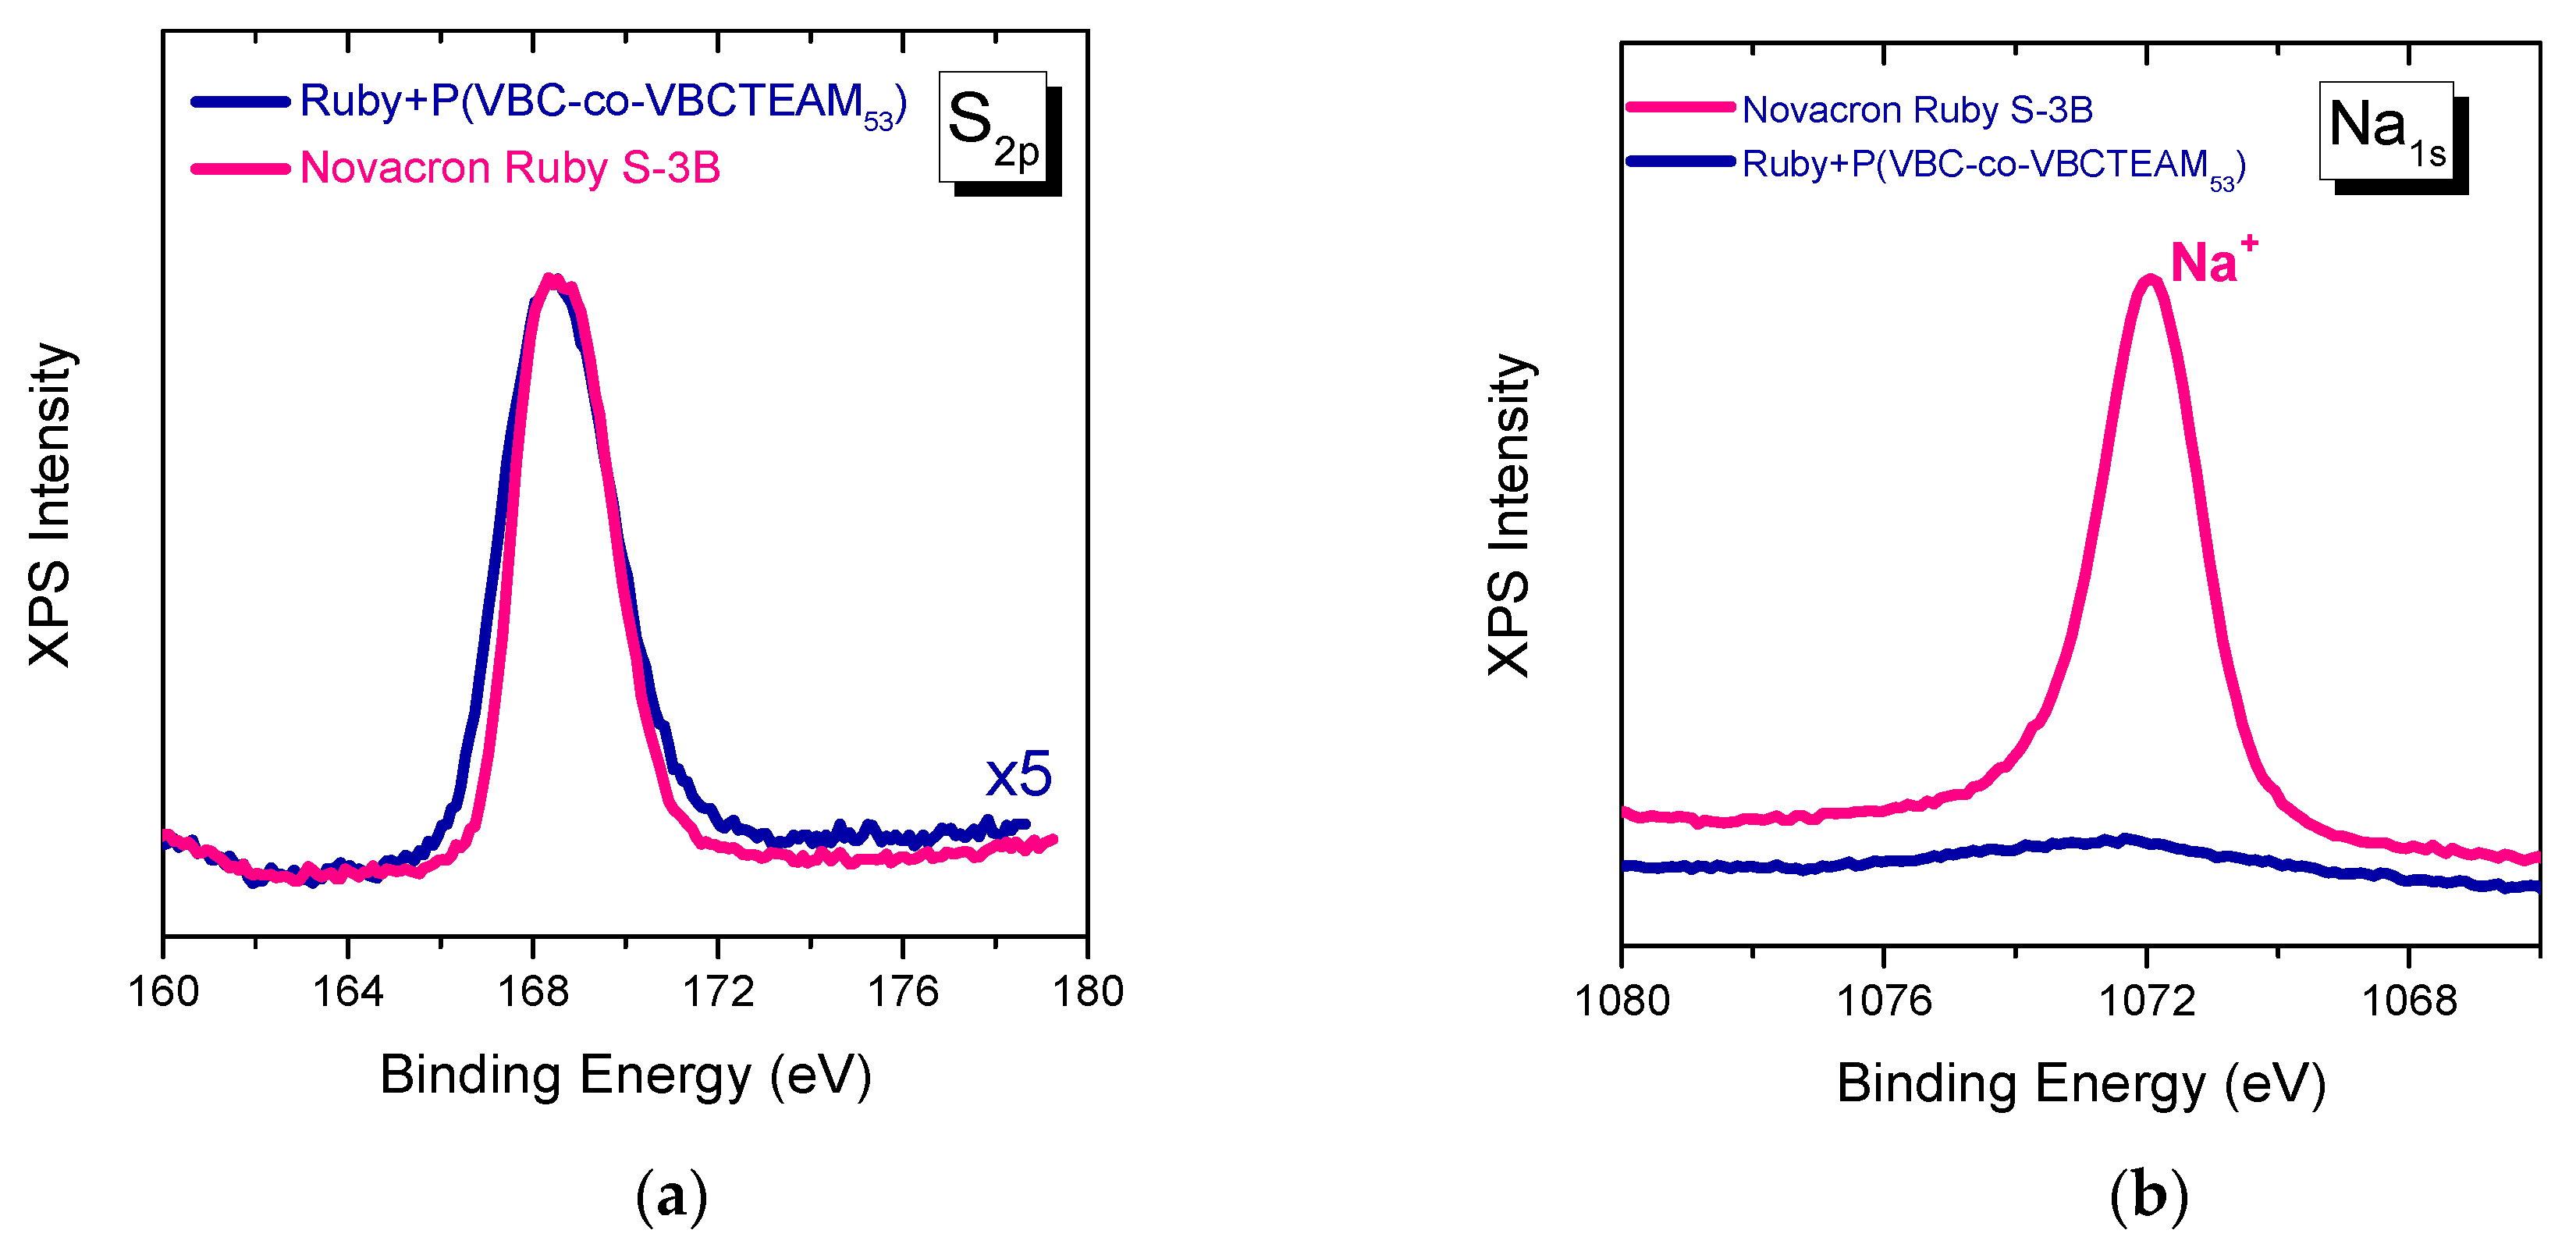
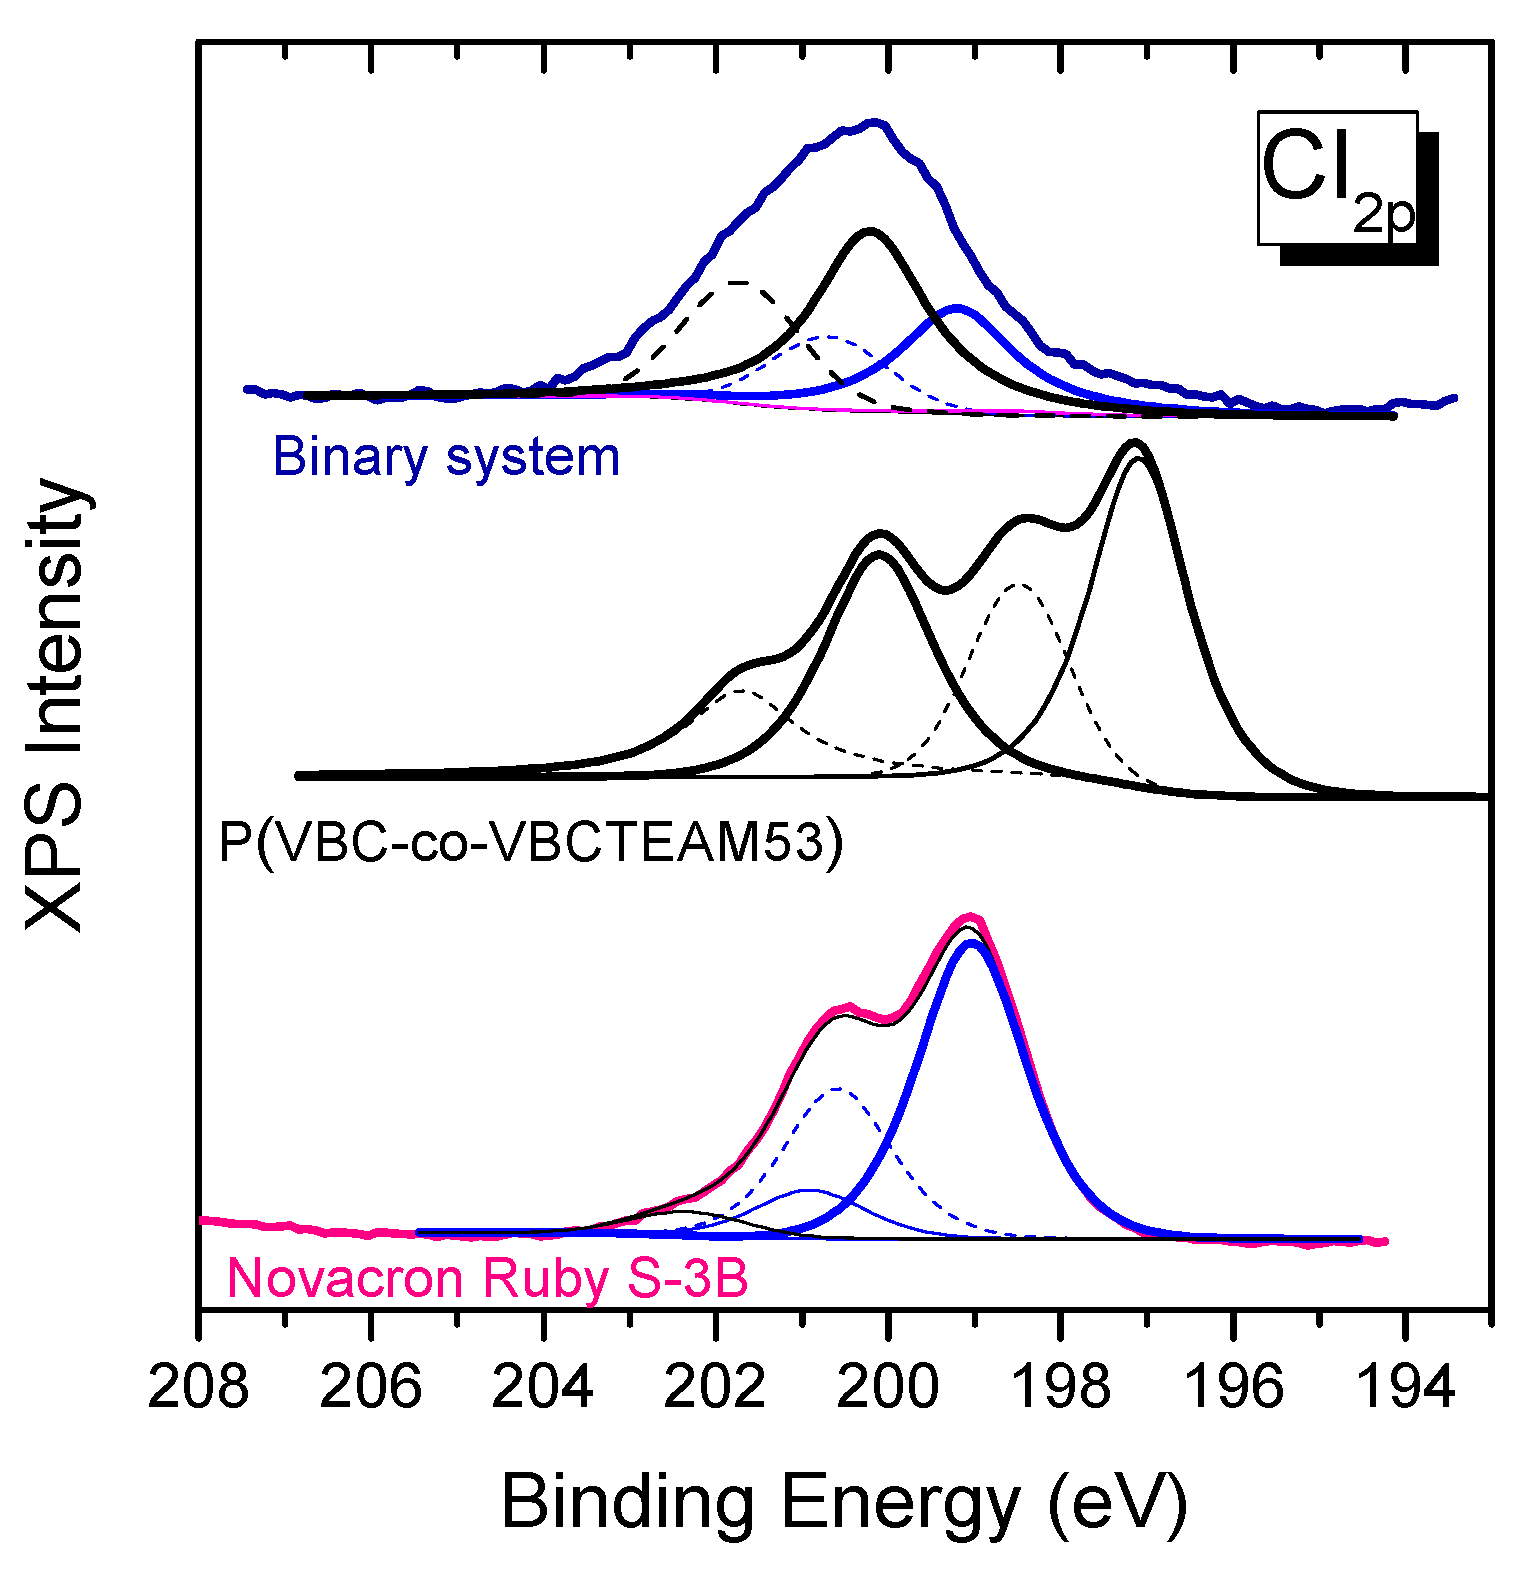
3.2.3. Investigation of dye-polymer precipitates through XPS spectroscopy
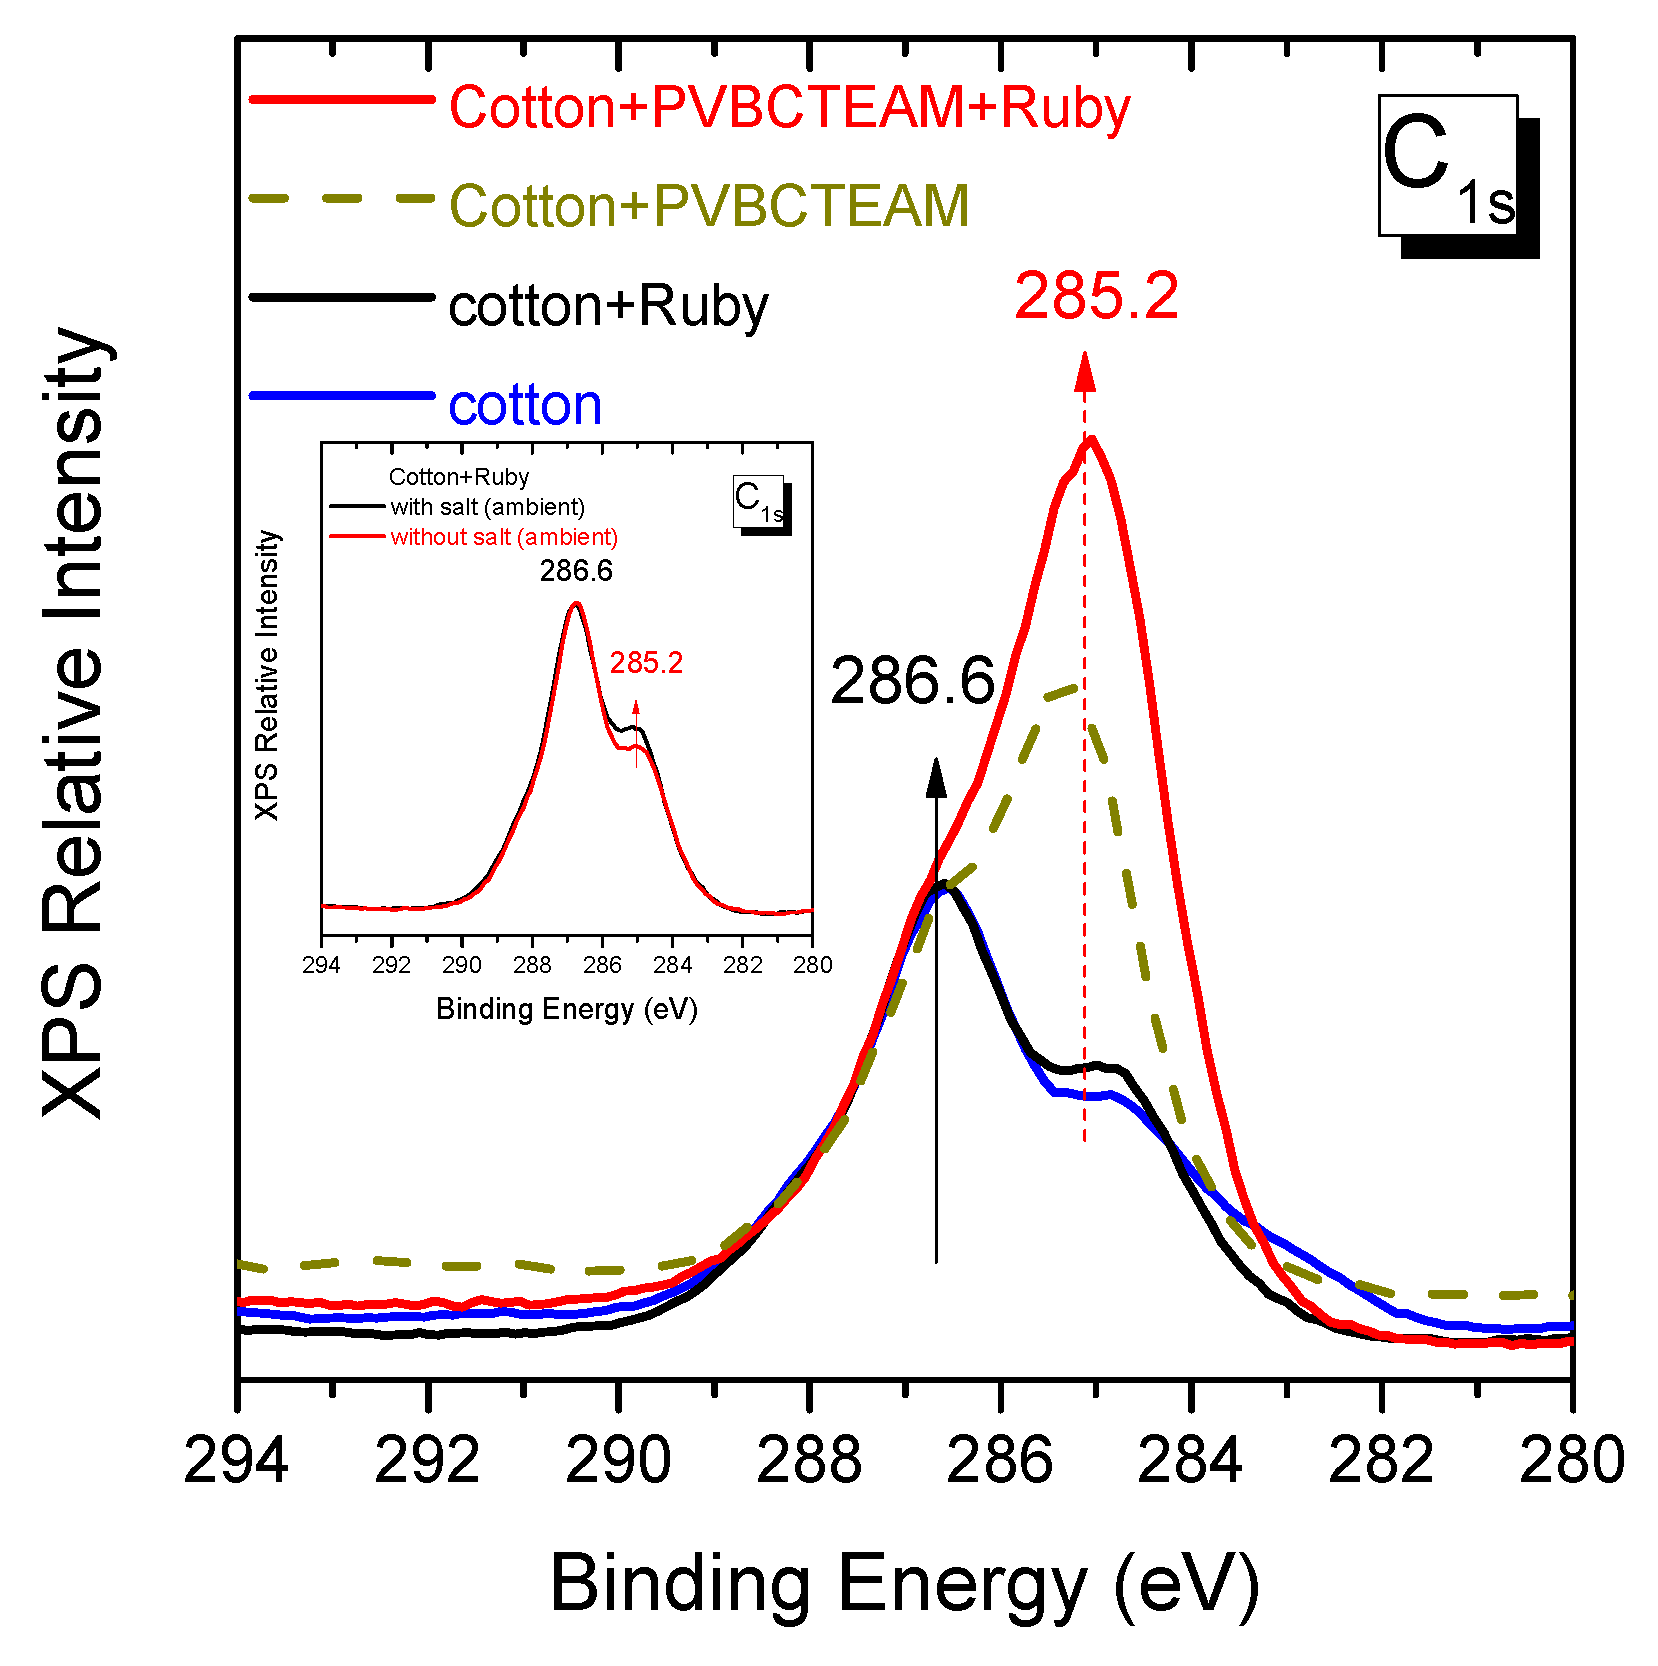
3.3. Role of the cationic modifier in the dyeing process of cotton

4. Conclusions
Author Contributions
Funding
References
- Acharya, S.; Abidi, N.; Rajbhandari, R.; Meulewaeter, F. Chemical cationization of cotton fabric for improved dye uptake. Cellulose. 2014, 21, 4693–4706. [Google Scholar] [CrossRef]
- Siddiqua, U.H.; Ali, S.; Iqbal, M.; Hussain, T. Relationship between structure and dyeing properties of reactive dyes for cotton dyeing. J. Mol. Liq. 2017, 241, 839–844. [Google Scholar] [CrossRef]
- Bhargava, R.; Mehta, S.; Tripathi, Y.; Shivankar, V.S.; Raichurkar, P.P. Eco-friendly cationized dyeing of cellulosic fabric: A review. Colourage. 2019, 31–38. [Google Scholar]
- Mu, B.; Liu, L.; Li, W.; Yang, Y. High sorption of reactive dyes onto cotton controlled by chemical potential gradient for reduction of dyeing effluents. J. Environ. Manage. 2019, 239, 271–278. [Google Scholar] [CrossRef]
- Hauser, P.J.; Tabba, A.H. Improving the environmental and economic aspects of cotton dyeing using a cationised cotton. Coloration Technology. 2001, 117, 282–288. [Google Scholar] [CrossRef]
- Niu, T.; Wang, X.; Wu, C.; Sun, D.; Zhang, X.; Chen, Z.; Fang, L. Chemical Modification of Cotton Fabrics by a Bifunctional Cationic Polymer for Salt-Free Reactive Dyeing. ACS Omega. 2020, 5, 15409–15416. [Google Scholar] [CrossRef]
- Gupta, D.; Haile, A. Multifunctional properties of cotton fabric treated with chitosan and carboxymethyl chitosan. Carbohydr. Polym. 2007, 69, 164–171. [Google Scholar] [CrossRef]
- Wang, L.; Ma, W.; Zhang, S.; Teng, X.; Yang, J. Preparation of cationic cotton with two-bath pad-bake process and its application in salt-free dyeing. Carbohydr. Polym. 2009, 78, 602–608. [Google Scholar] [CrossRef]
- Montazer, M.; Malek, R.; Rahimi, A. Salt free reactive dyeing of cationized cotton. Fibers. Polym. 2007, 8, 608–612. [Google Scholar] [CrossRef]
- Fu, S.; Hinks, D.; Hauser, P.; Ankeny, M. High efficiency ultra-deep dyeing of cotton via mercerization and cationization. Cellulose. 2013, 20, 3101–3110. [Google Scholar] [CrossRef]
- Arivithamani, N.; Giri, Dev. V.R. Salt-free reactive dyeing of cotton hosiery fabrics by exhaust application of cationic agent. Carbohydr. Polym. 2016, 152, 1–11. [Google Scholar] [CrossRef]
- Arivithamani, N.; Giri, Dev. V.R. Sustainable bulk scale cationization of cotton hosiery fabrics for salt-free reactive dyeing process. J. Clean. Prod. 2017, 149, 1188–1199. [Google Scholar] [CrossRef]
- Arivithamani, N. ; Giri, Dev. V.R. Characterization and comparison of salt-free reactive dyed cationized cotton hosiery fabrics with that of conventional dyed cotton fabrics. J. Clean. Prod. 2018, 183, 579–589. [Google Scholar] [CrossRef]
- Zhai, S.; Li, Y.; Don, W.; Zhao, H.; Ma, K.; Zhang, H.; Wang, H.; Zhao, Y.; Li, X; Cai, Z. Cationic cotton modified by 3-chloro-2- hydroxypropyl trimethyl ammonium chloride for salt-free dyeing with high levelling performance. Cellulose. 2022, 29, 633–646. [Google Scholar] [CrossRef]
- Pruś, S.; Kulpiński, P.; Zgondek, E.M.; Wojciechowski, K. Eco–friendly dyeing of cationised cotton with reactive dyes: mechanism of bonding reactive dyes wit CHPTAC cationised cellulose. Cellulose. 2022, 29, 4167–4182. [Google Scholar] [CrossRef]
- Wang, L.; Xie, G.; Mi, X.; Kang, X.; Zhu, Q.; Yu, Z. A single-step pad-steam cationisation and dyeing process for improving dyeing properties of cotton fabrics. Color Technol. 2022, 138, 509–521. [Google Scholar] [CrossRef]
- Fang, K.; Zhao, H.; Li, J.; Chen. W.; Cai, Y.; Hao, L. Salt-free dyeing of cotton fabrics modified with cationic copolymer nanospheres using an acid dye. Fibers Polym. 2017, 18, 400–406. [Google Scholar] [CrossRef]
- Dehabadi, V.A.; Buschmann, H.J.; Gutmann, J.S. Durable press finishing of cotton fabrics with polyamino carboxylic acids. Carbohydr. Polym. 2017, 89, 558–563. [Google Scholar] [CrossRef]
- Ma, W.; Wang, T.; Li, H.; Zhang, S. Cotton fabric modification through ceric (IV) ion-initiated graft copolymerisation of 2- methacryloyloxyethyltrimethyl ammonium chloride to enhance the fixation of reactive dyes. Cellulose. 2015, 22, 4035–4047. [Google Scholar] [CrossRef]
- Wang, L.; Hu, C.; Yan, K. A one-step inkjet printing technology with reactive dye ink and cationic compound ink for cotton fabrics. Carbohydr Polym. 2018, 197, 490–496. [Google Scholar] [CrossRef]
- Yang, H.; Fang, K.; Liu, X.; An, F. High-Quality Images Inkjetted on Different Woven Cotton Fabrics Cationized with P(St-BA-VBT) Copolymer Nanospheres. ACS Appl Mater Interfaces. 2019, 11, 29218–29230. [Google Scholar] [CrossRef]
- Song, Y.; Fang, K.; Bukhari, M.N.; Ren, Y.; Zhang, K.; Tang, Z. Green Efficient Inkjet Printing of Cotton Fabrics Using Reactive Dye@Copolymer Nanospheres. ACS Appl Mater Interfaces. 2020, 12, 45281–45295. [Google Scholar] [CrossRef]
- Janhom, S.; Watanesk, R.; Watanesk, S.; Griffiths, P.; Arquero, OA.; Naksata, W. Comparative study of lac dye adsorption on cotton fibre surface modified by synthetic and natural polymers. Dyes. Pigm. 2006, 71, 188–193. [Google Scholar] [CrossRef]
- Zhang, F.; Chen, Y.; Lin, H.; Lu, Y. Synthesis of an aminoterminated hyperbranched polymer and its application in reactive dyeing on cotton as a salt-free dyeing auxiliary. Color Technol. 2007, 123, 351–357. [Google Scholar] [CrossRef]
- Shin, H.; Ueda, M.; Burkinshaw, S.M. New methods of obtaining patterned dyeings on cellulosic fibres with anionic dyes: photomodification using a methacryloyl quaternary ammonium compound. Dyes Pigm. 1999, 41, 11–17. [Google Scholar] [CrossRef]
- Srikulkit, K.; Larpsuriyakul, P. Process of dyeability modification and bleaching of cotton in a single bath. Color Technol. 2006, 118, 79–84. [Google Scholar] [CrossRef]
- Ma, W.; Du, S.; Yan, S.; Yu, X.; Zhang, Z.; Zhang, S. Salt-Free Dyeing of Modified Cotton through Graft Polymerization with Highly Enhanced Dye Fixation and Good Strength Properties. Polymers. 2020, 12, 462. [Google Scholar] [CrossRef]
- Ramamoorthy, A.; Helmy, H.M.; Rajbhandari, R.; Hauser, P.J.; El-Shafei, A. Plasma Induced Graft Polymerization of Cationic and Fluorocarbon Monomers into Cotton: Enhanced Dyeability and Photostability. Ind. Eng. Chem. Res. 2016, 55, 8501–8508. [Google Scholar] [CrossRef]
- Goel, N.K.; Rao, M.S.; Kumar, V.; Bhardwaj, Y.K.; Chaudhari, C.V.; Dubey, K.A.; Sabharwal, S. Synthesis of antibacterial cotton fabric by radiation-induced grafting of [2-(Methacryloyloxy)ethyl]trimethylammonium chloride (MAETC) onto cotton Radiat. Phys. Chem. 2009, 78, 399–406. [Google Scholar] [CrossRef]
- Dong, W.; Zhou, M.; Li, Y.; Zhai, S.; Jin, K.; Fan, Z.; Zhao, H.; Zou, W.; Cai, Z. Low-salt dyeing of cotton fabric grafted with pH-responsive cationic polymer of polyelectrolyte 2-(N,N-dimethylamino)ethyl methacrylate. Colloids Surf A Physicochem Eng Asp. 2020, 594, 124573. [Google Scholar] [CrossRef]
- Niu, T.; Wang, X.; Wu, C.; Sun, D.; Zhang, X.; Chen, Z.; Fang, L. Chemical Modification of Cotton Fabrics by a Bifunctional Cationic Polymer for Salt-Free Reactive Dyeing. ACS Omega. 2020, 5, 15409–15416. [Google Scholar] [CrossRef]
- Tsimpouki, L.; Papapetros, K.; Anastasopoulos, C.; Sygellou, L.; Soto-Beobide, A.; Andrikopoulos, K.S.; Voyiatzis, G.A.; Bokias, G.; Kallitsis, J.K. Water-soluble quaternized copolymers as eco-friendly cationic modifiers of cotton fabrics for salt-free reactive dyeing applications. 2022. Research Square (preprint). [CrossRef]
- Lewis, D.M. The chemistry of reactive dyes and their application process. In Handbook of Textile and Industrial Dyeing; Clark, M., Ed.; Woodhead Publishing: Cambridge, UK, 2011; pp. 303–364. [Google Scholar]
- Chattopadhyay, D.P. Chemistry of dyeing. In Handbook of Textile and Industrial Dyeing; Clark, M., Ed.; Woodhead Publishing: Cambridge, UK, 2011; pp. 150–183. [Google Scholar]
- Broadbent, A.D. Basic Principles of Textile Coloration. Society of Dyers and Colourists. Bradford, West Yorkshire, England, 2001; 26.
- Topalovic, T.; Nierstrasz, V.A.; Bautista, L.; Jocic, D.; Navarro, A.; Warmoeskerken, M.M.C.G. XPS and contact angle study of cotton surface oxidation by catalytic bleaching. Colloids and Surfaces A: Physicochem. Eng. Aspects. 2007, 296, 76–85. [Google Scholar] [CrossRef]
- Moulder, J.F.; Stickle, W.F.; Sobol, P.E.; Bomben, K.D. Handbook of X-Ray Photoelectron Spectroscopy. Perkin Elmer corporation, Eden Prairie, Minnesota, US. 1992.
- Wang, L.; Wen, X.; Zhang, X.; Yuan, S.; Xu, Q.; Fu, F.; Diao, H.; Liu, X. Durable antimicrobial cotton fabric fabricated by carboxymethyl chitosan and quaternary ammonium salts. Cellulose. 2021, 28, 5867–5879. [Google Scholar] [CrossRef]
- Briggs, D. Surface analysis of polymers by XPS and SIMS. Clarke, D.R.; Suresh S.; Ward FRS. I.M., Ed; Cambridge University Press, UK, 1998.
- Kovac, J. Surface Characterization of polymers by XPS and SIMS. Materials and Technology. 2011, 45, 191–197. [Google Scholar]
- Kim, M.; Kim, J.; Cho, J.; Kim, H.; Lee, N.; Choi, B. A study of the characteristics of indium tin oxide after chlorine electro-chemical treatment. Materials Research Bulletin. 2016, 82, 115–121. [Google Scholar] [CrossRef]
- Socrates, G. Infrared and Raman Characteristic Group Frequencies. Wiley: West Sussex, UK. 2001. 3rd ed.
- Larkin, P. Infrared and Raman Spectroscopy Principles and Spectral Interpretation. Elsevier, Oxford, UK. 2011. 1st.ed.
- Andreassen, E. Infrared and Raman spectroscopy of polypropylene. Karger-Kocsis, J.; Ed; Kluwer Publishers, Dordrecht. 1999.
- Podstawka, E.; Światłowska, M.; Borowiec, E.; Proniewicz, L.M. Food additives characterization by infrared, Raman, and surface-enhanced Raman spectroscopies. J. Raman Spectrosc. 2007, 38, 356–363. [Google Scholar] [CrossRef]
- Arivithamani, N.; Giri, Dev. V.R. Cationization of cotton for industrial scale salt-free reactive dyeing of garments. Clean Techn. Environ. Policy. 2017, 19, 2317–2326. [Google Scholar] [CrossRef]
- Sperline, R.; Song, Y.; Freiser, H. Fourier Transform Infrared Attenuated Total Reflection Linear Dichroism Study of Sodium Dodecylbenzenesulfonate adsorption at the alumina/water interface using Al2O3-coated optics. Langmuir. 1994, 10, 1–37. [Google Scholar] [CrossRef]
- Lo, M; Diaw, A. K.D; Gningue-Sall, D; Oturan, M.A; Chehimi, M.M; Aaron, J-J. A novel fluorescent sensor based on electrosynthesized benzene sulfonic acid-doped polypyrrole for determination of Pb(II)and Cu(II). Luminescence. 2019, 34, 489–499. [Google Scholar] [CrossRef]
- Bauer, C.; Jacques, P.; Kalt, A. Investigation of the interaction between a sulfonated azo dye. Chem. Phys. Lett. 1999, 307, 397–406. [Google Scholar] [CrossRef]
- Jevavijayan, S. Spectroscopic (FTIR, FT-Raman), molecular electrostatic potential, NBO and HOMO-LUMO analysis of sulfonyl chloride based on DFT calculations. Spectrochim. Acta A Mol. Biomol. Spectrosc. 2015, 136, part B, 890–899. [Google Scholar] [CrossRef]
- Mabrouk, K.B.; Kauffmann, T.; Aroui, H.; Fontana, M. Raman study of cation effect on sulfate vibration modes in solid state and in aqueous solutions. J. Raman Spectrosc. 2013, 44, 1603–1608. [Google Scholar] [CrossRef]
- Shishlov, N.M.; Khursan, S.L. Effect of ion interactions on the IR spectrum of benzenesulfonate ion.Restoration of sulfonate ion symmetry in sodium benzenesulfonatedimer. J. Mol. Struct. 2016, 1123, 360–366. [Google Scholar] [CrossRef]
- Lada, Z.G.; Mathioudakis, G.N.; Pavlidou, S.; Goulas, G.; Anastasopoulos, C.; Bokias, G.; Andrikopoulos, K.S.; Voyiatzis, G.A. Comparative Assessment of the Dyeing Process for Pristine and Modified Cotton Fabrics towards the Reduction of the Environmental Fingerprint. Sustainability 2023, 15, 3144. [Google Scholar] [CrossRef]


Disclaimer/Publisher’s Note: The statements, opinions and data contained in all publications are solely those of the individual author(s) and contributor(s) and not of MDPI and/or the editor(s). MDPI and/or the editor(s) disclaim responsibility for any injury to people or property resulting from any ideas, methods, instructions or products referred to in the content. |
© 2023 by the authors. Licensee MDPI, Basel, Switzerland. This article is an open access article distributed under the terms and conditions of the Creative Commons Attribution (CC BY) license (https://creativecommons.org/licenses/by/4.0/).


