Submitted:
20 March 2023
Posted:
24 March 2023
You are already at the latest version
Abstract
Water is an essential commodity to sustain life. The condition of water in Tiruchirappalli was measured using different Physicochemical parameters like Temperature, pH, TDS, Total Solids, Salinity, Total Hardness, and Electrical Conductivity. Water samples were collected from different places in Tiruchirappalli city, Tamil Nadu. Water samples were examined by different chemical methods. According to the results, Thiruvarambur-1 showed comparatively higher results in the case of every parameter compared to other sampling stations. Obtained results were further interpreted using statistical tools. Considering ECs as a principal component for the regression and correlation analysis with other parameters significant correlation was found. A strong correlation was observed between ECs and TDS, Total Hardness, Turbidity, and Salinity.
Keywords:
Correlation study
; Regression analysis
; Physicochemical parameters
; quality of water
; Electrical conductivity
1. Introduction
Water is an essential commodity to sustain life. One-third of the earth is covered by the water itself but still, we cannot rely on that water for drinking. Drinking water supplies from river water or groundwater in the city of Tiruchirappalli, Tamil Nadu. Tiruchirappalli is the fourth largest city in Tamil Nadu, the city is expanded over a 167.2 km² area. This city depends on groundwater and river water for drinking purposes, so keeping the water quality is essential for further uses. Evaluation of water quality is an important factor to assess for the constant monitoring of the quality. There are multiple parameters to assess the quality of Water. Urbanization along the river banks is believed to be the main contributor to the Cauvery River's water pollution, along with excessive groundwater use and human inputs (Selvakumar et al., 2017), (Kalavathy et al., 2011). Chemicals introduced into the water supply system by leaks and cross-connections cause water quality to deteriorate (Napacho & Manyele, 2010). In drinking water around the world, chemical contaminants could be dangerous to people's health. Additionally, most sources are located close to gullies, where open field feces is frequent and flood-washed wastes impact the water's quality (Meride & Ayenew, 2016). According to World Health Organization (WHO), worldwide 80% of all illnesses and disorders, are caused by poor sanitation, tainted water, or a lack of access to clean water. A variety of statistical techniques, including non-parametric, time series, and regression models, have been employed to analyse water quality (WQ). The daily requirement for fresh water for drinking and other uses is supplied by rivers and groundwater which are significant sources of supply. As a result, in recent years a different strategy built on statistical correlation has been employed to create mathematical relationships for comparing Physico-chemical data (Sunil Ramarao & Ganesh Ramdas, 2009). Electrical conductivity is the quickest, easiest, and most accurate way to determine the quality of water (McCleskey et al., 2011). This parameter's value is influenced by the contaminant’s concentration and mobility (Shrestha et al., 2017). For a variety of uses, electrical conductivity which has been measured in real-world settings for more than a century can be used as a rough indicator of water quality. Analyzing the water parameters is still crucial and commonly practiced today. One of the key physical factors, electrical conductivity is used to measure the number of conductive compounds as well as to monitor the ionic contaminants dissolved in a variety of types of water, including pure, drinkable, and natural water. Temperature, transparency, turbidity, watercolor, carbon dioxide, pH, alkalinity, hardness, ammonia, nitrite, and nitrate levels, primary production, biochemical oxygen demand (BOD), plankton population, etc. all play important roles in sustaining good water quality (Bhatnagar & Devi, 2013).
In this paper different physicochemical parameters will be discussed regression and correlation with Electrical Conductivity (EC) as a prime factor with other parameters to assess the quality of water that can be influenced by other Physicochemical Parameters. The quantification of the relative concentration of different parameters in water and the provision of necessary guidance for the implementation of quick water quality management the comprehensive analysis of correlation and regression coefficients acts as a good measuring tool.
2. Materials and methods
2.1. Sample Collection and analysis
Water samples were collected from six different areas around Tiruchirappalli city: Ariyamangalam pond site, Ariyamangalam Dump yard borewell, Sanjay Nagar borewell, Sanjay N agar Canal, Kailash Nagar Borewell, Kailash Nagar Pond site, Thiruvarambur Borewell, Thiruvarambur pond site, Palakarai Borewell, Pundotam Borewell in May 2022. Water samples were collected from 3 different sources: pond, canal, and borewell samples. Ariyamangalam Dump yard borewell had a distance of 15-20 meters from the dumping sites. The study area and sampling sites are shown in Figure 1. Samples were collected in February, 2022.
Single replicate of Water samples from all sampling sites was collected in 5 liters of polyethylene bottles, previously clean with distilled water, and immediately transported to the laboratory. The temperature was measured immediately after the sample collection from the site using a thermometer (Model details). Samples were kept in a cool and dry place at room temperature for further analysis. Experiments were follows American Public Health Association (APHA) methods for the Physicochemical parameters analysis and readings were taken in triplicates. Seven parameters (pH, TDS, Total Solids, Salinity, Total Hardness, Ca Hardness, and Mg Hardness) were chosen based on basic parameters analysis to study the water quality.
2.2. Data Analysis
The values of water quality parameters were analyzed with the ‘GraphPad Prison’ a statistical software to get the regression and correlation analysis details (Shrestha & Basnet, 2018), (Ashiyani et al., 2007). Variables are dependent, as EC considered independent here in this study.
3. Result
Pure water is a good insulator and is not able to be a good conductor of electrical current. Ionic concentration increases the EC of water. Electrical conductivity is often based on the number of dissolved particles in water. The ability of a solution to convey current through its ionic process is measured by electrical conductivity (EC). In this study, the minimum value of electrical conductivity was 643μS/cm (Kaylashanagar 2) whereas the maximum value was 5410μS/cm (Thiruvarambur 1) and had a mean of 1796μS/cm value. The study area was considerably high ionized and had a high ionic concentration activity due to high dissolved solids (Shrestha & Basnet, 2018) (Table 1). According to WHO guidelines (Table 2), the EC value shouldn't be more than 400μS /cm for the water for drinking purposes, it points out that the water was not directly consumable although the majority of the water samples were collected from borewells.
The minimum temperature was 28.7℃ at Ariyamangalam and the maximum was 29℃ at Sanjay Nagar 2. The temperature was taken exactly at the sampling location (Table 2). The average temperature was 28.83℃.
The pH assesses the acidity and alkalinity of the water. It also serves as a gauge of the acid-base concentration of water. The amount of dissolved carbon dioxide (CO2), which produces carbonic acid in the water, essentially determines the pH of a solution. The results of the current inquiry matched the previously calculated standards and the ranges in between (Meride & Ayenew, 2016). This study ranges between 7.6 (Thiruvarambur 1) to 8.1 (Kailash Nagar) pH, and it follows the WHO and the ISI limits (Table 1).
Potassium, Calcium, Sodium, Bicarbonates, Chlorides, Magnesium, Sulphates, and a variety of other inorganic and some organic minerals or salts can all be dissolved in water which contributes to the values in the Total Dissolved Solids (TDS) parameters. Water with a high TDS value is heavily mineralized. TDS levels beyond a certain threshold are normally not dangerous to people, but they can harm people with kidney and heart disorders. High solids in water may have laxative or constipating effects (Sasikaran et al., 2012). In this study, only two sites were under desirable limits Thiruvarambur-2 and the Kailash Nagar-2 sites according to WHO and ISI standards, and the rest of the sites were above the acceptable limits of ISI, and according to WHO it comes under fair, poor, and unacceptable criteria for drinking purposes. Ariyamangalam, Sanjay Nagar-1, Kailash Nagar-1, Ariyamangalam Dump yard, Palakara, Pundotam, and Sanjay Nagar-2 these seven sampling sites came under poor quality as per WHO guidelines. 2816mg/L was the highest value for the TDS at Thiruvarambur-1, according to ISI standards it was above the permissible limits (Table 1).
The amount of salt present in water is referred to as salinity, it also represents the concentrations of the electrically charged ion (Lawson & Lawson, 2011). In this study, most of the sampling sites were within the range but the Thiruvarambur-1 sample showed a very high range of salinity (2.9ppt) whereas the Thiruvarambur-2 site and Kailash Nagar-2 site showed a low range of salinity (0.1ppt) (Table 2). Fresh water is having a salinity of 0.5ppt.
Considering the Total Hardness of water, no sampling sites had soft water quality. The minimum range is about the level of hard water. The minimum range found was 187mg/l (Kailash Nagar-2) and the maximum range was 643mg/l (Sanjay Nagar-1) (Table 2).
3.1. Regression analysis
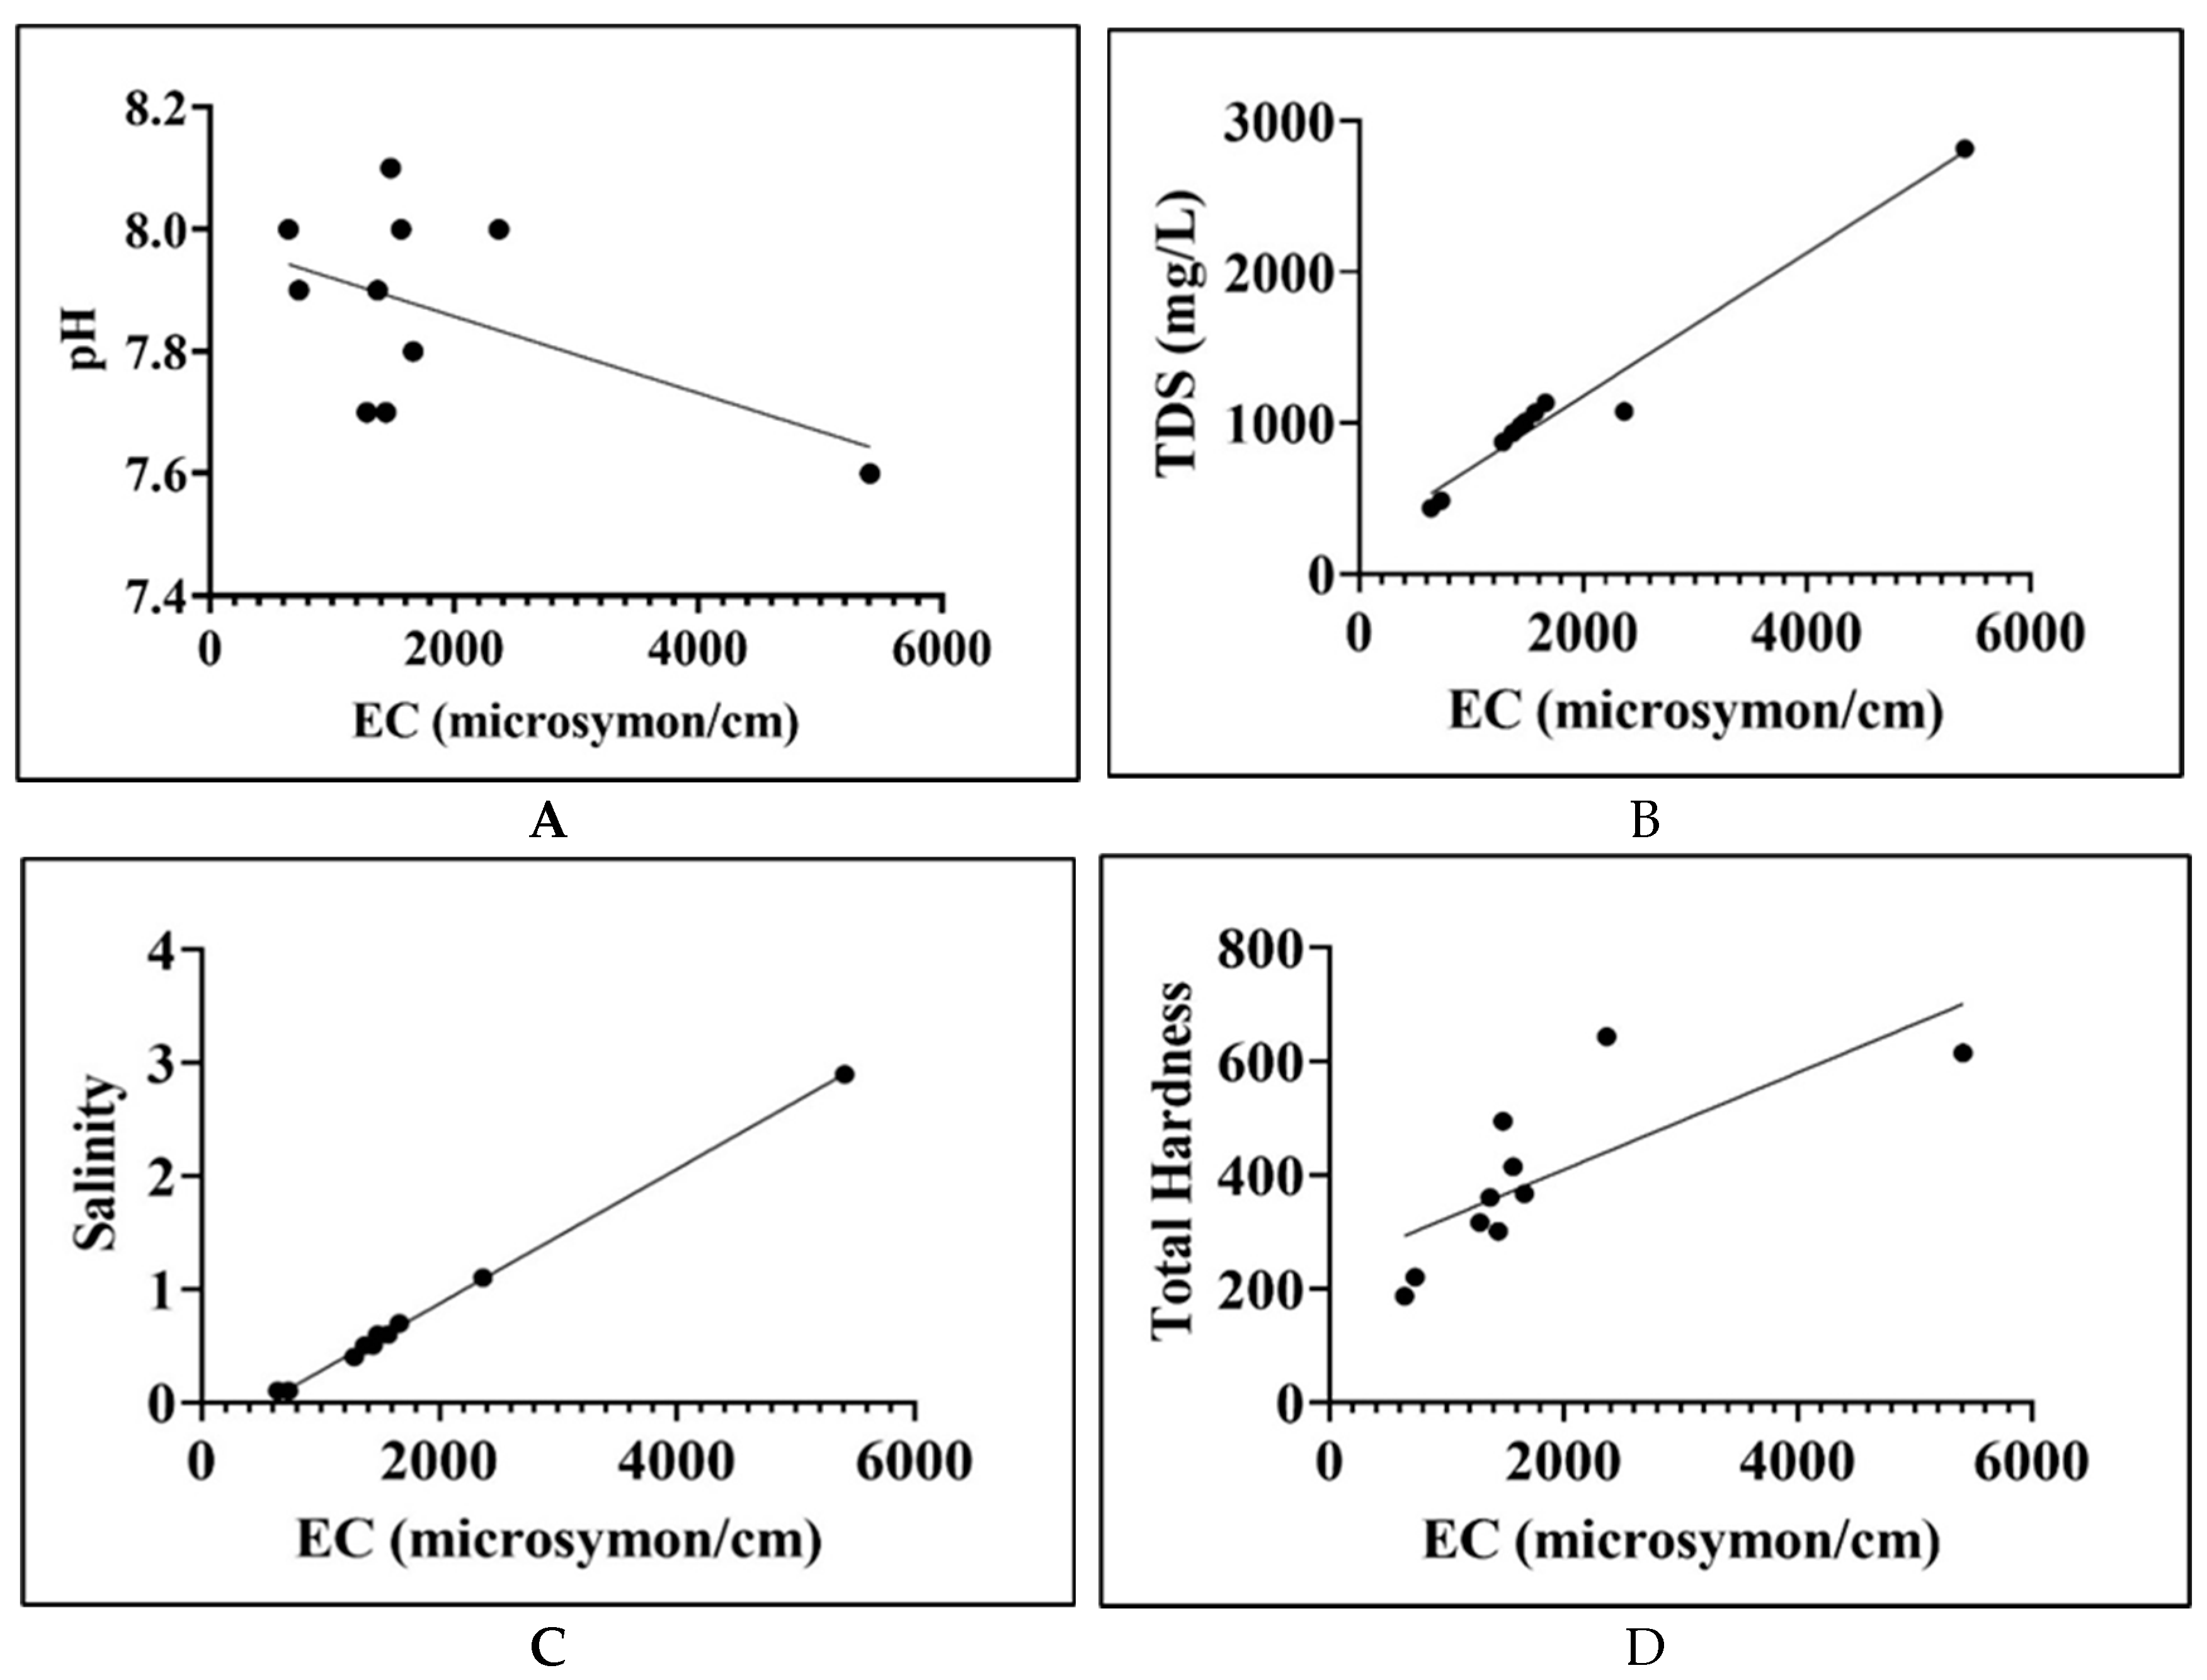
The dependent and independent variables are more dependent on one another when the coefficient of correlation is good or high. A higher regression coefficient value denotes a more valuable and well-fitting regression variable. Linear regression analysis was done to understand the Quality of the Water. For the water quality measures that have been shown to have more elevated and foremost levels of significance in their correlation coefficient, linear regression analysis was employed. Regression analysis methodical enumeration offers a quick way to assess water quality indirectly. In the study of correlation and regression, the majority of the parameters are almost correlated with one another. The correlation between EC and TDS, EC and Salinity, and EC and Total Hardness was positive whereas EC and pH were negative.
Figure.
A B, C, and D are the regression graphs against the Electrical conductivity.
3.2. Correlation Model Analysis
4. Discussion
Based on our statistical analysis there are strong positive correlation was observed also there is a negative correlation in only one parameter found. TDS, Total Hardness, and Salinity showed a strong positive correlation whereas pH had a negative correlation with EC, and Ca Hardness contributed little positive effects on Total Hardness. Water quality is discussed depending on various parameters; there are several interrelationships between the various Physico-chemical parameters. The combined effect of the interrelationships between these parameters reflects the water quality from which it can be articulated about the quality of water (Nadu, 2017). EC shows a ‘very highly statistically significant’ (p< 0.001) correlation with TDS (p=0.000006), Total Solids (p=0.000206), Salinity (p=0.000004), and Total Hardness (p=0.000807), ‘not statistically significant’ (p> 0.05) with Temperature (p=0.670681), pH (p=0.695966).
5. Conclusion
After measuring Seven physicochemical parameters of water samples of Tiruchirappalli city, it concluded that the quality of water does not fully meet the WHO guidelines (2011) and also exceeds Indian Standard Institution (ISI) guidelines. The pH satisfies the optimum range of the guidelines of both WHO and ISI, whereas other parameters like TDS, Total Hardness, and Electrical conductivity show little high ranges for that specific time which needs to be controlled. Constant high ranges can cause health hazards if consume directly for a long duration without a proper treatment process. A strong positive correlation of EC with TDS, Total Hardness, Turbidity, and Salinity was observed. Considering EC value, it will show a clear idea about the quality of water. This study wants to draw further attention to policymakers to adopt and implement the rules to maintain the good quality of drinking water in Tiruchirappalli city.
Acknowledgments
The authors are thankful to Dr. Vijaykumar Bommuraj, Research Associate, Department of Environmental Biotechnology, Bharathidasan University, for his constant support and guidance.
Funding Information and Conflicts of Interest
Rashtriya Uchchatar Shiksha Abhiyan (RUSA 2.0) Biological Science, Bharathidasan University funded the research work, authors are grateful.
References
- Ashiyani, N.; Parekh, F.; Suryanarayana, T.M.V.; Student, P.G. Analysis Of Physico-Chemical Properties of Groundwater. International Journal of Innovative Research in Science, Engineering, and Technology 2007, 3297, 1094–1098. [Google Scholar] [CrossRef]
- Bhatnagar, A.; Devi, P. Water quality guidelines for the management of pond fish culture. International Journal of Environmental Sciences 2013, 3, 1980–2009. [Google Scholar] [CrossRef]
- Kalavathy, S.; Rakesh Sharma, T.; Sureshkumar, P. Water Quality Index of River Cauvery in Tiruchirappalli district, Tamilnadu. Aes. Asia. Edu. Tw 2011, 5, 55–61 https://aesasiaedutw/Issues/AES2011/KalavathyS2011pdf. [Google Scholar]
- Lawson, O.E.; Lawson, E.O. Physico-Chemical Parameters and Heavy Metal Contents of Water from the Mangrove Swamps of Lagos Lagoon, Lagos, Nigeria. Advances in Biological Research 2011, 5, 8–21. [Google Scholar]
- McCleskey, R.B.; Kirk Nordstrom, D.; Ryan, J.N. Electrical conductivity method for natural waters. Applied Geochemistry 2011, 26, S227–S229. [Google Scholar] [CrossRef]
- Meride, Y.; Ayenew, B. Drinking water quality assessment and its effects on residents health in Wondo genet campus, Ethiopia. Environmental Systems Research 2016, 5, 1–7. [Google Scholar] [CrossRef]
- Nadu, T. Multivariate statistical analysis to assess groundwater quality. 2017, 46, 830–836.
- Napacho, Z.A.; Manyele, S.V. Quality assessment of drinking water in Temeke District (part II): Characterization of chemical parameters. African Journal of Environmental Science and Technology 2010, 4, 775–789. [Google Scholar]
- Sasikaran, S.; Sritharan, K.; Balakumar, S.; Arasaratnam, V. Physical, chemical, and microbial analysis of bottled drinking water. The Ceylon Medical Journal 2012, 57, 111–116. [Google Scholar] [CrossRef] [PubMed]
- Selvakumar, S.; Ramkumar, K.; Chandrasekar, N.; Magesh, N.S.; Kaliraj, S. Groundwater quality and its suitability for drinking and irrigational use in the Southern Tiruchirappalli district, Tamil Nadu, India. Applied Water Science 2017, 7, 411–420. [Google Scholar] [CrossRef]
- Shrestha, A.K.; Basnet, N. The Correlation and Regression Analysis of Physicochemical Parameters of River Water for the Evaluation of Percentage Contribution to Electrical Conductivity. Journal of Chemistry 2018, 2018. [Google Scholar] [CrossRef]
- Shrestha, A.K.; Basnet, N.; Bohora, C.K.; Khadka, P. Variation of Electrical Conductivity of the Different Sources of Water with Temperature and Concentration of Electrolyte Solution NaCl. International Journal of Recent Research and Review 2017, 10, 24–26. [Google Scholar]
- Sunil Ramarao, M.; Ganesh Ramdas, B. Correlation study on Physico-chemical parameters and quality assessment of Thane region, Maharashtra groundwater. Current World Environment 2009, 4, 89–95. [Google Scholar] [CrossRef]
Figure 1.
Map of thze city of Tiruchirappalli and water sample collection points.
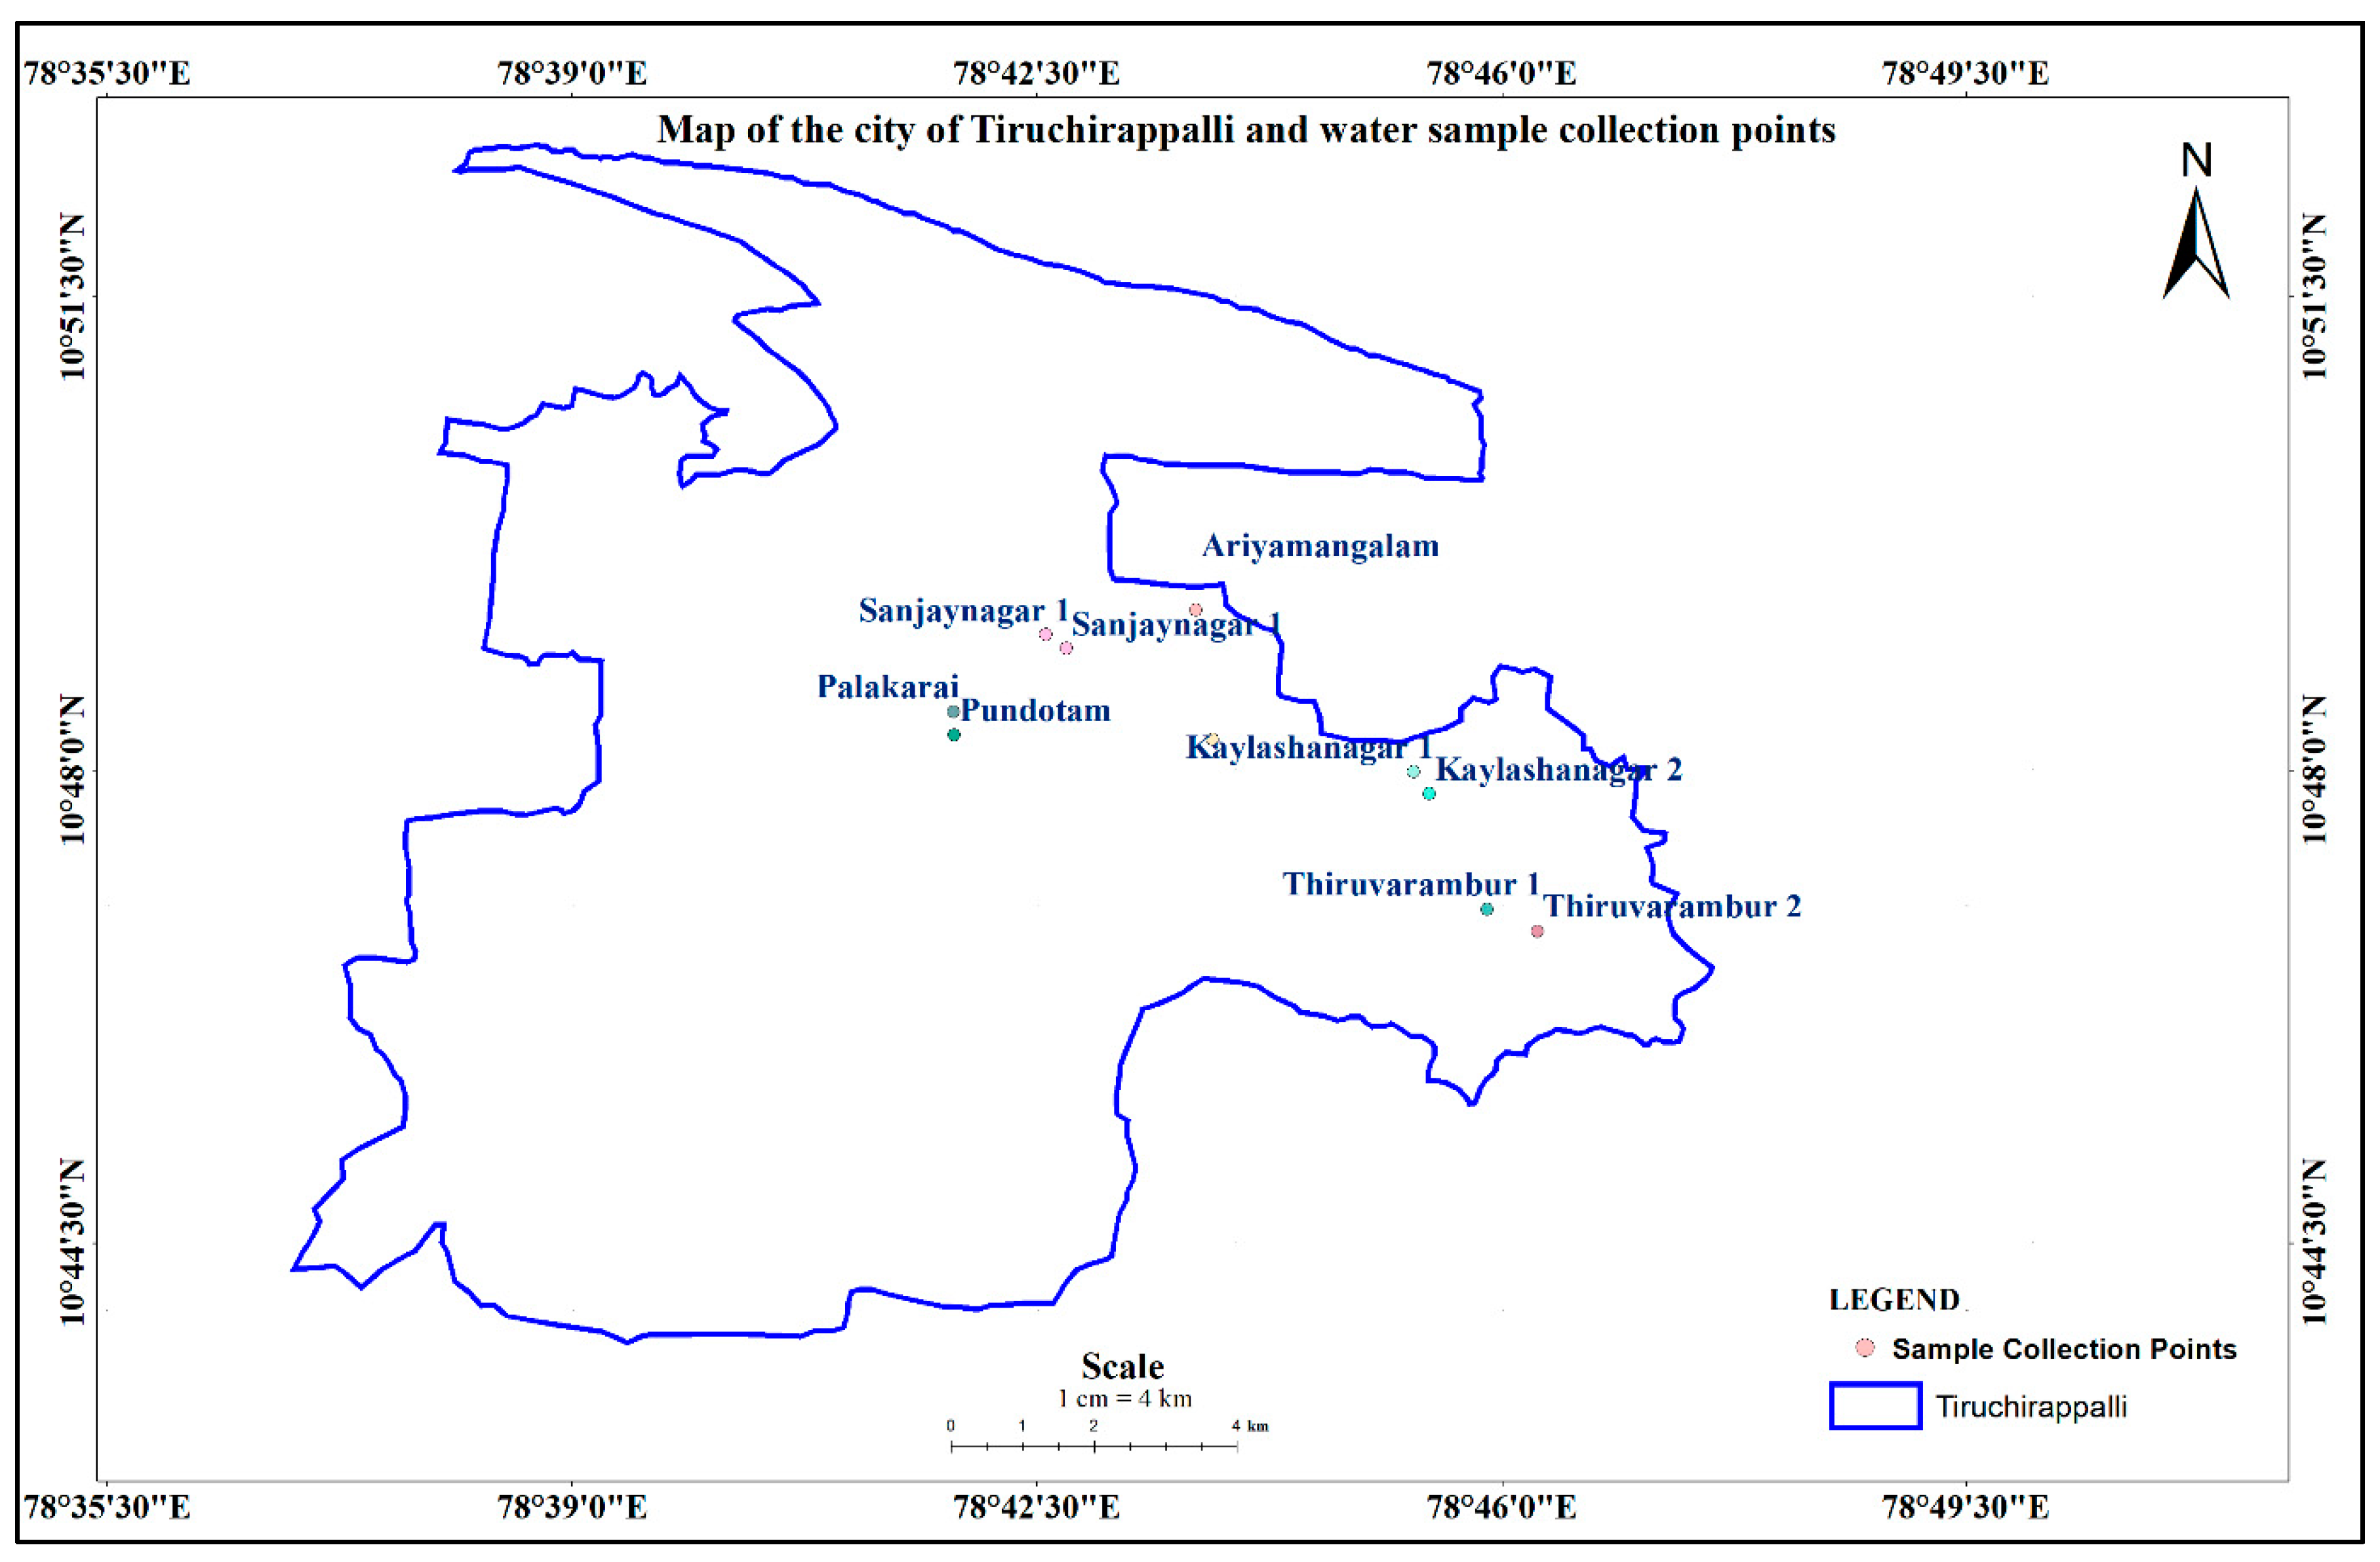

Table 1.
WHO and ISI standards.
| Parameters | WHO Guidelines (2011) | Indian Standard Institution | |||
|---|---|---|---|---|---|
| EC | < 400μS /cm | -- | |||
| pH | 6.5-8.5 | 6.5-8.5 | |||
| TDS | Up to 300mg/L 300 to 600mg/L 600 to 900mg/L 900 to 1200mg/L >1200mg/L |
Excellent Good Fair Poor Unacceptable |
500mg/L 2000mg/L |
Acceptable Permissible |
|
| Total Solids | No health-based guidelines | No health-based guidelines | |||
| Salinity | No health-based guidelines | No health-based guidelines | |||
| Total Hardness | < 60 mg/l 60–120 mg/l 120–180 mg/l > 180 mg/l |
Soft; Moderately hard; Hard; Very Hard |
200mg/L 600mg/L |
Acceptable Permissible |
|
Table 2.
Sampling sites, corresponding results, and mean of different Physico-chemical parameters.
| SL. N. | Collection Area | Temperature | pH | TDS (mg/L) | Total Solids | Salinity | Total Hardness | EC (µS/cm) |
|---|---|---|---|---|---|---|---|---|
| S1 | Ariyamangalam | 28.7 | 7.8 | 1133 | 1153.3 | 0.7 | 367 | 1665 |
| S2 | Sanjay Nagar 1 | 28.8 | 8.0 | 1077 | 1110.6 | 1.1 | 643 | 2367 |
| S3 | Kailash Nagar 1 | 28.8 | 8.1 | 1007 | 1020.3 | 0.6 | 494 | 1480 |
| S4 | Thiruvarambur 1 | 28.8 | 7.6 | 2816 | 3943.3 | 2.9 | 614 | 5410 |
| S5 | Ariyamangalam Dump yard | 28.8 | 8.0 | 1065 | 1152.0 | 0.6 | 414 | 1567 |
| S6 | Palakarai | 28.8 | 7.7 | 873 | 959.7 | 0.4 | 316 | 1284 |
| S7 | Pundotam | 29.0 | 7.7 | 980 | 1067.0 | 0.5 | 301 | 1441 |
| S8 | Thiruvarambur 2 | 28.8 | 7.9 | 486 | 506.3 | 0.1 | 220 | 730 |
| S9 | Kailash Nagar 2 | 28.8 | 8.0 | 435 | 448.0 | 0.1 | 187 | 643 |
| S10 | Sanjay Nagar 2 | 29.0 | 7.9 | 933 | 953.3 | 0.5 | 360 | 1373 |
| Mean | 28.83 | 7.87 | 1080.50 | 1231.38 | 0.75 | 391.60 | 1796.00 |
Table 3.
p> 0.05 [not statistically significant], p < 0.05* [statistically significant], p < 0.01** [highly statistically significant], p < 0.001*** [very highly statistically significant].
Table 3.
p> 0.05 [not statistically significant], p < 0.05* [statistically significant], p < 0.01** [highly statistically significant], p < 0.001*** [very highly statistically significant].
| Temperature | pH | TDS | Total Solids | Salinity | Total Hardness | EC | |
|---|---|---|---|---|---|---|---|
| Temperature | 1 | ||||||
| pH | 0.2288 | 1 | |||||
| TDS | 0.0677 | -0.1914 | 1 | ||||
| Total Solids | 0.1046 | -0.3210 | 0.9636*** | 1 | |||
| Salinity | 0.1429 | -0.0966 | 0.9786*** | 0.9052*** | 1 | ||
| Total Hardness | 0.2831 | 0.1297 | 0.8545*** | 0.7455* | 0.9236*** | 1 | |
| EC | 0.1539 | -0.1420 | 0.9879*** | 0.9394*** | 0.9909*** | 0.9030*** | 1 |
Disclaimer/Publisher’s Note: The statements, opinions and data contained in all publications are solely those of the individual author(s) and contributor(s) and not of MDPI and/or the editor(s). MDPI and/or the editor(s) disclaim responsibility for any injury to people or property resulting from any ideas, methods, instructions or products referred to in the content. |
© 2023 by the authors. Licensee MDPI, Basel, Switzerland. This article is an open access article distributed under the terms and conditions of the Creative Commons Attribution (CC BY) license (http://creativecommons.org/licenses/by/4.0/).
Copyright: This open access article is published under a Creative Commons CC BY 4.0 license, which permit the free download, distribution, and reuse, provided that the author and preprint are cited in any reuse.


