

Submitted:
23 March 2023
Posted:
23 March 2023
You are already at the latest version
Abstract
The purpose of this study is to provide an accurate formula for calculating entropy for short DNA sequences and to demonstrate how to use it to examine leukemia patient surviving. We used IDIBAPS leukemia patient’s data base with 117 anonymized records. The generalized form of the Robust Entropy Estimator (EnRE) for short DNA sequences was proposed and key EnRE futures was showed. The Survival Analysis has been done using statistical package IBM SPSS. Entropy EnRE were calculated for leukemia patients for two samples: A. 2 groups divided by median EnRE and B. 2 groups of patients were formed according to their belonging to 1st and 4th quartiles of EnRE. The result of survival analysis are statistically significant: A. p < 0.05; B. p < 0.005. The death hazard for a patient with EnRE below median is 1.556 times that of a patient with EnRE over median and that the death hazard for a patient of 1st quartile (lowest EnRE) is 2.143 times that of a patient of 4th quartile (highest EnRE). The transition from median to quartile patients’ groups with more EnRE differentiation confirmed the unique significance of the entropy of DNA sequences for leukemia patients surviving.
Keywords:
information entropy
; DNA sequences
; patients surviving
; leukemia
1. Introduction
Deoxyribonucleic acid (DNA) is not a random sequence of four nucleotides (A – adenine, C – cytosine, G – guanine, T – thymine) combinations: comprehensive reviews [1,2] persuasively shows long- and short-range correlations in DNA, periodic properties and correlations structure of sequences. Information theory methods imply quantifying the amount of information contained in sequences. According to a recent article in Cells [3], mammalian aging is greatly impacted by the reduction in quantity and quality of information in DNA sequences. Recognition of an organism's physiological age and backward rejuvenation of it are both highly dependent on the level of genetic and epigenetic information stored in DNA sequences. The information entropy by Claude Shannon was one of the first information measure for studied DNA sequences [4]. Nowadays, the Shannon’s entropy implementations continue to be very successful for analyzing viral RNA, like SARC-COV-2 [5]. Thorough review of different entropy approaches ‘to identify the formal connections between genetic diversity and the flow of information’ was given in [6] and comprehensive review [7] puts state of art of information theory implementations for analyzing ‘gene expression and transcriptomics, alignment-free sequence comparison, sequencing and error correction, genome-wide disease-gene association mapping, metabolic networks and metabolomics, and protein sequence, structure and interaction analysis’.
On the other hand, the relationship between entropy and patient survival is widespread in some branches of medicine and medical researches, as few examples:
- Cardiology: Used Approximated entropy based on Heart Rate Variability (HRV) for sudden cardiac death prognostication, evaluation of the effect of specific pharmacologic agents on HRV [8]; Used entropy based on Holter Electro-Cardiograms (ECG) and Heart Rate (HR) of normal cardiac dynamics and those with varying degrees of acute cardiac pathologies [9]; Consecutive post–myocardial infarction patients undergoing late gadolinium enhanced cardiac magnetic resonance (MR) with derived MR imaging tissue entropy. Patients were followed for appropriate implantable cardioverter-defibrillator therapy and mortality [10].
- Neurology: investigated the association of heart rate entropy (HRE) with mortality after intracerebral hemorrhage [11];
- Surgery (general anesthesia): Entropy monitoring involves using electroencephalography (EEG) to assess the depth of general anesthesia in surgical patients [12] ;
- Trauma: For the categorisation of injury using entropies it is necessary to consider the underlying entropy of the individuals morbidity to which is added the entropy of trauma, which then may result in death [13]; Shown integer heart rate (HR) multiscale entropy (MSE), an indicator of complexity, predicts death based on long duration. Heart rate MSE within hours of admission predicts death occurring days later [14]; In this study measured both Shannon and Tsallis entropy of temperature signals in a cohort of critically ill patients. The reduced wavelet Shannon and Tsallis entropies of temperature signals may complement with sequential organ failure assessment in mortality prediction [15];
- Oncology: used DNA copy number entropy (by array CGH DNA profile imaging) for survival analyzing of patients with esophageal adenocarcinoma [16]; used imaging texture analyzing entropy as predictive marker of promoter methylation status of the O6-methylguanine-DNA methyltransferase in glioblastomas [17]; nuclear texture analysis measures the spatial arrangement of the pixel gray levels in a digitized microscopic nuclear image and is a promising quantitative tool for prognosis of cancer. It was evaluated the prognostic value of entropy-based adaptive nuclear texture features for patients with uterine sarcomas [18]; used nuclear texture analysis for detection of high-chromatin entropy nuclei. Chromatin entropy supplemented existing prognostic markers in multivariable analyses of three gynecological cancer cohorts [19].
Therefore, it appears there is a necessity for implementing advantages of information theory methods for exploration of relationship between mortality of some category of patients and entropy of their DNA sequences. The goal of this paper is to provide a reliable formula for calculating entropy accurately for short DNA sequences and to show how to use existing entropy analysis to examine the mortality of leukemia patients.
2. Materials and Methods
We used Instituto de Investigaciones Biomédicas August Pi i Sunyer (IDIBAPS) leukemia patient’s data base (DB) with 117 anonymized records that consists: Date of patient’s diagnosis, Date of patient’s death, Leukemia diagnoses, Patient’s DNA sequence. Average time for patient death after diagnoses: 99 ± 77 months. The formal characteristics of DNA sequences in UB leukemia patient’s DB are: average number of bases N=496±69; min (N)=297 bases; max(N)=745 bases.
Statistically DNA is mostly close to uniform distribution but has exactly different non-uniform frequency patterns, e.g. base frequencies of human mitochondrion (16,569 bases) are A – 31%, C – 31%, G – 13%, T – 25% or human fetal globin exons (882 bases) are A – 24%, C – 25%, G – 28%, T – 22% [20]. We have shown comparison between real DNA sequence and simulated by uniform distribution on Figure 1 and Figure 2:
Claude Shannon originally proposed the formula of information entropy in 1948 [21] and here is called Empirical Entropy (EnEmp) due to the limitations of time series:
The problem of using the formula (1) in practice are:
- insensitivity to changing nucleotide positions in DNA sequence. There is sensitivity to changing of base only;
- low accuracy for small number of points in a time series (e.g. N < 1000);
- slow descending to an accurate value with the increasing length of sequence.
Shown in Table 2 is the dependency of accuracy of calculating entropy according to formula (1) on the length of a series for certain types of distribution of a random value. Accurate entropy values for associated distributions are given in Table 1.

Table 1.
Various probability distributions and correspondent Entropy [22].
Table 1.
Various probability distributions and correspondent Entropy [22].
| Distribution | Probability density function | Entropy (En, nats) |
|---|---|---|
| Normal Distribution | ||
| Uniform Distribution | ||
| Exponential Distribution | ||
| Lognormal Distribution | ||
| Pareto Distribution |
Table 2.
Dependence from the length of time series of Entropy estimation accuracy and Correlation along simulated distribution parameters for various probability distributions.
Table 2.
Dependence from the length of time series of Entropy estimation accuracy and Correlation along simulated distribution parameters for various probability distributions.
| Distribution | Length of sample | Empirical Entropy (EnImp) | Robust Entropy Estimator (EnRE) | ||
|---|---|---|---|---|---|
| Accuracy (Relative Error, %) | Correlation | Accuracy (Relative Error, %) | Correlation | ||
| Uniform Distribution (a = 0; b = 4) |
N=100 | 6.92 | 0.978 | 4.71 | 0.991 |
| N =500 | 4.11 | 0.988 | 0.57 | 0.997 | |
| N =1000 | 3.83 | 0.999 | 0.11 | 0.998 | |
| Normal Distribution ) |
N=100 | 7.74 | 0.994 | 1.95 | 0.995 |
| N =500 | 1.83 | 0.997 | 0.35 | 0.998 | |
| N =1000 | 0.91 | 0.999 | 0.16 | 0.999 | |
| Exponential Distribution ) |
N=100 | 46.24 | 0.452 | 0.77 | 0.993 |
| N =500 | 28.38 | 0.903 | 0.25 | 0.997 | |
| N =1000 | 19.31 | 0.950 | 0.06 | 0.999 | |
| Lognormal Distribution ) |
N=100 | 3.69 | 0.980 | 3.38 | 0.986 |
| N =500 | 1.17 | 0.997 | 0.49 | 0.997 | |
| N =1000 | 0.80 | 0.999 | 0.22 | 0.999 | |
| Pareto Distribution = 2; s = 1000 – 2000) |
N=100 | 32.68 | 0.589 | 1.01 | 0.997 |
| N =500 | 17.78 | 0.867 | 0.35 | 0.998 | |
| N =1000 | 14.75 | 0.946 | 0.12 | 0.999 | |
The uniform distribution case (shown in Figure 1 and Figure 2.) receives special attention, but other distributions are also taken into consideration as necessary examples of using numerical formulas for analysis of a limited series because it is not always possible to precisely match the observed DNA sequence with some fixed random distribution. We can acknowledge the impossibility of applying the formula (1) to a short times series N < 1000. Therefore, it would seem that developing a formula for accurately measuring entropy for a small number of DNA sequences is necessary.
Early in the last century, an Italian statistics professor Corrado Gini had proposed a way to measure the inequality among values of a frequency distribution (the Gini coefficient) [23]:
where M is a mean of x values. The Gini coefficient proved to be very popular in economics and sociology, and there are attempts to apply it to other areas as well, including HRV analyzing [24]. The Gini coefficient is an instance of generalized inequality index [25], and its alternative, as measure of deviation from balance — generalized entropy index — is derived from information theory as a measure of redundancy in data [26]. There are known limitations when using the Gini coefficient for data analysis: dependence on additive change of mean; a small selection substantially decreases the magnitude of the coefficient and etc.
Therefore, following the analysis of known definitions of measures of deviation from balance and degree of order, a generalized form of the Robust Entropy Estimator (EnRE) for time series was proposed in [27] and adopted for DNA sequences now:
where MD is median of the sequence for numerically coded bases B; - distance between ; A, l, m, k – estimated coefficients. Search conditions for coefficients A, l, m, k is the following:
1/accurate approximation for known distributions of a random value;
2/independence of EnRE from N for initial time series and for series after sorting;
3/independence of EnRE from additive changes of mean.
After numerical researches, final results of which are presented in Tab.2, the following coefficient values had been found: l = , m = , k = 2. Let us highlights some key futures of the discovered generalized form of EnRE and coefficients:
1/form of recording (3) and found coefficients l, m, k provide independence from additive change of mean series and from magnitude of selection N for basic series and for series after sorting;
2/value EnRE is sensitive to structural changes in series, such as, for example, sorting which increases the degree of order in series, decreasing the EnRE;
3/value EnRE is sensitive to change of nucleotide position in DNA sequence;
4/readjusting coefficient A alone may be required to find the best EnRE value in another range of change in parameters of various random distributions, which can always be done using the method of least squares.
The Survival Analysis has been done using statistical package IBM SPSS 27.
3. Results
3.1. Accuracy
First of all, let us test the accuracy of the proposed formula (3) for calculating entropy: Table 2 provides values of EnRE for various lengths of time series and various types of random distributions, and error values are given for each of these results when entropy is calculated and correlated with precise values when distribution parameters are changed. Let us note, that in all cases for N = 500, relative error in calculating the precise value of entropy does not exceed 1 %, while the magnitude of correlation is no worse than 0.995; in case of uniform and normal distribution the relative error for time series length N=500÷1000 are less than 0.6% and correlation is about 0.998.
3.2. Optimal DNA sequence coding
An initial DNA sequence's alphabet code should be converted into a numerical code of bases, but such permutation is arbitrary. We have used a principle of maximum entropy to avoid such arbitrariness. In Table 3, we present different numerical decoding of DNA sequences and their entropy values, standard deviations and coefficients of variation.
We can assume that, according to the EnRE properties, any symmetric change in integer decoding gives the same EnRE value (see the first two rows of Table 3); only one minimal and symmetric numerical decoding about zero gives the maximum for EnRE (bolded in Table 3). An additional, there is the minimal standard deviation and coefficient of variation for this numerical coding (A=-1, C=-2, G=1, T=2). Furthermore, this optimization rule reduced the self-influence of numerical decoding variance. A biochemical interpretation of this optimal coding is possible: A and G are purines that coded as -1 and +1; C and T are pyrimidines that coded as -2 and +2. The pairs A-T and G-C are complementary as purine to pyrimidine and "-" to "+". Thus, numerical decoding arbitrariness was removed by only one possible integer combination.
3.3. Leukemia patient’s surviving
The entropy EnRE was calculated for all Leukemia patients after optimal integer decoding generated by a translation symmetry group (A = -1, C = -2, G = 1, T = 2).
3.3.1. Median groups
All patients were divided by median EnRE = 1.47 for 2 groups:
- Group ‘1’, 58 patients, EnRE below median;
- Group ‘2’, 59 patients, EnRE over median.
On Figure 3, we present the frequencies of DNA bases for both groups divided by median EnRE. There is no any significant changes in the frequencies of DNA bases between groups, thus statistical significance of difference in EnRE means is mainly caused by differences in the ordering of patients’ DNA nucleotides in the groups.
The result of Kaplan-Meier survival analysis is given on Figure 4 (a). All overall comparisons show statistical significance: p=0.015 for Log Rank (Mantel-Cox); p=0.002 for Breslow (Generalized Wilcoxon); p=0.003 for Tarone-Ware. Descriptive statistics for all groups are given in final Table 5.
The result of Cox Regressions survival modelling is given on Figure 4 (b). All overall comparisons show statistical significance: p=0.015 for Omnibus test of model coefficients; p=0.016 for variables in equation with ‘-2 Log Likelihood‘=862.2. The value of Exp(B) for model variable shows that the death hazard for a patient with EnRE below median is 1.556 times that of a patient with EnRE over median.
3.3.2. 1st and 4th quartiles groups
2 groups of patients were formed according to their belonging to 1st and 4th quartiles:
- 3.
- Group ‘1’, 29 patients, EnRE ≤ 1.448, that is below 1st quartile;
- 4.
- Group ‘4’, 29 patients, EnRE ≥ 1.490, that is over 4th quartile.
The result of Kaplan-Meier survival analysis is given on Figure 5 (a). All overall comparisons show statistical significance: p=0.005 for Log Rank (Mantel-Cox); p=0.003 for Breslow (Generalized Wilcoxon); p=0.003 for Tarone-Ware. Descriptive statistics for all groups are given in final Table 5.
The result of Cox Regressions survival modelling is given on Figure 5 (b). All overall comparisons show statistical significance: p=0.005 for Omnibus test of model coefficients; p=0.005 for variables in equation with ‘-2 Log Likelihood‘=345.4. The value of Exp(B) for model variable shows that the death hazard for a patient of 1st entropy quartile (lowest EnRE) is 2.143 times that of a patient of 4th entropy quartile (highest EnRE).
3.3.3. Immunoglobulin Variable Heavy Chain Gene (IgVH) mutated and unmutated subtypes
In article [28], it is shown: ‘Chronic lymphocytic leukemia (CLL) presents two subtypes which have drastically different clinical outcomes, IgVH mutated (M-CLL) and IgVH unmutated (U-CLL)’. I was indicated that ‘U-CLL, the more aggressive type of the disease, shows significantly increased variability of gene expression across patients and that, overall, genes that show higher variability in the aggressive subtype are related to cell cycle, development and inter-cellular communication.’ It will be actual to establish a relation between leukemia patient surviving and entropy DNA sequences for IgVH subtypes M-CLL and U-CLL. For this purpose, we used the 177 leukemia patients' UB database, where M-CLL and U-CLL distributions between groups divided by entropy are shown in Table 4.
Table 4.
Leukemia patient’s entropy (EnRE) of DNA sequences groups and IgVH subtypes.
| IgVH subtype | Entropy of DNA sequences groups, number of patients | |||
|---|---|---|---|---|
| Below median | Over median | 1st quartile | 4th quartile | |
| Mutated (M-CLL) | 26 | 16 | 13 | 9 |
| Unmutated (U-CLL) | 32 | 43 | 16 | 20 |
We did not find statisticaly significant differences of M-CLL and U-CLL EnRE neither for equality of means nor for equality of variance. The survival analysis shows statistical significance only for M-CLL stratum in both cases: median groups and 1st and 4th quartiles groups.
3.3.4. Combined analyzing for median entropy groups and M-CLL, U-CLL subtypes
We constructed a two-dimensional (2D) space for deeply analyzing of each factor influencing (EnRE and IgVH subtypes) on leukemia patients surviving. On the Figure 6 showed two leukemia patient’s groups for surviving analysis:
- EnRE below median (Low) and U-CLL;
- EnRE over median (High) and M-CLL.
The result of Kaplan-Meier survival analysis is given on Figure 7 (a). All overall comparisons show statistical significance: p=0.004 for Log Rank (Mantel-Cox); p=0.014 for Breslow (Generalized Wilcoxon); p=0.007 for Tarone-Ware. Descriptive statistics for all groups are given in final Table 5.
Table 5.
Summary table for leukemia patient’s surviving analysis.
| Groups | Number of patients | Average EnRE ± SE | Average time of surviving ± SE , months | Hazard | Significance | |
|---|---|---|---|---|---|---|
| Median | Below med. (Low) | 58 | 1.442 ± 0.003 | 76.4 ± 9 | 1.56 | p < 0.05 |
| Over med. (High) |
59 | 1.504 ± 0.003 | 114.3 ± 9 | 1 | ||
| Quarter | 1st quart. (Lowest) |
29 | 1.425 ± 0.003 | 78.6 ± 11 | 2.14 | p < 0.005 |
| 4rd quart. (Highest) | 29 | 1.519 ± 0.005 | 129.6 ± 11 | 1 | ||
| Median & IgVH subtypes | Low & U-CLL |
32 | 1.443 ± 0.003 | 78.2 ± 13 | 2.61 | p < 0.01 |
| High & M-CLL |
16 | 1.505 ± 0.005 | 154.3 ± 25 | 1 | ||
The result of Cox Regressions survival modelling is given on Figure 7 (b). All overall comparisons show statistical significance: p=0.005 for Omnibus test of model coefficients; p=0.004 for variables in equation with ‘-2 Log Likelihood‘=272.8. The value of Exp(B) for model variable shows that the death hazard for a patient of Low&U-CLL is 2.611 times that of a patient of High&M-CLL.
The Generalized Linear Mixed Model (GLMM) can be performed for predictions of months from leukemia diagnosis to patient’s death based on evaluation of entropy EnRE level and IgVH subtype. The model is statistically significant on the level of p < 0.05 for a whole model, intercept and each variable:
Months = 30.09*IgVH + 37.43 * EnMed + 69.65, months.
Where, IgVH = 0 for U-CLL subtype, IgVH = 1 for M-CLL subtype; EnMed = 0 for EnRE below median and EnMed = 1 for EnRE over median. Thus, proposed GLMM suggests that the combination of a mutated IgVH subtype and a high entropy of DNA sequence over the median can double the minimal life expectancy of leukemia patients from diagnosis to death.
4. Discussion
The generalized form of Robust Entropy Estimator (3), which has been effectively used to calculate entropy values for a variety of random distributions (Table 1 and Table 2), is proposed in this paper for DNA sequences of a finite length (N ≈500). We have formulated generalized parameters estimation rules for Entropy Robust Estimator (3). Important characteristics of the found generalized form of EnRE and coefficients are:
1/sensitive to change of nucleotide position in DNA sequence;
2/value EnRE is sensitive to structural changes in series, such as, for example, sorting which increases the degree of order in series, decreasing the EnRE;
3/form of recording (3) and found coefficients l, m, k provide independence from additive change of mean series and from magnitude of selection N for basic series and for series after sorting;
4/readjusting coefficient A alone may be required to find the best EnRE value in another range of change in parameters of various random distributions, which can always be done using the method of least squares.
Using the proposed generalized form for Entropy Robust Estimator (3) for UB leukemia patient’s database, we analyzed DNA sequences entropy and IgVH subtypes of leukemia patient’s surviving:
Patients groups comparison:
- A
- Groups divided by median. Both, Kaplan-Meier survival analysis and Cox Regressions survival modelling, showed the statistically significant results for p < 0.05. The value of Exp(B) for Cox Regressions model variable shows that the death hazard for a patient with EnRE below median is 1.556 times that of a patient with EnRE over median. The relation of average time of death after diagnoses is 1.496 times more for patients with EnRE over median in compare with patients with EnRE below median.
- B
- Patients groups formed of 1st and 4th quarterlies. Both, Kaplan-Meier survival analysis and Cox Regressions survival modelling, showed the statistically significant results for p < 0.005. The value of Exp(B) for model variable shows that the death hazard for a patient of 1st entropy quartile (lowest EnRE) is 2.143 times that of a patient of 4th entropy quartile (highest EnRE). The relation of average time of death after diagnoses is 1.649 times more for patients of 4th entropy quartile in compare with patients of 1st entropy quartile.
- C
- Combined groups: Low&U-CLL and High&M-CLL. Both, Kaplan-Meier survival analysis and Cox Regressions survival modelling, showed the statistically significant results for p < 0.01. The value of Exp(B) for Cox Regressions model variable shows that the death hazard for a patient with EnRE below median & U-CLL is 2.611 times that of a patient with EnRE over median & M-CLL. The relation of average time of death after diagnoses is 1.973 times more for patients with EnRE over median & M-CLL in compare with patients with EnRE below median & U-CLL.
Thus, the transition from median to 1st and 4th quartiles patients’ groups with more EnRE differentiation between groups confirmed the unique significance of the entropy of DNA sequences for leukemia patient’s surviving. This significance is proved statistically by increasing hazard and decreasing of average time of death after diagnoses for leukemia patients with lower entropy of DNA sequences.
Stratification by IgVH shows that entropy of DNA sequences survival analysis is statistically significant for mutated subgroup (M-CLL). Accordingly, the presented entropy-based DNA sequences analyzing and the proposed in [27] IgVH mutated/unmutated immunoglobulin subtypes dividing methods complement each other and provide additional accuracy for mutated subgroup patients. A Generalized Linear Mixed Model suggests that the combination of a mutated IgVH subtype and a high entropy of DNA sequence over the median can double the minimal life expectancy of leukemia patients from diagnosis to death.
The future elaboration of current research is inclusion of more different patients’ groups for exploration patient’s surviving in relation with entropy DNA sequences as well as involving other methods of fractal analyses for DNA sequences, like fractal dimension or sequence reversibility.
Author Contributions
Conceptualization, A.M. and X.P.; methodology, A.M.; software, A.M.; validation, A.M., X.P. and S.F.; formal analysis, A.M.; investigation, S.F. and J.G.; resources, X.P., S.F. X.B. and J.G.; data curation, S.F., X.B. and J.G.; writing—original draft preparation, A.M.; writing—review and editing, A.M.; visualization, A.M.; supervision, X.P.; project administration, X.P.; funding acquisition, X.P.
Funding
This research received no external funding
Institutional Review Board Statement
“Ethical review and approval were waived for this study due to REASON: data were fully anonymized and reused from any existing datasets.”
Data Availability Statement
Not applicable.
Acknowledgments
The Authors wish to grateful the contributions of Prof. Elias Campo and Prof. Alfonso Valencia for the critical review of this article.
Conflicts of Interest
The authors declare no conflict of interest.
References
- Li, W.T. The study of correlation structures of DNA sequences: a critical review. Comput. Chem 1997, 21(4), 257–271.
- Damasevicius, R. Complexity estimation of genetic sequences using information-theoretic and frequency analysis methods. Informatica 2010, 21(1), 13–30.
- 3. Yang, Jae-Hyun et al. Loss of epigenetic information as a cause of mammalian aging. Cells 2023, 186, 1–22. [CrossRef]
- Rowe, G.W.; Trainor, L.E.H. On the informational content of viral DNA. J. Theoretical Biology 1983, 101, 151–170.
- Vopson, M.M.; Robson, S.C. A new method to study genome mutations using the information entropy. Physica A 2012, 1-9. [CrossRef]
- Sherwin, W.B. Entropy and Information Approaches to Genetic Diversity and its Expression: Genomic Geography. Entropy 2010, 12, 1765-1798;. [CrossRef]
- Chanda, P.; Costa, E.; Hu, J.; Sukumar, S.; Van Hemert, J.; Walia, R. Information Theory in Computational Biology: Where We Stand Today. Entropy 2020, 22, 627. [CrossRef]
- Villareal, R.P.; Liu, B.C; Massumi, A. Heart rate variability and cardiovascular mortality. Curr. Atheroscler Rep. 2002, 4, 120–127. https://doi-org.sire.ub.edu/10.1007/s11883-002-0035-18.
- Rodríguez, J.; Correa, C.; Ramírez, L. Heart dynamics diagnosis based on entropy proportions: Application to 550 dynamics. Revista Mexicana de Cardiología 2017, 28(1), 10-20.
- Androulakis, A.F.A.; Zeppenfeld, K.; Paiman, E.H.M.; Piers, S.R.D., Wijnmaalen, A.P.; Siebelink, H.J.; Sramko, M.; Lamb, H.J.; van der Geest, R.J.; de Riva, M.; Tao, Q. Entropy as a Novel Measure of Myocardial Tissue Heterogeneity for Prediction of Ventricular Arrhythmias and Mortality in Post-Infarct Patients. JACC Clin Electrophysiol 2019, 5(4), 480-489. [CrossRef]
- Sykora, M.; Szabo, J.; Siarnik, P.; Turcani, P.; Krebs, S.; Lang, W.; Czosnyka, M.; Smielewski, P. Heart rate entropy is associated with mortality after intracereberal hemorrhage, Journal of the Neurological Sciences 2020, 418, 1-5: . [CrossRef]
- Matsuda, E. Entropy Monitoring in Patients Undergoing General Anesthesia. Am J Nurs. 2017, 117(3), 62. [CrossRef]
- Neal-Sturgess, C. The Entropy of Morbidity Trauma and Mortality. Arxiv Cornell University 2010, Med. Physics, 1-20. [CrossRef]
- Norris, P.R.; Anderson, S.M.; Jenkins, J.M.; Williams, A.E.; Morris, J.A.Jr. Heart rate multiscale entropy at three hours predicts hospital mortality in 3,154 trauma patients. Shock 2008, 30(1),17-22. [CrossRef]
- Papaioannou, V.E.; Chouvarda, I.G.; Maglaveras, N.K.; Baltopoulos, G.I.; Pneumatikos, I.A. Temperature multiscale entropy analysis: a promising marker for early prediction of mortality in septic patients. Physiol Meas. 2013, 34(11), 1449-66. [CrossRef]
- Obulkasim, A.; et all. Reduced genomic tumor heterogeneity after neoadjuvant chemotherapy is related to favorable outcome in patients with esophageal adenocarcinoma. Oncotarget 2016, 7(28), 44084-44095. [CrossRef]
- Kanazawa,T.; Minami, Y.; Jinzaki, M.; Toda, M.; Yoshida, K.; Sasaki, H. Predictive markers for MGMT promoter methylation in glioblastomas. Neurosurg Rev. 2019, 42(4), 867-876. [CrossRef]
- Nielsen, B.; Hveem, T.S.; Kildal, W.; Abeler, V.M.; Kristensen, G.B.; Albregtsen, F.; Danielsen, H.E. Entropy-based adaptive nuclear texture features are independent prognostic markers in a total population of uterine sarcomas. Cytometry A. 2015, 87(4), 315-25. [CrossRef]
- Nielsen, B.; at all. Association Between Proportion of Nuclei With High Chromatin Entropy and Prognosis in Gynecological Cancers. J Natl Cancer Inst. 2018, 110(12), 1400-1408. [CrossRef]
- Weir, B.S. Statistical analysis of molecular genetic data. IMA J. of Math. Applied in Medicine and Biology 1985, 2, 1-39.
- Shannon, C.E. A Mathematical Theory of Communication. Bell System Technical Journal. 1948, 27 (3), 379–423. doi:10.1002/j.1538-7305.1948.tb01338.x.
- Lazo, A.; Rathie, P. On the entropy of continuous probability distributions. IEEE Transactions on Information Theory 1978, 24 (1). doi:10.1109/TIT.1978.1055832.
- Gini, C. Variabilità e mutabilità. Memorie di metodologica statistica. Reprinted in Pizetti, E.; Salvemini, T., eds. Libreria Eredi Virgilio Veschi: Rome, Italy, 1955.
- Sánchez-Hechavarría, M.E.; at all. Introduction of Application of Gini Coefficient to Heart Rate Variability Spectrum for Mental Stress Evaluation. Arq Bras Cardiol. 2019; [online].ahead print, PP.0-0. [CrossRef]
- Firebaugh, G. Empirics of World Income Inequality. American Journal of Sociology 1999, 104 (6), 1597–1630. doi:10.1086/210218.
- Shorrocks, A.F. The Class of Additively Decomposable Inequality Measures. Econometrica 1980, 48 (3), 613–625. [CrossRef]
- Martynenko, A.; Raimondi, G.; Budreiko, N. Robust Entropy Estimator for Heart Rate Variability. Klin. Inform. Telemed. 2019. 14(15), 67-73. [CrossRef]
- Ecker, S.; Pancaldi, V.; Ric, D.; Valencia, A. Higher gene expression variability in the more aggressive subtype of chronic lymphocytic leukemia. Genome Medicine 2015; 7(8), 12. [CrossRef]
Figure 1.
Real patient DNA sequence, N=745 bases (UB leukemia patient DB): (a) nucleotides distribution; (b) nucleotides frequenies (A – 1; C – 2; G – 3; T – 4).
Figure 1.
Real patient DNA sequence, N=745 bases (UB leukemia patient DB): (a) nucleotides distribution; (b) nucleotides frequenies (A – 1; C – 2; G – 3; T – 4).
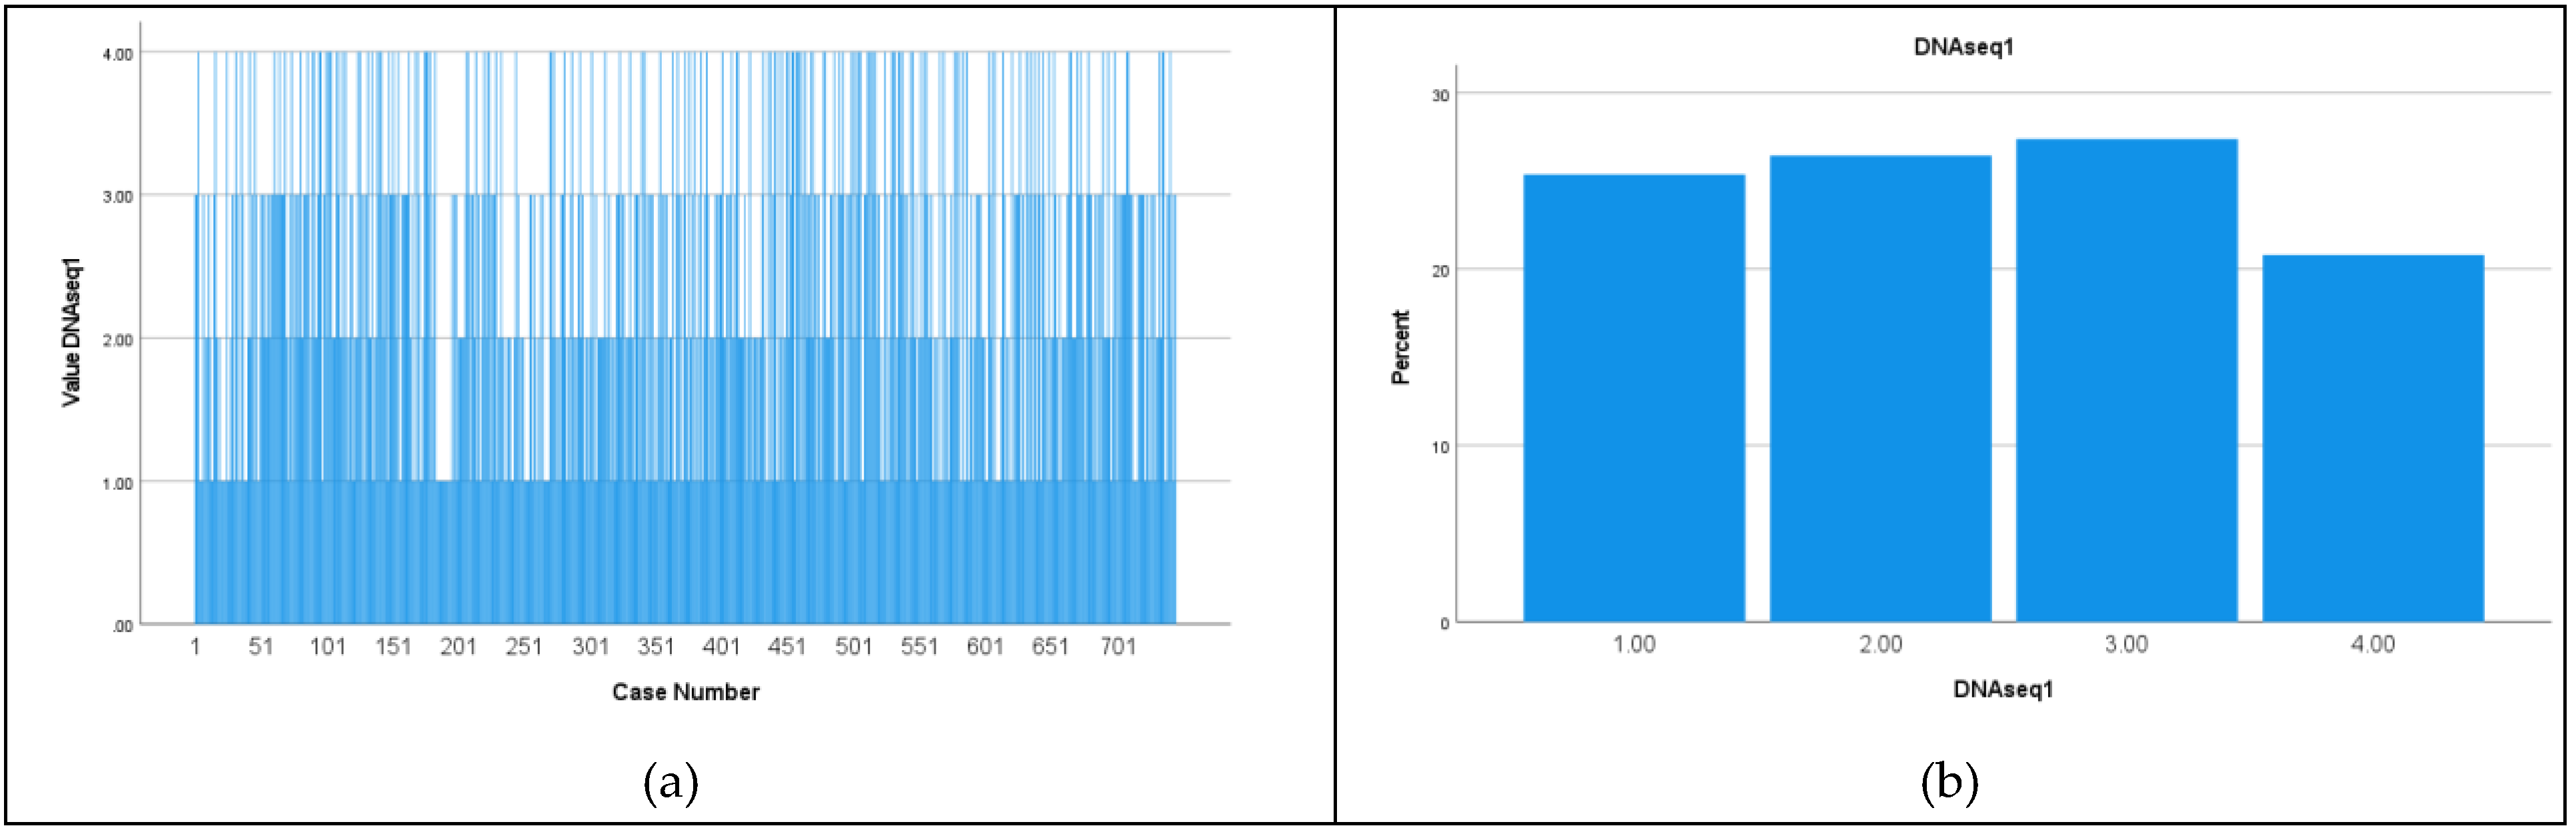
Figure 2.
Simulated 4 elements sequence by Uniform distribution, N=745 bases: ): (a) nucleotides distribution; (b) nucleotides frequenies (A – 1; C – 2; G – 3; T – 4).
Figure 2.
Simulated 4 elements sequence by Uniform distribution, N=745 bases: ): (a) nucleotides distribution; (b) nucleotides frequenies (A – 1; C – 2; G – 3; T – 4).
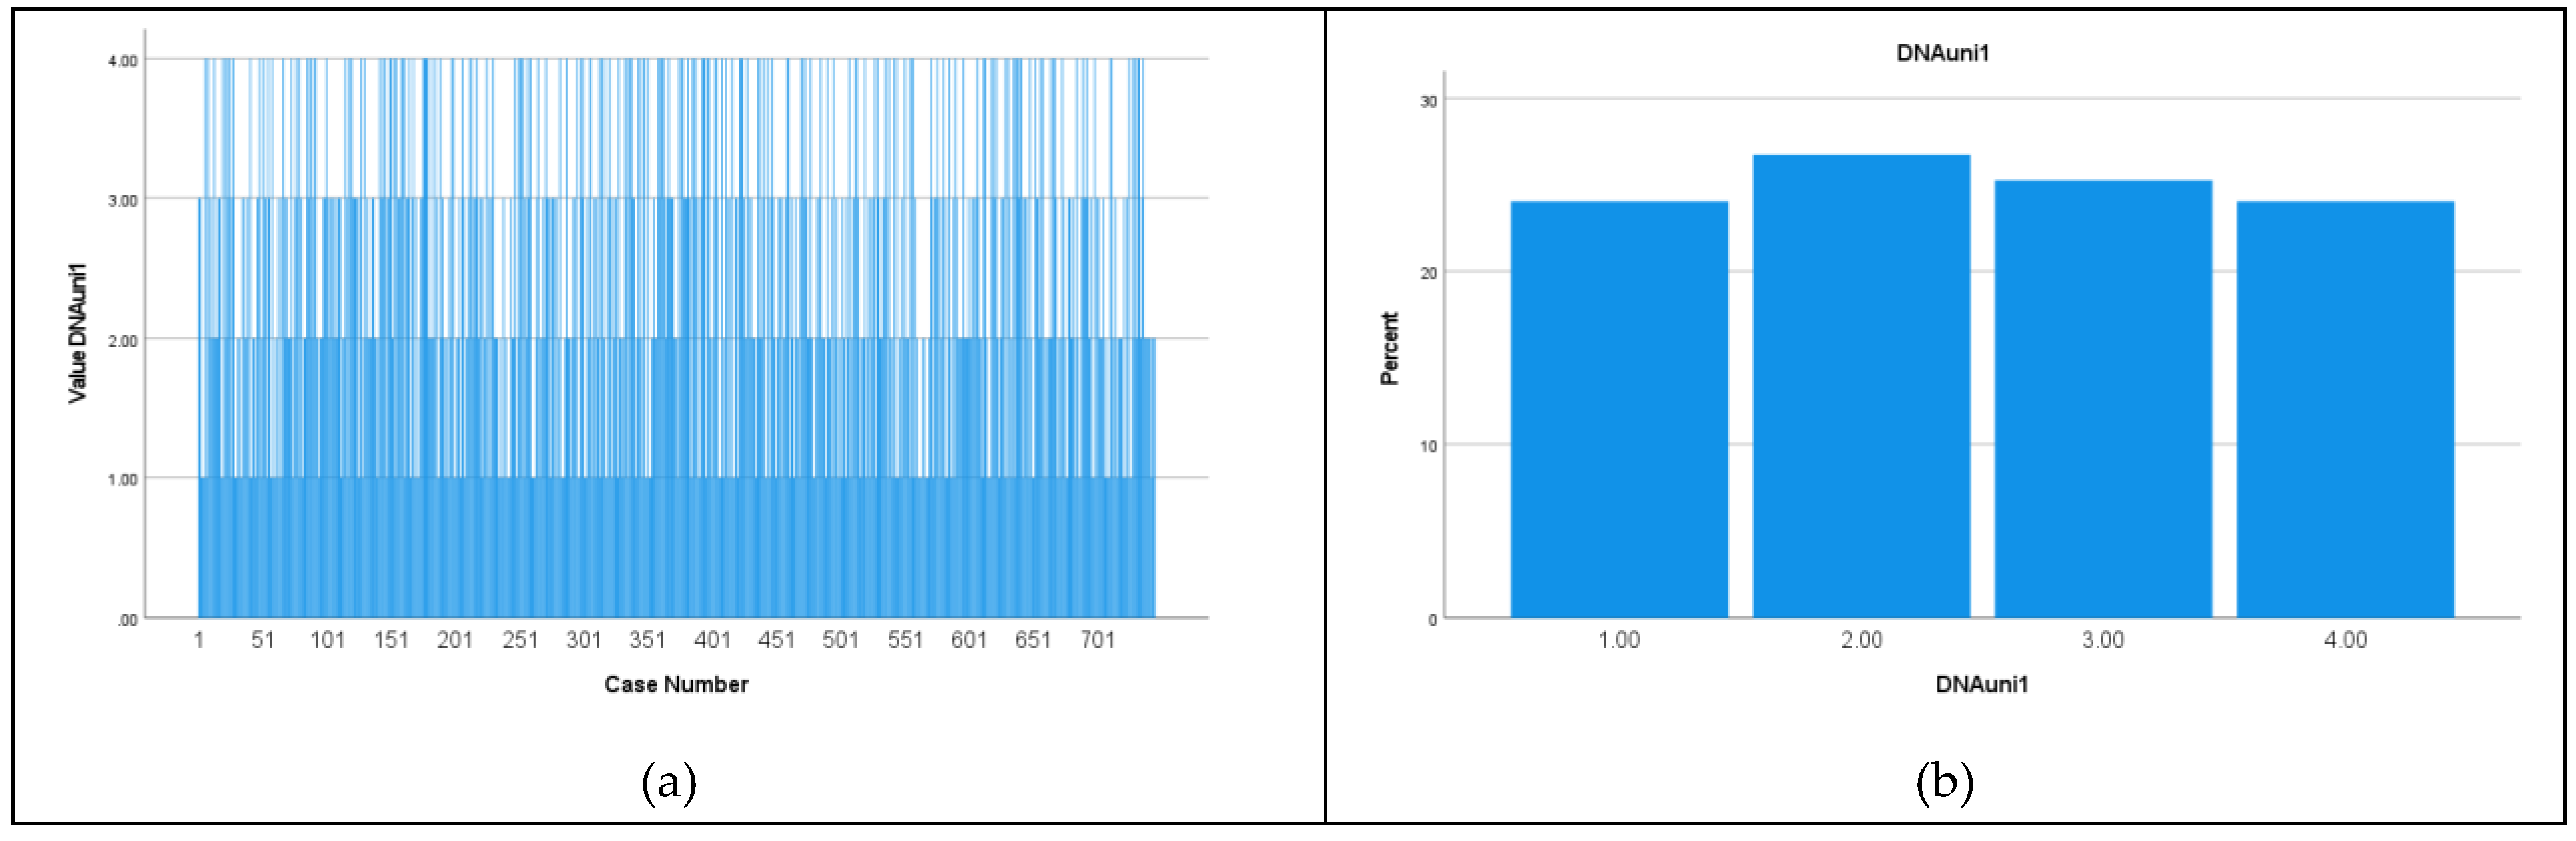
Figure 3.
Frequencies of DNA bases for both groups divided by median EnRE.
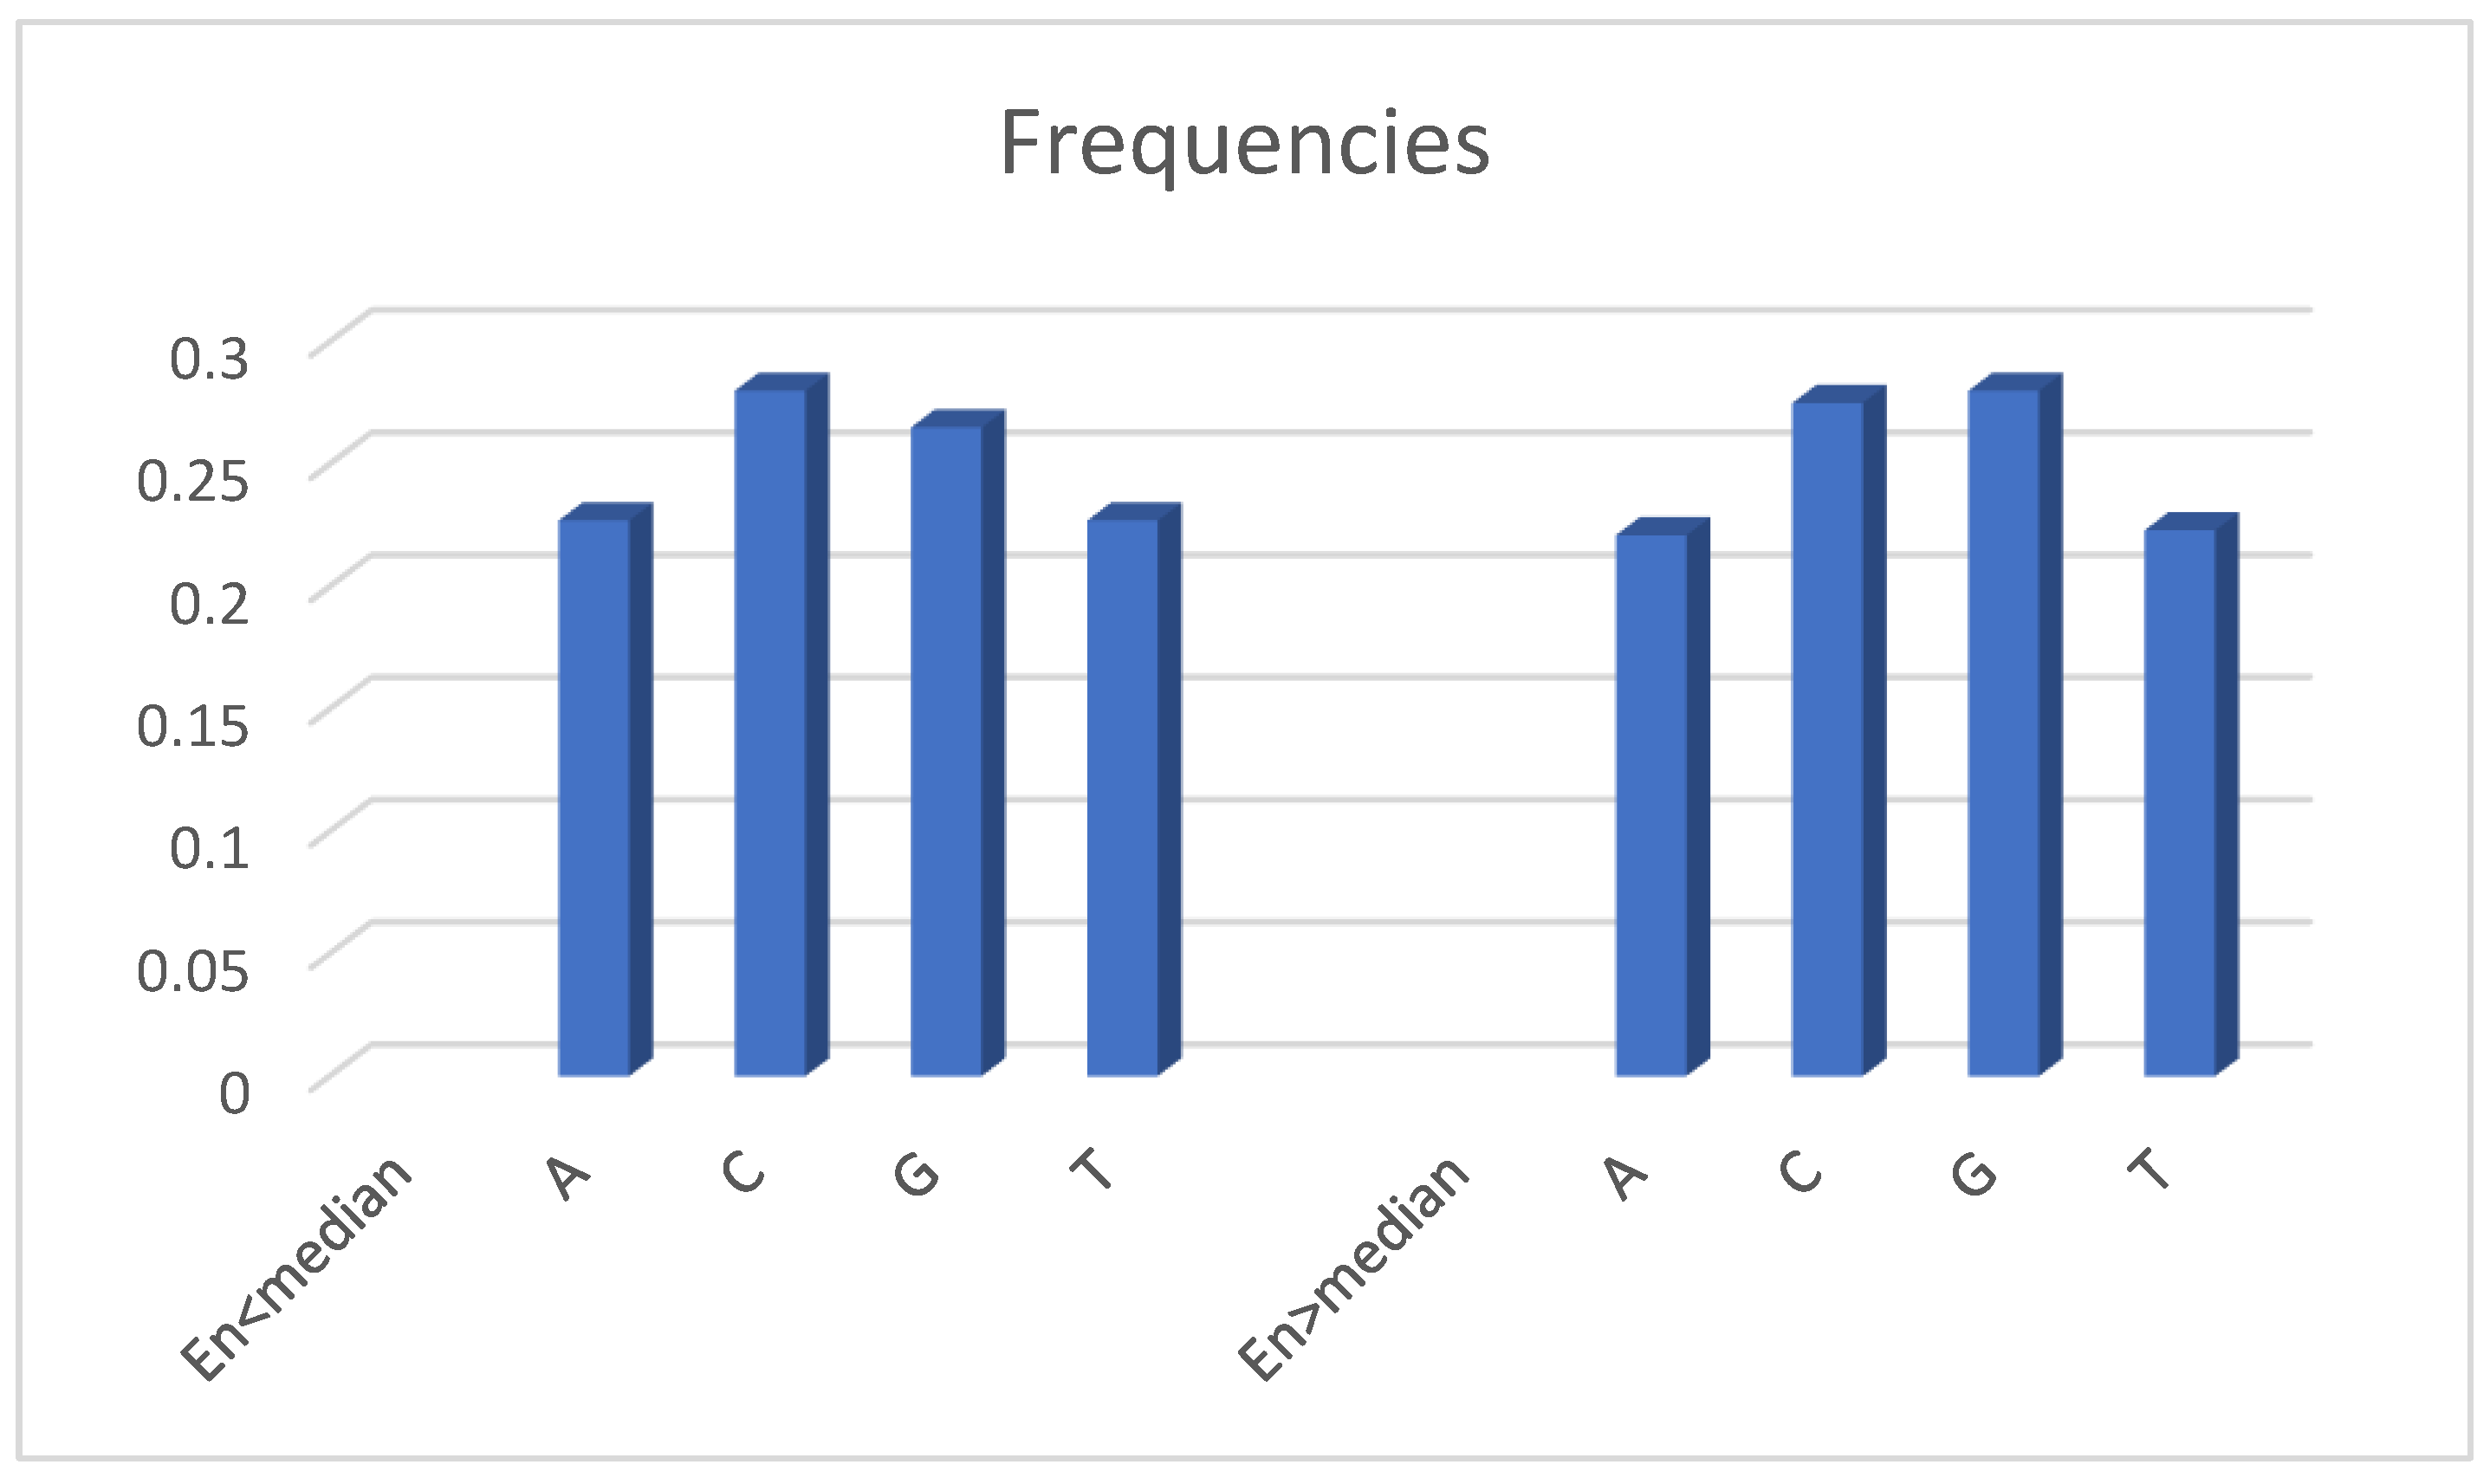
Figure 4.
Kaplan-Meier (a) and Cox Regressions survival plot (b) for median groups.
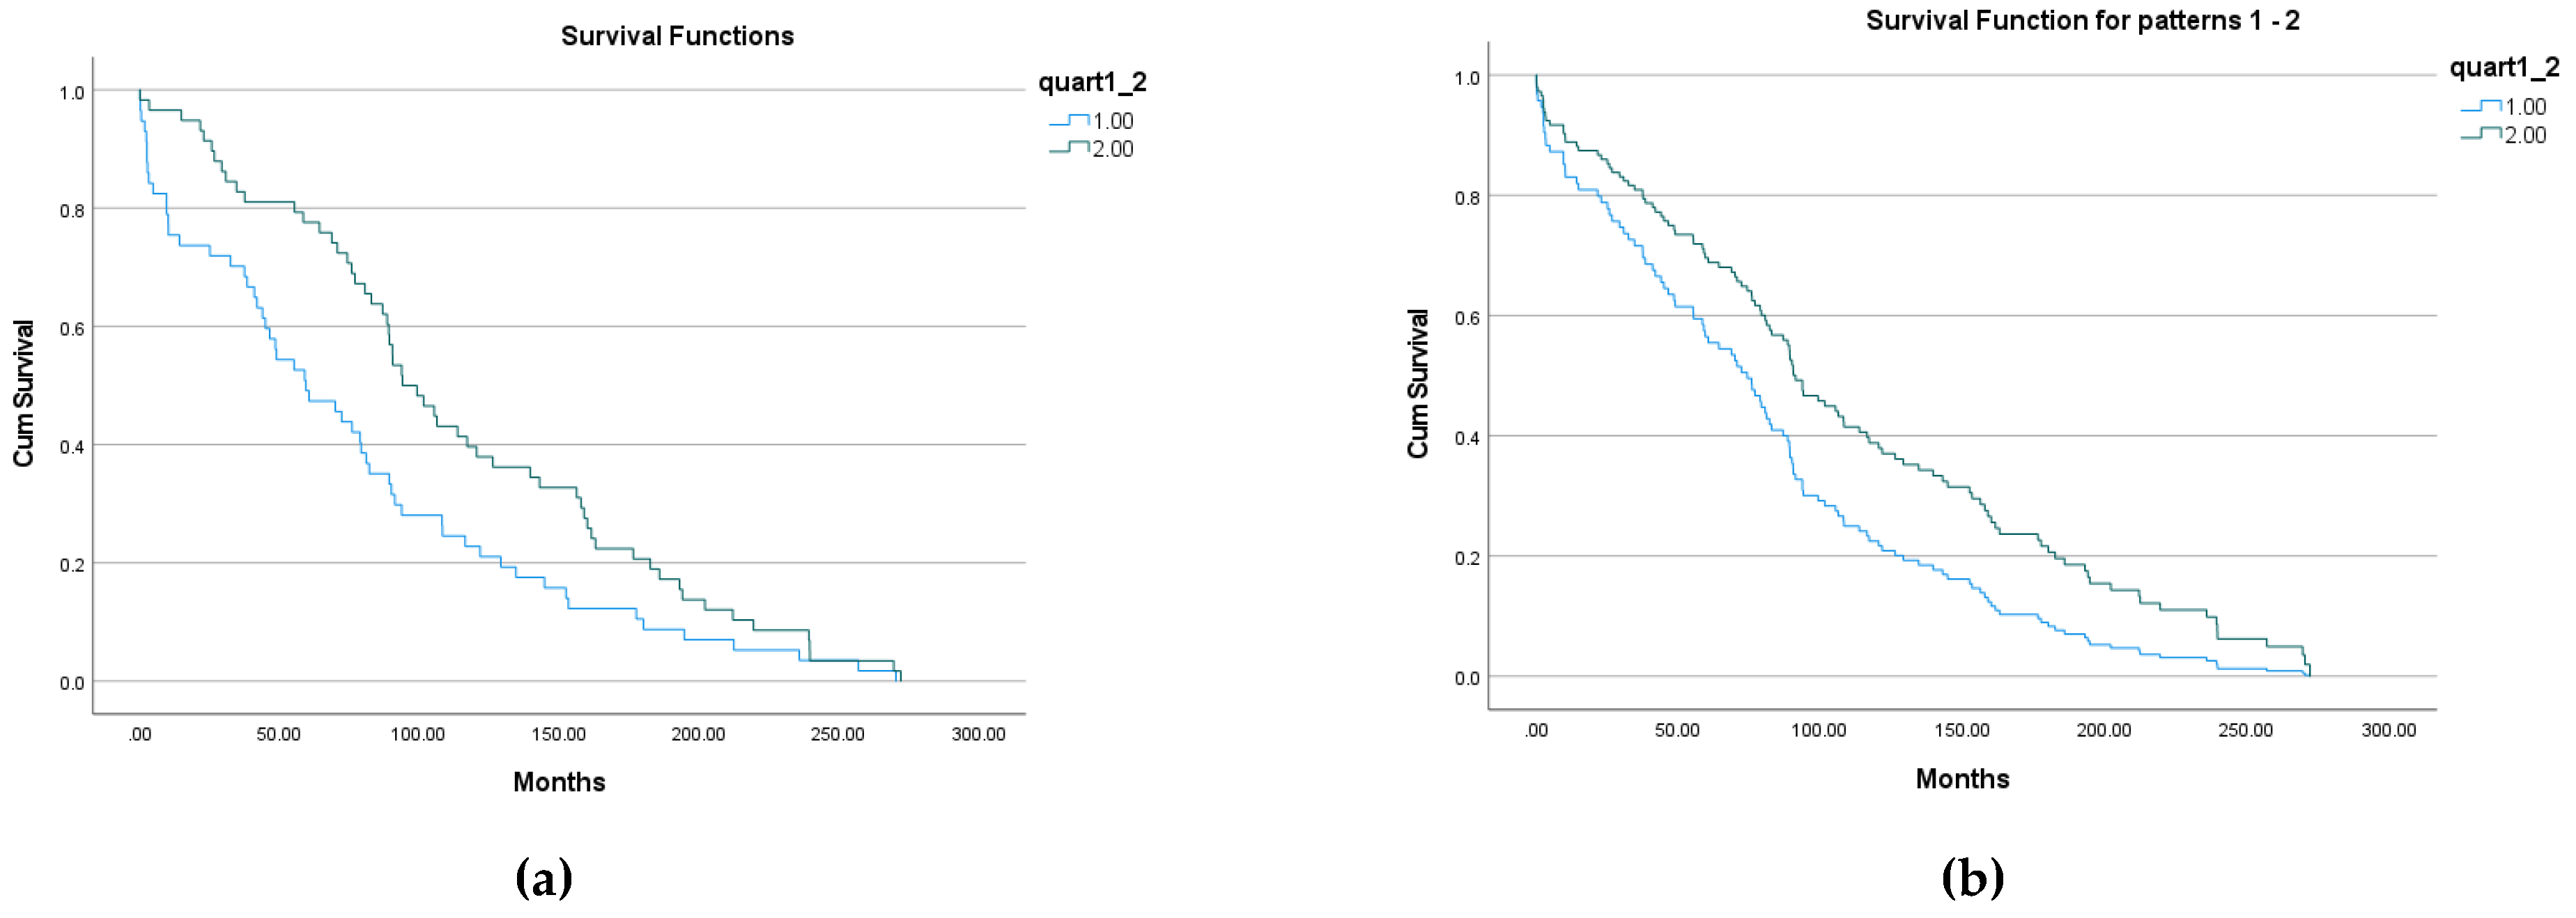
Figure 5.
Kaplan-Meier (a) and Cox Regressions survival plot (b) (1st and 4th quarterlies).
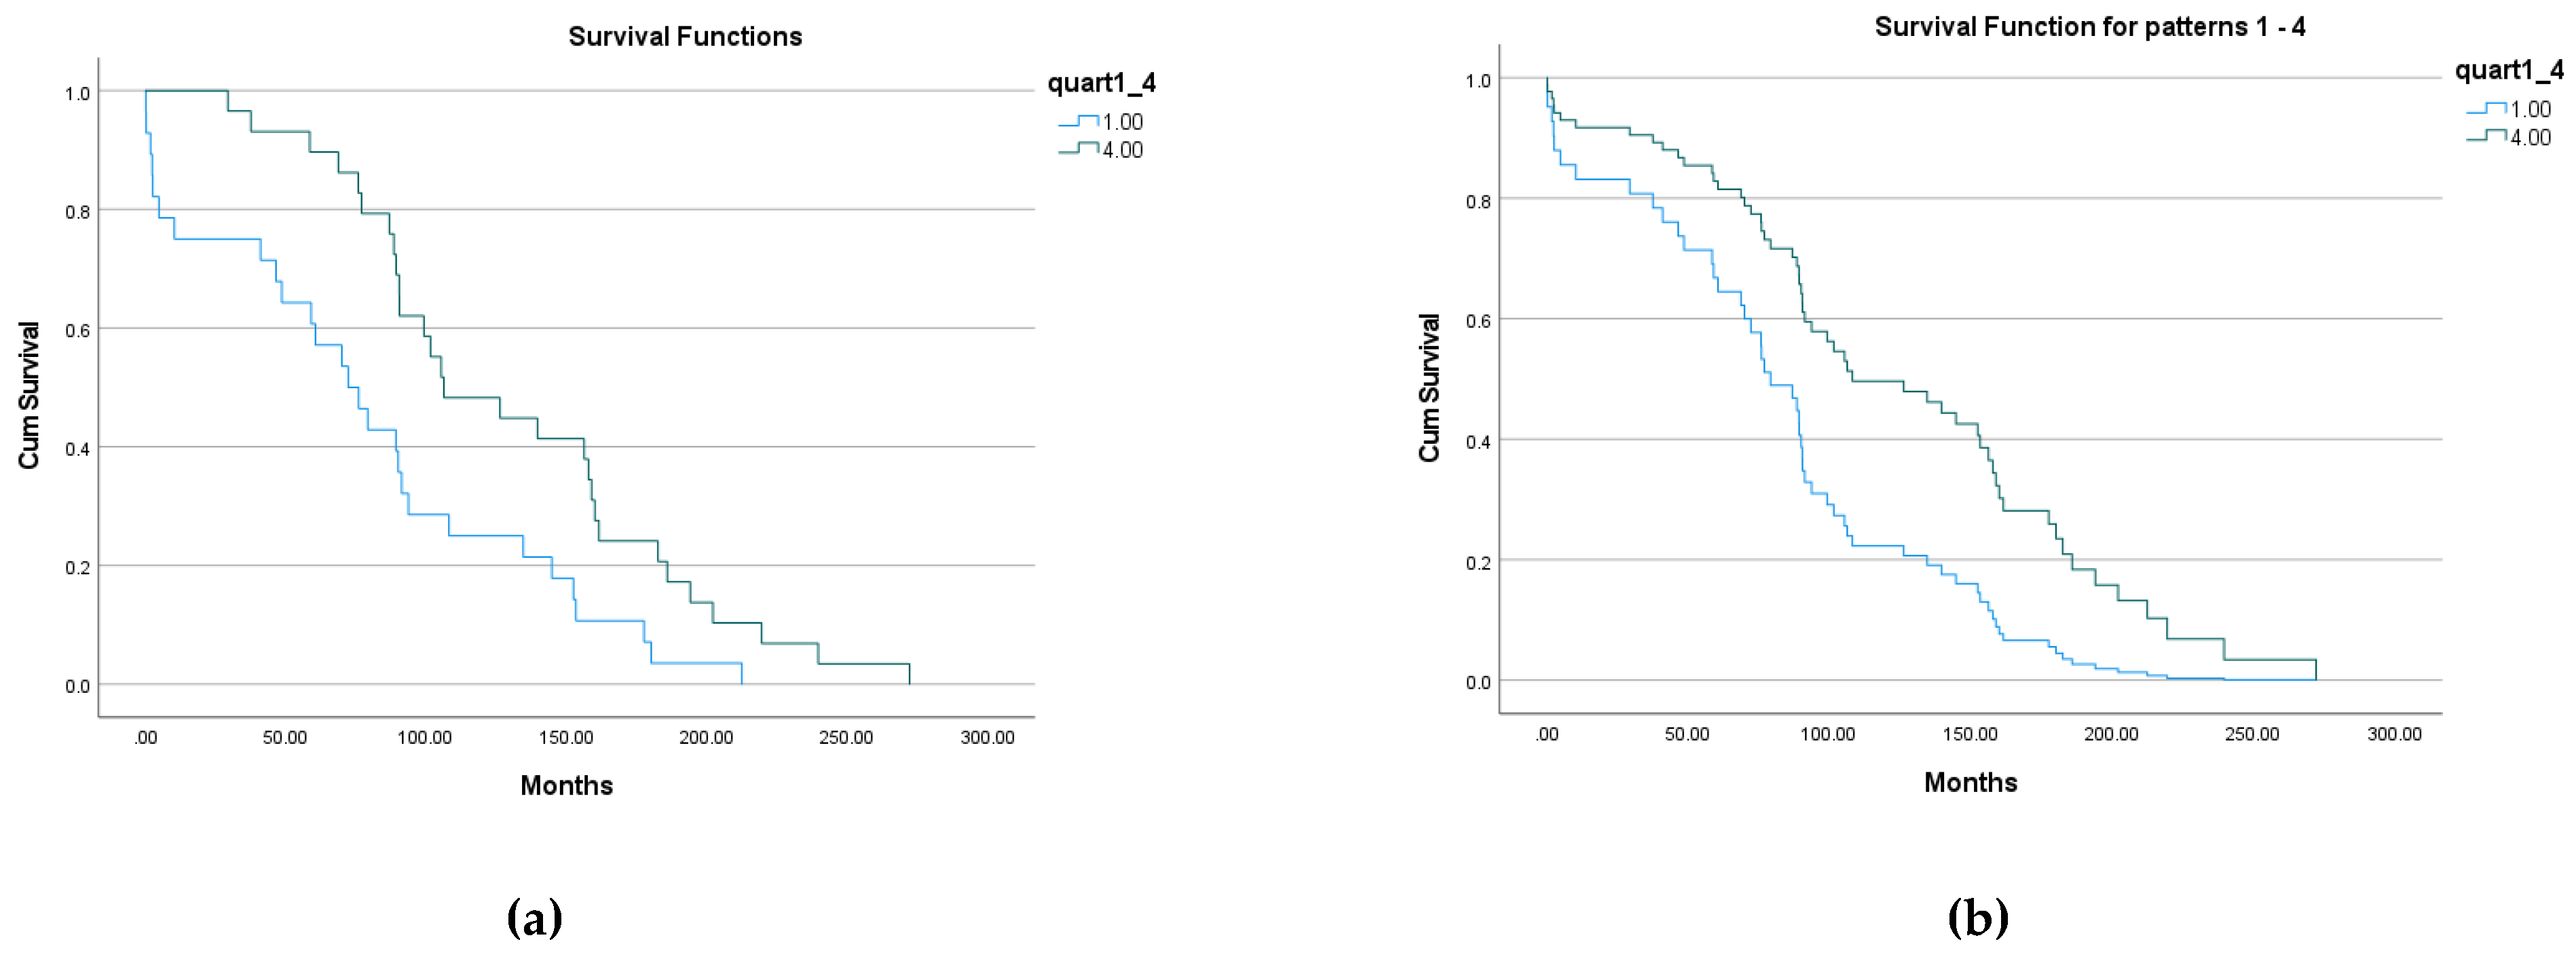
Figure 6.
2D leukemia patients separation by EnRE median and IgVH subtypes.
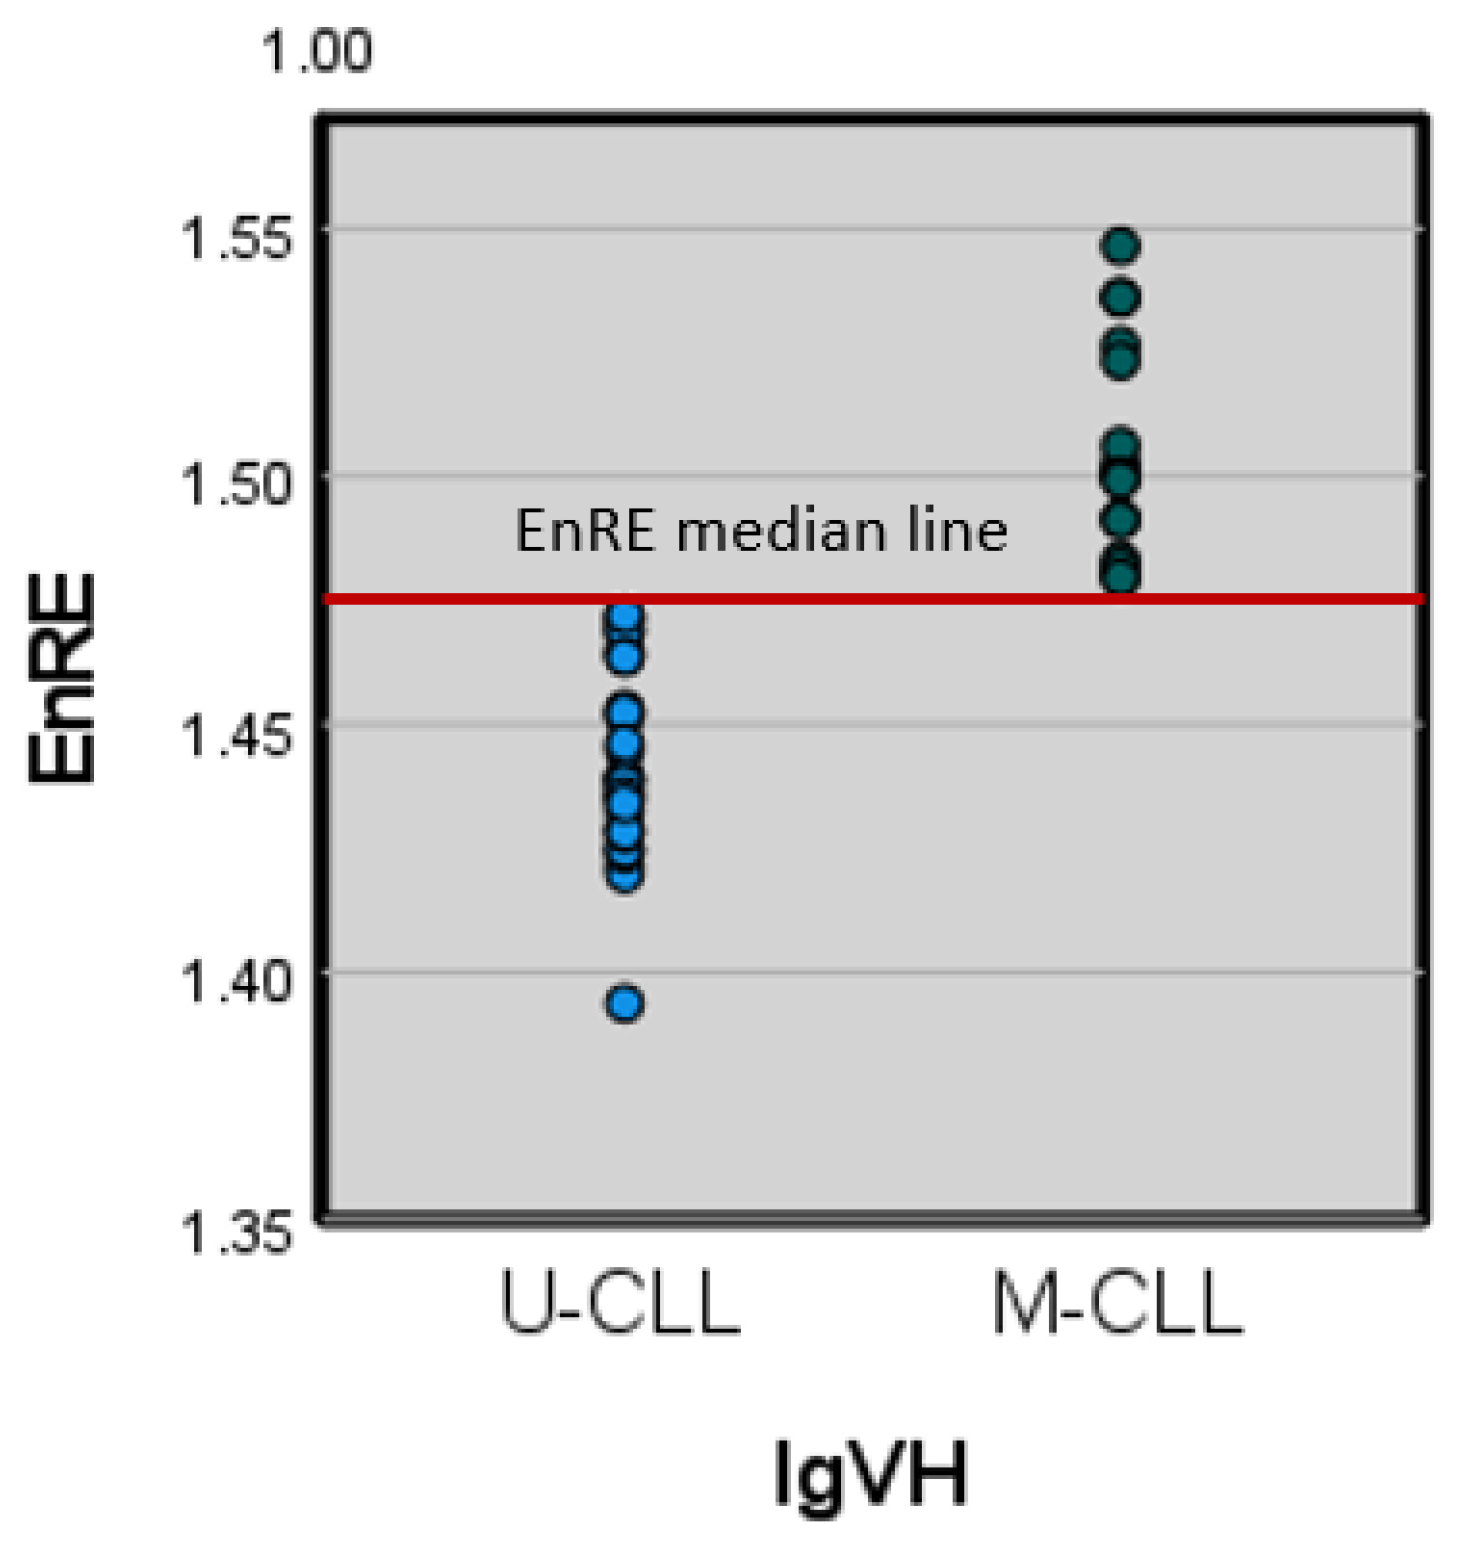
Figure 7.
Kaplan-Meier (a) and Cox Regressions survival plot (b) (combined groups).
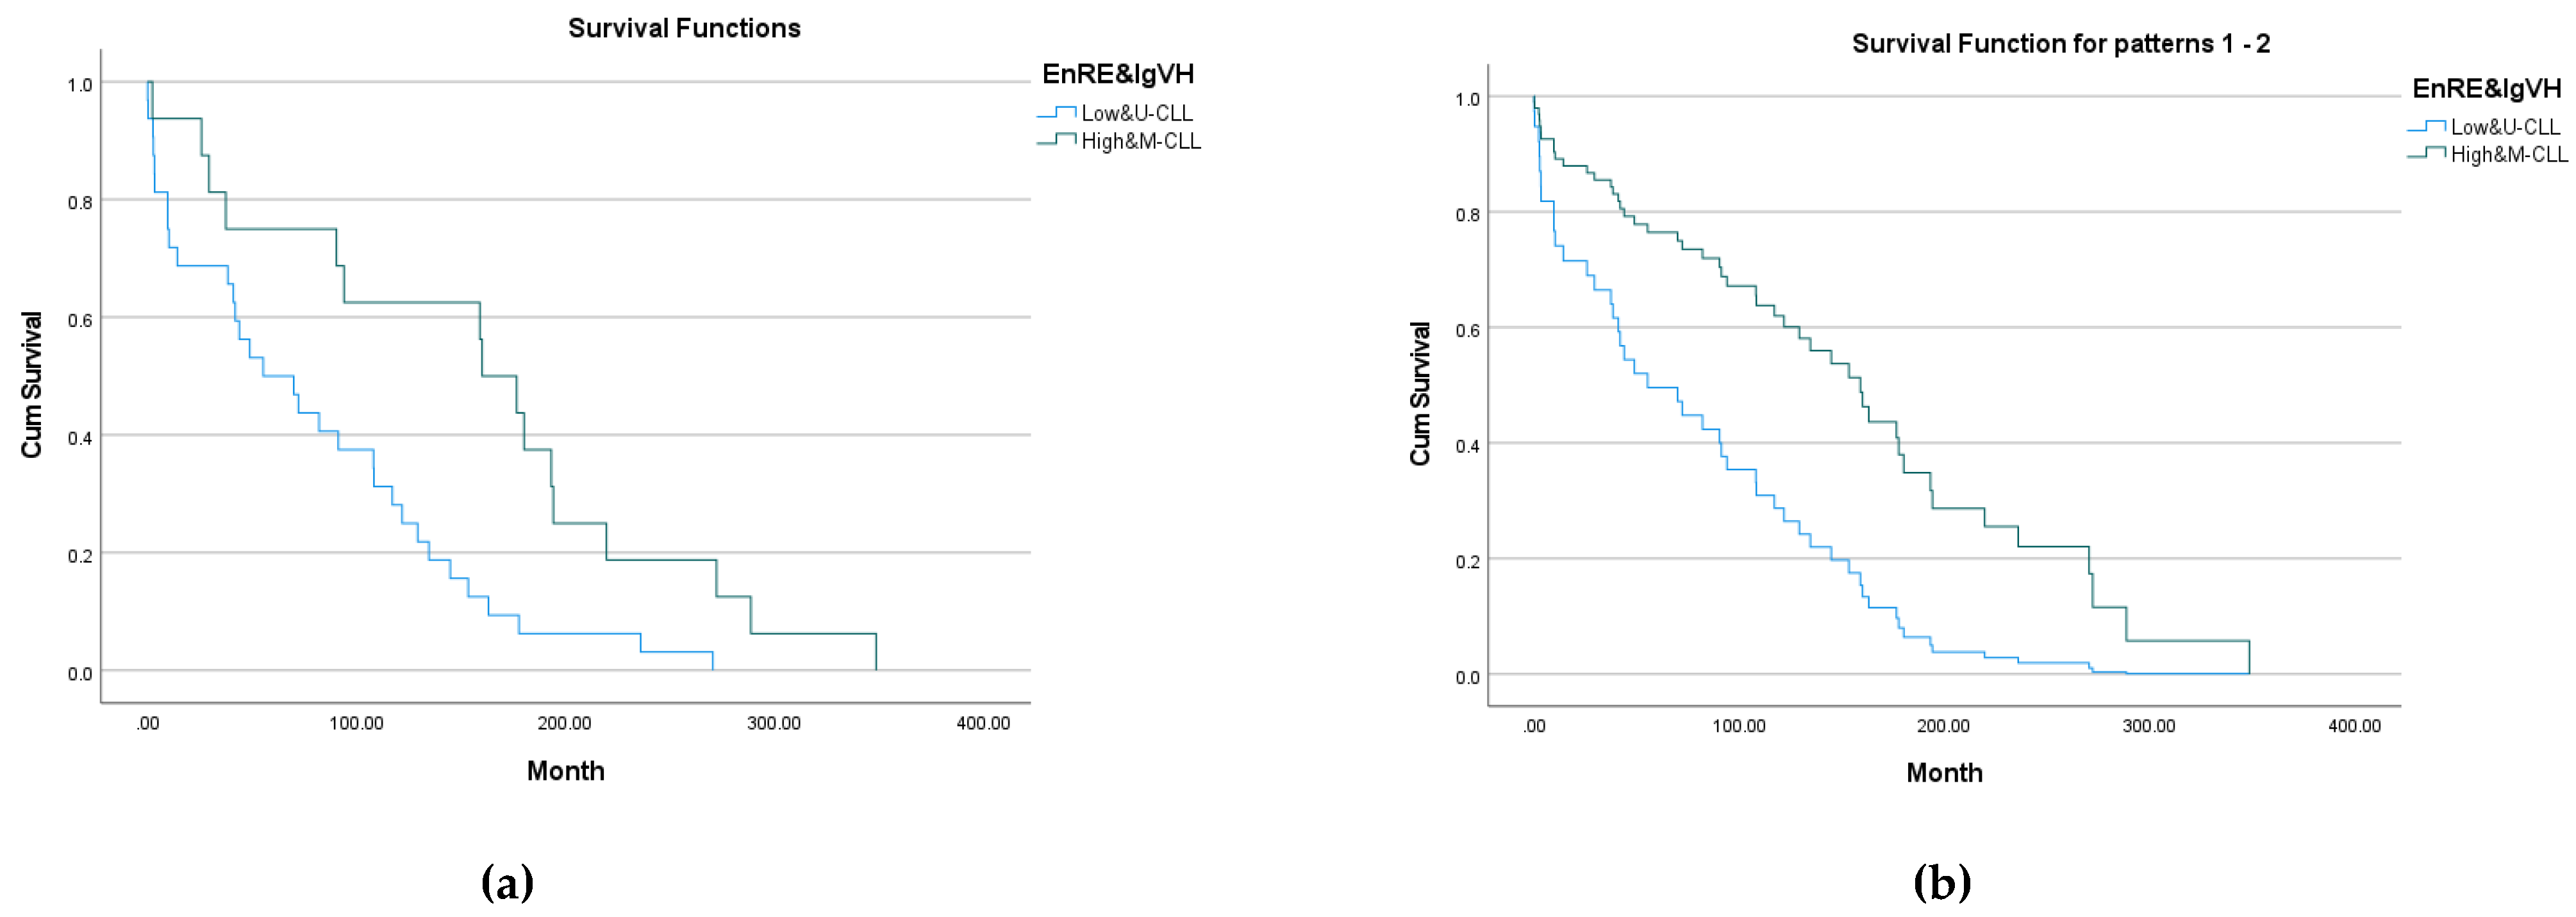
Table 3.
Numerical decoding of DNA sequences and correspondent EnRE, standard deviation and coefficient of variation of EnRE.
Table 3.
Numerical decoding of DNA sequences and correspondent EnRE, standard deviation and coefficient of variation of EnRE.
| Integer DNA code | Average Entropy EnRE | Standard deviation of EnRE | Coefficient of Variation (CV) |
|---|---|---|---|
| A=1,C=2,G=3,T=4 or A=4,C=3,G=2,T=1 | 1.205 | 0.030 | 0.025 |
| A=2,C=1,G=3,T=4 or A=3,C=4,G=1,T=2 | 1.254 | 0.036 | 0.029 |
| A=3,C=4,G=2,T=1 | 1.241 | 0.034 | 0.027 |
| A=1,C=4,G=3,T=2 | 1.235 | 0.043 | 0.035 |
| A=1,C=3,G=4,T=2 | 1.221 | 0.040 | 0.033 |
| A=1,C=3,G=2,T=4 | 1.211 | 0.033 | 0.027 |
| A=1,C=2,G=4,T=3 | 1.223 | 0.039 | 0.032 |
|
A=-2, C=-1, G=1, T=2 (reflection symmetry by modulus ) |
1.430 | 0.023 | 0.016 |
|
A=-1, C=-2, G=1, T=2 (translation symmetry by modulus) |
1.470 | 0.022 | 0.015 |
Disclaimer/Publisher’s Note: The statements, opinions and data contained in all publications are solely those of the individual author(s) and contributor(s) and not of MDPI and/or the editor(s). MDPI and/or the editor(s) disclaim responsibility for any injury to people or property resulting from any ideas, methods, instructions or products referred to in the content. |
© 2023 by the authors. Licensee MDPI, Basel, Switzerland. This article is an open access article distributed under the terms and conditions of the Creative Commons Attribution (CC BY) license (http://creativecommons.org/licenses/by/4.0/).
Copyright: This open access article is published under a Creative Commons CC BY 4.0 license, which permit the free download, distribution, and reuse, provided that the author and preprint are cited in any reuse.


