
Submitted:
14 February 2023
Posted:
16 February 2023
You are already at the latest version
Abstract
In recent years, the production of renewable energy represents one of the main challenges of modern and future society. The new cultivation method called Agrivoltaic (hereafter AV), combines and associates agricultural production and renewable energy (photovoltaic) production in a collaborative synergy from which both benefit. In this study, the dry matter and essential oils yield of six medicinal species (Salvia officinalis L., Origanum vulgare L., Rosmarinus officinalis L., Lavendula angustifolia L., Thymus citriodorus L. and Mentha spicata L.) grown underneath a dynamic AV system in comparison to those in full sun (T), were evaluated. In particular, below the dynamic AV system, due to the rotation of the panels, two plot areas on the ground were distinguished: one always covered by the panels (UP), and another one covered alternatively (BP). During the aromatic crop cycles, the solar radiation, infrared leaf temperature and air temperatures in UP, BP and T plot, were measured. In addition, at harvest time, weed survey was carried out. The results showed that, in general, the solar radiation and infrared leaf temperature were lower in UP plot than in either the BP and T plots, while the air temperatures were similar in all compared plots. Also the weed cover percentage was lower in the UP plot than other ones. The essential oils yield in the sage, thyme, mint and rosemary plants were higher in both UP and BP plots than for T plot. Thus, shading and/or less weed infestation may have been the main factors favorably influencing the performance of medicinal crops under a dynamic AV system.
Keywords:
dynamic agrivoltaic
; essential oils yield
; medicinal crops
; microclimatic factors
1. Introduction
The world demand of energy is rising mainly due to an increase of the world population and a more energy intensive industrial sector. The depletion of fossil fuel resources and the harmful effects of burning them for energy such as climate change (Sadeghi, 2022) [1] has prompted the development of renewable and clean sources of energy such as solar energy.
Worldwide, photovoltaic energy has grown exponentially thanks to the integration of photovoltaic panels on existing buildings but also by occupying agricultural land. Initially they were the photovoltaic fields: more or less vast expanses of solar panels on the ground, that in fact subtracted land for agriculture or grazing (Nonhebel, 2005) [2]. But, in recent years, research has produced a new form of combination between photovoltaics and agriculture, called agrivoltaic (AV) (or agrovoltaic, or agrophotovoltaic), in which the solar collectors are placed at a height of 2-5 meters above the ground, creating a virtuous synergy between energy and agricultural production (Agostini et al., 2021) [3]. The concept of the AV was initially proposed in the1982 by Goetzberger and Zastrow [4], but it took about three decades until this concept was implemented in various projects and pilot plants worldwide (Weselek et al., 2019) [5].
Over time, the technical characteristics of AV systems have been improved by passing from the application of fixed photovoltaic modules (vertical, horizontal, inclined) to dynamic ones (single and biaxial tracking systems), optimizing electricity generation and also increasing solar radiation at plant level compared to fixed modules (Valle et al., 2017) [6]. With 1-axial tracking photovoltaics, the modules track the sun horizontally according to the angle of incidence (elevation) or vertically according to the orbit of the sun (azimuth). Biaxial trackers do both while maximizing energy yield.
Although the AV technology is increasingly being applied all over the world, there is very little accompanying scientific research to examine its impacts on agronomic parameters, such as crop performance and crop yields (Lee et al., 2022) [7]. Some studies (Marrou et al., 2013a and b, Ravi et al., 2016, Amaducci et al., 2018) [8,9,10,11] indicate that the presence of the photovoltaic panels creates, especially in semi-arid and arid regions, a microclimate (temperature and humidity) favorable for plant growth, which can improve the performance of some crops that often suffer from the adverse effects of high solar radiation and concomitant water losses. Indeed, AV systems can bring various synergistic effects such as the reduction of global radiation on crops, benefiting production and greater water savings thanks to the reduction of evapotranspiration and the negative effects of excessive radiation. In this context, however, the impact of AV has so far been studied for a small number of crops. In a field experiment (Marrou et al., 2013c) [12] yields of different lettuce varieties grown underneath a AV ranged from 81 to 99% of control values in full sun, with some varieties even exceeding control values. In another experiment (Schindelea et al., 2020) [13] the potato tuber yield was decreased by 38.2% in crops grown under APV compared to the conventional potato tuber yield. Lee et al. (2022) [7] reported that the potato yield was similar in the AV system and the control plot, on the other hand, the yields of sesame, soybean, and rice crops were 19%, 18–20%, and 13–30% lower than those grown in the control plot, respectively. The reduction of light resources (ranged from 25–32%) underneath the AV systems could be directly responsible for the slower growth and development of crop plants in the shade.
Also in previous studies, showed that artificial shade conditions reduced yields in maize and potatoes (Midmore et al.,1988, Kuruppuarachchi et al., 1990) [14,15]. Some plant species are able to grow at low light conditions (termed shade plants). They have low light compensation and saturation points. However, most plants can adapt to a range of low light conditions, inducing physiological and morphological changes in plants exposed to such conditions. In general, low light intensities induce stem elongation to overcome the shade conditions. Leaves of shaded plants increase their size and reduce their thickness and have a higher chlorophyll concentration (Ferrante and Marian. 2018) [16]. Thus, the effects of shading must be considered when exploring potential AV conditions. In this regard, the cultivation of agricultural species underneath photovoltaic panels is possible using species that tolerate partial shading or that can take advantage of it. For example, strong lighting increases the accumulation of reserve substances, favors flowering and is suitable for potatoes, beets, cereals and fruit plants, while modest light availability is favorable for lengthening the vegetative parts of plants and, therefore, suitable for crops cultivated for the production of leaves and stems (Giardini, 1992) [17]. The latter could be the case of medicinal plants, that could be very suitable for cultivation under a partially shaded AV system. Among the medicinal plants, an extremely interesting group of plants, capable of offering natural substances and raw materials of high quality value, is represented by the Lamiaceae. Most of them are used as parts of plants (stems, leaves, flowers) fresh or dried (called drug) from which to extract essential oil. Therefore, the choice of medicinal herbs grown in this study fell on: sage, oregano, rosemary, lavender and thyme. Their role in recent years, in fact, has assumed increasingly diversified aspects, linked to the emergence of needs and opportunities that have promoted their development both in terms of business areas, and of new agricultural enterprises operating in this sector.
Italy, with 6,000 active companies and 24,000 hectares of cultivated land, is the 4th country in the EU in terms of Pamc surfaces (medicinal aromatic plants and condiments), after Poland, Bulgaria and France (IiSole24Ore, 2020)
Medicinal aromatic plants and condiments develop a market of enormous interest for Italy which produces 25 million kilos in over 6,000 companies involved and more than 24,000 cultivated hectares (with a 110% growth in three years), covering only 70 % of the entire national requirement.
It is estimated that the use of medicinal products amounts to a value at the wholesale stage of around 115 million euro. The potential volumes of use for an Italian production would amount to almost 18 thousand tons, equal to 73% of the total.
The sector records double-digit growth rates, managing to fully grasp the new requests that come both from the consumer side, such as greater attention to well-being, and from the side of community policies, which provide for the protection of biodiversity, sustainability, multifunctionality, as well as of course to represent a very promising market opportunity for farmers.
The best-selling products are parsley, basil, sage, rosemary, mint and wild fennel. Instead those that show the most interesting dynamics are coriander, chives, thyme and chilli pepper. In Italian organized distribution, aromatic herbs are considered a service product to complete the fruit and vegetable department and have a more limited range than in large-scale foreign distribution chains.
Given the total lack of studies on the AV cultivation of medicinal plants, the aim of this work is to evaluated the yield qualitative characteristics of six medicinal species (Salvia officinalis L., Origanum vulgare L., Rosmarinus officinalis L., Lavandula angustifolia L., Thymus citriodorus L. and Mentha spicata L.) underneath a dynamic AV system, compared with the same crops in the full sun.
2. Materials and methods
2.1. The dynamic Agrivoltaic system
The dynamic Agrivoltaic system used in this study is the single-axis tracking photovoltaics, built on suspended structures (stilts). On the stilts are mounted horizontal main axis, on which secondary axis holding the solar panels are hinged.
The dynamic Agrivoltaic system (Figure 1) consisting of photovoltaic solar panels (positioned 2,50 m above the crops) that can rotate in an angle of +/- 50° to adjust the level of shading.
Solar tracking system managed by an electronic unit that allows the panels to always be oriented towards the sun and avoid that they shade each other. This mechanism maximizes the photovoltaic yield and improves the availability of light.
The support structures, made of metallic material, have been arranged in a North-South direction in parallel rows and appropriately spaced apart to reduce the effects of shadows. The panels rotate on the axis from East to West, following the daily trend of Sun. The maximum angle of rotation of the modules is about 55°, while the height of the axis of rotation from the ground is equal to 2.50 m. The minimum free space between the takers, when these are arranged parallel to the ground (i.e. at midday), is 4.166 m; while when the inclination of the modules is approximately 45° the minimum height is 0.80 m.
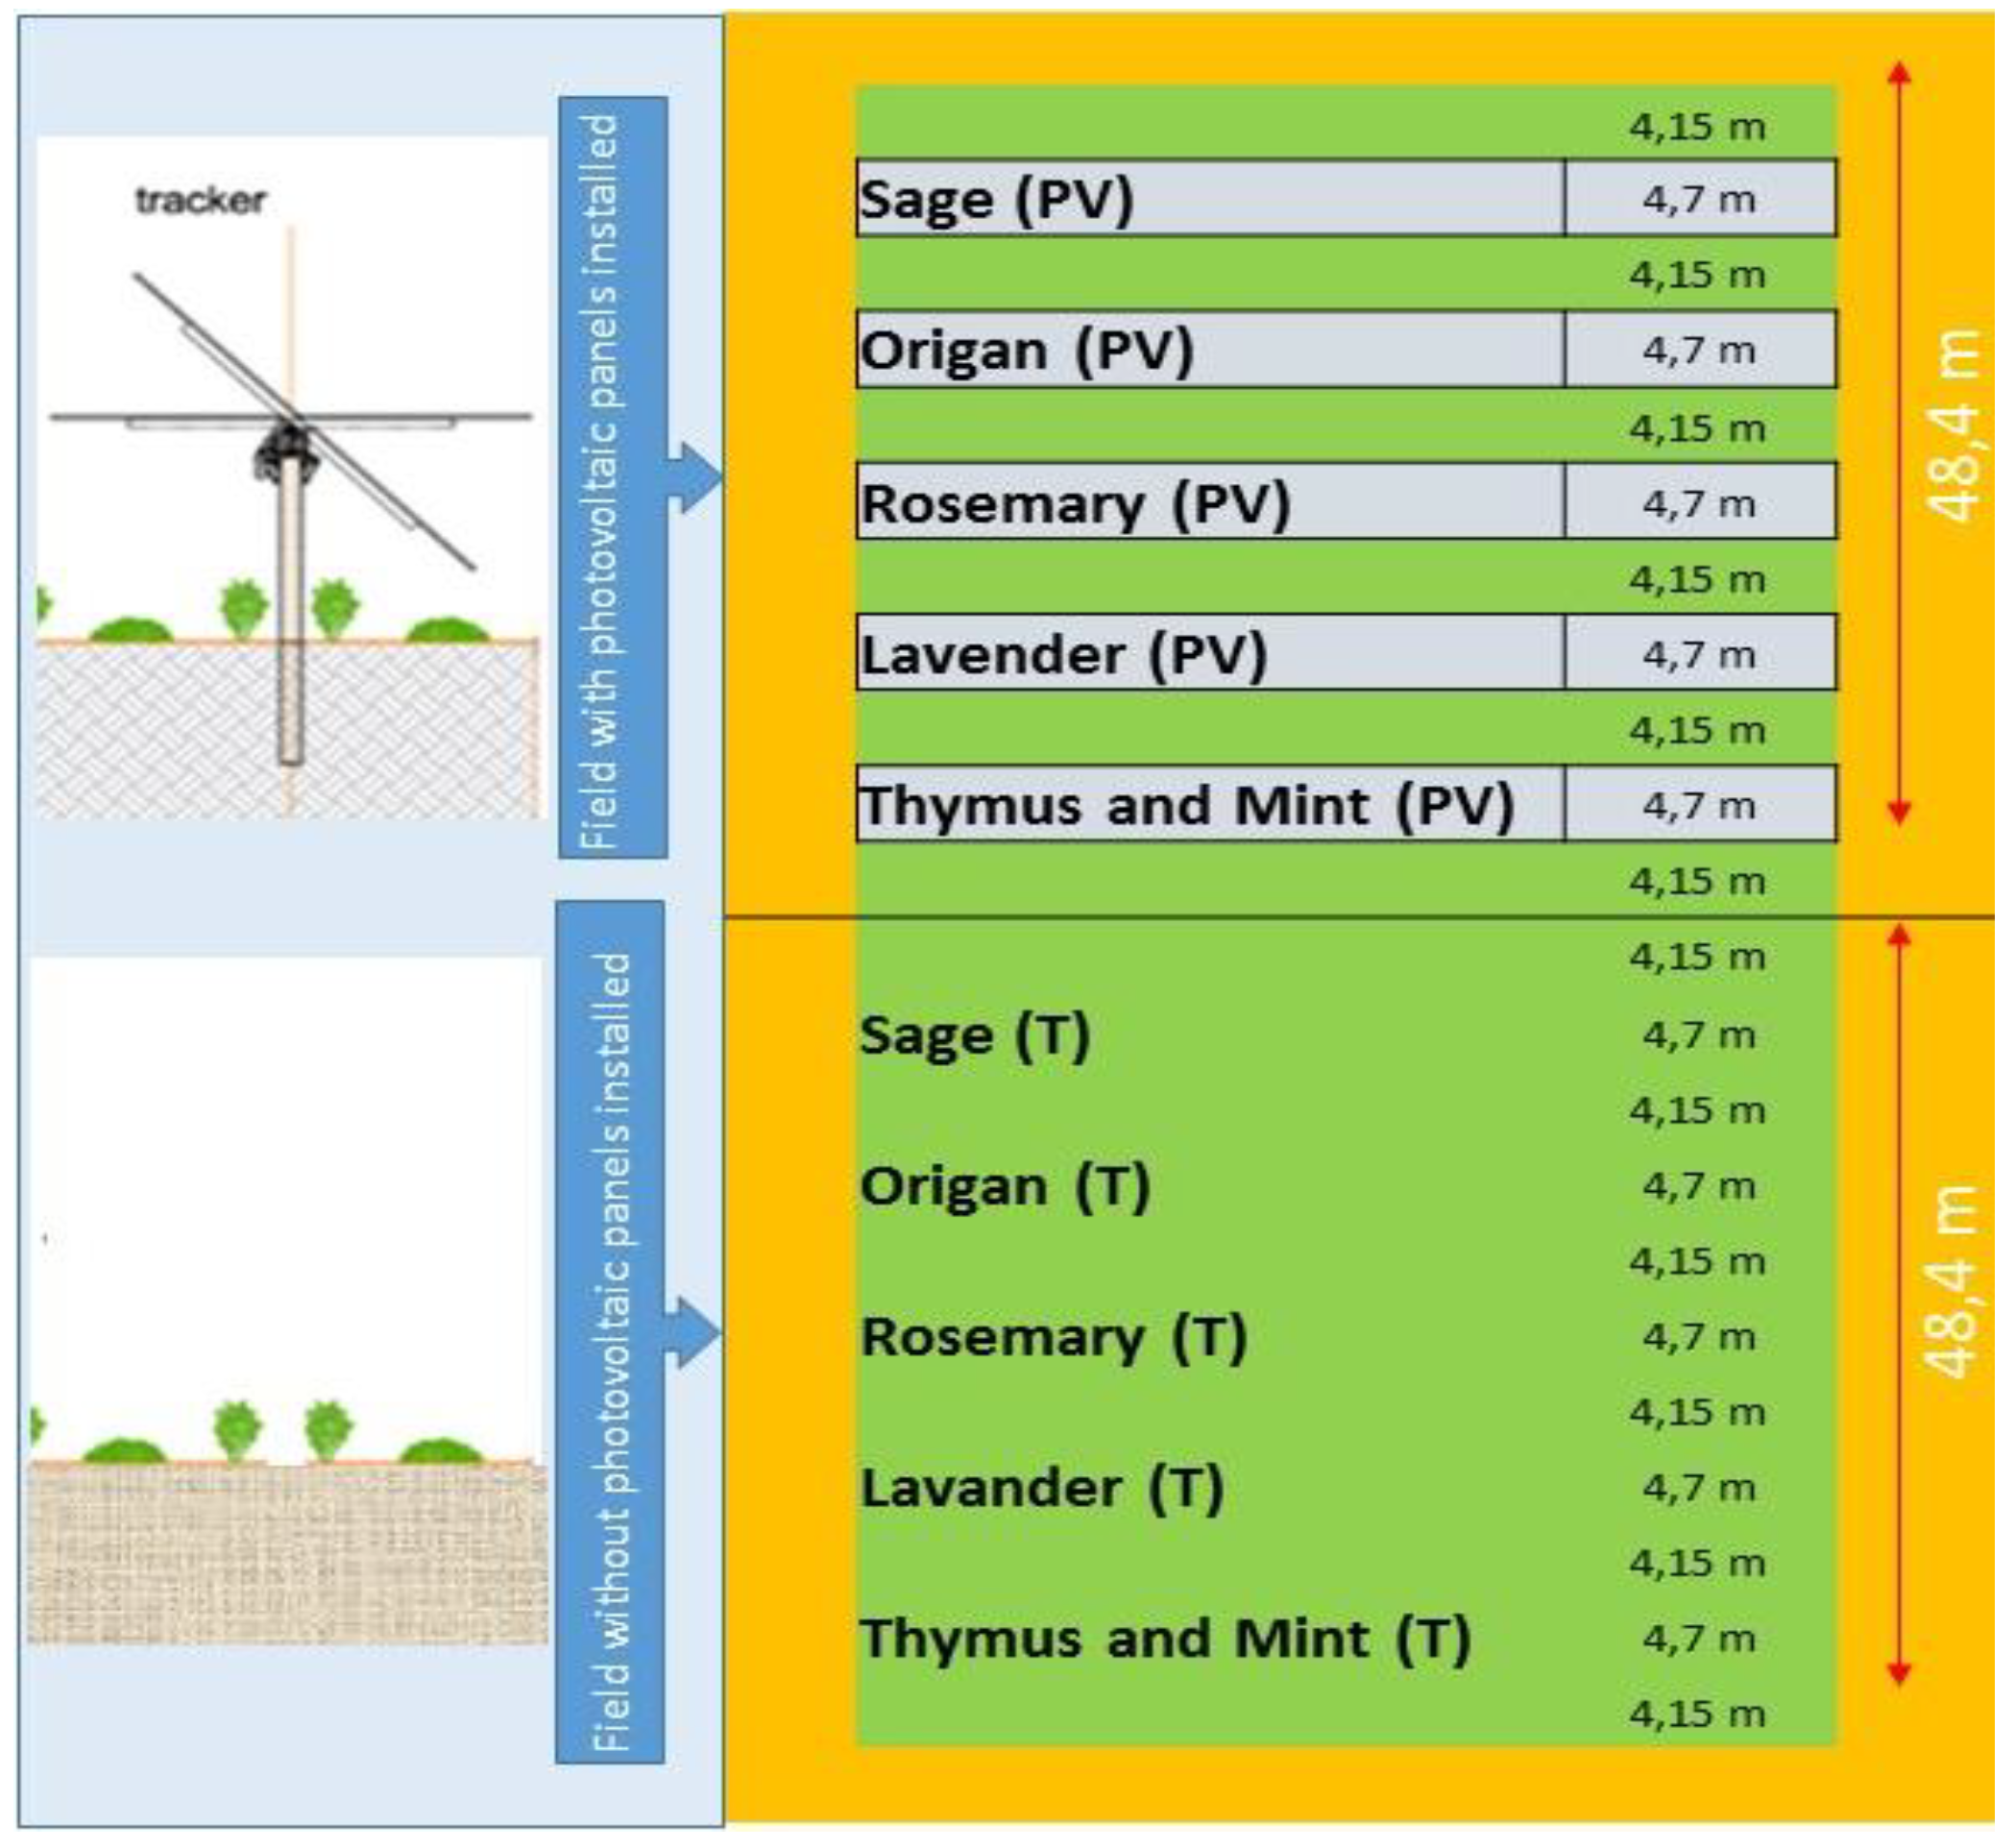
Below the dynamic agrivoltaic system, following the rotation of the solar panels, on the soil surface, two zones were distinguished: one in which it is always in the shade (indicated as UP plot), and the other in which it is alternately in the shade (indicated as BP plot). The aromatic crops grown in these two plots were compared with those grown in full sun (indicated as T plot).
2.2. Field experiment
The field experiment was carried out during 2022 season, at the countryside of San Severo (Foggia province, Apulia region, Southern Italy). The site of the research was in a typical semi-arid zone, characterized by a Mediterranean climate, classified as an “accentuated thermomediterranean” (UNESCO/FAO, 1963) [18], with temperature that may fall below 0 °C in winter and exceed 40 °C in summer. Rainfall is unevenly distributed throughout the year and is mostly concentrated in the winter months with a long- term annual average of 559 mm (Ventrella et al. 2012) [19].
The study was designed by the Department of Agriculture, Food, Natural resources and Engineering (DAFNE), University of Foggia and M2 Energia S.r.l., on 6 medicinal and aromatic crops: sage (Salvia officinalis var. latifolia L.), oregano (Origanum vulgar L.), rosemary (Rosmarinus officinalis L.), lavender (Lavandula angustifolia L.), thyme (Thymus citriodorus L.) and mint (Mentha spicata L.). The experimental trial included the compared aromatic crops grown among the UP, BP and T plots. The soil texture was clay-loam (USDA classification) [20], with an effective depth over 120 cm, and vertisol of alluvional origin having the following characteristics: sand = 38.6%, loam = 22.4%, clay= 39,0%; total N (Kjeldahl) = 2.7 ‰, assimilable P2O5 (Olsen) = 58 ppm; exchangeable K2O (Schollemberger) = 539 ppm; Ca exchangeable = 2928 ppm; Mg exchangeable = 317 ppm; Na exchangeable = 34 ppm; ratio C/N = 5:2; electrical conductivity (ECe) = 0,63 dS cm−1; pH (in water) = 8.1; organic matter (Walkley and Black) = 2.5%. The tillage system was: 40 cm plowing depth and two treatments with disk harrow.
Figure 2.
Dynamic agrivoltaic system in San Severo (FG).
Before the transplanting the aromatic plants, the soil was plowed to a depth of 40 cm and refined with two treatments with a disc harrow.
The field experimental trial was carried out on 30x115 m surface (3450 m2): half underneath the AV system and the other in a full sun adjacent area.
Each medicinal crop was transplanted, in continuous plant rows, 1x1m apart, on May 2022. During the growing season, drip irrigation and standard agronomic practices were applied. All the crops were harvested by hand in the balsamic phase (in July 2022). At harvest, the fresh leaves of each aromatic plants were collected, dried in an oven at 30°C, mixed for homogenization and used for essential oils (EOs) extractions by distillation for 2 hours in a current stream. The EOs yields (% of dry matter yield) were determined. EOs were isolated by direct steam distillation using a 62 L steel extractor apparatus (Albrigi Luigi EO 131, Verona, Italy). With this type of steam distillation apparatus, the remaining water (a by-product), called floral water or hydrosol, can be recycled after condensation, thereby limiting the process duration. The EOs were stored in hermetically-sealed dark-glass containers and kept in rooms at 5–6 °C.
2.3. Microclimatic condition and Floristic surveys
During the crop cycles of each aromatic crop, every 15 days, the solar radiation (W m2), air temperature (°C) and infrared leaf temperature (°C) in UP, BP and T plots at the hottest hours of the day (between 12 and 14), were measured. They were taken manually with solar power meter (TES, Taiwan), thermometer (TorAnn S.A.S Strumenti, Italy) and infrared thermometer (TorAnn S.A.S Strumenti, Italy), respectively. Moreover, the weed survey was carried out at harvest time. The infestation of the different weed species was manifested by the weed ground cover percentage (WGC %). The WGC % was rated visually for each weed species, according to the Braun-Blanquet (1964) cover abundance-dominance method, by assigning to each species a value ranging from 1 to 5, based on the proportion of the plot area covered. Classes of presence and abundance were transformed in cover percentage using the following scale: 0 = absent; 1 = 1–4%; 2 = 5–24%; 3 = 25–49%; 4 = 50–74%; 5 = 75–100%.
Each microclimatic parameters measurement and the floristic survey were replicated three times.
2.4. Statistical analysis
The results were evaluated with one-way analysis of variance (ANOVA) using JMP software (SAS Institute Inc., Cary, NC, USA) and average values were compared with Tukey's test. p values < 0.05 were considered significant.
3. Results and discussion
3.1. Microclimatic and weed survey
First of all, it should be noted that the measurements of solar radiation, air temperature, infrared leaf temperature and weed survey did not provide any significant difference between the aromatic specie, in each of the UP, BP and T plots. Therefore, the data presented are the average values of different species compared.
Solar radiation
The average solar radiation values, in the UP, BP and T plots, are reported in Figure 3. In each date, as was to be expected, the values were significantly lower in the UP plot (ranging from 25 and 50 Wm2) than in either the BP and T plots, which they were not statistically different from each other (ranging between1025 and 1228 Wm2).
Air temperature
The average air temperature (Figure 4) monitored during the season, it showed significant differences among the different days (passing from 28.5 to 37.8 °C). On the other hand, in each day, no statistical differences among the UP, BP and T plots were observed.
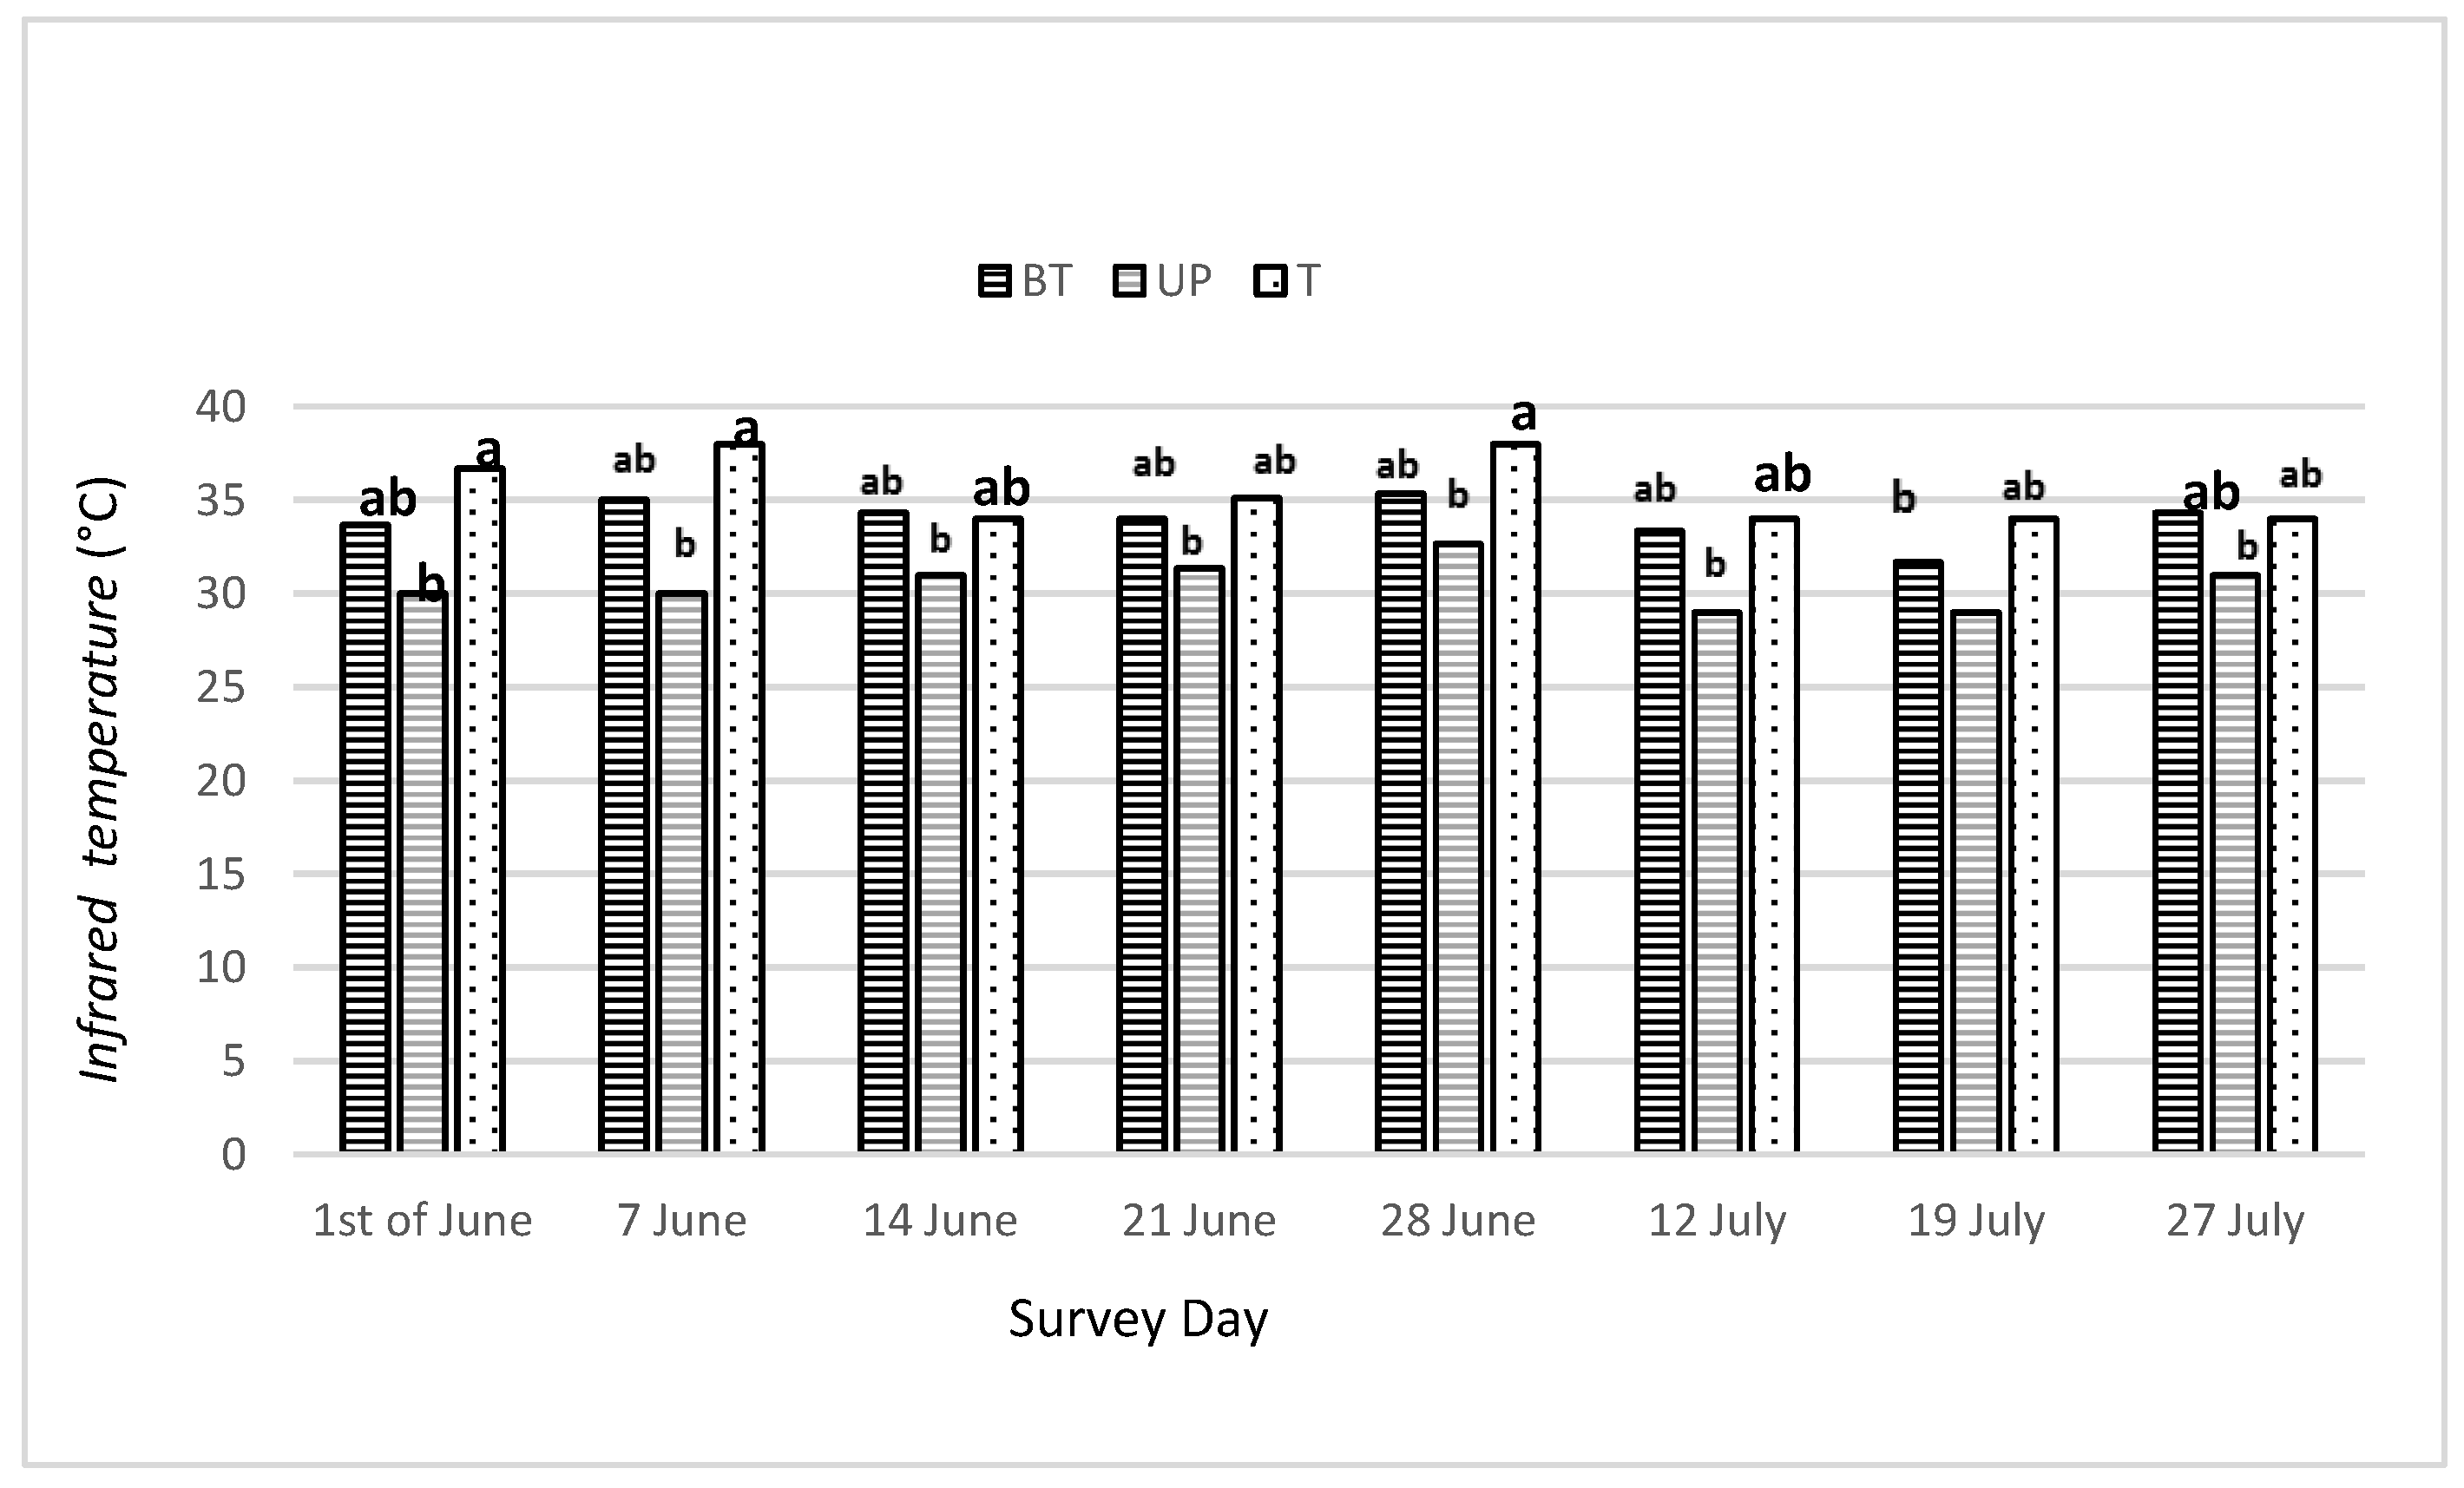
Infrared temperature
The average infrared foliar temperature, recorded at noon during the season in the UP, BP and T plots, are reported in Figure 3. On each date, the crop for the UP plot showed the lowest values (between 28.1 and 32.2 °C), although not significantly different from those BP (between 30.0 and 35.1 °C), but significantly lower, in different dates, compared to T plots (between 30.1 and 38.9 °C).
Figure 5.
Average infrared foliar temperature in the UP, BP and T plots at different dates during the crops cycle. Means with different letters in each date are significantly different according to Tukey’s test (p =0.05).
Figure 5.
Average infrared foliar temperature in the UP, BP and T plots at different dates during the crops cycle. Means with different letters in each date are significantly different according to Tukey’s test (p =0.05).
Weeds
From the floristic surveys, carried out in the trial, the most represented weeds were the following 6 species: Portulaca oleracea L., Amaranthus retroflexus L., Setaria italica L., Convolvulus arvensis L., Solanum nigrum L. and Cirsium arvense L.).
In Figure 6, the average values of WGC %, recorded in different plots for each weed, are reported. Significant differences were recorded among weed species and among plots.
Within all the weed species, the highest relative values were noted for S. nigrum L. (ranged between 15.8 and 24.2%), while the lowest ones were recorded for A. retroflexus L. (ranged between 1.8 and 2.1%). Intermediate WGC % values were found for other weed species (ranged between 2.6 and 14.1%). Among the three compared plots, except for the A. retroflexus species, all the other weeds recorded significantly lower values in the Up plot (ranged between 2.5 and 15.7%) compared to both BP and T ones. (ranged between 7.5 and 24.2%).
These results could lead us to assume that the aforementioned weeds, typical specie for growing in the spring-summer period, and therefore demanding of brightness, under the solar panels have undergone a lower growth.
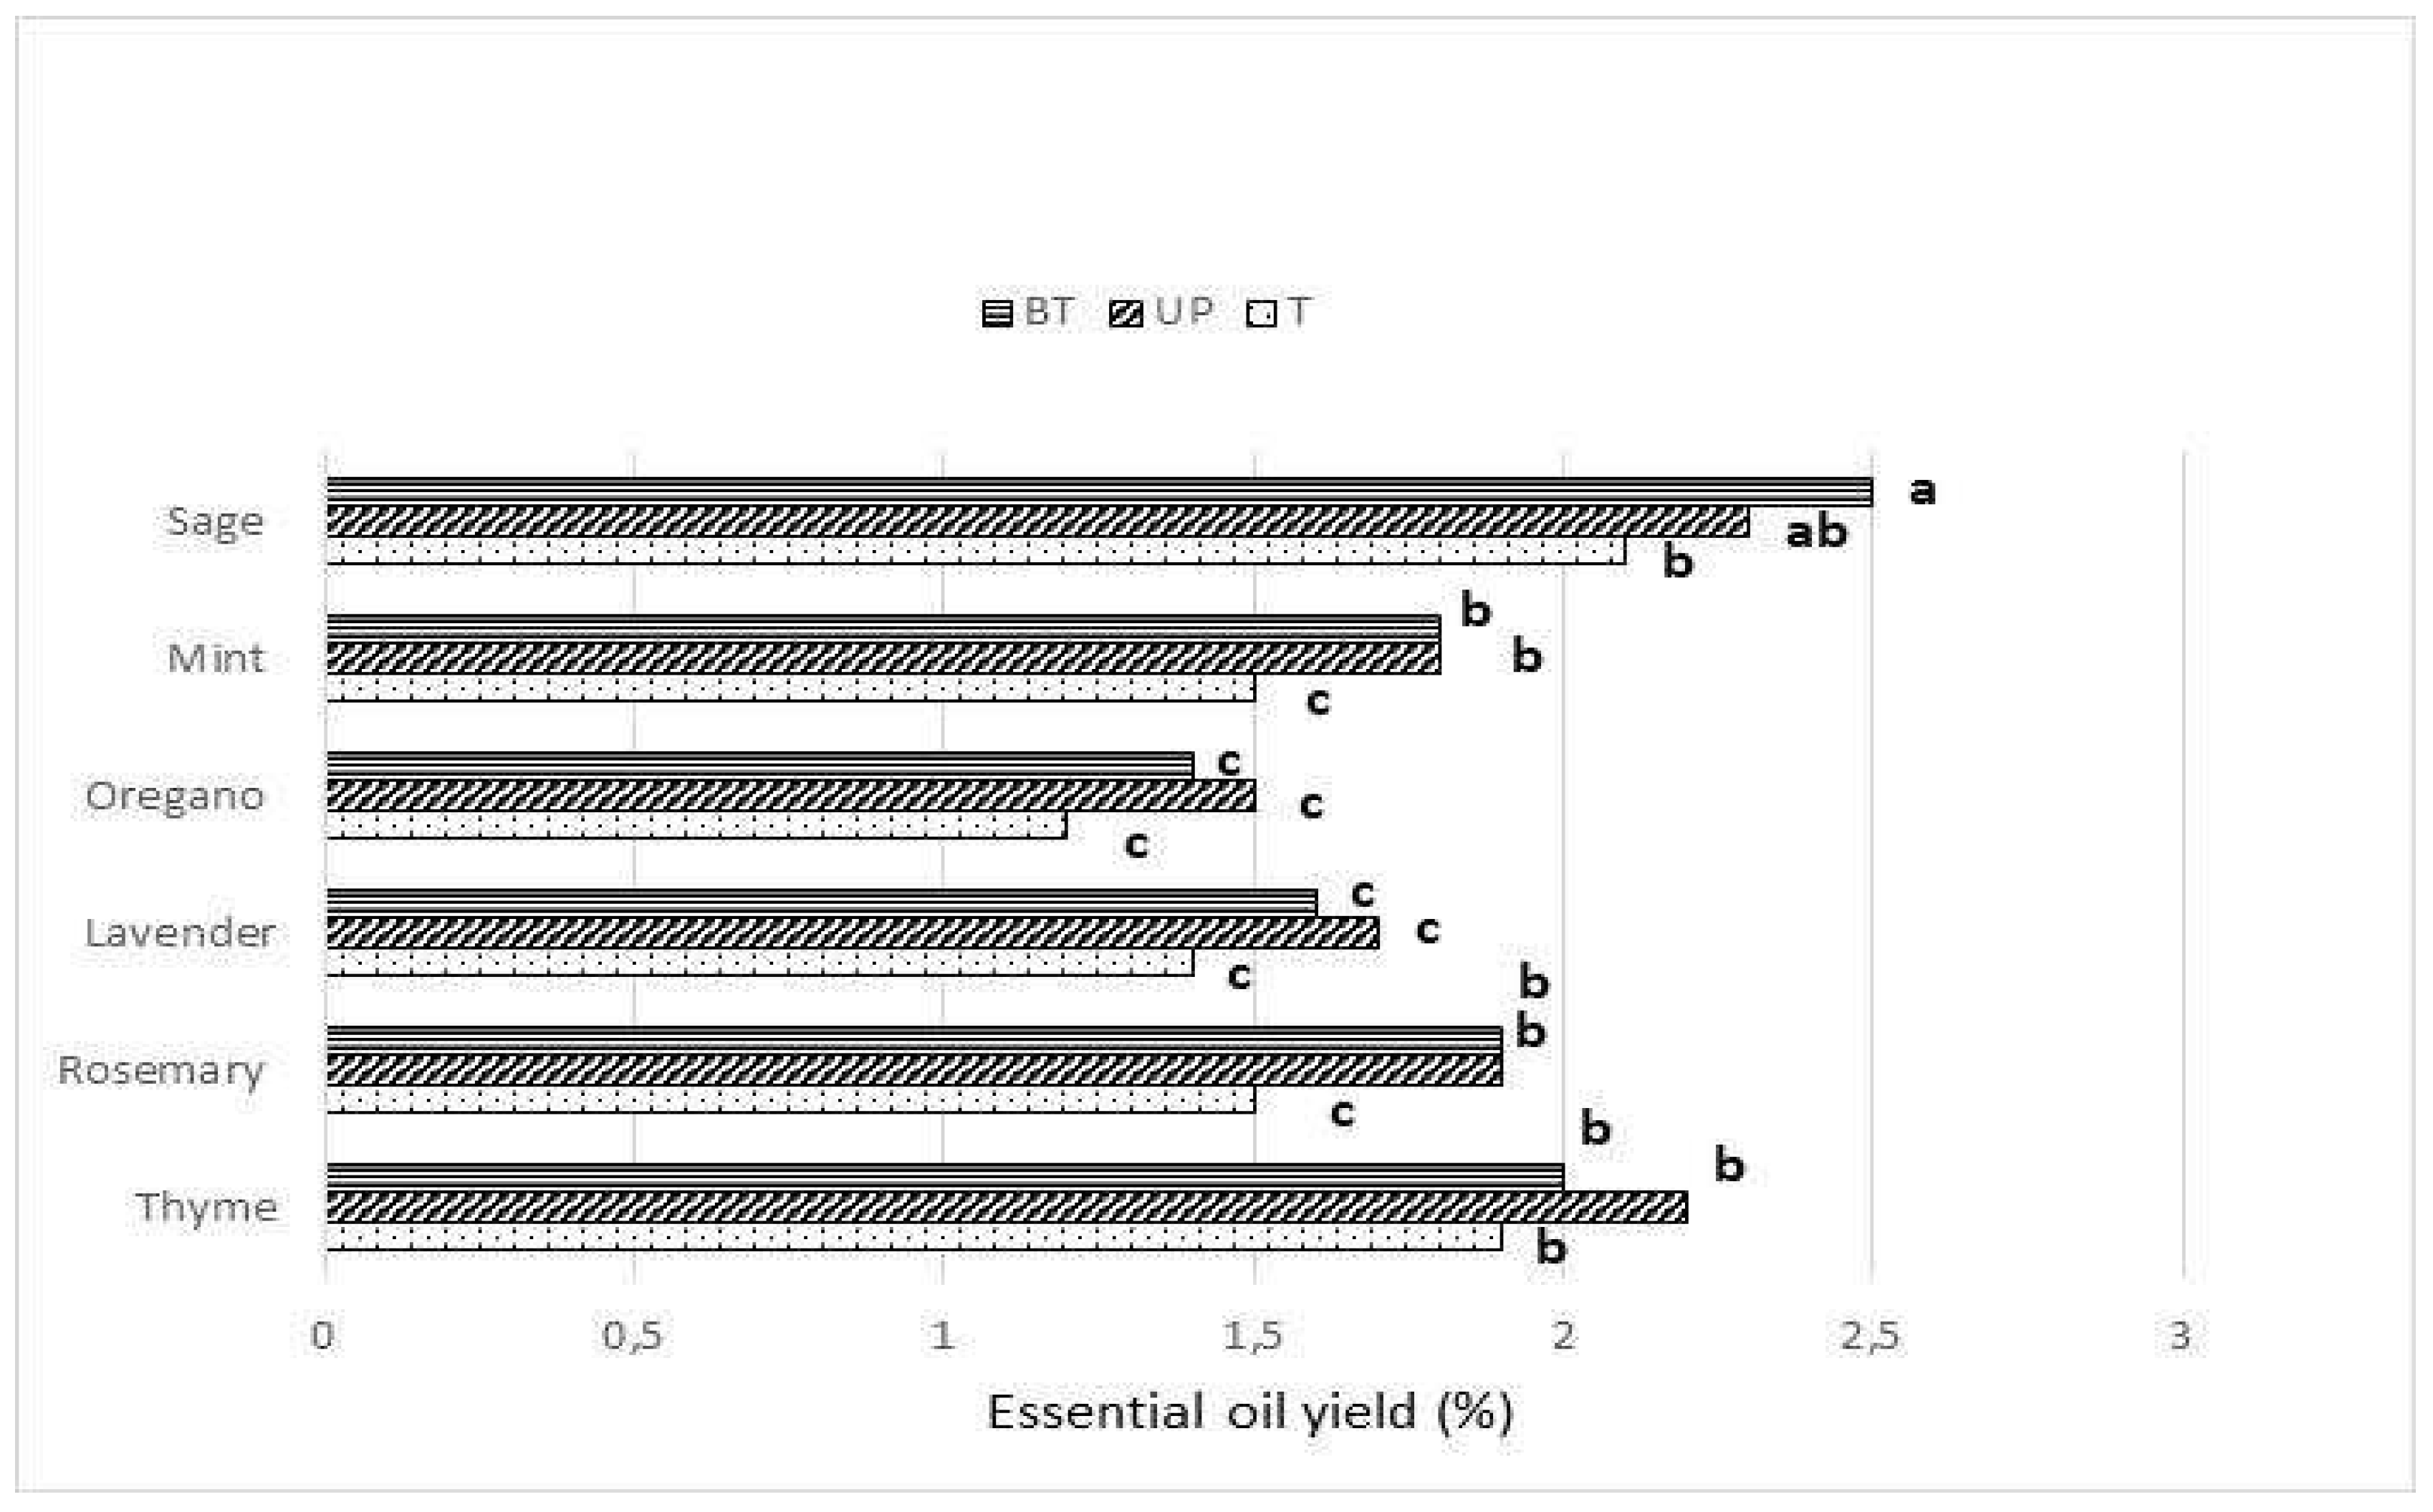
3.5. Dry matter and essential oil yield (EOs)
The average values of dry matter detected in each crop (Figure 7) were not significantly different among the UP, BP and T plots, while they were significantly higher in the three sage, rosemary and thyme crops (average 45,9%) than either the oregano and mint crops (average 38.1%), the values of which were in turn statistically higher than the lavender (29.8%).
As concern the EOs yield (Figure 8), either the UP and BP plot, only for sage, mint, lavender and rosemary, showed significant higher average values (ranged from 1.8 and 2.5) than the T plot (ranged from 1.2 and 2.1 %). However, even if the remaining compared crops do not showed significant differences between the plots, they tend to have higher values in the UP and BP ranged from 1.4 and 2.3 %) than the T ones (ranged from 1.2 and 1.8 %). Furthermore, significantly differences were noted among the compared medicinal crops, whose lavender and oregano crops, on average of the plots, showed lower values (1.7 and 1.52%, respectively) than the remaining compared crops. (ranged from 1.5 and 2.5%). The best results obtained from the crops in the UP and BP plots could be due to the shading effect of the solar panels and/or the lower presence of weeds in these plots, which have had a positive effect on crops. On the latter, according to the previous investigators [21,22] the presence of weeds led to a qualitative and quantitative reduction of yield of several medicinal crops. As regards the influence of shading on the chemical composition of the essential oil of plants, research is completely lacking.
4. Conclusions
This first year of experimentation on the cultivation of the 6 aromatic species (sage, thyme, rosemary, lavender and mint) underneath a dynamic agrivoltaic system, compared with that in full sun, it has provided interesting results.
The reduction of light resources on the medicinal crops could be directly responsible for the lowest weed grow cover of almost all the specie as the P. oleracea, S. italica, C. arvense, S. nigrum and S. italic, and directly or indirectly for the highest essential oil yields in sage, mint, lavender and rosemary plants. The results of this study need to continue to be confirmed.
Considering that all the aromatic plants grown in this study are perennial, the qualitative and quantitative analysis of their production underneath the dynamic agrivoltaic system compared with those in full sun will continue in the future.
References
- Sadeghi, G. Energy storage on demand: Thermal energy storage development, materials, design, and integration challenges Energy Storage Materials 2022, 46, 192–222. [CrossRef]
- Nonhebel, S. Renewable energy and food supply: will there be enough land? Renew Sust Energ Rev 2005, 9,191–201. [CrossRef]
- Agostini, A.; Colauzzi, M.; Amaducci, S. Innovative agrivoltaic systems to produce sustainable energy: An economic and environmental assessment. 2021. Applied Energy 281:116102. [CrossRef]
- Goetzberger, A.; Zastrow, A. On the coexistence of solar-energy conversion and plant cultivation. Int. J. Solar Energy 1982, 1, 55–69. [Google Scholar] [CrossRef]
- Weselek, A.; Ehmann, A.; Zikeli, S. et al. Agrophotovoltaic systems: applications, challenges, and opportunities. A review. Agron. Sustain. Dev. 2019, 39, 35. [CrossRef]
- Valle, B.; Simonneau, T.; Sourd, F.; Pechier, P.; Hamard, P.; Frisson, T.; Ryckewaert, M., Christophe, A. Increasing the total productivity of aland bycombining mobile photovoltaic panels and food crops. Applied Energy 2017, 206, 1495–1507. [CrossRef]
- Lee, H.J.; Park.; H.H.; Kim, Y.O.; Kuk, Y.I. Crop Cultivation Underneath Agro-Photovoltaic Systems and Its Effects on Crop Growth, Yield, and Photosynthetic Efficiency. Agronomy 2022, 12(8), 1842. [CrossRef]
- Marrou, H.; Dufour, L.; Wery, J. How does a shelter of solar panels influence water flows in a soil–crop system? Eur J Agron 2013a, 50, 38–51. [Google Scholar] [CrossRef]
- Marrou, H.; Guilioni, L.; Dufour, L.; Dupraz, C.; Wery, J. Microclimate under agrivoltaic systems: is crop growth rate affected in the partial shade of solar panels? Agric For Meteorol 2013b, 177, 117–132. [CrossRef]
- Ravi, S.; Macknick, J.; Lobell, D.; Field, C.; Ganesan, K.; Jain, R.; Elchinger, M.; Stoltenberg, B. Colocation opportunities for large solar infrastructures and agriculture in drylands. Appl Energy 2016, 165, 383–392. [Google Scholar] [CrossRef]
- Amaducci, S.; Yin, X.; Colauzzi, M. Agrivoltaic systems to optimise land use for electric energy production Applied Energy 2018, 220, 545–561. [CrossRef]
- Marrou, H.; Wery, J.; Dufour, L.; Dupraz, C. Productivity and radiation use efficiency of lettuces grown in the partial shade of photovoltaic panels. Eur J Agron 2013c, 44, 54-66. [CrossRef]
- Schindelea, S.; Trommsdorff, M.; Schlaaka, A.; Obergfell, T.; Bopp, G.; Reise, C.; Braun, C.; Weselek, A.; Bauerle, A.; Högy, P.; et al. Implementation of agrophotovoltaics: Techno-economic analysis of the price-performance ratio and its policy implications. Appl. Energy 2020, 265, 114737. [Google Scholar] [CrossRef]
- Midmore, D.J.; Berrios, D.; Roca, J. Potato, (Solanum spp.) in the hot tropics V. intercropping with maize and the influence of shade on tuber yields. Field Crop Res. 1988, 18, 159–176. [CrossRef]
- Kuruppuarachchi, D.S.P. Intercropped potato (Solanum spp.): Effect of shade on growth and tuber yield in the northwestern regosol belt of Sri Lanka. Field Crop Res. 1990, 25, 61–72. [CrossRef]
- Ferrante, A.; Marian, L. Agronomic management for enhancing plant tolerance to abiotic stresses: high and low values of temperature, light intensity, and relative humidity. Horticulturae 2018, 4, 21. [CrossRef]
- Giardini, L. Agronomia generale, ambientale e aziendale. Pàtron Editore. 1992, 600.
- UNESCO/FAO. Bioclimatic Map of the Mediterranean Zone; Explanatory Notes, Arid Zone Research. Rome, Italy, 1963, 2217.
- Ventrella, D.; Charfeddine, M.; Moriondo, M.; Rinaldi, M.; Bindi, M. Agronomic adaptation strategies under climate change for winter durum wheat and tomato in southern Italy: Irrigation and nitrogen fertilization. Reg. Environ. Change 2012, 12, 407–412. [Google Scholar] [CrossRef]
- USDA. Textural soil classification. In Study Guide Revised; United States Department of Agriculture, Soil Conservation Service: Washington, DC, USA, 1987, 48.
- Hendawy, S.F.; Abouziena, H.F., Abd El-Razik, T.M.; Amer H.M.; Hussein M.S. Winter weeds and its control in the medicinal plants in Egypt: a survey study. Egypt Pharmaceut J 2019, 18, 16-26. [CrossRef]
- Vouzounis, N.A.; Dararas, V.E.; Georghiou, G. Chemical control of weeds in the aromatic crops lavender, oregano and sage. Agricultural Research Institute Ministry of Agriculture, Natural Resources and the Environment, Technical Bulletin 218 2003. Available at: http://news.ari.gov.cy/publications/tb218-vouzounis.pd.
- Manuelli, M. T.; Cresce il consumo di erbe aromatiche e il settore rilancia con l’Osservatorio e nuovi investimenti. IlSole24Ore 2020. Available at: https://www.ilsole24ore.com/art/cresce-consumo-erbe-aromatiche-e-settore-rilancia-l-osservatorio-e-nuovi-investimenti-ADe6hjg.
Figure 1.
Scheme of the agrivoltaic system.
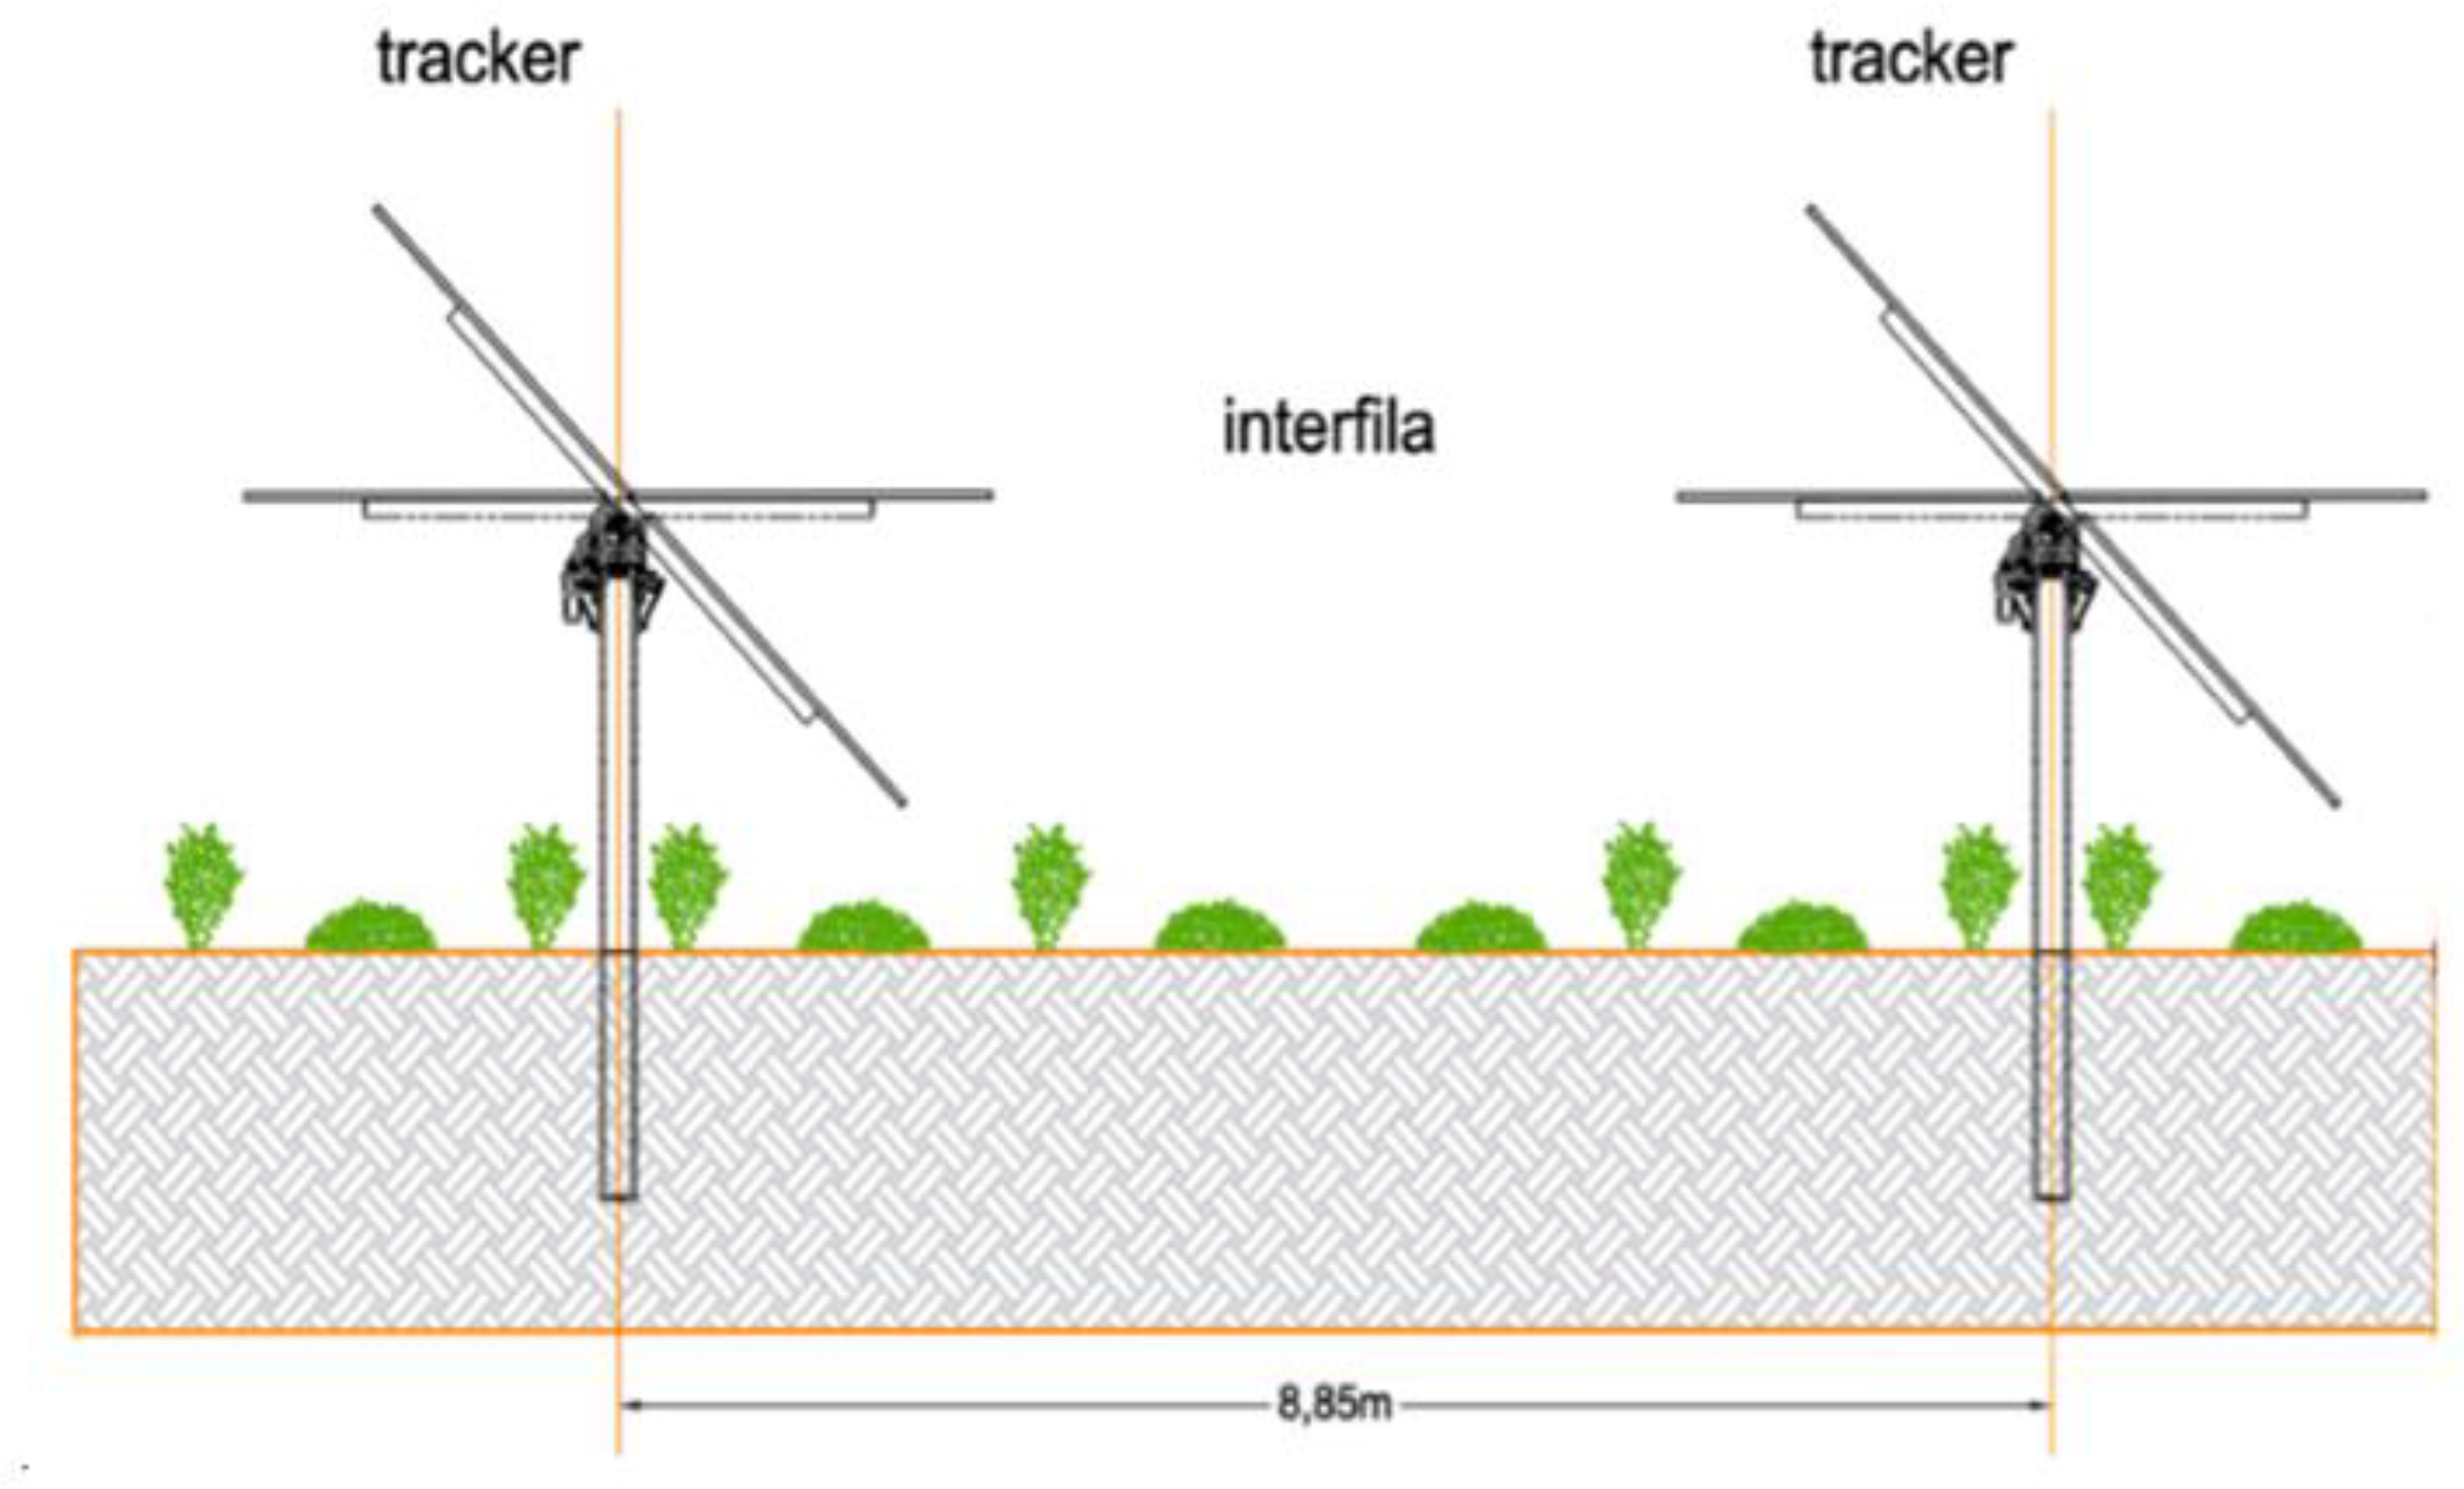
Figure 3.
Average solar radiation in the UP, BP and T plots at different dates during the crops cycle. Means with different letters in each date are significantly different according to Tukey’s test (p =0.05;).
Figure 3.
Average solar radiation in the UP, BP and T plots at different dates during the crops cycle. Means with different letters in each date are significantly different according to Tukey’s test (p =0.05;).
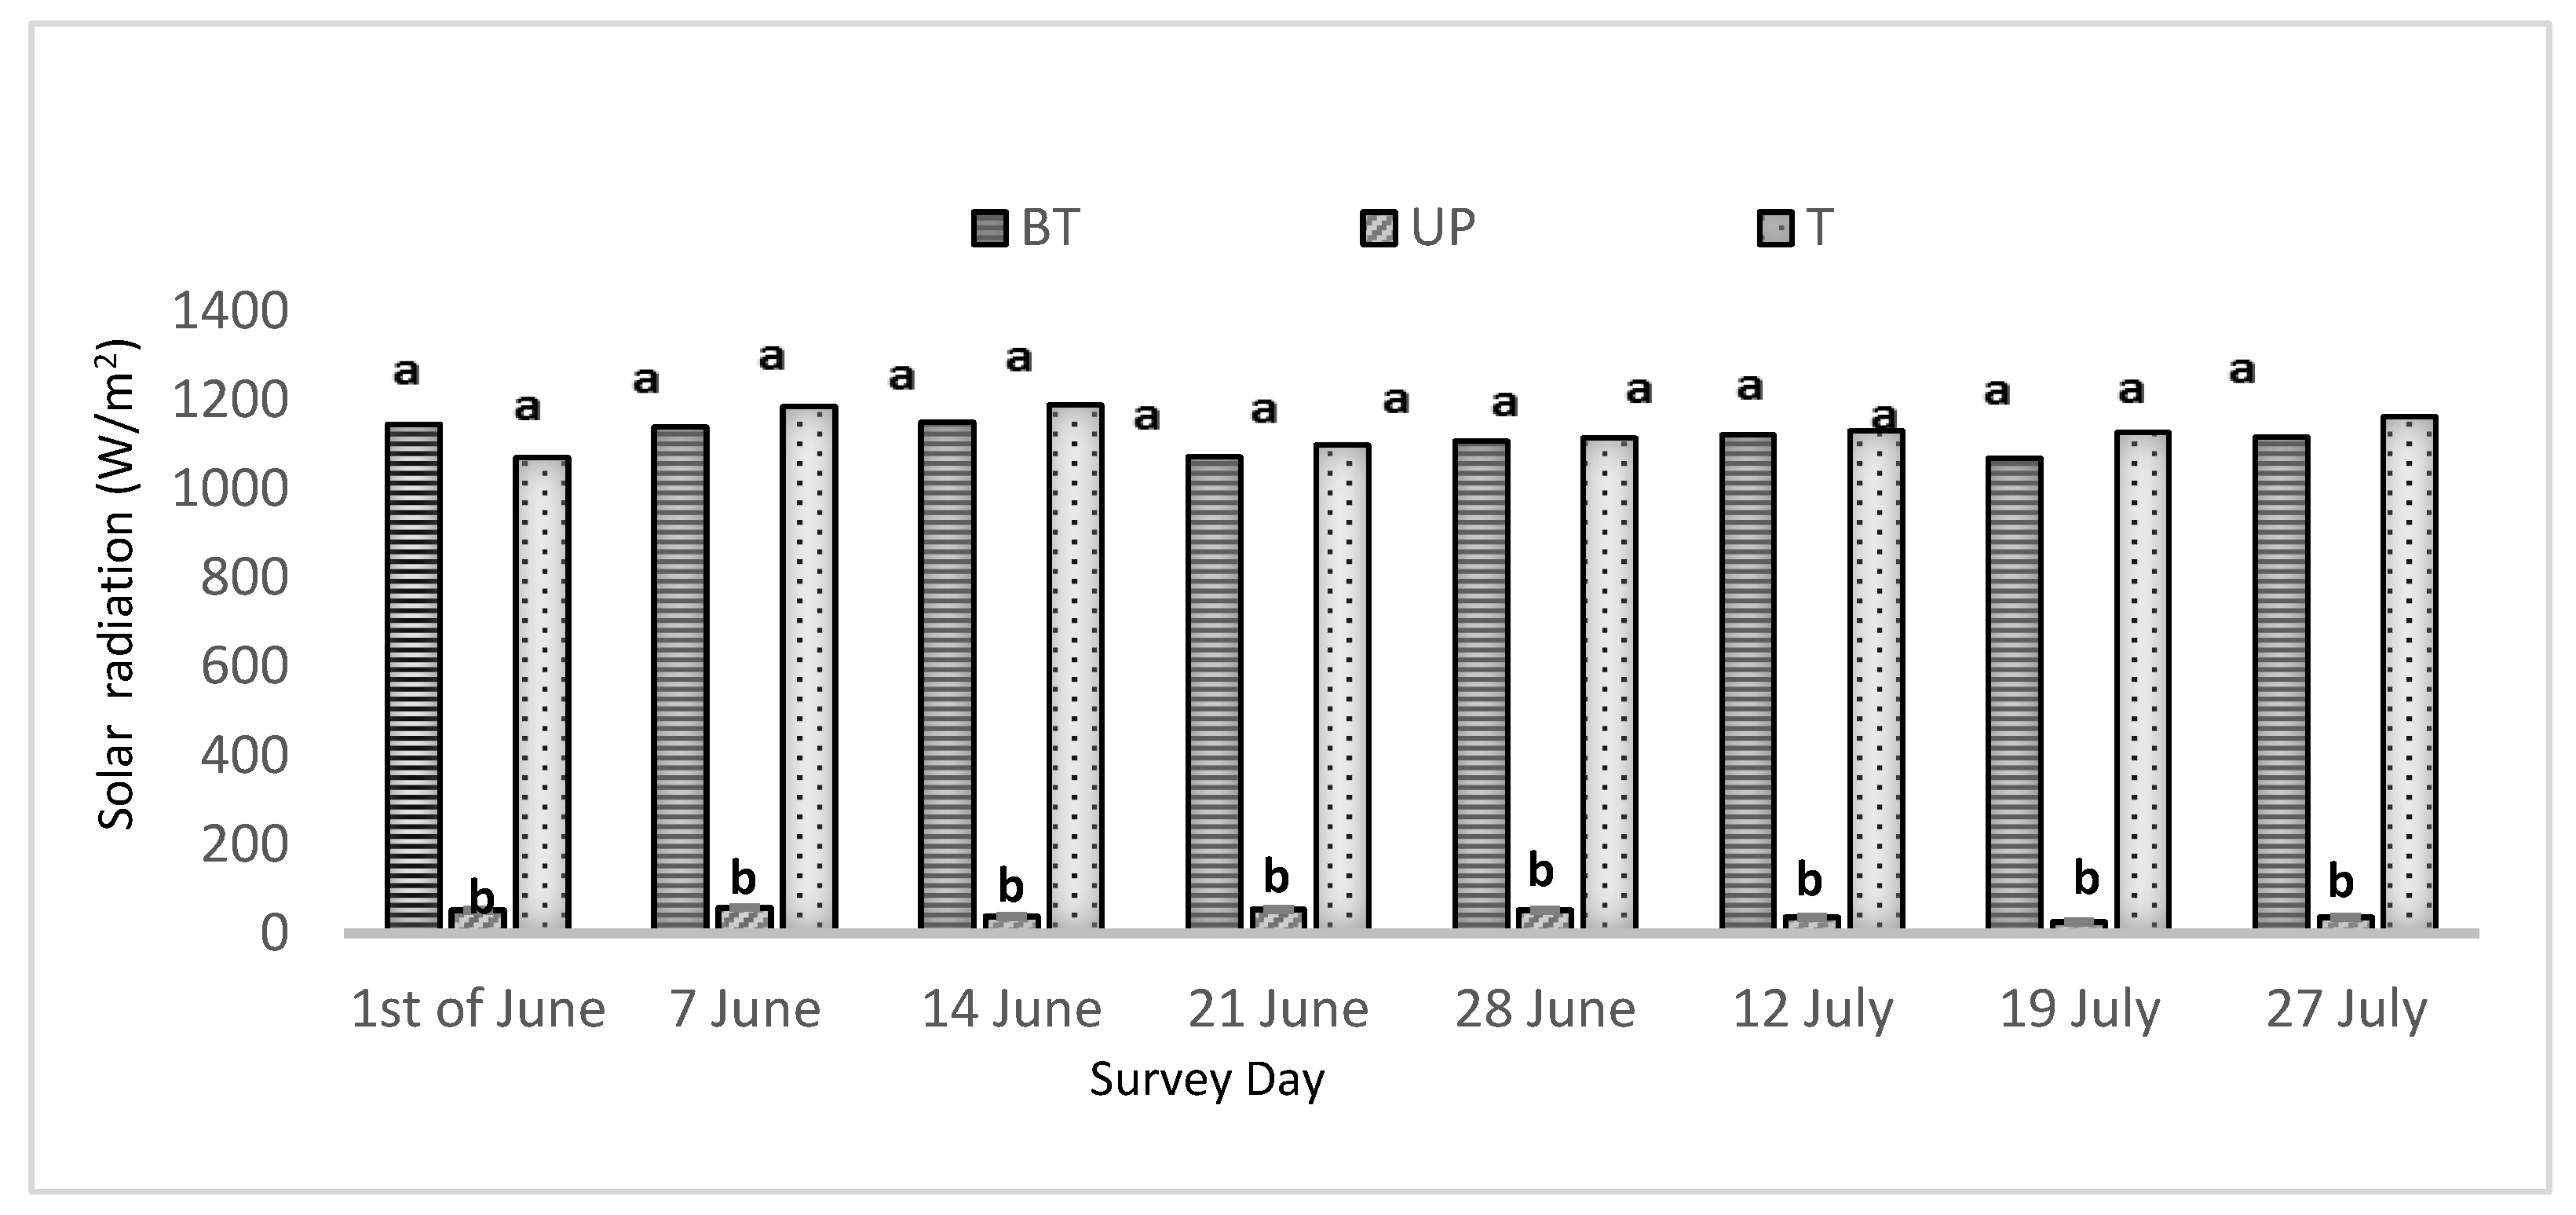
Figure 4.
Average air temperature in the UP, BP and T plots at different dates during the crops cycle. Means with different letters in each date are significantly different according to Tukey’s test (p =0.05).
Figure 4.
Average air temperature in the UP, BP and T plots at different dates during the crops cycle. Means with different letters in each date are significantly different according to Tukey’s test (p =0.05).
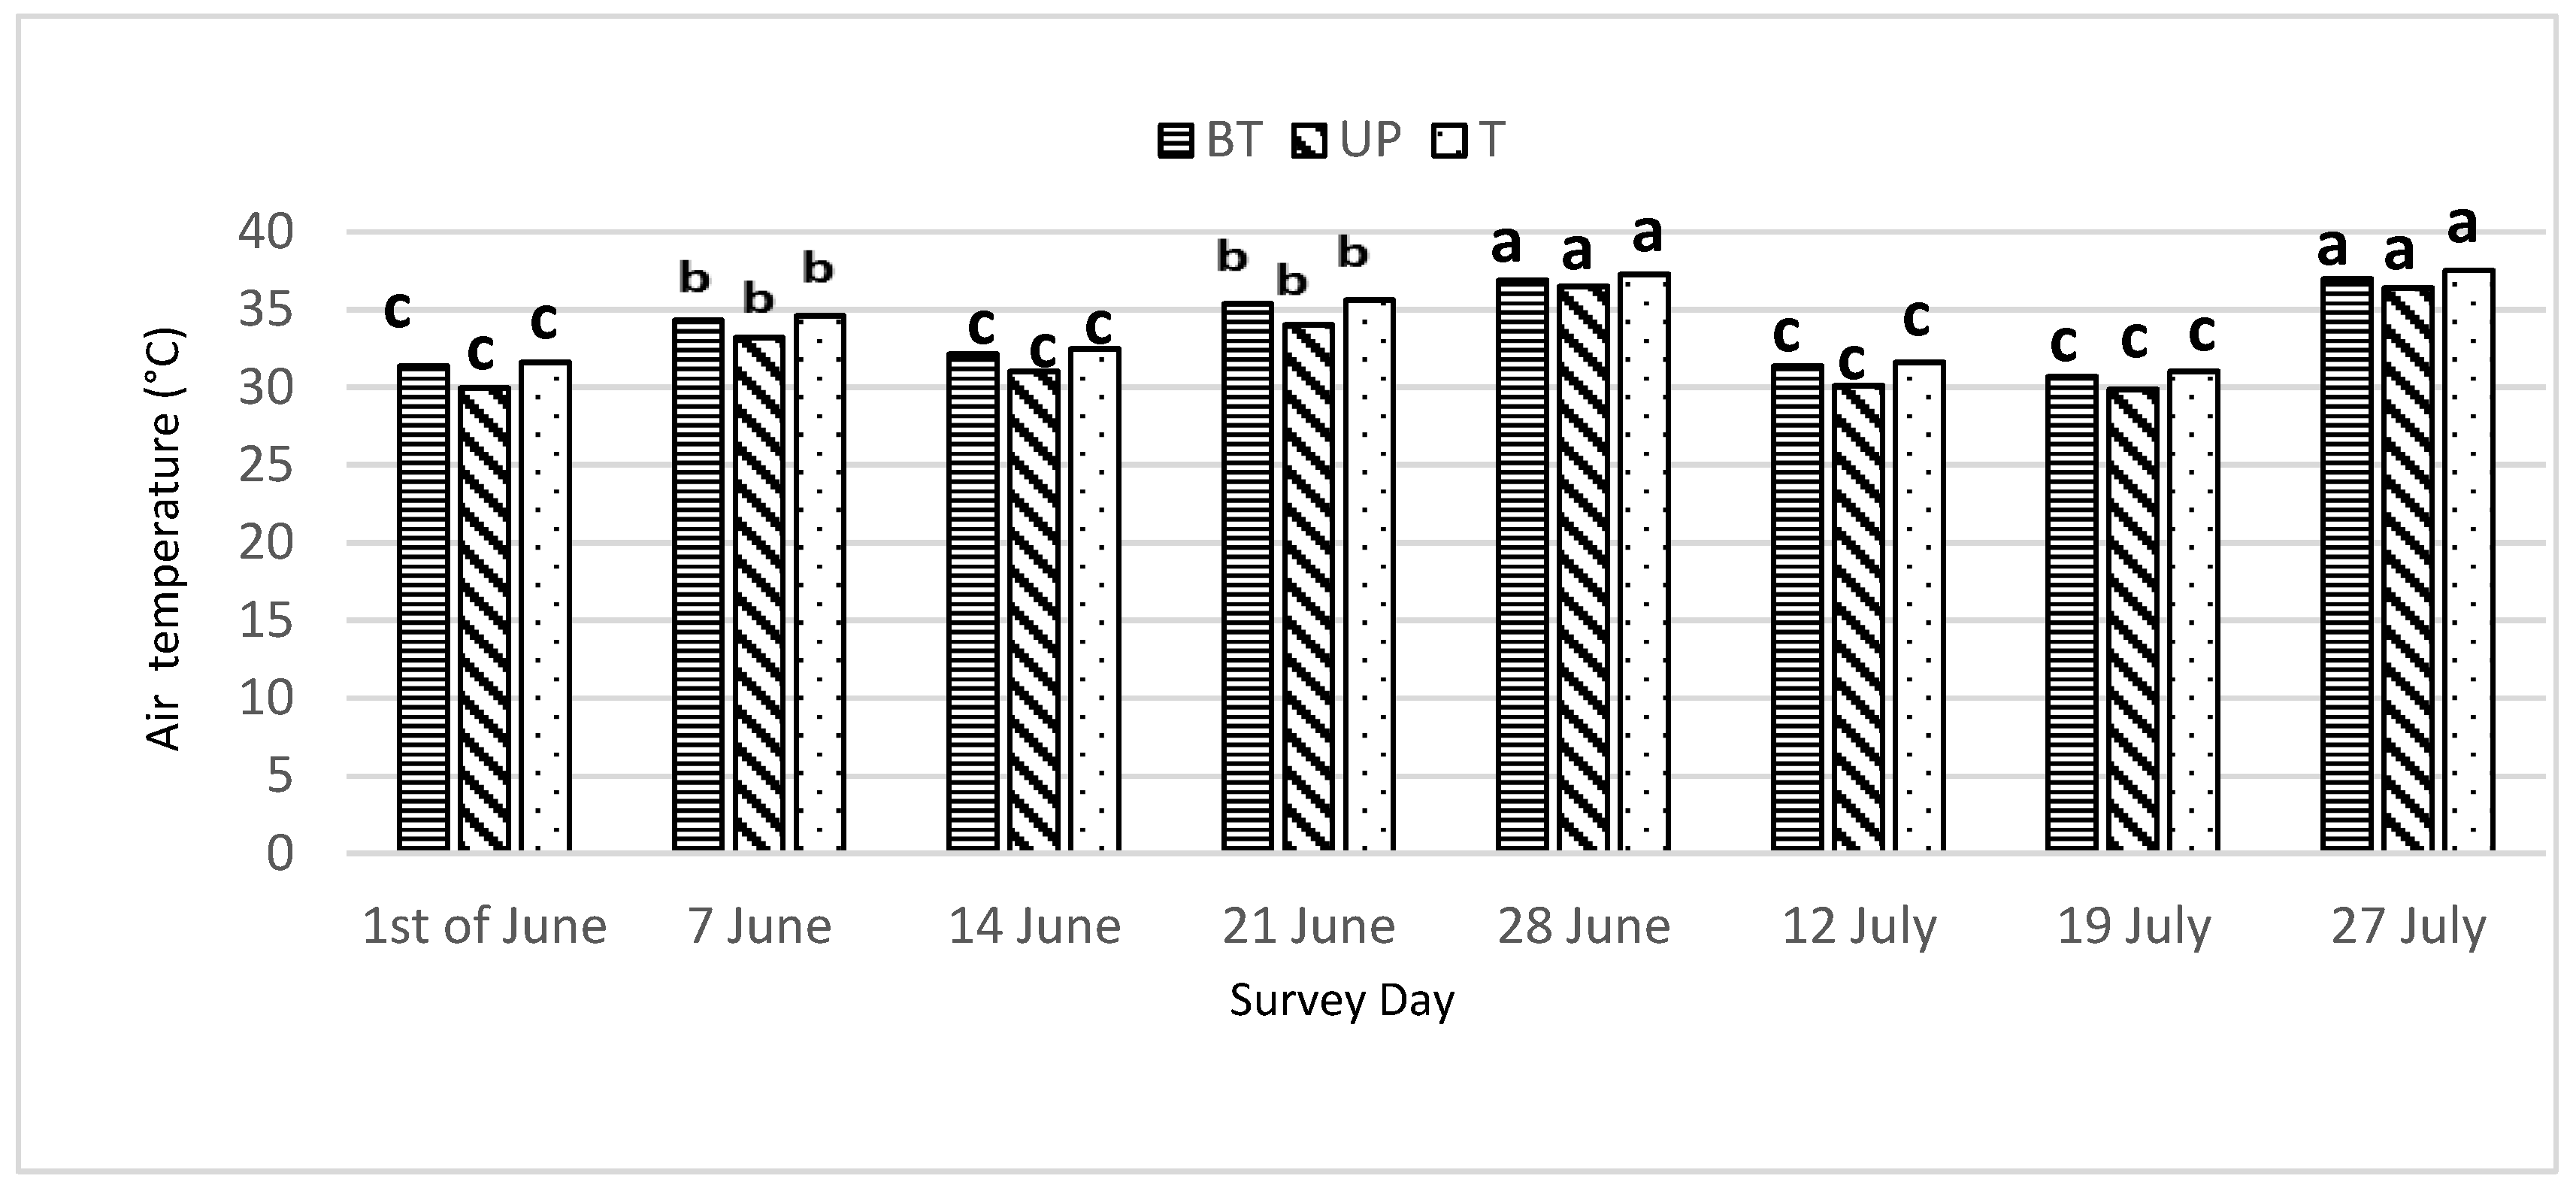
Figure 6.
Weeds ground cover (WGC) in the UP, BP and T plots detected on 19 July. Means with different letters are significantly different according to Tukey’s test (p =0.05).
Figure 6.
Weeds ground cover (WGC) in the UP, BP and T plots detected on 19 July. Means with different letters are significantly different according to Tukey’s test (p =0.05).
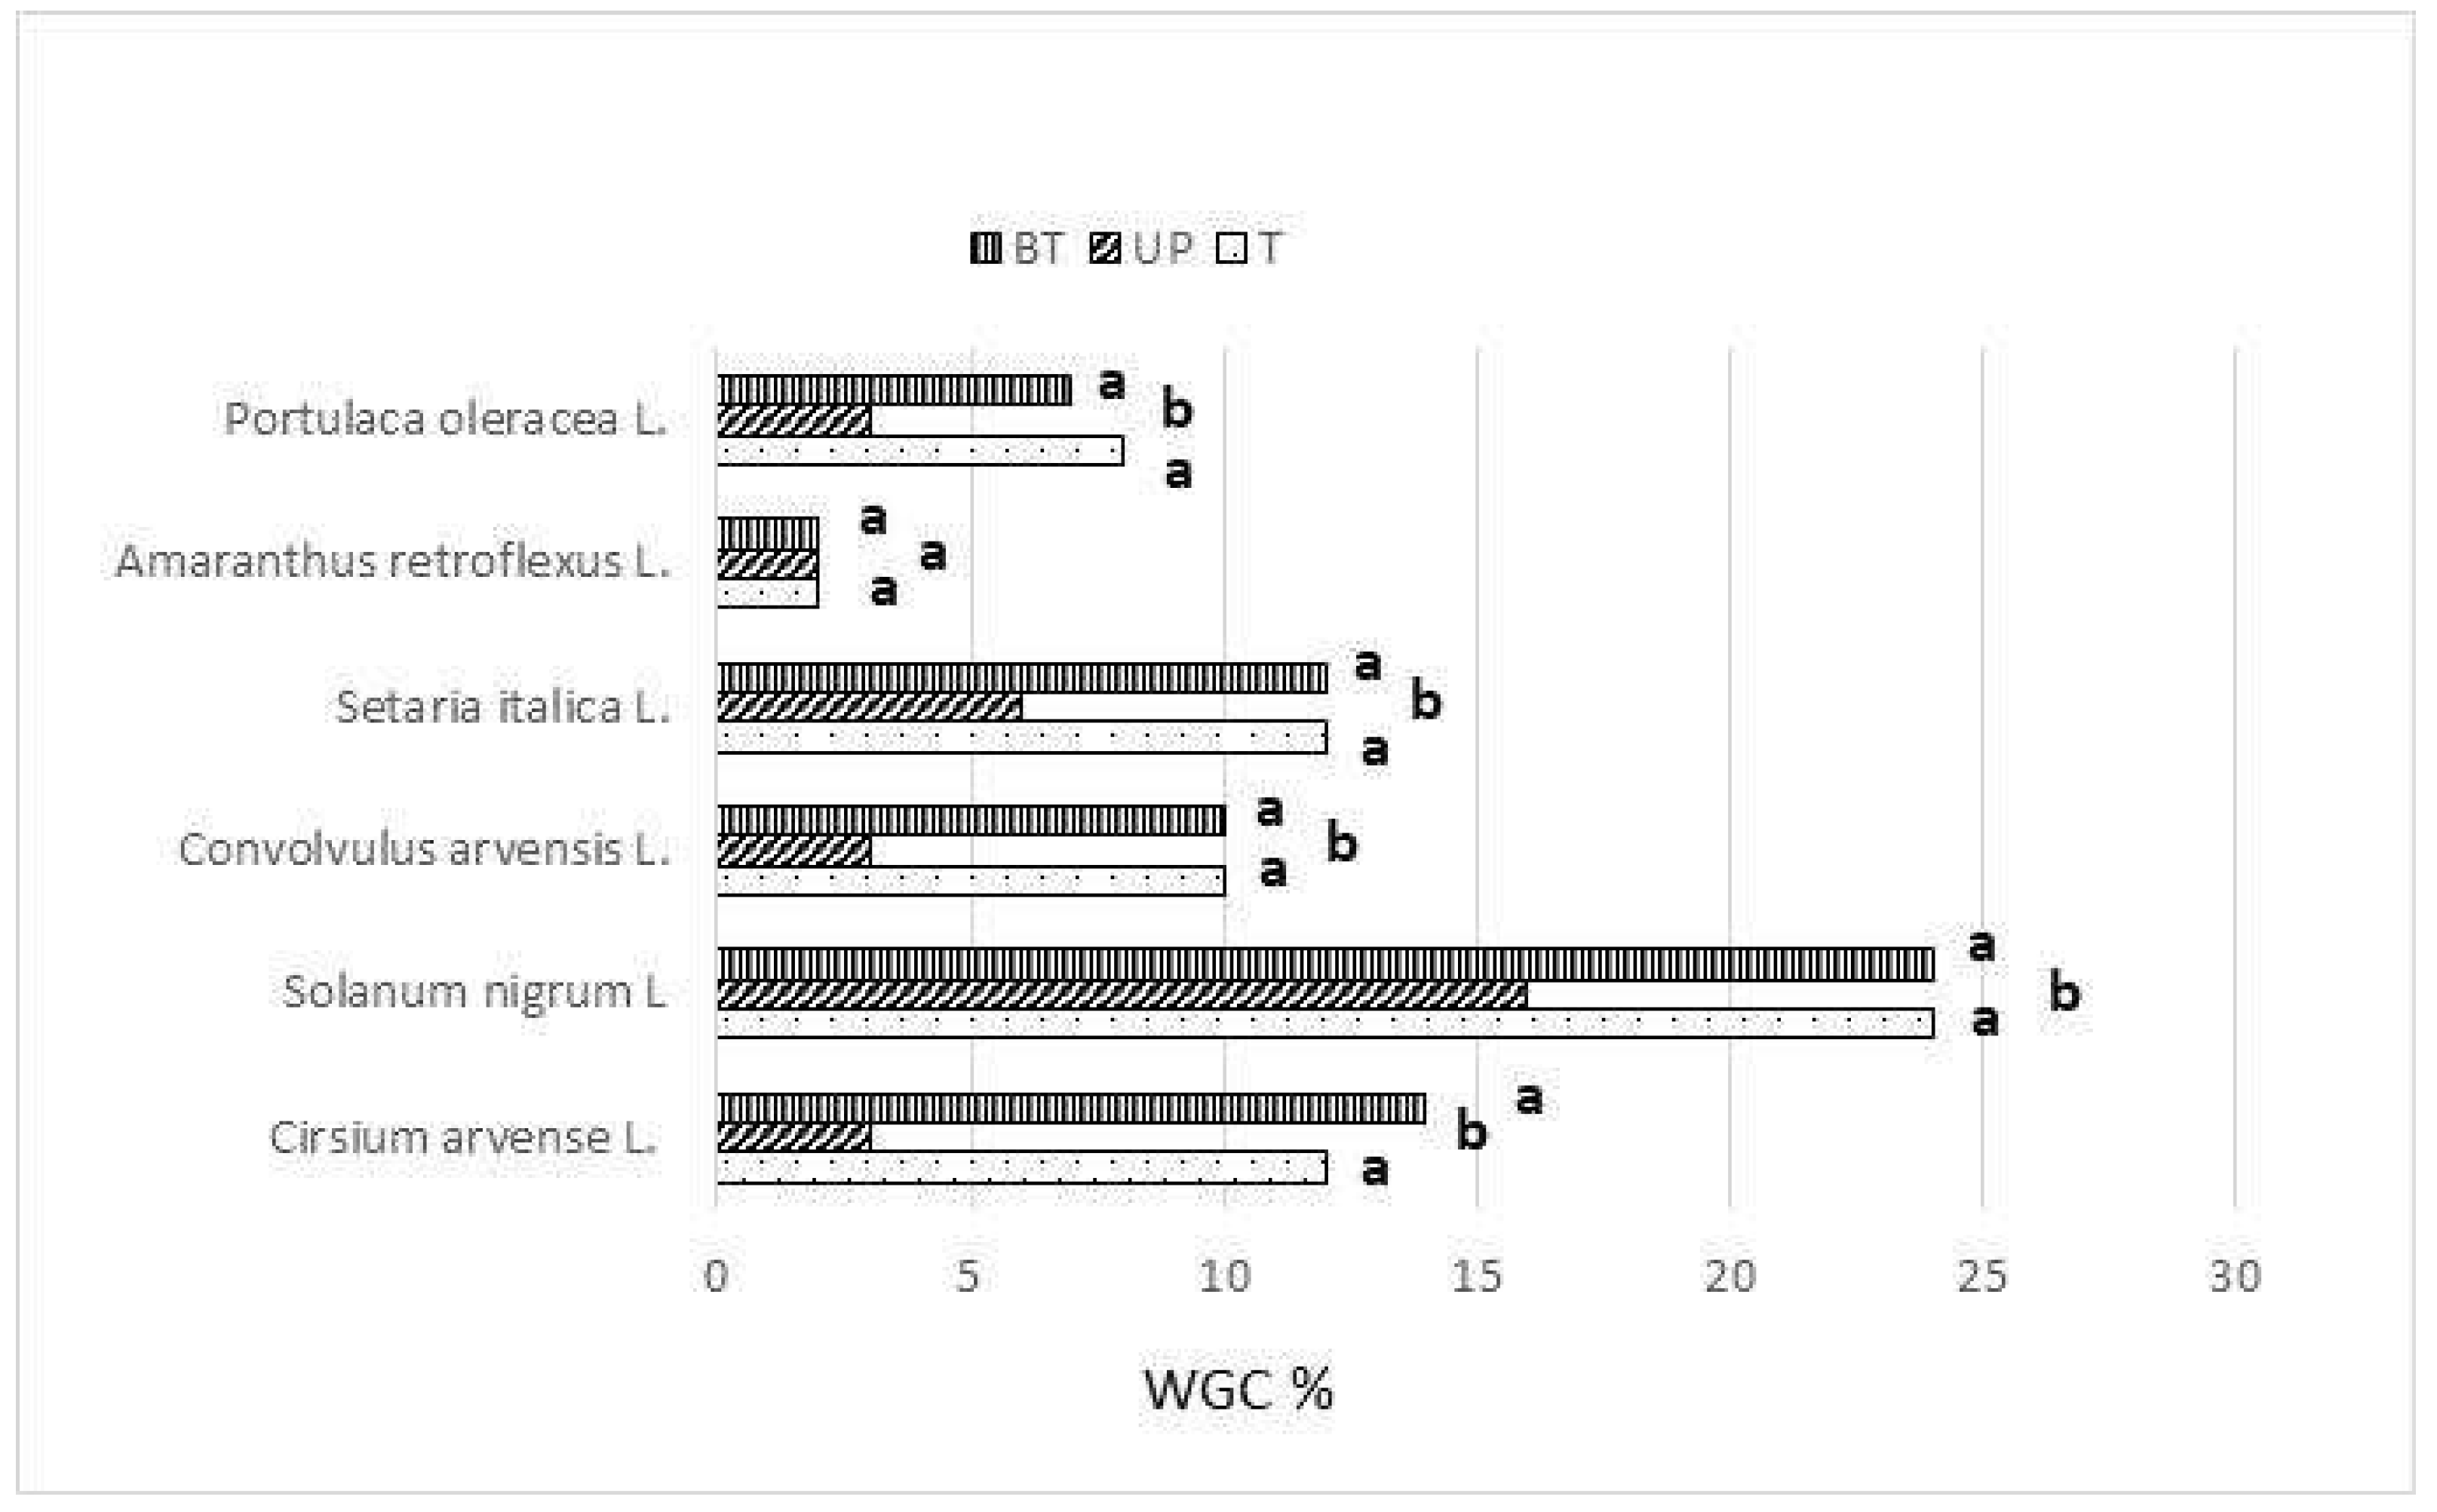
Figure 7.
Dry matter content (%) of the compared aromatic crops from the UP, BP and T plots. Means with different letters are significantly different according to Tukey’s test (p =0.05).
Figure 7.
Dry matter content (%) of the compared aromatic crops from the UP, BP and T plots. Means with different letters are significantly different according to Tukey’s test (p =0.05).
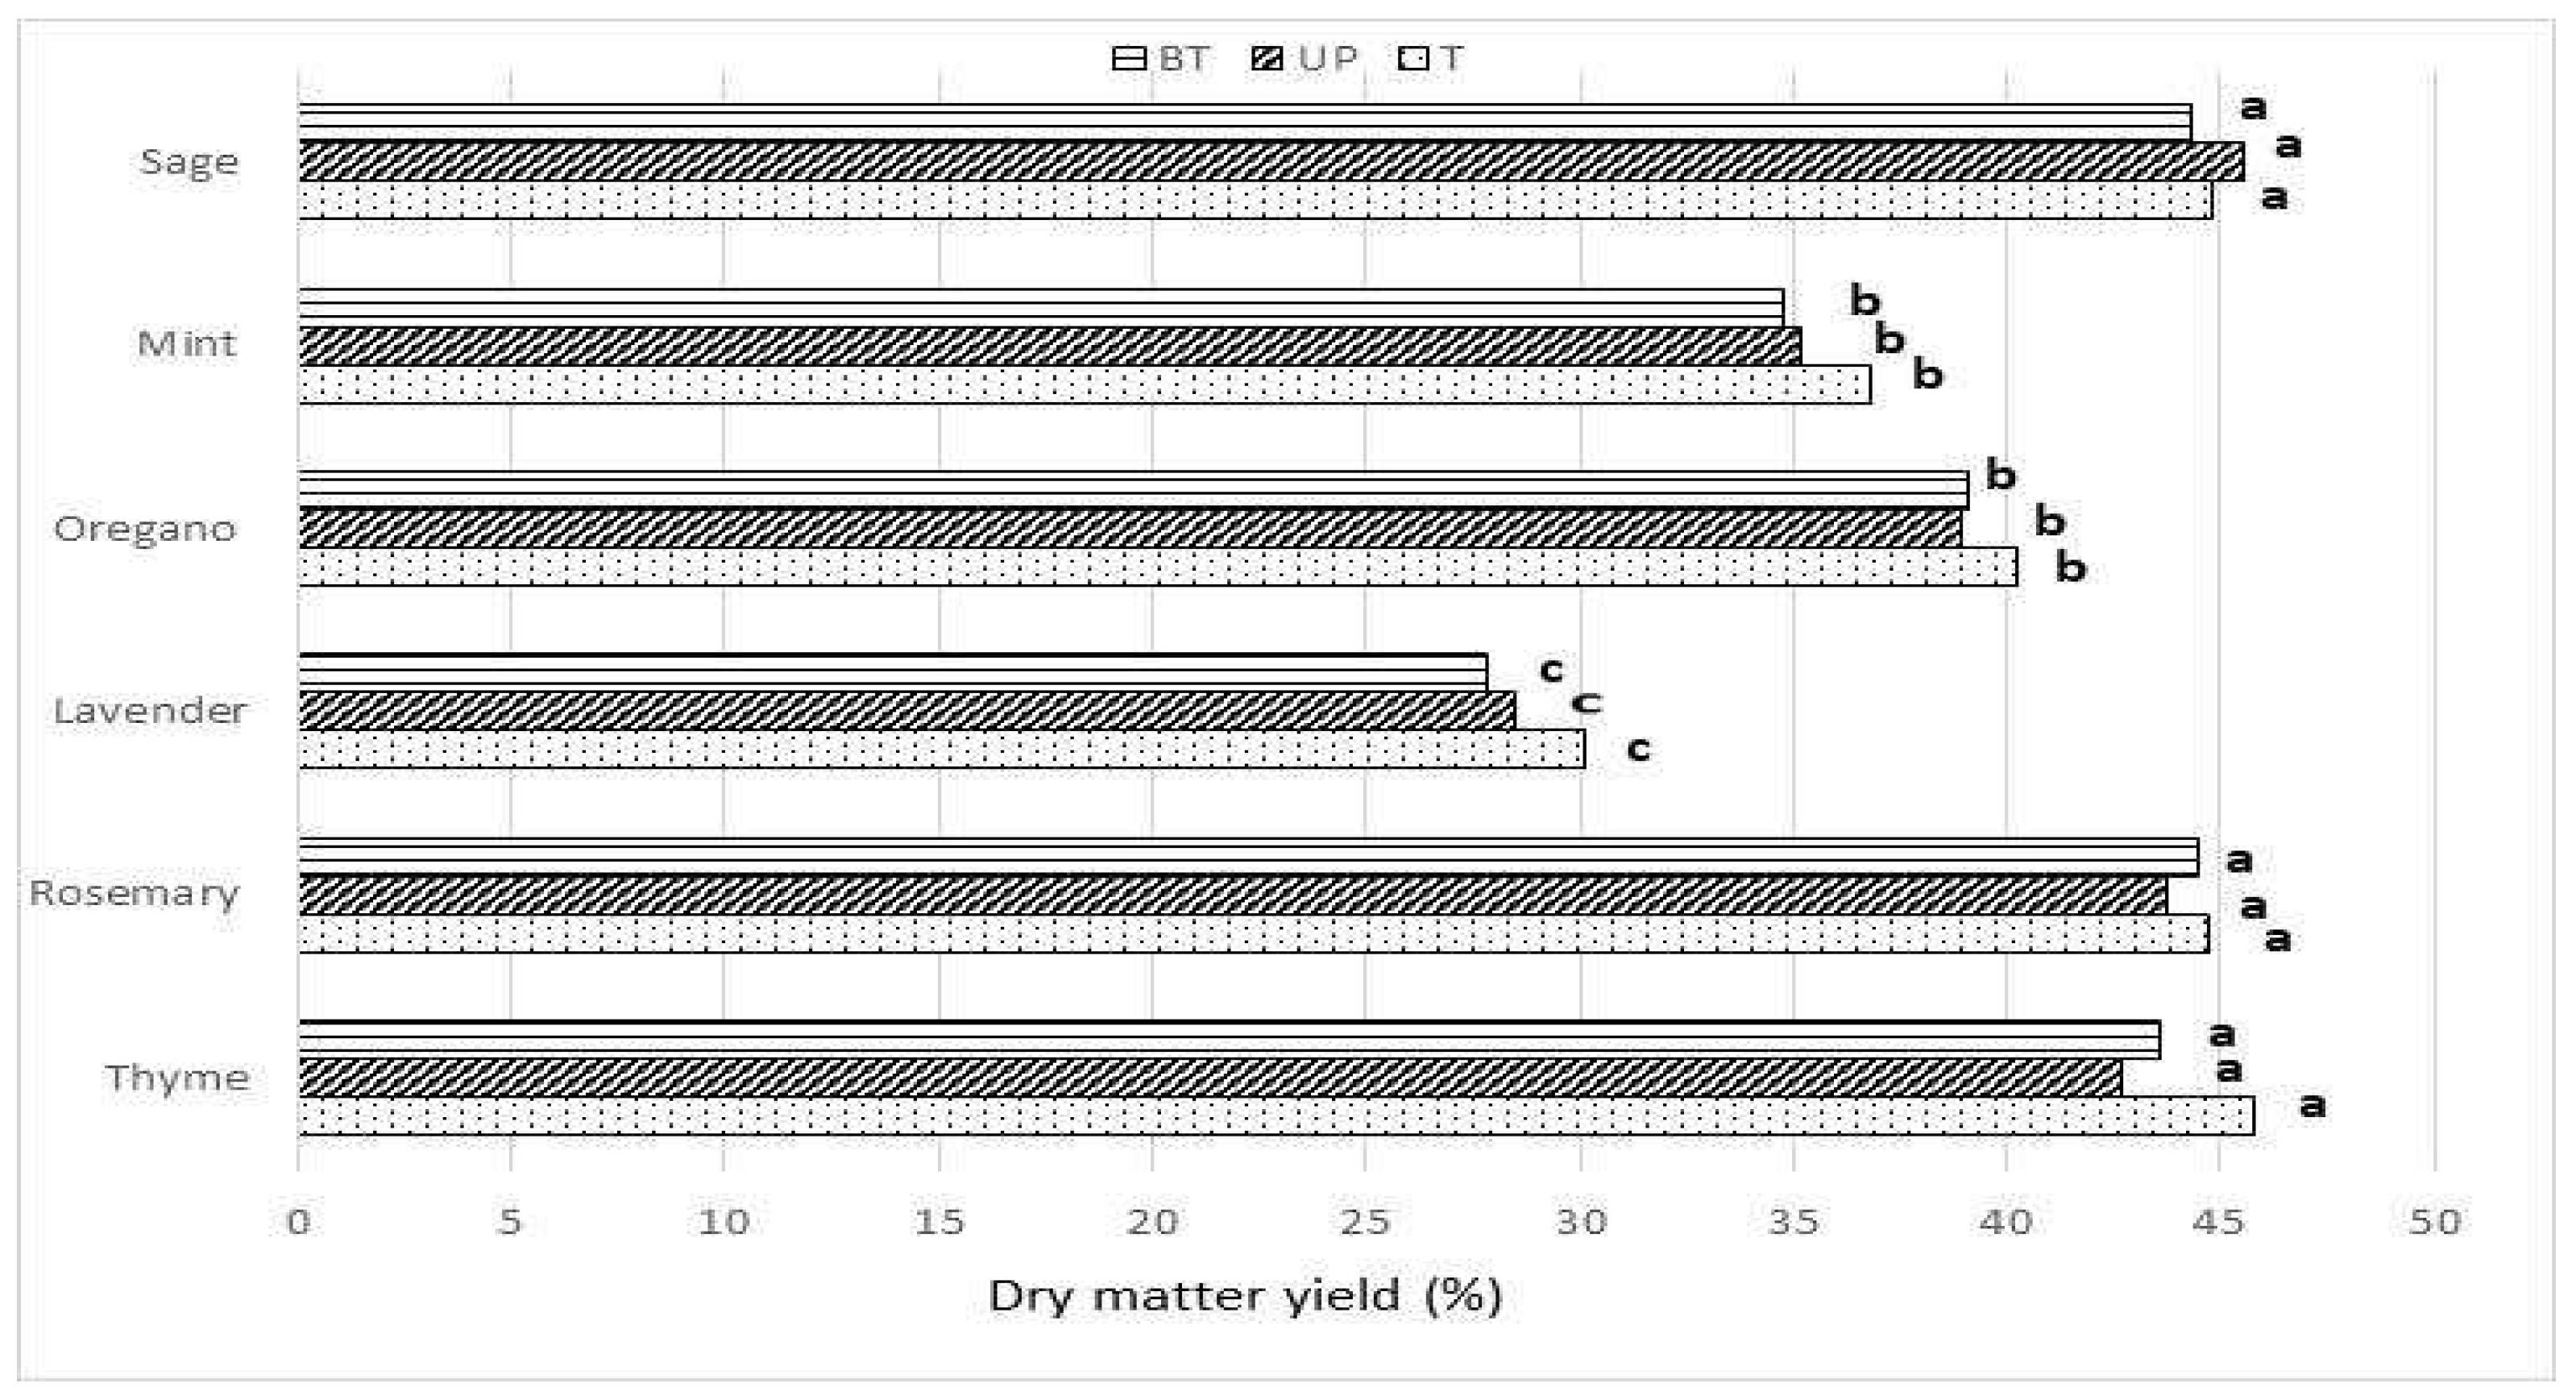
Figure 8.
Essential oil yield (%) of the compared aromatic crops from the UP, BP and T plots. Means with different letters are significantly different according to Tukey’s test (p =0.05).
Figure 8.
Essential oil yield (%) of the compared aromatic crops from the UP, BP and T plots. Means with different letters are significantly different according to Tukey’s test (p =0.05).
Disclaimer/Publisher’s Note: The statements, opinions and data contained in all publications are solely those of the individual author(s) and contributor(s) and not of MDPI and/or the editor(s). MDPI and/or the editor(s) disclaim responsibility for any injury to people or property resulting from any ideas, methods, instructions or products referred to in the content. |
© 2023 by the authors. Licensee MDPI, Basel, Switzerland. This article is an open access article distributed under the terms and conditions of the Creative Commons Attribution (CC BY) license (http://creativecommons.org/licenses/by/4.0/).
Copyright: This open access article is published under a Creative Commons CC BY 4.0 license, which permit the free download, distribution, and reuse, provided that the author and preprint are cited in any reuse.


