
Submitted:
23 February 2023
Posted:
24 February 2023
You are already at the latest version
Abstract
Adaptive Cruise Control (ACC) is useful in the most dangerous maneuvers such as braking and acceleration. This study assesses how ACC modifies traffic flows by analysing the differences be-tween manual and autonomous driving in connected and autonomous vehicles (CAVs). Using a platoon of 80 vehicles, tested in pairs on the road, it was possible to define the speed trends during braking and acceleration and the reaction times to the driving maneuvers (PRT, TH, TCC) with a kinematic data detector. The interactions between the CAV and the driver, have been studied in-novatively, i.e through gaze analysis. Situations of potential danger, characterized by the braking of the vehicle that precedes the car with the driver equipped with the eye tracker tool, have been recreated, considering the influence of the driver’s ACC experience. Results statistically confirmed that with the ACC switched on the reaction times are greater than manual driving (2.4/3.8 sec); this can lead to a reduction in road safety, further motivated by the rapid decrease in speed. The interpolation between automated and human data, finally, has allowed the detection of some criticalities of the system that are fundamental in order to reach the second level of automation.
Keywords:
Perception-reaction time
; speed
; driving behavior
; connected and autonomous vehicles (CAVs)
; gaze
1. Introduction
The complexity of a car’s driving activity, consisting of several concurrent tasks, causes the driver to have an excessive mental workload and, as a result, an increased likelihood of making mistakes [1,2,3,4]. Advanced Driver-Assistance Systems (ADAS) have been introduced in vehicles to try to limit the physical and mental strain on the driver [5]. ADAS are technologically innovative devices able to monitor driving and intervene in an emergency, thanks to the presence of a series of sensors [6]. They are the basis of self-driving cars, or autonomous cars, capable of driving on the road without the help of the driver.
Connected and automated vehicles (CAVs), becoming increasingly frequent, are radically changing the interactions related to road driving [7,8,9]. To date, however, few studies have evaluated the interactions of systems on traffic flows; for this reason, it is important to determine their impact and, consequently, their main peculiarities, to define how they affect road safety. However, it must be recognized that these technologies, when applied to large fleets of vehicles, allow for limiting the risk of accidents, and at the same time polluting emissions, energy, and fuel consumption [10].
In general, the four main components of ADAS devices are longitudinal control, lateral control, monitoring system of the watch driving, and parking assistance [11].
The aim of these devices is, therefore, to increase safety, try to limit dangerous situations for the motorist, and establish an innovative methodology of shared driving [12,13]. To shed light on this, the study of the interaction between driver and driver assistant is fundamental; it is, in fact, interesting to evaluate how the driver approaches the task of driving in the presence of ADAS since it is not always possible to trust the effective functioning of the mechanisms. Although the devices have been designed to increase road safety, they do not turn out to be totally autonomous. The need for constant control by the driver, in fact, is fundamental in order to avoid situations where ADAS do not intervene in an optimal way. This, however, presupposes high attention to driving to react promptly to situations of sudden danger. According to some studies, however, it has been found that the ADAS increase the focus of the look on the dashboard, in order to control the functioning of the system, outlining a lower perception of the road and the possible dangers inherent in it [14,15].
Therefore, the safety impact of these technologies often does not meet the expected benefits, as drivers change their behavior while driving, following the concept of Behavioural Awareness (BA) [16,17,18]. Several factors, such as the role of secondary driving tasks, and situational awareness (SA), need to be considered in order to analyse in depth the behavioural adaptation of drivers to driver assistance systems and the degree of trust they have with ADAS in relation to their driving experience [18,19].
1.1. Impact of ACC on Traffic Flow
SAE, the Society of Automotives Engineers, has defined five levels of autonomous driving plus one, Level 0 (it involves no automation). Level 1, on the other hand, requires that the vehicle be equipped with at least one system that provides steering assistance. In this level, the driver remains the only person responsible for driving the vehicle. Adaptive Cruise Control is the first example of Level 1 driver assistance technology.
Among the new driver assistance systems, Adaptive Cruise Control (ACC), is the one of the first concrete step toward autonomous driving [7,20,21]. The term "adaptive", in fact, is expressed the main feature of the system, which the ability to vary the speed according to the traffic conditions; it, in fact, through sensors RADAR or LIDAR frontal, can accelerate and decelerate automatically depending on the vehicle detection in front. In recent years, although the widespread use of this type of device has led to various research, none has been able to define the driver-vehicle interaction considering the different reaction times between the on and off the system, considering, therefore, the actual behavioral variation on the driving behavior [22,23].
The prerogative of the ACC is to monitor the safety distance from the previous vehicle; the concept of distance on the road falls within the constraints imposed by the spacing policy [24]. Its implementation has, in fact, a direct effect on road safety and the amount of traffic, considering the different parameters of analysis of the vehicles involved. First, the time headway (TH) is introduced, which allows the time interval between the passage at the same point of two successive vehicles, within the car-following model [25]. Although [26] argue that the risk is almost null if the driver maintains a time headway of 1s, it emerged that a TH of fewer than 1.2 seconds does not ensure road safety, especially in dangerous situations that require abrupt handling [27].
Unfortunately, drivers tend to adopt other significantly smaller ones especially when it is decided to keep a low safety distance in order not to be exceeded by other vehicles [28].
Since a spacing policy is established to ensure safety between vehicles, the collision time (TTC) should also be evaluated on the assumption that both vehicles march at a constant speed, without accelerating or decelerating. In some cases, in fact, it is possible to define the spacing error, that is, when the actual space moves away from the security space, creating instability in the flow of traffic. In fact, if in a platoon, the error increases, the traffic string becomes unstable, while if the error decreases it means that the string is kept within the considered time interval [29,30,31]. Drivers are not always able to perceive the right safe distance to keep to avoid an accident. In fact, 24% of accidents are characterized by a rear-end collision because most drivers cannot objectively perceive an acceptable TTC [32,33].
The last important factor for spacing policy is the reaction time of drivers in case of more or less dangerous maneuvers [7,34,35]. They, in fact, vary depending on whether it is to react to an obstacle on the road, a vehicle that crosses a junction to a car that brakes in front of us. However, to date in the literature, there is not yet a range of reaction times that have been studied in relation to the ACC. Many authors consider the range 0.4-0.5s, another 0.8-1.2s [7,36,37].
To assess how drivers evaluate the above parameters, many researchers have exemplified their behavior in the presence of strings from two or more vehicles, or a system of the vehicular platoon, monitoring the speed and distance adopted by one vehicle to another [38]. The instability of a platoon equipped with ACC refers to a dangerous situation caused by reaction times different from those required for the safety and comfort of passengers [39,40,41]. Marsden et al. (2001) through a detailed simulation investigation, obtained from the results a significant deceleration when the driver resumed control of the ACC system to increase the distance from a vehicle about to cut the road and deceleration, coming from the first vehicle of the platoon, has spread along the whole platoon. Thus, the presence of the ACC system reduces the standard deviation of vehicle acceleration, ensuring a potential gain in comfort [7,42,43]. Their evaluation is useful, following the analysis of the behaviors of drivers in various possible situations during a car-following, to design safe and suitable roads for the driver [44].
This paper aims to study the changes in traffic flows, evaluating the use or not of the system. Pairs of vehicles have been selected for analysis because it has been verified that strings with more than four vehicles with ACCs tend to be more unstable than smaller ones due to disturbances and interruptions related to the regularity of a traffic flow [45].
In addition, through specific controlled braking events, it was possible to define all the parameters included in the spacing policy, as well as highlight a new element of the link between vehicle and driver. Fancher et al. (1998), in fact, were able to observe that, in the same test, most drivers had different perceptions and behaviors during the reaction time. For this reason, the innovative identification of the Perception-reaction time allows to add a piece of behavioral analysis in the reaction range, so as to have a complete analysis framework [45,46,47].
To confirm the significance of the study, it was also verified the trend of the results, through a comparison between drivers who had the experience driving with ACC and others who had never used it.
2. Methods
A platoon of 80 connected and autonomous vehicles (CAVs), tested in pairs on the road, was equipped through the V-box. This tool allows for recording the kinematic data of vehicles in particular speed, acceleration, and position. The V-Box consists of two high resolution cameras that are inserted inside the vehicle. They have the task of recording the frames related to the road traveled, so as to match the kinematic data to those of location, through the powerful GPS of which it consists (Table 1). By synchronizing both V-boxes in the two consecutive vehicles (V1, in the lead, V2, in the end), it was possible to define some important parameters of analysis:
- Perception Reaction Time (PRT);
- Time Headway (TH);
- Time To Collision (TTC).
After testing the significance of the study of traffic flows, using two cars consecutive at the time [48], was introduced in the vehicle (V2) a visual tracking tool, properly calibrated with the driver.
The mobile eye tracker (ME) consists of two cameras that capture the external environment (scene camera) and the movement of the pupil (eye camera) (Table 1). During the entire test, you can monitor both cameras thanks to the DTU, a display that allows video monitoring. Thanks to the overlapping of the recordings, which allows obtaining a video with the point of view, it was possible to extrapolate the visual data throughout the entire route.
The 10 km route is a separate two-lane road. According to the experimental procedure, the system tested, i.e. the ACC was turned on only for half the route, so as to compare the real and autonomous driving behavior. Once the system is switched ON, various indicators are displayed on the dashboard according to the reciprocal position with the vehicle in front. While driving, the system is able to activate only if the driver of the vehicle does not press either the brake or the accelerator. In this case, the vehicle, in a completely autonomous way, keeps the motion at a speed lower, than the maximum speed selected and automatically adjusts the distance to the vehicle in front based on that indicated. The dashboard interface (Figure 1) shows on the top left the green icon that shows the activation of the system. In particular, the stylized figure of the vehicle with the speedometer confirms the activation of the system; whereas, the three blue lines (7.14 and 21 m respectively) allow the definition of a distance from the previous vehicle set at 21 km. In this way, once the desired cruising speed is reached, it is possible to see speed decreases due to an approach to the previous vehicle.
To further highlight the crucial role of the system, 6 controlled braking events were planned for each couple of vehicles. This has shed light on the effectiveness of the system on the car following model and consequently on traffic flows. In fact, ACC allows modulating the cruise speed with the distance of the previous vehicle, avoiding sudden stop-and-go phenomena. In relation to the use of the system, different types of drivers have been recruited: 40 drivers who have used the ACC for at least 3 months (Mean-age = 45.81 years; Range: 35÷50; SD = 6.02) and 40 who have never used it (Mean-age = 40,84 years; Range: 35÷55; SD = 5.57); these were called ‘ACC-Skilled’ and ‘Inexpert’ respectively [15].
2.1. Speed Trend: The Times of Analysis
The use of the V-box allowed tracking of the speed. During the controlled braking event, it was possible to define two trends:
- deceleration : vl ( ti,s + τ ) < vf (ti,s + τ) (1)
- acceleration : vl (ti,s + τ ) > vf ( ti,s + τ ) (2)
where i is an index of the event, s is the beginning and τ is the next discrete point in the measurement timeline [49].
Figure 2 shows the speed and acceleration trend of V2. By synchronizing the V-boxes, it was possible to trace the reaction time (RT) within the braking event. It is enclosed within the range:
- TL (blue line), indicating the braking of vehicle V1, when the Led stop appeared;
- TB (grey line), which is the effective braking moment of vehicle V2, coinciding with the minimum y-acceleration.
In order to create a compendium of kinematic and visual data, the Mobile Eye was introduced. This allowed for reducing this interval of time, providing specific data of the moment when the driver of the V2 vehicle notices the braking.
The moment of fixation (TF) therefore represents the moment at which the cursor is positioned for the first time, after TL time, on V1 vehicle stop lamps (Figure 3). This interval, defined as the reaction-perception time (PRT), therefore allows the specific interval of reaction to the braking event to be evaluated.
The availability of the geographical coordinates of vehicles V1 and V2 allowed the evaluation of the relative distance between them, using the Haversine formula [48]. From this data, it was also possible to define:
1. Time to Collision (TTC), the time that elapses before two vehicles collide if the trajectories and speeds remain constant [49]. TTC is calculated as follows:
| (3) | d is the distance between vehicles V1 and V2 [m]; v2 is the vehicle V2 speed [m/s]; v1 is the vehicle V1 speed [m/s]. |
2. Time Headway (TH), the time between the passage of two vehicles at the same point [49]. TH is expressed as:
| (4) | d is the distance between vehicles V1 and V2 [m];v2 is vehicle V2 speed [m/s]. |
In literature, the point from which the distance of the two indicators is calculated refers to the front bumper of the two vehicles [49]; whereas in our study the position of the GPS sensor was placed in the center of the vehicle, on the roof of the car to use a barycentric position.
3. Results
3.1. The Minimum Distance
The vehicles have achieved a total of 240 controlled braking events, half with the system On. The distance covered for each event differs according to the experience of users with ACC; in fact, inexperts have shorter distances (0.2 km) than of ACC-Skilled (0.3 km). This immediately highlights a different approach to driving, which is confirmed by the minimum distances recorded. As shown in Table 2, ACC-Skilled have high average values, both on and off system. In the first case, in fact, after having set a minimum distance from the previous vehicle of 21 meters, users, knowing how the ACC works, tend to change lanes as soon as they notice a first deceleration, so as to avoid too many speed variations (average = 5 km/h). A different situation, however, appears when the system is turned Off. The difference distance of the events (9.48 meters) underlines the high reduction of space, according to an average speed variation of 15 km/h. In the case of Inexpert, the trend between ACC On and Off is the same, but a substantial decrease in the respective distances is detected. In fact, with the system On, users are just above the minimum distance set by the ACC (21.7 m), as they have a driving behavior that leads to staying behind the vehicle that precedes them, without preferring to overtake a clear lane.
3.2. The Perception-Reaction Time, TH,TTC
Figure 3 shows the values of perception-reaction time, considering the system in On and Off conditions. ACC-Skilled and Inexperienced users reveal very different driving behavior depending on the state of the system. With the On system (Figure 4a), in fact, the Inexperts have PRT (Average=2.1; SD=0.9; p<0.01) lower than the skilled pilots (Average=3.8; SD=1.1; p<0.01), which allows confirming the trend recorded by the minimum distances and the TH. In fact, TH has values above the security limit (1.2 seconds) that are higher for experienced users (Average=1.8 sec; SD=0.08; p<0.03) than those who have never used the system (Average=1.3 sec; SD=0.7; p<0.03). The ACC-Skilled user, in fact, knowing the system, tries to reduce the discomfort related to sudden braking, and changing lanes to keep speed as constant as possible. This also justifies skilled TTC values (Average=9 sec; SD=3.8; p<0.02) well above the critical value of 5 seconds, compared to inexpert users (Average=6 sec; SD=2.3; p<0.04) [32].
The PRT analysis with the Off system (Figure 4b) confirms the tendency of skilled users to have longer times (AVERAGE=2.9; SD=0.6; p<0.01), with an average difference of 1 second (AVERAGE=1.9; SD=0.7; p<0.01). Although there are no dangerous braking events, which record low TTC (TTC skilled=7 sec; TTC Inexpert=6 sec), it is possible to highlight how the TH in for Inexpert is below the limit (Average=0.9; SD=0.07; p<0.01).
The statistical comparison of PRT between the On and Off conditions of the system shows very different maximum and minimum values when the system is On; a trend that decreases with ACC Off. This substantial difference between autonomous and manual driving behavior is not very compatible with a road occupied by both autonomous and manual vehicles [20].
4. Discussion
The trial showed relevant results of analysis of the ACC considering the combined use of the ME and the V-Box. The synchronization and subsequent overlapping of the data, allowed to define of a detailed picture of the operation of CAVs, in relation to controlled braking events, comparing it with manual driving. The combined analysis methodology has made it possible to evaluate the perception-reaction time. It represents the range that elapses between the moment when the individual looks at the LED stop of the car in front of him (TF), to the instant he starts braking. Although the litearture debates the reaction time (TL-TB), that is the time that starts with the previous vehicle's (V1) brakes, to when the vehicle V2 also begins the braking maneuver, the reaction-perception time (TF-TB) represents a step forward in the analysis of driving behavior. In fact, it allows the kinematic data of the vehicle to be linked with human perception. An innovative analysis point is added to the braking reaction interval, extrapolated from the speed and acceleration trend, namely the first visual perception of the previous braking vehicle (TF). TF represents a crucial point of analysis because it makes a quick comparison between experienced and inexperienced users; indeed they are located in very different time points, thus defining intervals of greater and lesser extent. With the system on, ACC-Skilled tends to look at the vehicle braking first; the opposite situation for inexperienced drivers who are watching it late. Indeed Inexperts, not knowing the functioning of the system, fix mainly the dashboard to check the correct function of the ACC. For Inexperienced users, turning on the ACC and checking the indicators on the dashboard is distracting, as the results show.
When the system is switched Off, the trend is confirmed, however, showing a decrease in the average values of PRTs. This result denotes a decrease in perception-reaction time when the system is turned Off, thus a faster response to dangerous situations. This factor, therefore linked to the manual driving of vehicles, underlines a first substantial difference in traffic flows; in car-following conditions, the control of the system entails wider deceleration curves, compared to the behavior recorded with manual driving. Since with ACC on, users have longer perception-reaction times, this means that they trust the self-driving vehicle, rely on its proper operation and feel safe.
In relation to these results, a further assessment was made, namely whether driving the vehicle first with the system On or Off led to variations. It has emerged that users who have driven first with the system operative and then with the system turned Off, kept longer minimum distances. This driving behavior shows how the use of the system had instructed them to have greater respect for the rules of the road, therefore increasing driving safety.
The TH and TTC underline another important behavioral element i.e. the tendency of experienced users to change lanes during braking, so as to reduce the discomfort related to the change in speed. Having already become familiar with the driver assistance system on a daily basis, ACC-Skilled are accustomed to changing lanes immediately after the vehicle first brakes Both analysis factors record averages above critical values, except for Inexpert when the system is shut down. Only in this case, in fact, a time headway is recorded just below the limit, as the time interval between the passage in the same point of two successive vehicles is equal to 0.9 seconds. However, having no low TTC, it is possible to define such a situation without possible collisions. Another important finding, which could explain the tendency to maintain safety distances higher than critical values, is the average speed maintained during the trial. The average speed maintained during experimentation, both with ACC on and ACC off, by skilled users is between 67 km/h and 70 km/h, while by inexperienced users is between 61/62 km/h. Since the required speed limit on the experiment road is 90 km/h, users were particularly careful about the speed limit, maintaining a speed much lower than the limit speed. Maintaining a low speed has certainly helped drivers keep minimum safety distances under control. In addition, a limited speed allows the driver to avoid hard lane changes. In fact, the driver, by maintaining a low speed, is able to check whether the lane the driver intends to occupy is clear of other vehicles, check that the vehicle in front has not signaled the start of the same maneuver, and then assesses the possibility of performing the turning maneuver, and subsequently decelerating continuously and slowly perform the turning maneuver without hard braking.
5. Conclusion
In the field of road safety, it is of particular importance to deal with research focused on the braking maneuver, since it appears to be one of the most difficult maneuvers. Its difficulty resides in the ability to instantly consider all the factors that influence it. In fact it is influenced by the slope of the road section, the adherence of the wheels with the road surface. In this research, another factor that can influence it has been considered, which is the experience. The complex action of braking explains why one of the first driver assistance systems were designed precisely to help with that maneuver.
The ACC is confirmed as a driver assistance system that holds the record in the first level of automation. An autonomous car, that is a car that can drive itself, is able to detect its surroundings in order to act accordingly and still arrive at its destination. The transition from manual driving to autonous driving certainly has repercussion on the driver’s driving activity.
In fact, it allows a profound change in driving behavior, especially in braking events. It is noticeable that it tends to increase the perception-reaction times of drivers, nevertheless, having deceleration intervals wider than manual driving. Driving characterized by wide deceleration curves indicates continuous and smooth driving, free from hard braking. Ride comfort is closely related to safety, which is expressed through good driving performance. Moreover, from the experimentation with ACC on, higher values of TH and TTC were obtained than the performance with ACC off, so as to reduce the risk of accidents between vehicles. As mentioned earlier, these factors, therefore, highlight a substantial behavioral difference on the road between autonomous and manual driving.
Author Contributions
E.M.A: formal analysis, data curation; V.V. and C.L.: conceptualization; E.M.A, and C.B.: methodology, writing—original draft; V.V.: writing—review and editing; C.L. and V.V.: investigation, supervision. All authors have read and agreed to the published version of the manuscript.
Funding
This research received no external funding.
Conflicts of Interest
The authors declare no conflict of interest.
References
- Vignali, V.; Cuppi, F.; Acerra, E.; Bichicchi, A.; Lantieri, C.; Simone, A.; Costa, M. Effects of median refuge island and flashing vertical sign on conspicuity and safety of unsignalized crosswalks. Transp. Res. Part F: Traffic Psychol. Behav. 2019, 60, 427–439. [Google Scholar] [CrossRef]
- Ghasemi, N.; Acerra, E.; Vignali, V.; Lantieri, C.; Simone, A.; Imine, H. Road Safety Review update by using innovative technologies to investigate driver behaviour. Transp. Res. Procedia 2020, 45, 368–375. [Google Scholar] [CrossRef]
- Hart, S.G.; Staveland, L.E. Development of NASA-TLX (Task Load Index): Results of empirical and theoretical research. In Advances in Psychology; North-Holland: Amsterdam, The Netherlands, 1988; Volume 52, pp. 139–183. [Google Scholar]
- Meshkati, N. (1988). Toward development of a cohesive model of workload. In Advances in psychology (Vol. 52, pp. 305-314). North-Holland.
- Khan, M.Q.; Lee, S. Gaze and Eye Tracking: Techniques and Applications in ADAS. Sensors 2019, 19, 5540. [Google Scholar] [CrossRef] [PubMed]
- Ziebinski, A.; Cupek, R.; Grzechca, D.; Chruszczyk, L. Review of advanced driver assistance systems (ADAS); AIP Publishing, 2017; p. 120002;
- Makridis, M.; Mattas, K.; Ciuffo, B. Response Time and Time Headway of an Adaptive Cruise Control. An Empirical Characterization and Potential Impacts on Road Capacity. IEEE Trans. Intell. Transp. Syst. 2020, 21, 1677–1686. [Google Scholar] [CrossRef]
- Szymanski, P.; Ciuffo, B.; Fontaras, G.; Martini, G.; Pekar, F. The future of road transport in Europe. Environmental implications of automated, connected and low-carbon mobility. Combust. Engines 2021, 186, 3–10. [Google Scholar] [CrossRef]
- Thomopoulos, N.; Givoni, M. The autonomous car—a blessing or a curse for the future of low carbon mobility? An exploration of likely vs. desirable outcomes. Eur. J. Futur. Res. 2015, 3, 1–14. [Google Scholar] [CrossRef]
- Knoop, V.L.; Wang, M.; Wilmink, I.; Hoedemaeker, D.M.; Maaskant, M.; Van der Meer, E.-J. Platoon of SAE Level-2 Automated Vehicles on Public Roads: Setup, Traffic Interactions, and Stability. Transp. Res. Rec. J. Transp. Res. Board 2019, 2673, 311–322. [Google Scholar] [CrossRef]
- Moujahid, A. , Tantaoui, M. E., Hina, M. D., Soukane, A., Ortalda, A., ElKhadimi, A., & Ramdane-Cherif, A. (2018, June). Machine learning techniques in ADAS: a review. In 2018 International Conference on Advances in Computing and Communication Engineering (ICACCE) (pp. 235-242). IEEE.
- Davidse, R.J. , 2006. Older drivers and ADAS-Which Systems Improve Road Safety?, Mobility for the elderly 6 iatss research.
- Masello, L.; Castignani, G.; Sheehan, B.; Murphy, F.; McDonnell, K. On the road safety benefits of advanced driver assistance systems in different driving contexts. Transp. Res. Interdiscip. Perspect. 2022, 15. [Google Scholar] [CrossRef]
- Li, L.; Wen, D.; Zheng, N.-N.; Shen, L.-C. Cognitive Cars: A New Frontier for ADAS Research. IEEE Trans. Intell. Transp. Syst. 2012, 13, 395–407. [Google Scholar] [CrossRef]
- Acerra, E. M. , Lantieri, C., Simone, A., Di Flumeri, G., Borghini, G., Babiloni, F., Vignali, V., 2022. The Impact of the Adaptive Cruise Control on the Drivers’ Workload and Attention. Available at SSRN 4281921.
- Rudin-Brown, C.M.; Parker, H.A. Behavioural adaptation to adaptive cruise control (ACC): implications for preventive strategies. Transp. Res. Part F: Traffic Psychol. Behav. 2004, 7, 59–76. [Google Scholar] [CrossRef]
- Lantieri, C.; Costa, M.; Vignali, V.; Acerra, E.M.; Marchetti, P.; Simone, A. Flashing in-curb LEDs and beacons at unsignalized crosswalks and driver’s visual attention to pedestrians during nighttime. Ergonomics 2021, 64, 330–341. [Google Scholar] [CrossRef] [PubMed]
- Ghasemi, N.; Acerra, E.M.; Lantieri, C.; Simone, A.; Rupi, F.; Vignali, V. Urban Mid-Block Bicycle Crossings: The Effects of Red Colored Pavement and Portal Overhead Bicycle Crossing Sign. Coatings 2022, 12, 150. [Google Scholar] [CrossRef]
- Ma, R.; Sheik-Nainar, M.A.; Kaber, D.B. Situation Awareness in Driving While Using Adaptive Cruise Control and a Cell Phone. Proc. Hum. Factors Ergon. Soc. Annu. Meet. 2005, 49, 381–385. [Google Scholar] [CrossRef]
- Ciuffo, B.; Mattas, K.; Makridis, M.; Albano, G.; Anesiadou, A.; He, Y.; Josvai, S.; Komnos, D.; Pataki, M.; Vass, S.; et al. Requiem on the positive effects of commercial adaptive cruise control on motorway traffic and recommendations for future automated driving systems. Transp. Res. Part C: Emerg. Technol. 2021, 130, 103305. [Google Scholar] [CrossRef]
- Makridis, M.; Mattas, K.; Ciuffo, B.; Re, F.; Kriston, A.; Minarini, F.; Rognelund, G. Empirical Study on the Properties of Adaptive Cruise Control Systems and Their Impact on Traffic Flow and String Stability. Transp. Res. Rec. J. Transp. Res. Board 2020, 2674, 471–484. [Google Scholar] [CrossRef]
- Kummetha, V.C. , Schrock, S.D., Mulinazzi, T.E., 2017. Analysis of the Effects of Adaptive Cruise Control (ACC) on Driver Behavior and Awareness Using a Driving Simulator.
- Makridis, M.; Mattas, K.; Anesiadou, A.; Ciuffo, B. OpenACC. An open database of car-following experiments to study the properties of commercial ACC systems. Transp. Res. Part C: Emerg. Technol. 2021, 125, 103047. [Google Scholar] [CrossRef]
- Wu, C.; Xu, Z.; Liu, Y.; Fu, C.; Li, K.; Hu, M. Spacing Policies for Adaptive Cruise Control: A Survey. IEEE Access 2020, 8, 50149–50162. [Google Scholar] [CrossRef]
- Chen, J.; Liang, H.; Li, J.; Lv, Z. Connected Automated Vehicle Platoon Control With Input Saturation and Variable Time Headway Strategy. IEEE Trans. Intell. Transp. Syst. 2021, 22, 4929–4940. [Google Scholar] [CrossRef]
- Swaroop, D.; Rajagopal, K. A review of constant time headway policy for automatic vehicle following. 2001 IEEE Intelligent Transportation Systems. Proceedings. LOCATION OF CONFERENCE, USADATE OF CONFERENCE; pp. 65–69.
- Bazilinskyy, P. , Stapel, J., de Koning, C., 2017. Graded auditory feedback based on headway: An on-road pilot study Which Visual Cues do Drivers Use to Anticipate and Slow Down in Curve Approach?-An Eye-Tracking and Think-Aloud On-road Study View project From Individual Automated Vehicles to Cooperative Traffic Management-Predicting the benefits of automated driving through on-road human behaviour assessment and traffic flow models View project.
- Filzek, B. , & Breuer, B. (2001). Distance behavior on motorways with regard to active safety~ A comparison between adaptive-cruise-control (ACC) and driver (No. 2001-06-0066). SAE Technical Paper.
- Dona, R.; Mattas, K.; He, Y.; Albano, G.; Ciuffo, B. Multianticipation for string stable Adaptive Cruise Control and increased motorway capacity without vehicle-to-vehicle communication. Transp. Res. Part C: Emerg. Technol. 2022, 140. [Google Scholar] [CrossRef]
- Li, P.Y.; Shrivastava, A. Traffic flow stability induced by constant time headway policy for adaptive cruise control vehicles. Transp. Res. Part C: Emerg. Technol. 2002, 10, 275–301. [Google Scholar] [CrossRef]
- Yanakiev, D.; Kanellakopoulos, I. Variable time headway for string stability of automated heavy-duty vehicles. 1995 34th IEEE Conference on Decision and Control. LOCATION OF CONFERENCE, USADATE OF CONFERENCE;
- Hoffmann, E.R.; Mortimer, R.G. Drivers' estimates of time to collision. Accid. Anal. Prev. 1994, 26, 511–520. [Google Scholar] [CrossRef] [PubMed]
- Touran, A.; A Brackstone, M.; McDonald, M. A collision model for safety evaluation of autonomous intelligent cruise control. Accid. Anal. Prev. 1999, 31, 567–578. [Google Scholar] [CrossRef] [PubMed]
- Basak, K.; Hetu, S.N.; Li, Z.; Azevedo, C.L.; Loganathan, H.; Toledo, T.; Xu, R.; Xu, Y.; Peh, L.S.; Ben-Akiva, M. Modeling reaction time within a traffic simulation model. 2013 16th International IEEE Conference on Intelligent Transportation Systems - (ITSC 2013). LOCATION OF CONFERENCE, NetherlandsDATE OF CONFERENCE; pp. 302–309.
- Brunner, J.S.; Makridis, M.A.; Kouvelas, A. Comparing the Observable Response Times of ACC and CACC Systems. IEEE Trans. Intell. Transp. Syst. 2022, 23, 19299–19308. [Google Scholar] [CrossRef]
- Kesting, A.; Treiber, M.; Schönhof, M.; Helbing, D. Adaptive cruise control design for active congestion avoidance. Transp. Res. Part C: Emerg. Technol. 2008, 16, 668–683. [Google Scholar] [CrossRef]
- Patel, R.; Levin, M.W.; Boyles, S.D. Effects of Autonomous Vehicle Behavior on Arterial and Freeway Networks. Transp. Res. Rec. J. Transp. Res. Board 2016, 2561, 9–17. [Google Scholar] [CrossRef]
- Feng, S.; Zhang, Y.; Li, S.E.; Cao, Z.; Liu, H.X.; Li, L. String stability for vehicular platoon control: Definitions and analysis methods. Annu. Rev. Control. 2018, 47, 81–97. [Google Scholar] [CrossRef]
- Kesting, A.; Treiber, M.; Schönhof, M.; Kranke, F.; Helbing, D. Jam-Avoiding Adaptive Cruise Control (ACC) and its Impact on Traffic Dynamics. In Traffic and Granular Flow’05; Springer: Berlin/Heidelberg, Germany, 2007; pp. 633–643. [Google Scholar]
- Makridis, M. , Mattas, K., Borio, D., Giuliani, R., Ciuffo, B., 2018. Estimating reaction time in Adaptive Cruise Control System; Estimating reaction time in Adaptive Cruise Control System, 2018 IEEE Intelligent Vehicles Symposium (IV). [CrossRef]
- Li, S.E.; Zheng, Y.; Li, K.; Wang, J. An overview of vehicular platoon control under the four-component framework. 2015 IEEE Intelligent Vehicles Symposium (IV). LOCATION OF CONFERENCE, South KoreaDATE OF CONFERENCE; pp. 286–291.
- Marsden, G. , McDonald, M., & Brackstone, M. (2001). Towards an understanding of adaptive cruise control. Transportation Research Part C: Emerging Technologies, 9(1), 33-51.
- Droździel, P.; Tarkowski, S.; Rybicka, I.; Wrona, R. Drivers ’reaction time research in the conditions in the real traffic. Open Eng. 2020, 10, 35–47. [Google Scholar] [CrossRef]
- Durrani, U.; Lee, C.; Shah, D. Predicting driver reaction time and deceleration: Comparison of perception-reaction thresholds and evidence accumulation framework. Accid. Anal. Prev. 2021, 149, 105889. [Google Scholar] [CrossRef]
- Fancher, P. , Ervin, R., Sayer, J., Hagan, M., Bogard, S., Mefford, M., & Haugen, J. (1998). Intelligent cruise control field operational test (No. UMTRI-97-11). United States. National Highway Traffic Administration.
- Wang, J.; Rajamani, R. Should Adaptive Cruise-Control Systems be Designed to Maintain a Constant Time Gap Between Vehicles? IEEE Trans. Veh. Technol. 2004, 53, 1480–1490. [Google Scholar] [CrossRef]
- Li, T.; Chen, D.; Zhou, H.; Laval, J.; Xie, Y. Car-following behavior characteristics of adaptive cruise control vehicles based on empirical experiments. Transp. Res. Part B: Methodol. 2021, 147, 67–91. [Google Scholar] [CrossRef]
- Monawar, T.; Bin Mahmud, S.; Hira, A. Anti-theft vehicle tracking and regaining system with automatic police notifying using Haversine formula. 2017 4th International Conference on Advances in Electrical Engineering (ICAEE ). LOCATION OF CONFERENCE, BangladeshDATE OF CONFERENCE; pp. 775–779.
- Vogel, K. A comparison of headway and time to collision as safety indicators. Accid. Anal. Prev. 2002, 35, 427–433. [Google Scholar] [CrossRef] [PubMed]
Figure 1.
Dashboard of the car with ACC On.
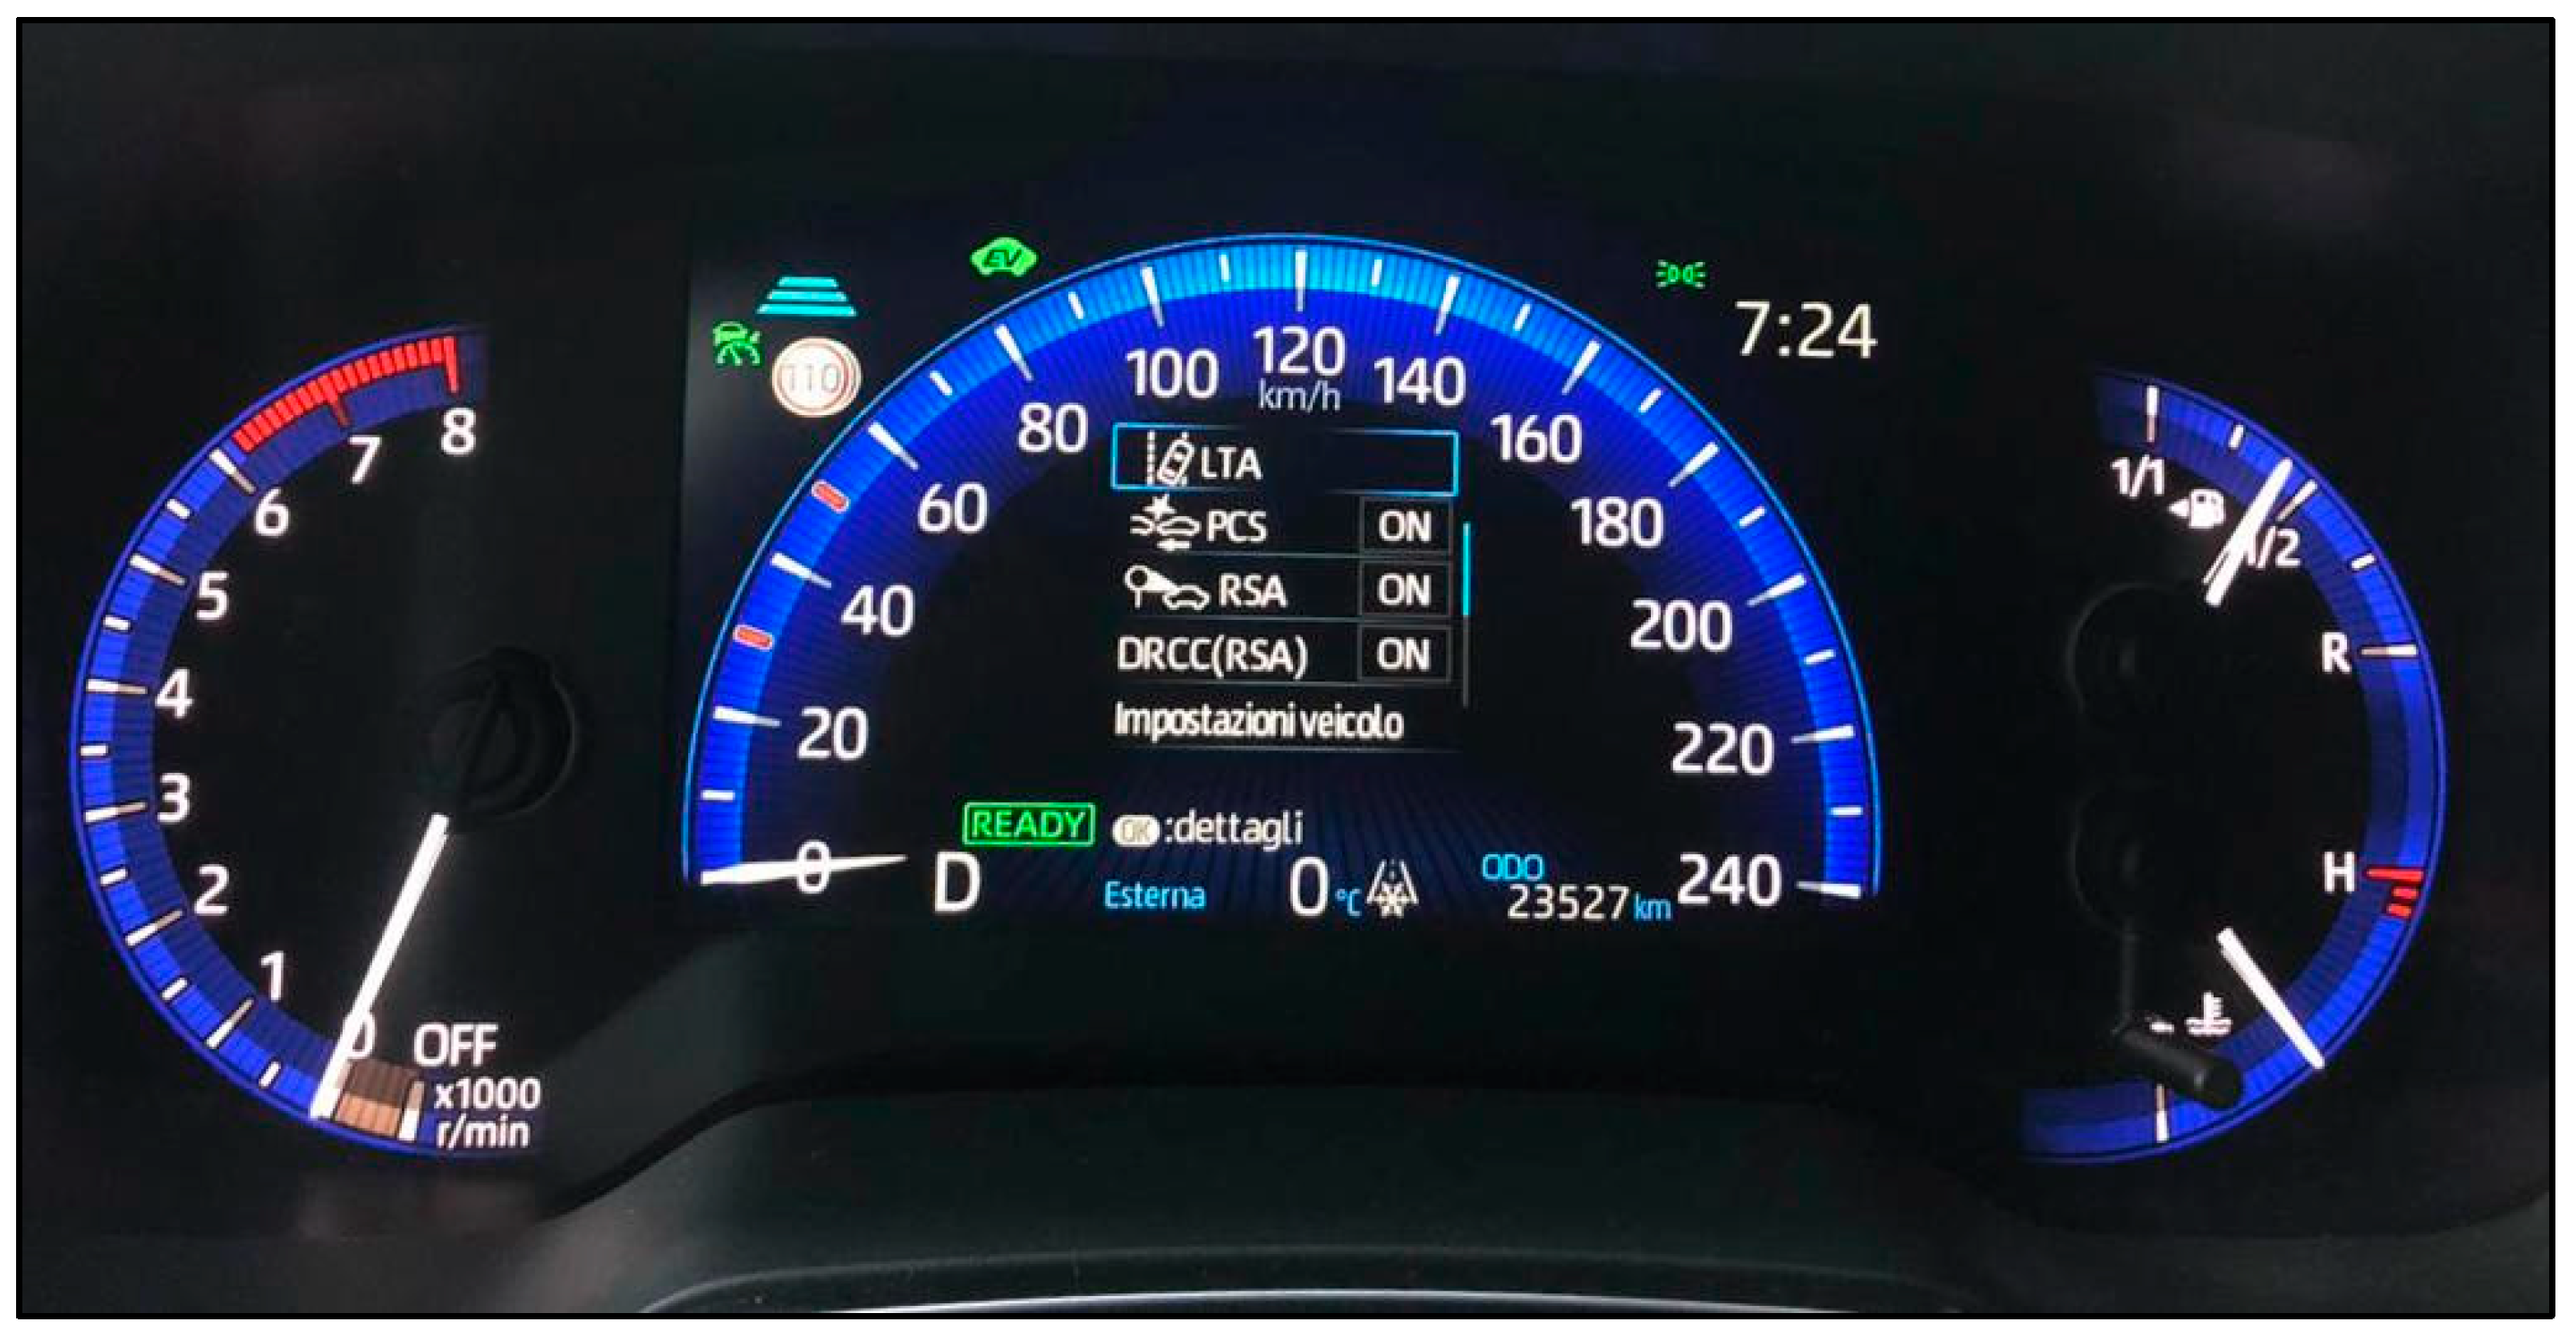
Figure 2.
Range of Perception-Reaction Time. It starts with the green line (TF) and it ends with grey ones (TB).
Figure 2.
Range of Perception-Reaction Time. It starts with the green line (TF) and it ends with grey ones (TB).
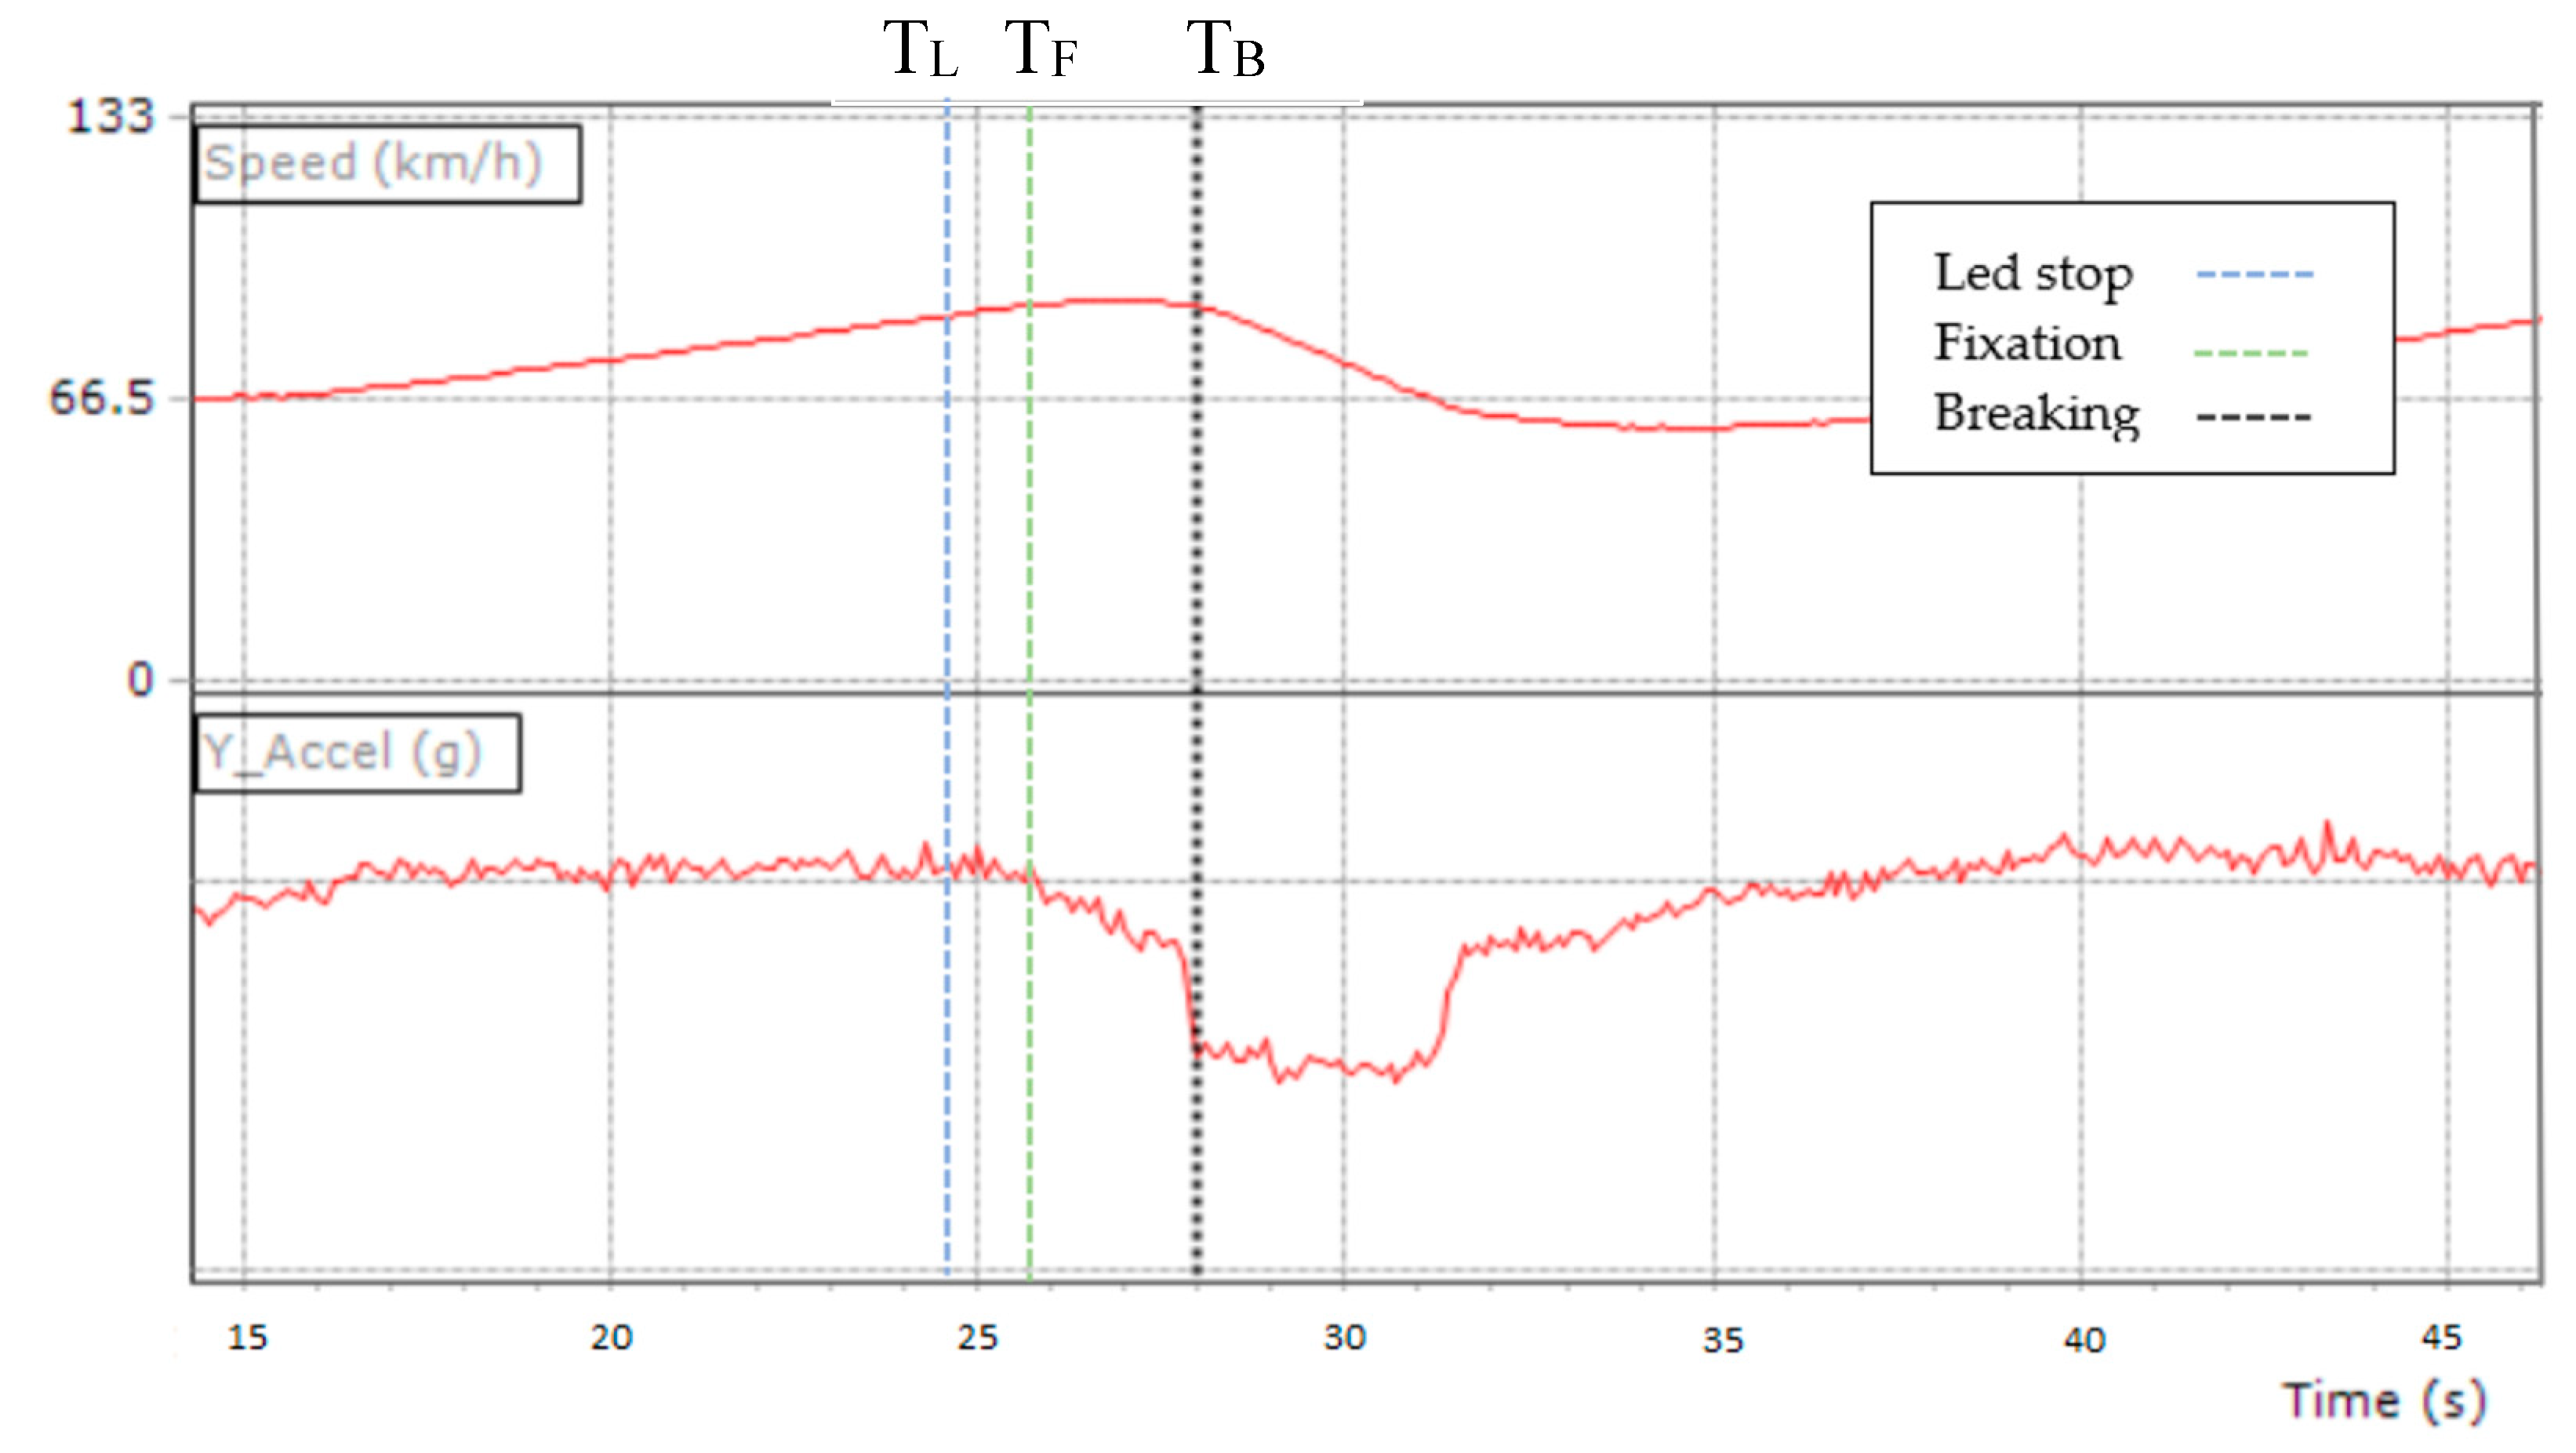
Figure 3.
Output frame of ME which represent the moment of fixation (TF).
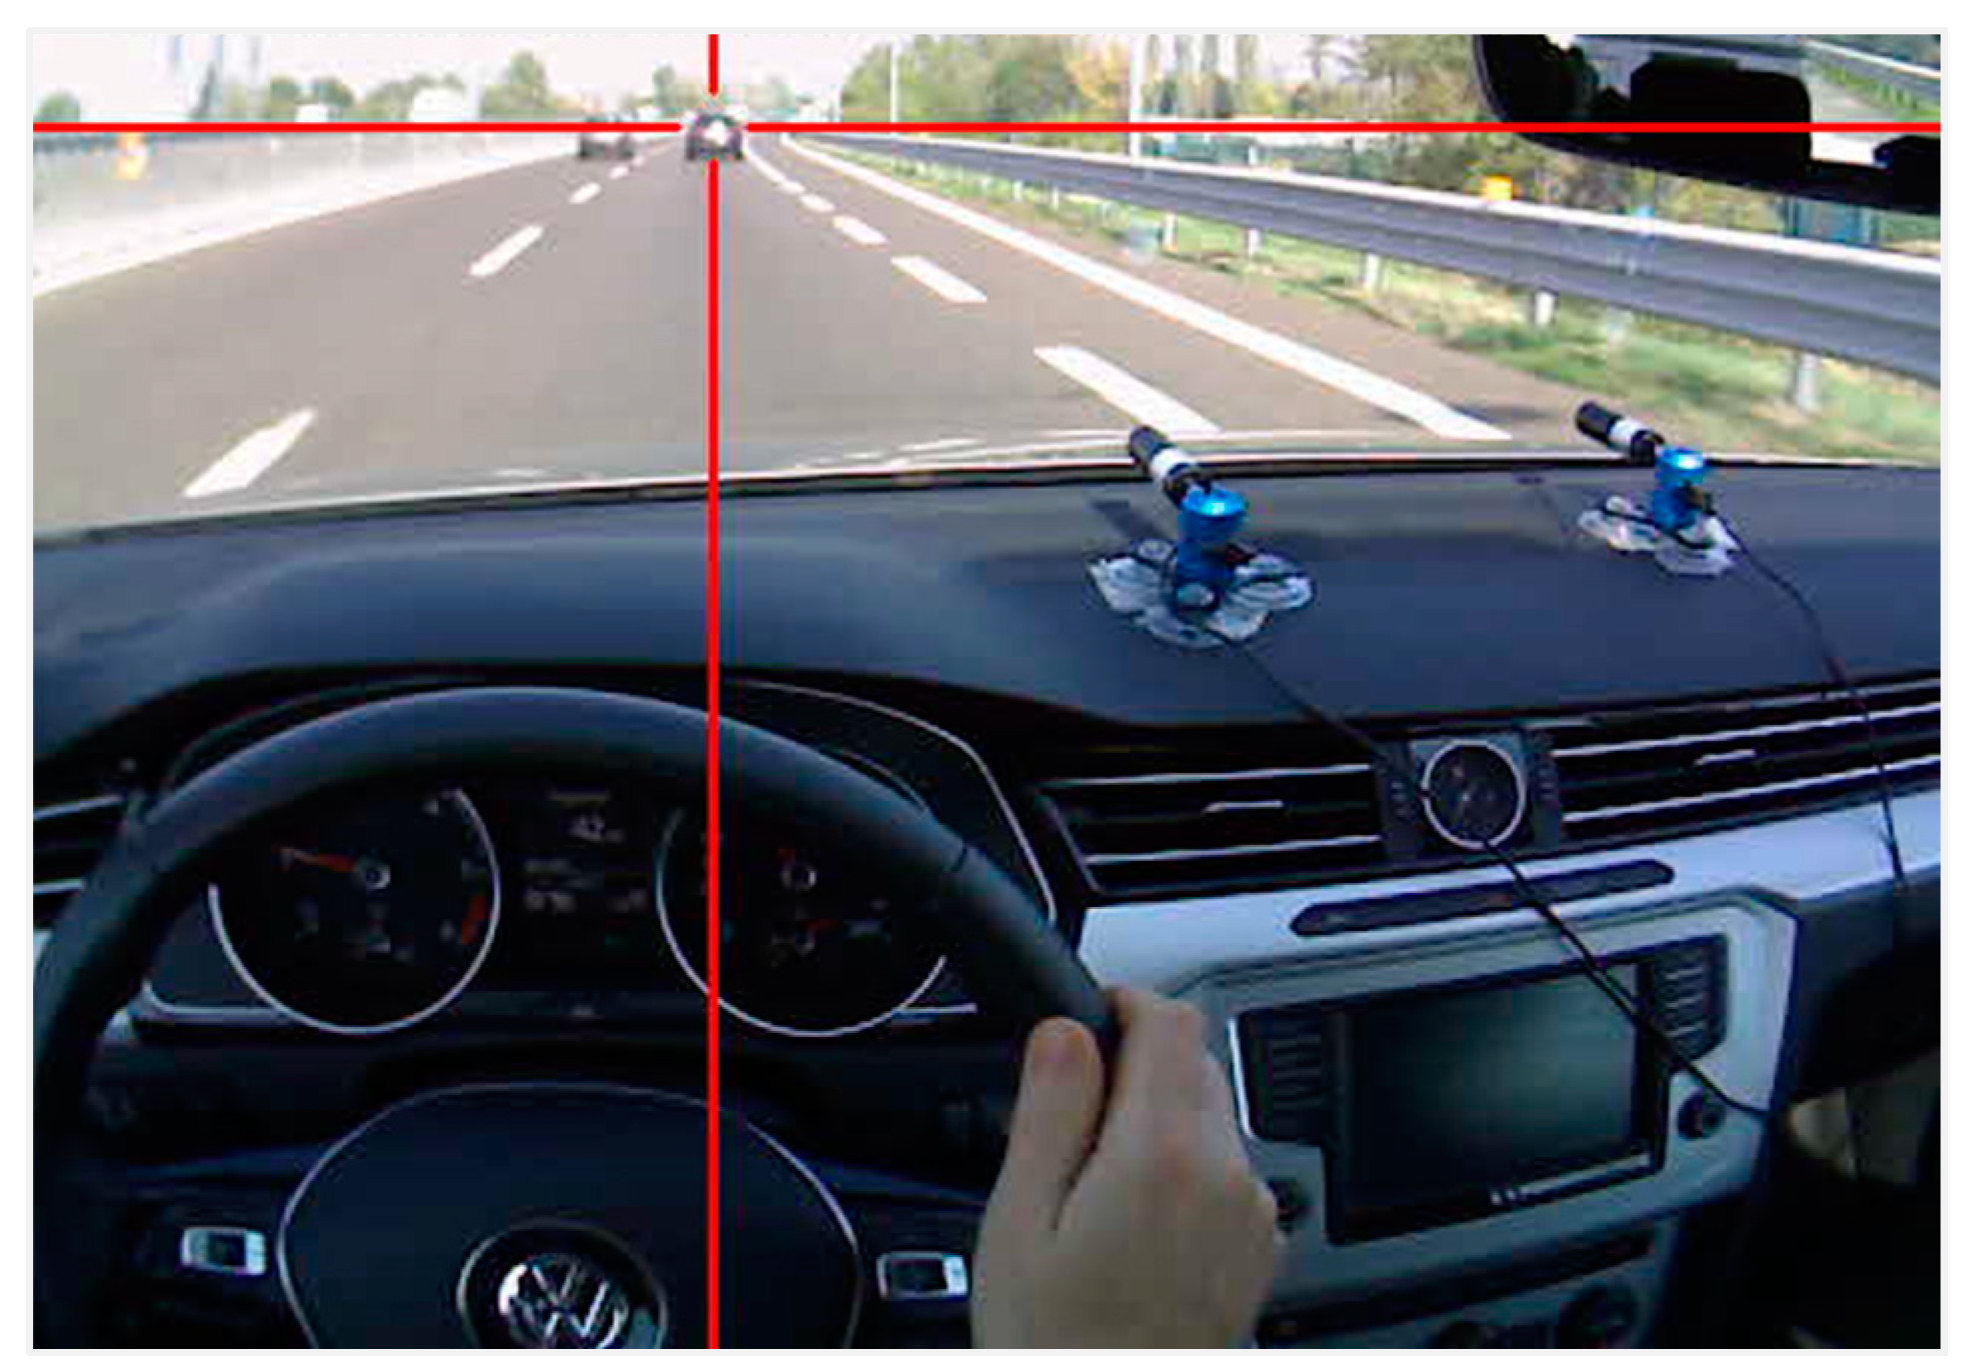
Figure 4.
Statistic evaluation of PRT. (a) Results with ACC On; (b) results with ACC Off.
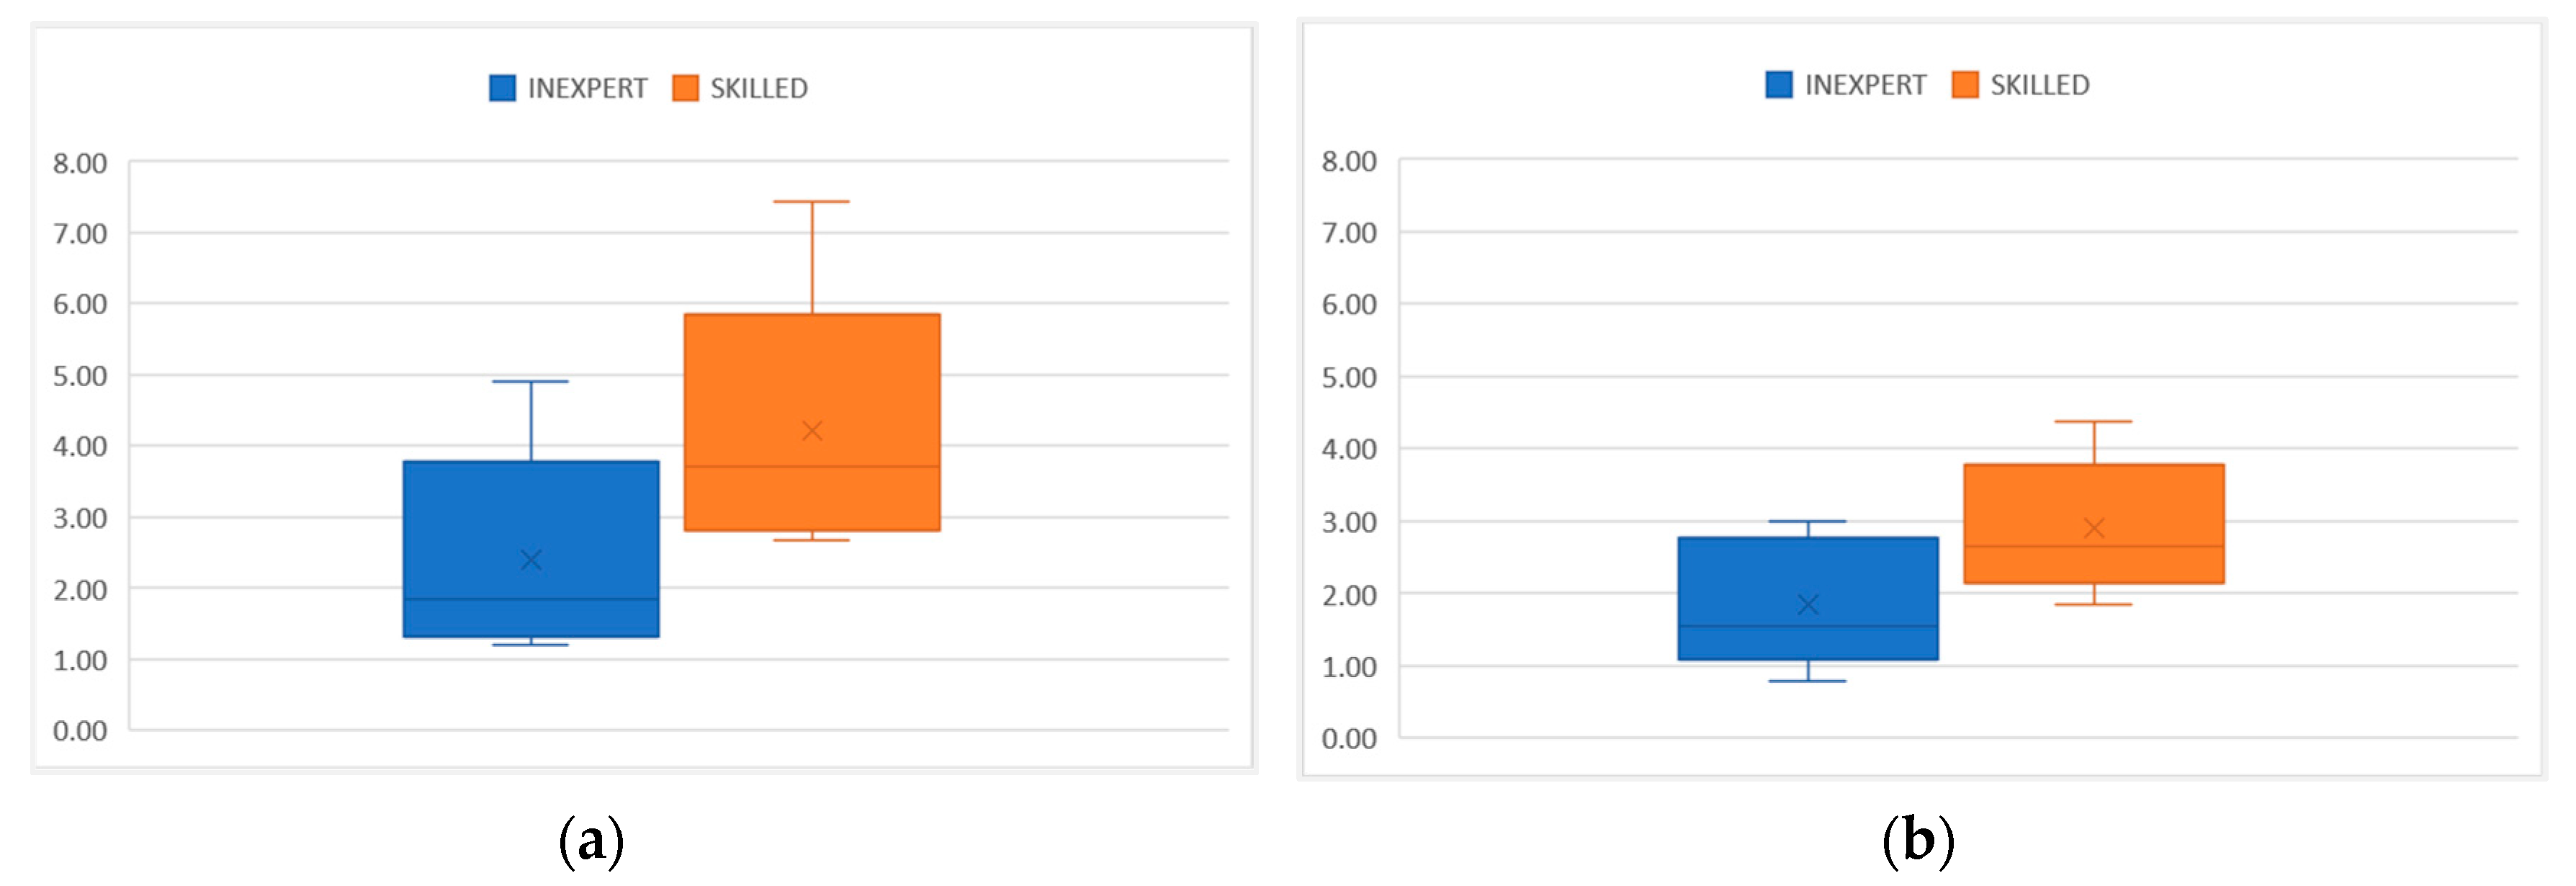

Table 1.
Features of instruments.
| Features | Video V-box | Mobile Eye Tracker |
|---|---|---|
| Accuracy | ± 0,1 km/h | 0.5-1° (approximating the angular width of the fovea) |
| Frame rate | 10 Hz | 30 Hz |
| Components | GPS, Software, IMU | Spectal Mounted Unit (SMU), Display Transmit Unit (DTU), ME PC |
| Camera | 2 cameras | 1 eye camera, 1 scene camera |
Table 2.
The minimum distance in the controlled braking events of inexpert and skilled drivers, considering ACC On and Off.
Table 2.
The minimum distance in the controlled braking events of inexpert and skilled drivers, considering ACC On and Off.
| ACC ON | ACC OFF | |
|---|---|---|
| Inexpert | 21.71 | 16.35 |
| Skilled | 28.34 | 18.86 |
Disclaimer/Publisher’s Note: The statements, opinions and data contained in all publications are solely those of the individual author(s) and contributor(s) and not of MDPI and/or the editor(s). MDPI and/or the editor(s) disclaim responsibility for any injury to people or property resulting from any ideas, methods, instructions or products referred to in the content. |
© 2023 by the authors. Licensee MDPI, Basel, Switzerland. This article is an open access article distributed under the terms and conditions of the Creative Commons Attribution (CC BY) license (http://creativecommons.org/licenses/by/4.0/).
Copyright: This open access article is published under a Creative Commons CC BY 4.0 license, which permit the free download, distribution, and reuse, provided that the author and preprint are cited in any reuse.


