Submitted:
12 January 2023
Posted:
13 January 2023
You are already at the latest version
Abstract
Keywords:
1. Introduction
2. Materials and Methods
2.1. Reagents and Drugs
2.2. Cell Lines, Culture, and Treatment
2.3. Cytotoxicity Assay
2.4. Apoptosis Assay Using Flow Cytometry
2.5. Immunoblotting
2.6. Caspase3/7 Activation Assay
2.7. Reactive Oxygen (ROS) Assay
2.8. Determination of Mitochondria Membrane Potential (MMP)
2.9. Acridine Orange Acidic Vacuole Assay
2.10. Statistical Analysis
3. Results
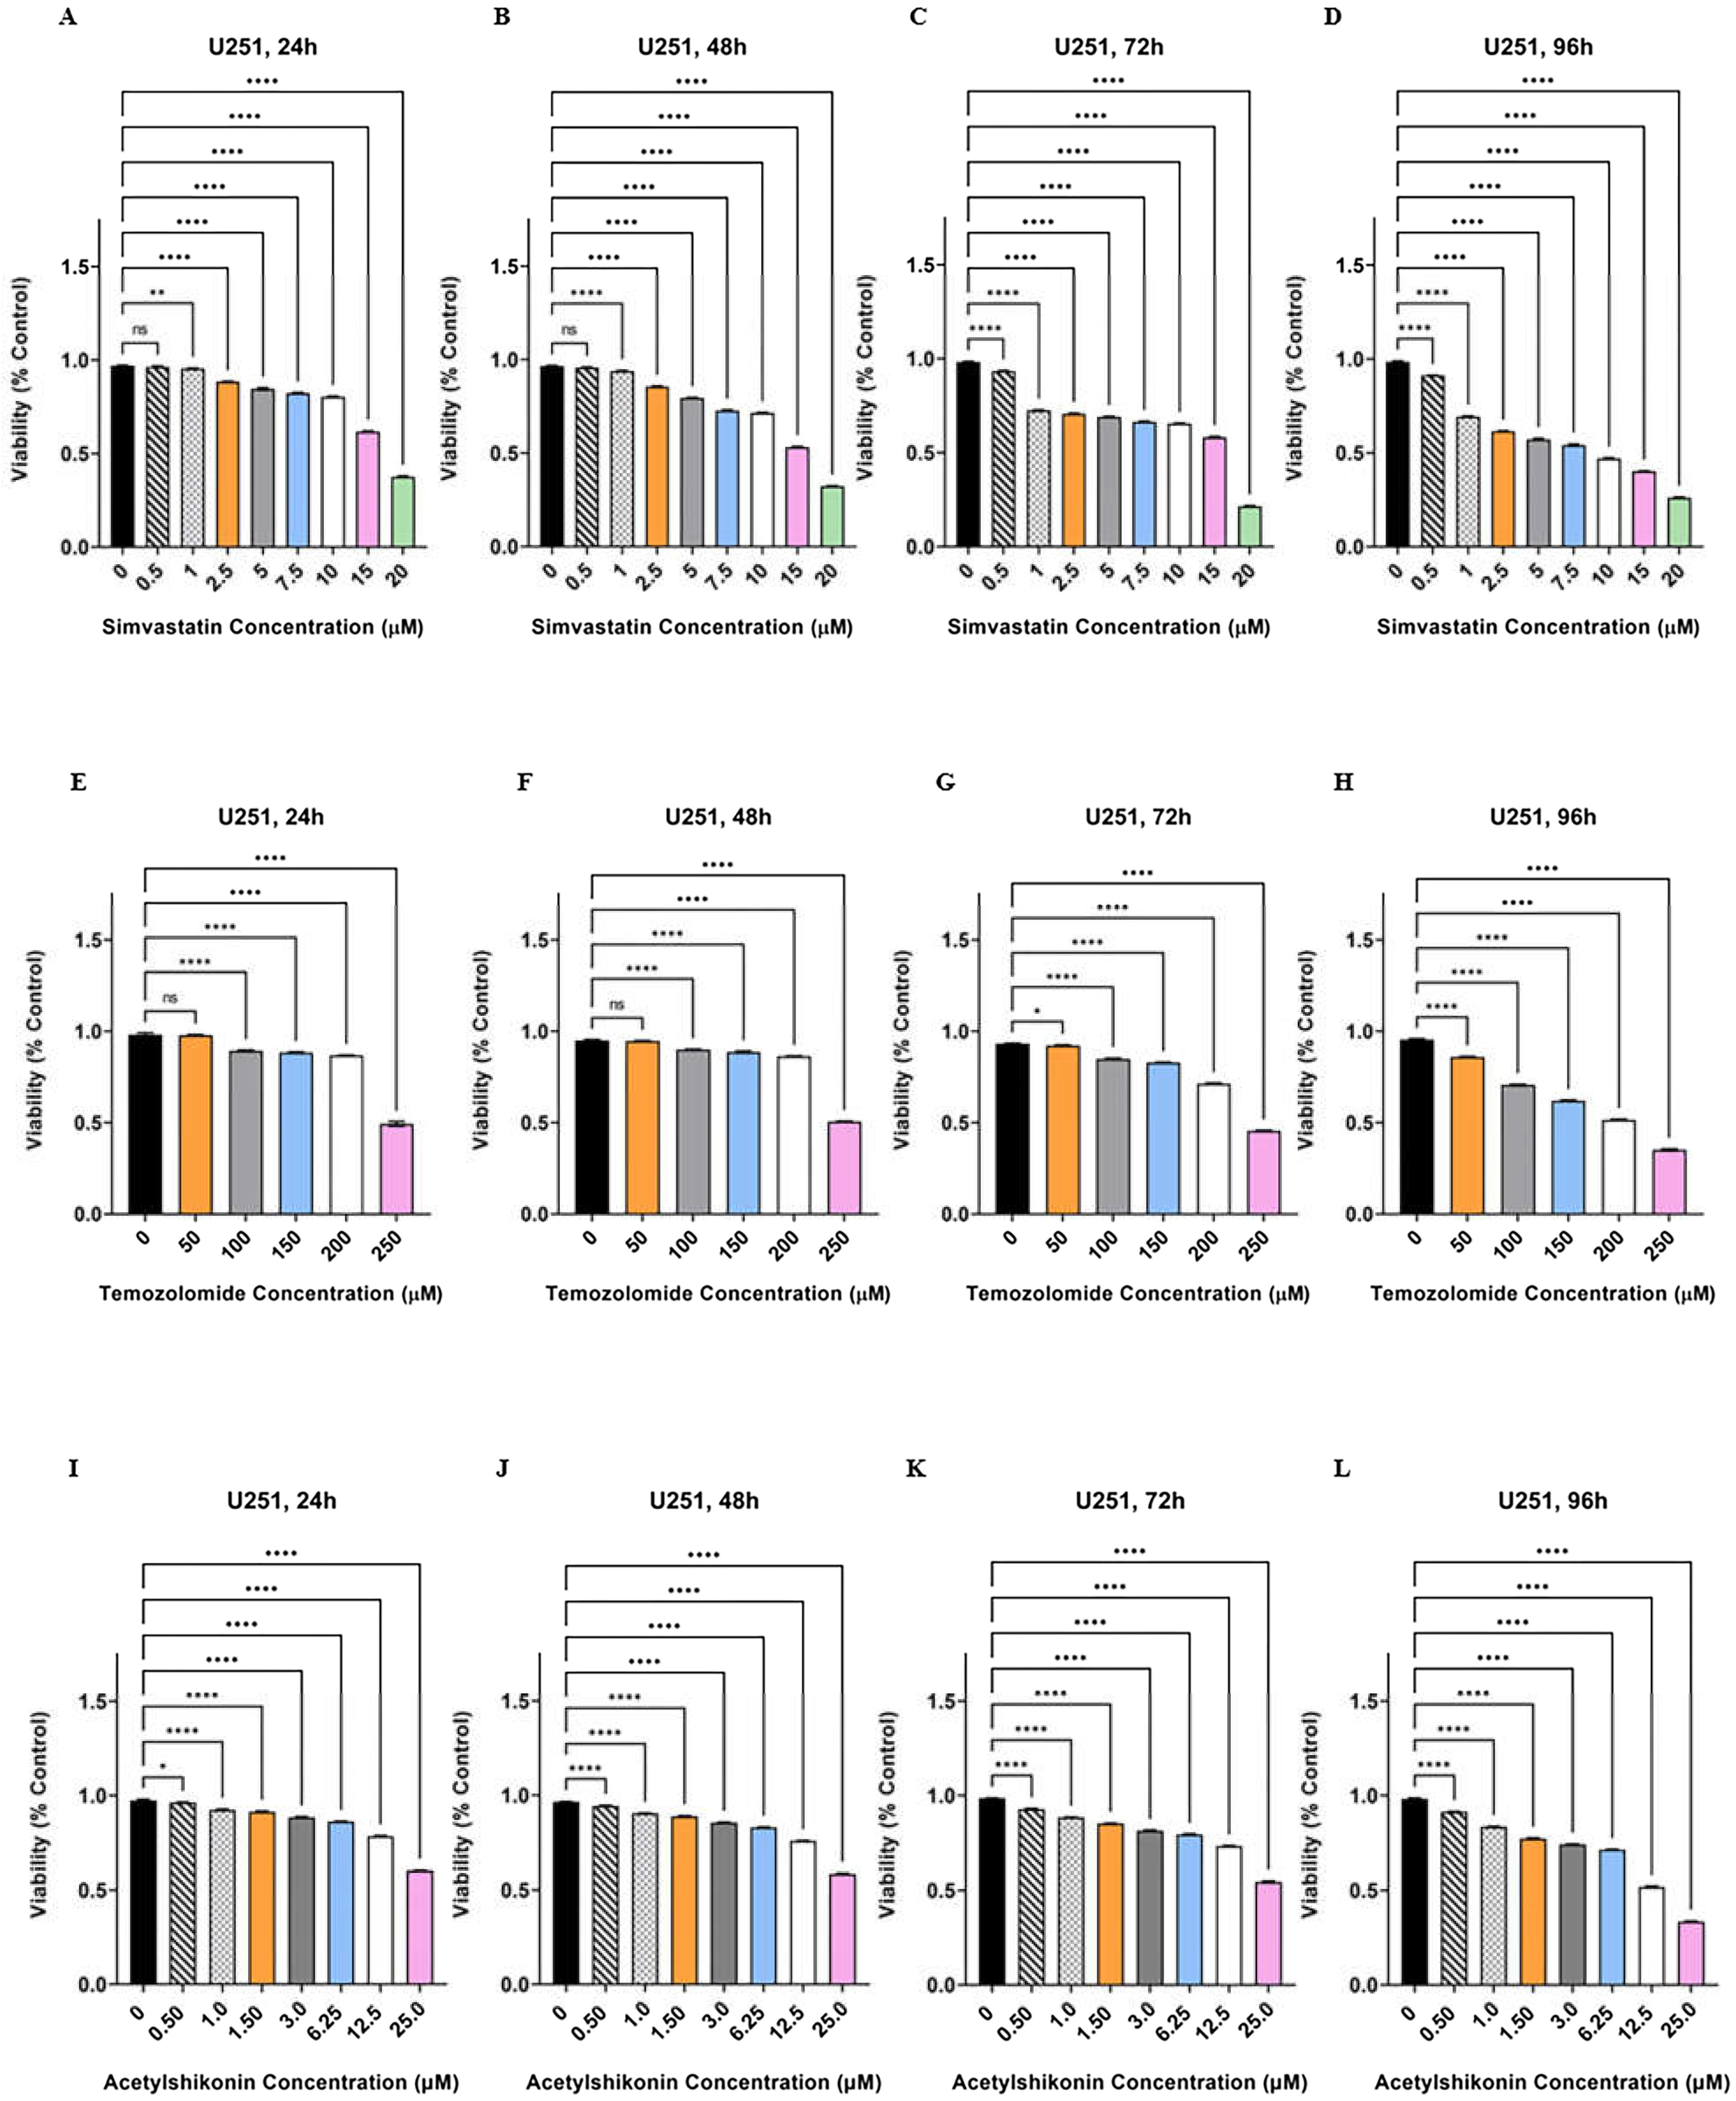
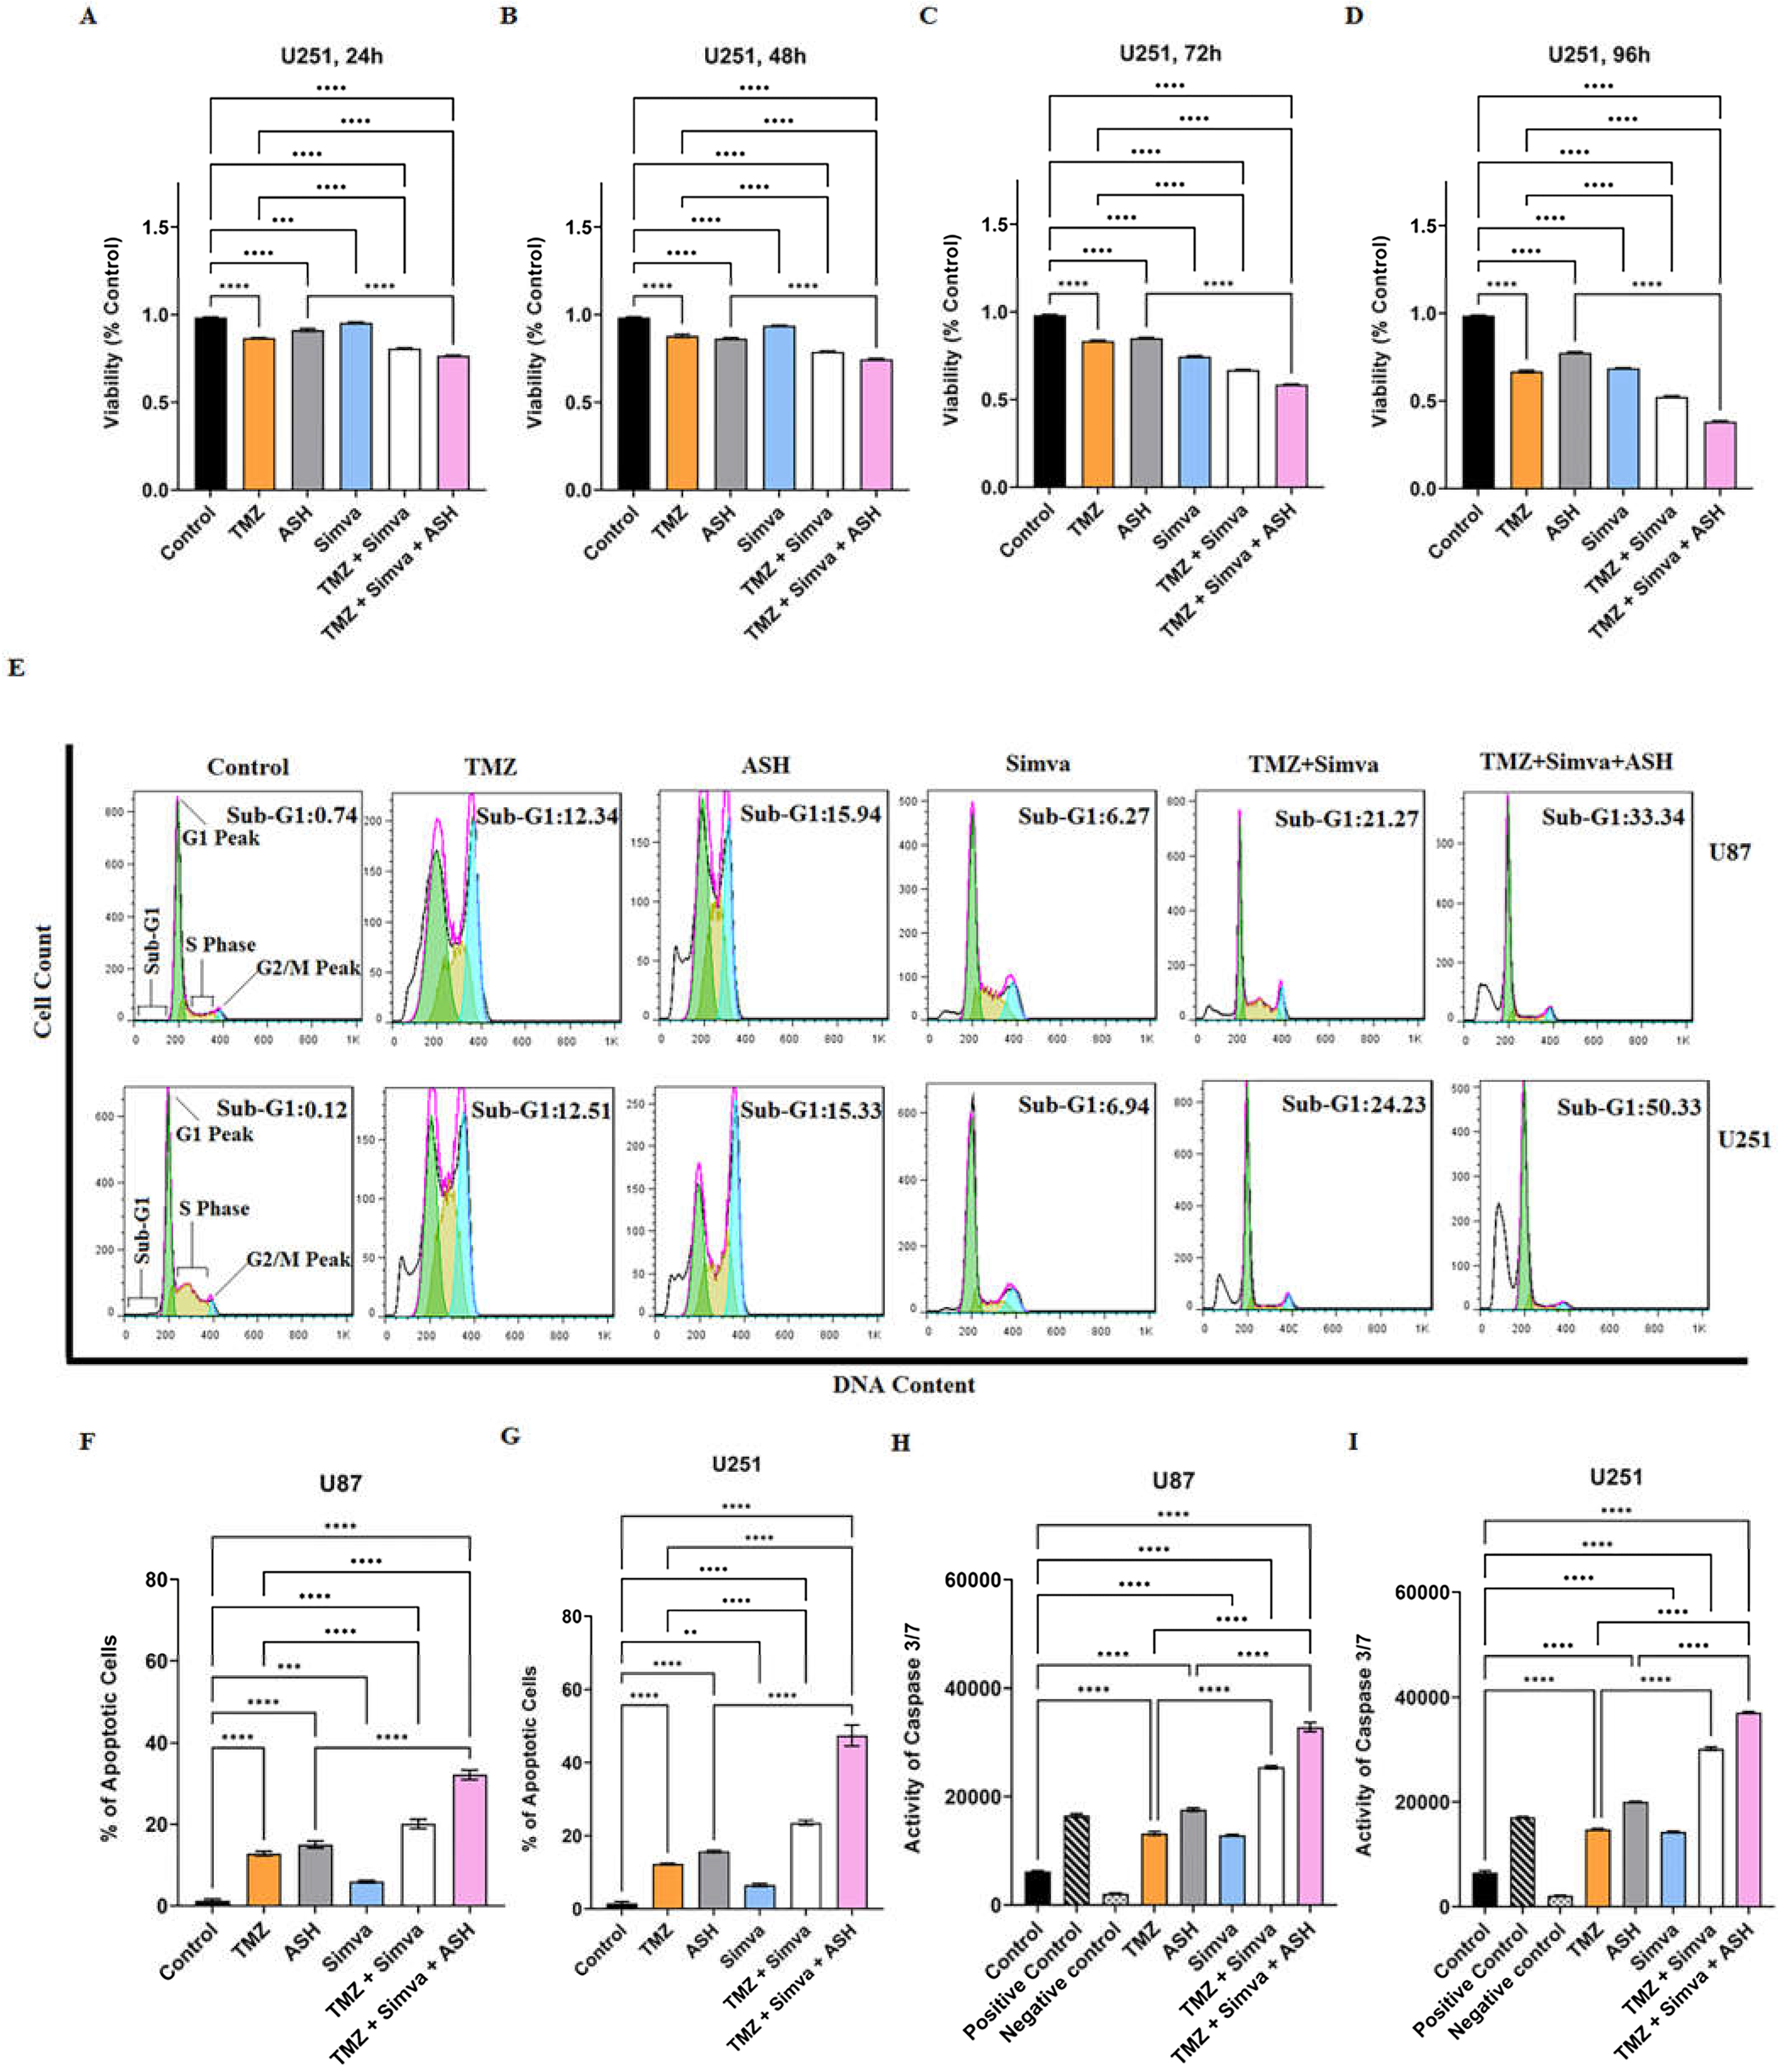
3.1. TMZ/Simva/ASH Combination Treatment Induces More Cell Death Compared to Single Treatment in Human GBM Cells
3.2. TMZ, Simva, ASH, TMZ/Simva and TMZ/Simva/ASH Treatments Induce Caspase-Dependent Apoptosis in GBM Cells
3.3. TMZ, Simva, ASH, TMZ/Simva and TMZ/Simva/ASH Treatments Increase Reactive Oxygen Species and Decrease Mitochondrial Membrane Potential in GBM Cells
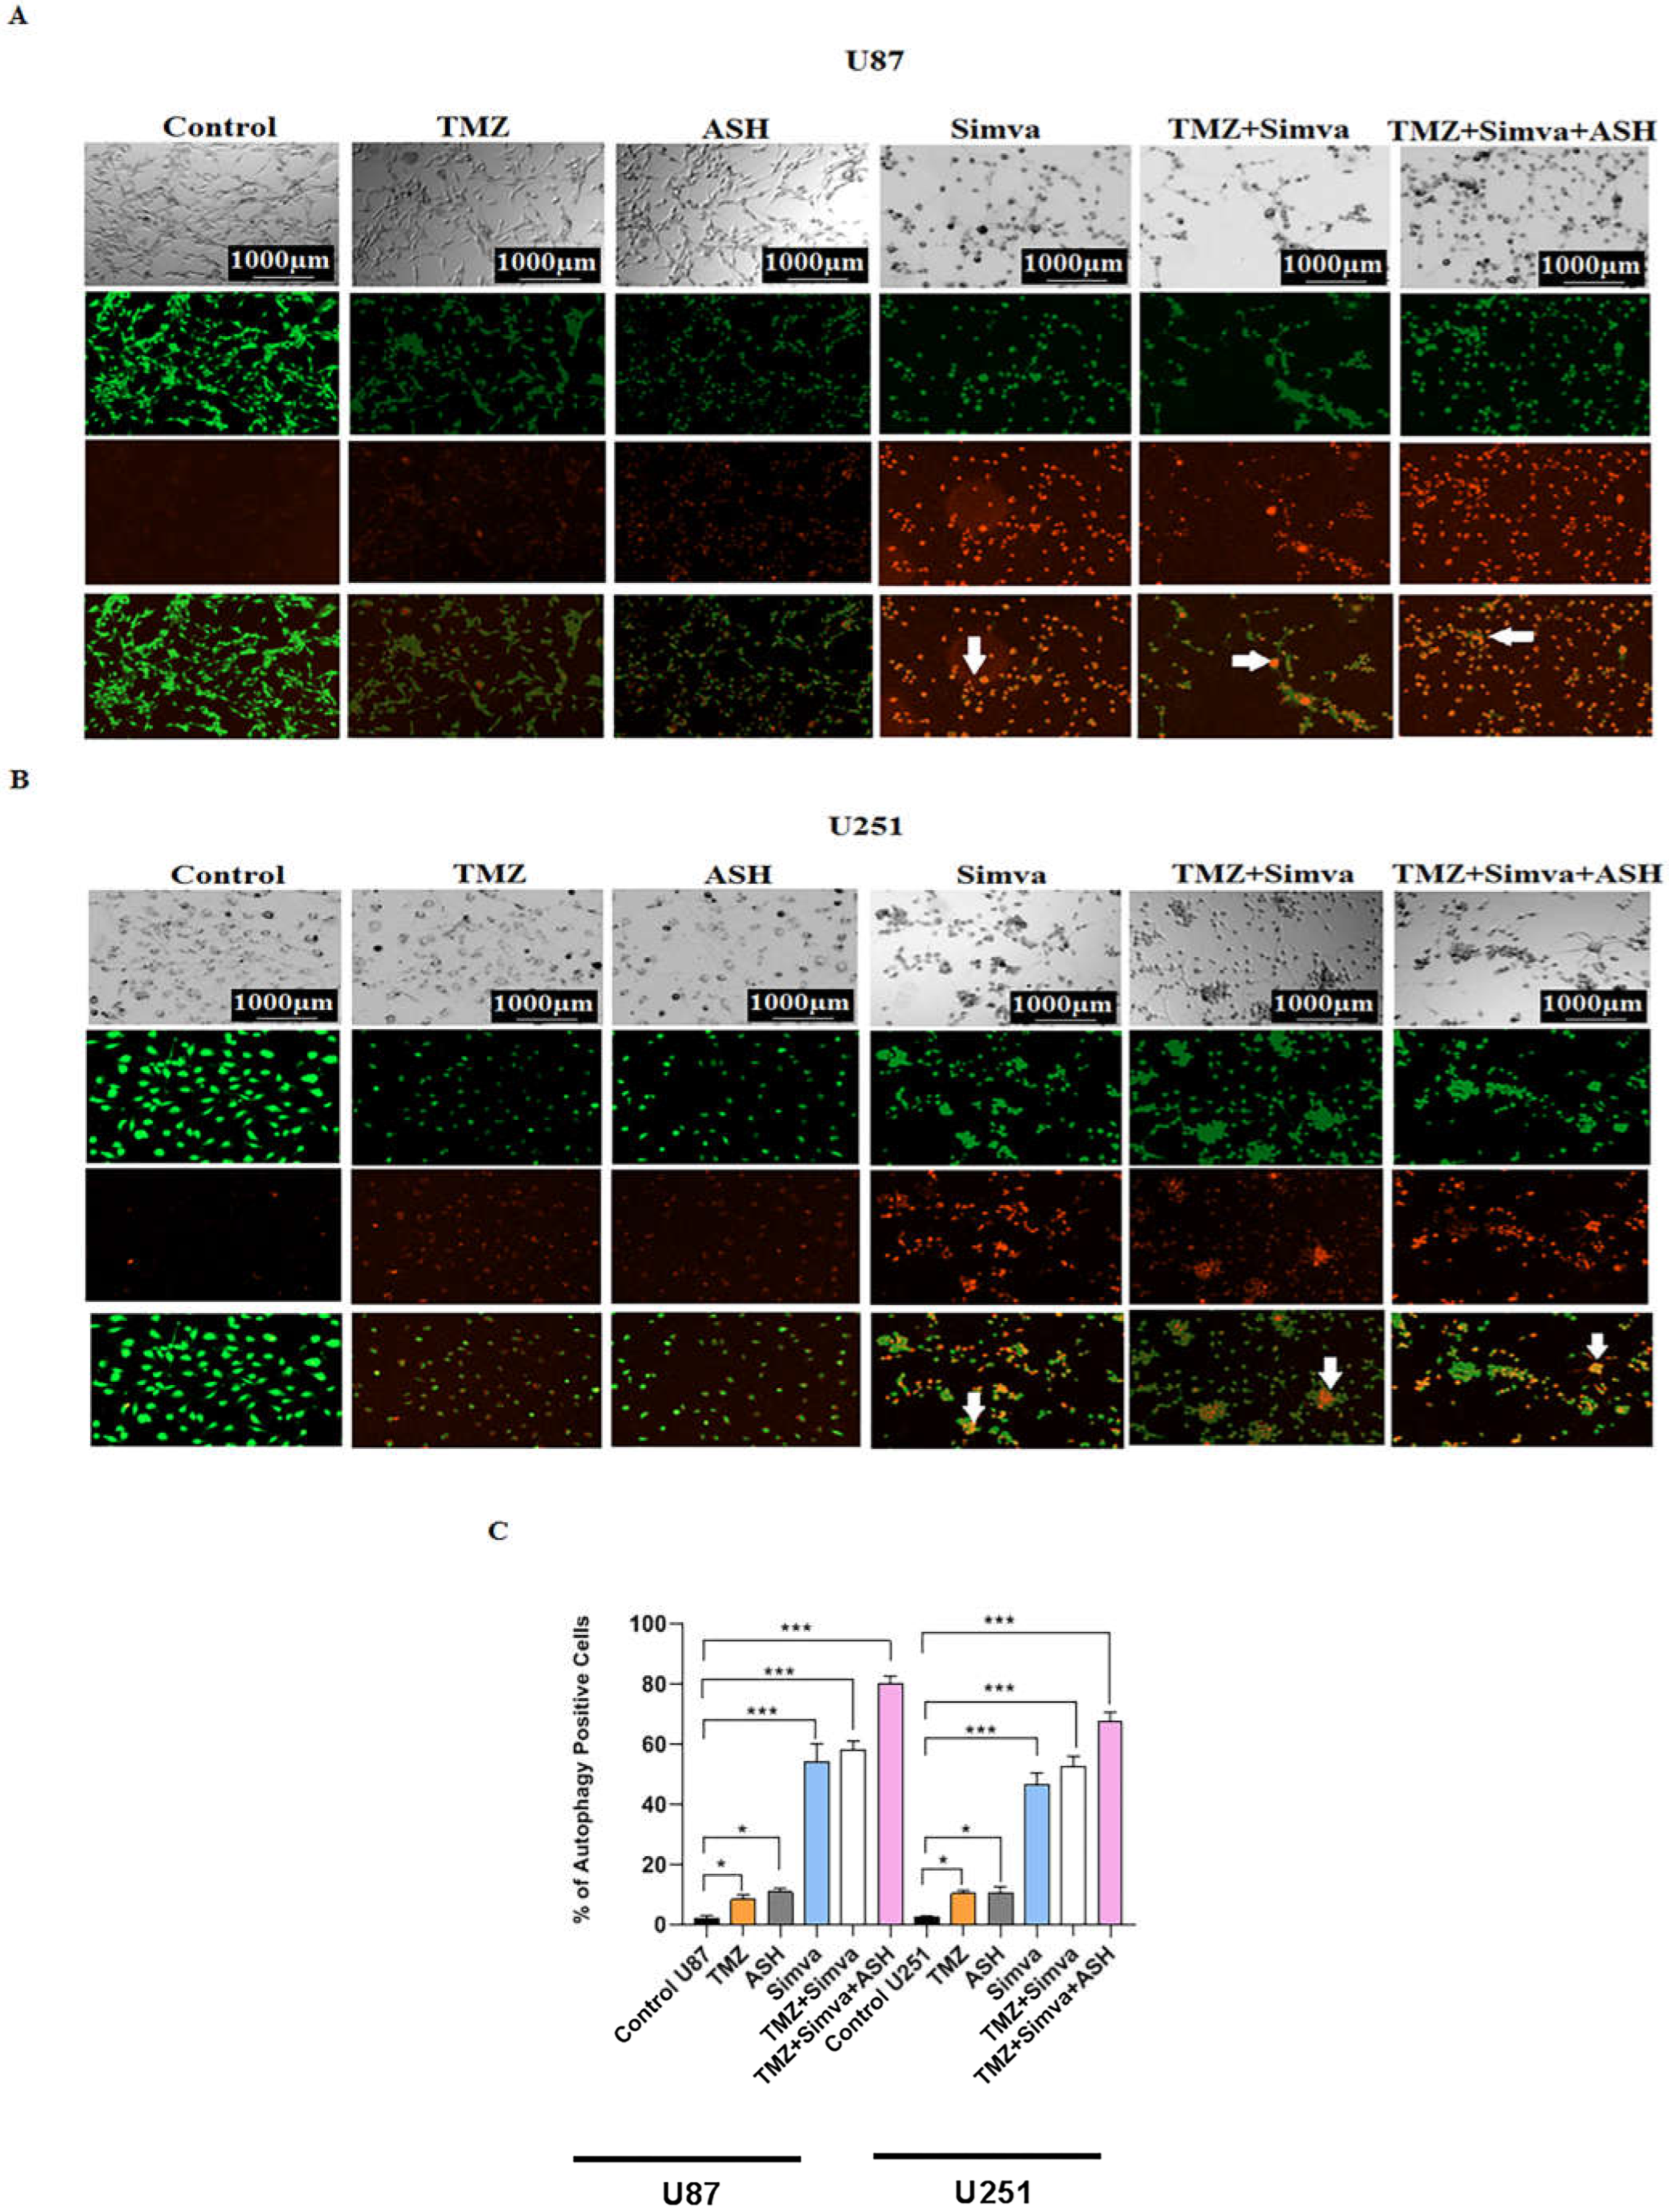
3.4. The Impact of TMZ, Simva, ASH, TMZ/Simva and TMZ/Simva/ASH Treatments on Autophagy in GBM Cells
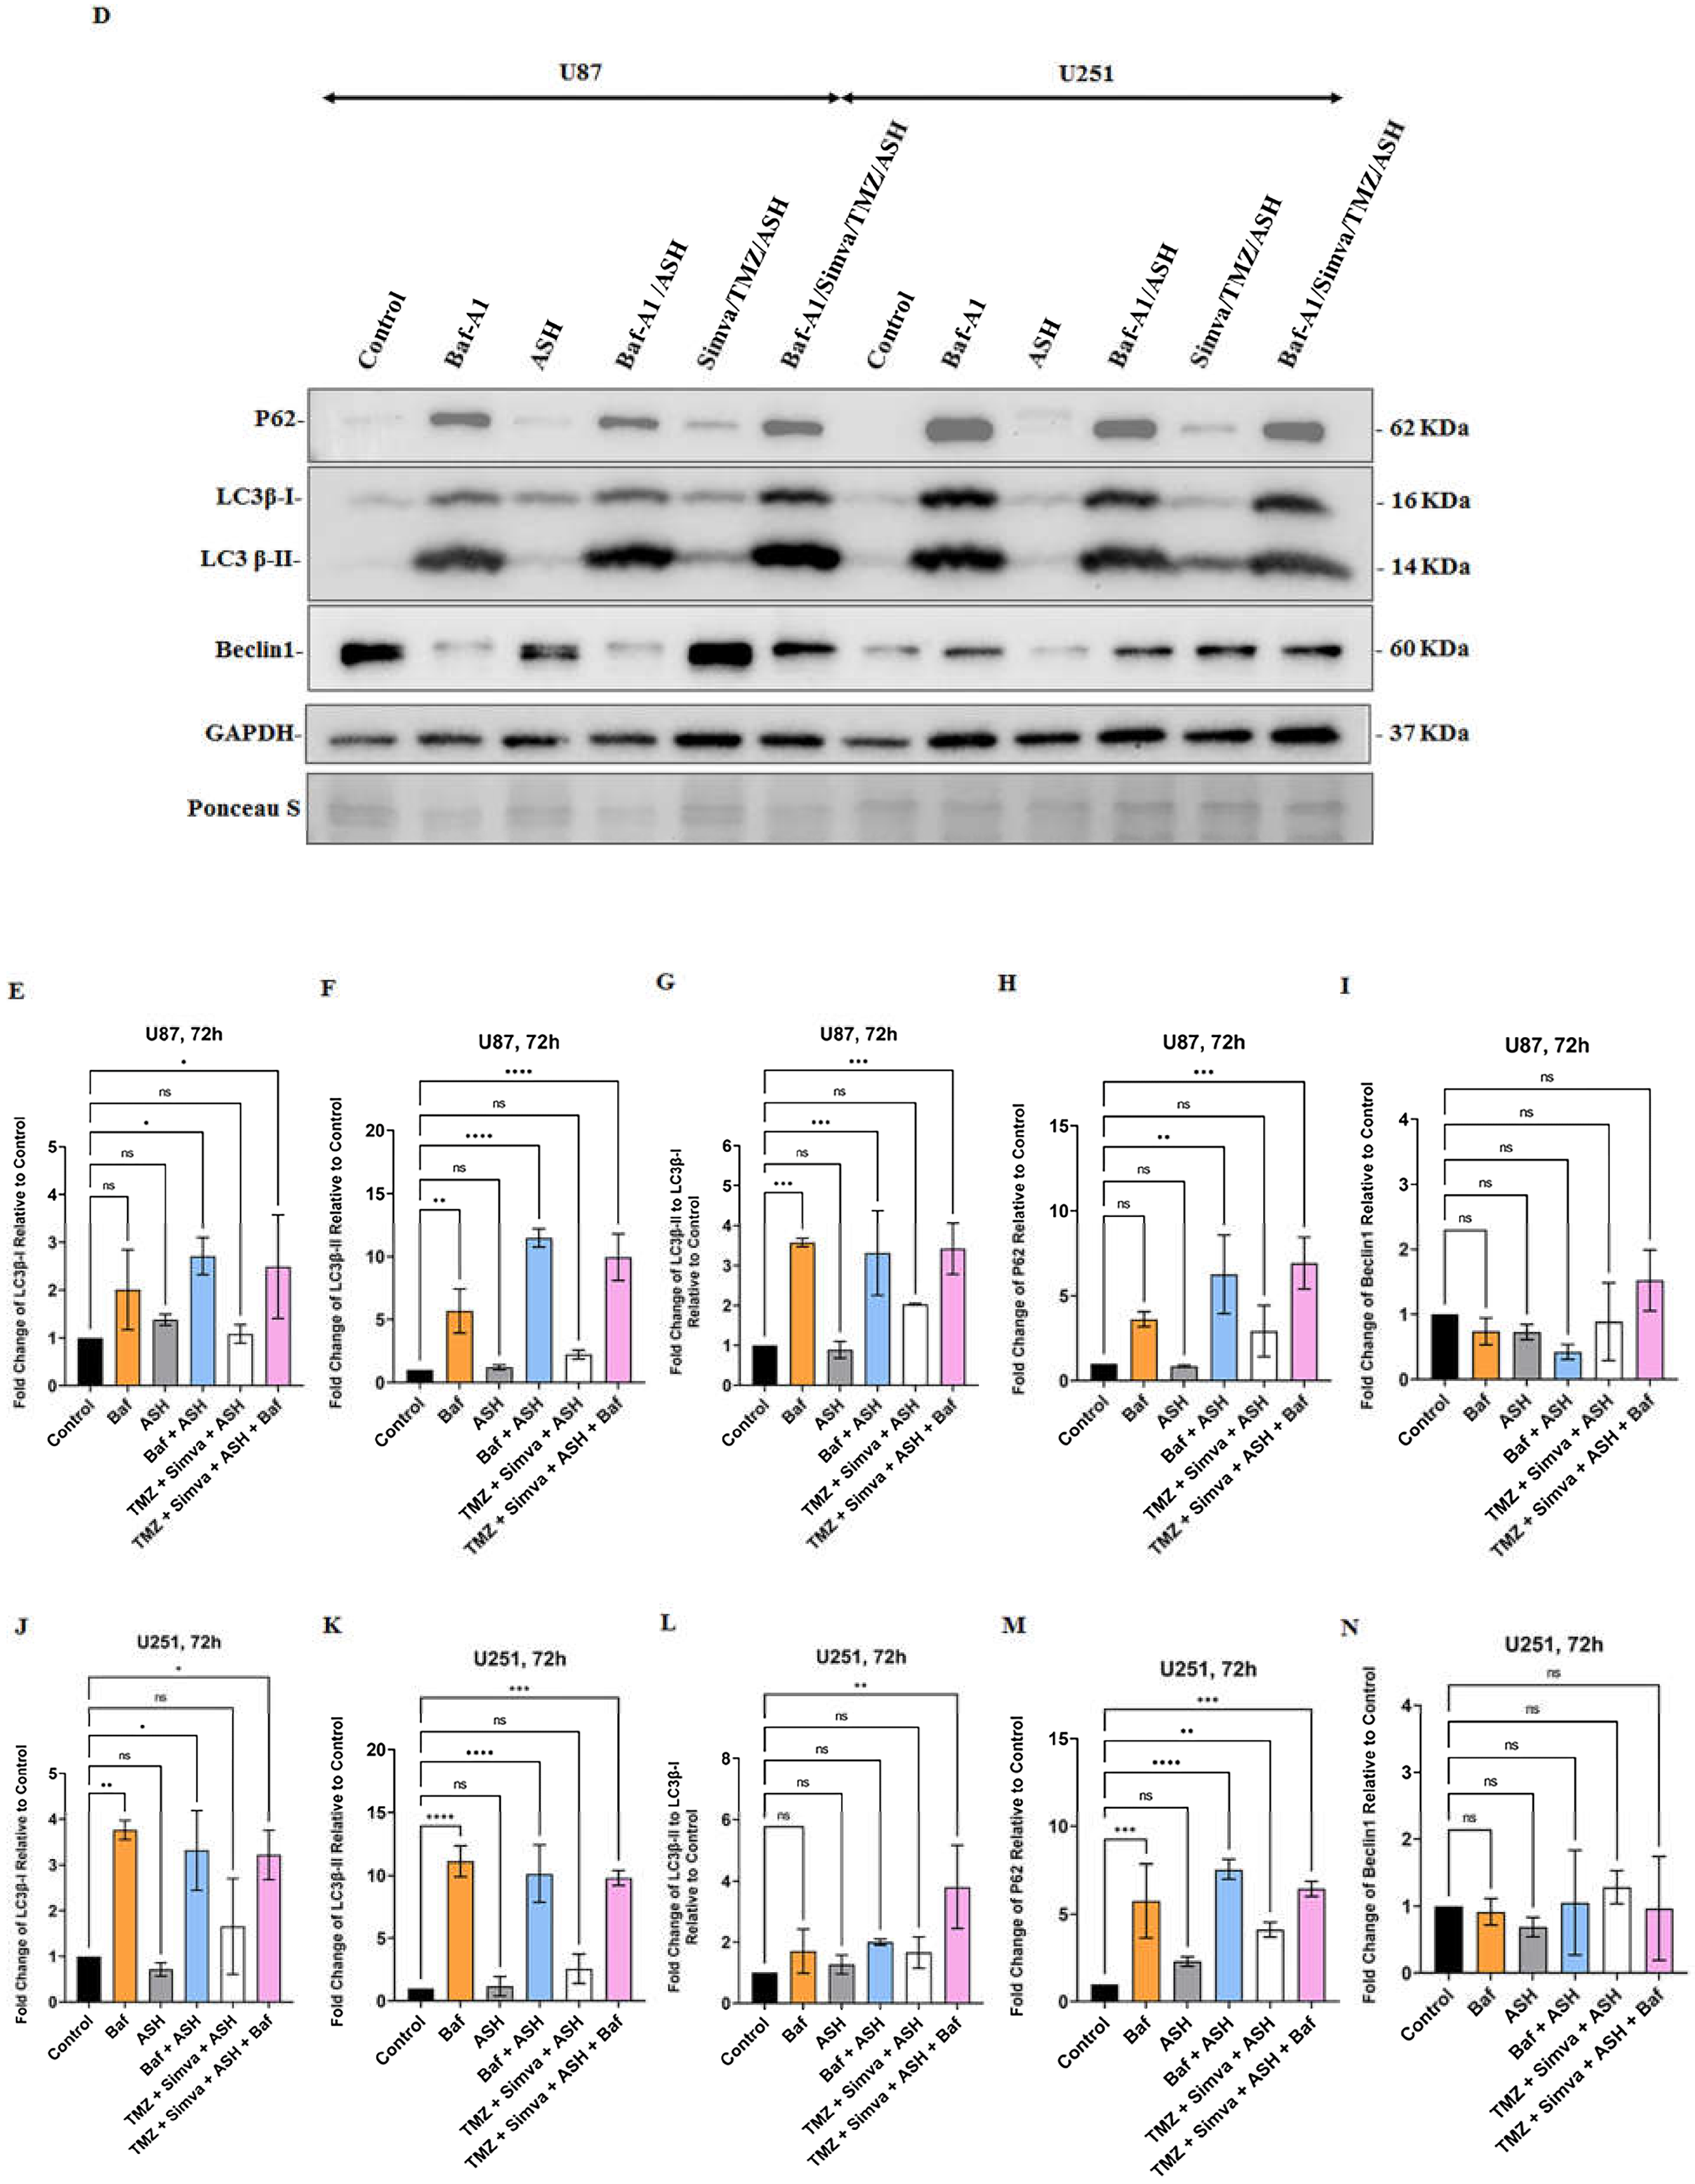
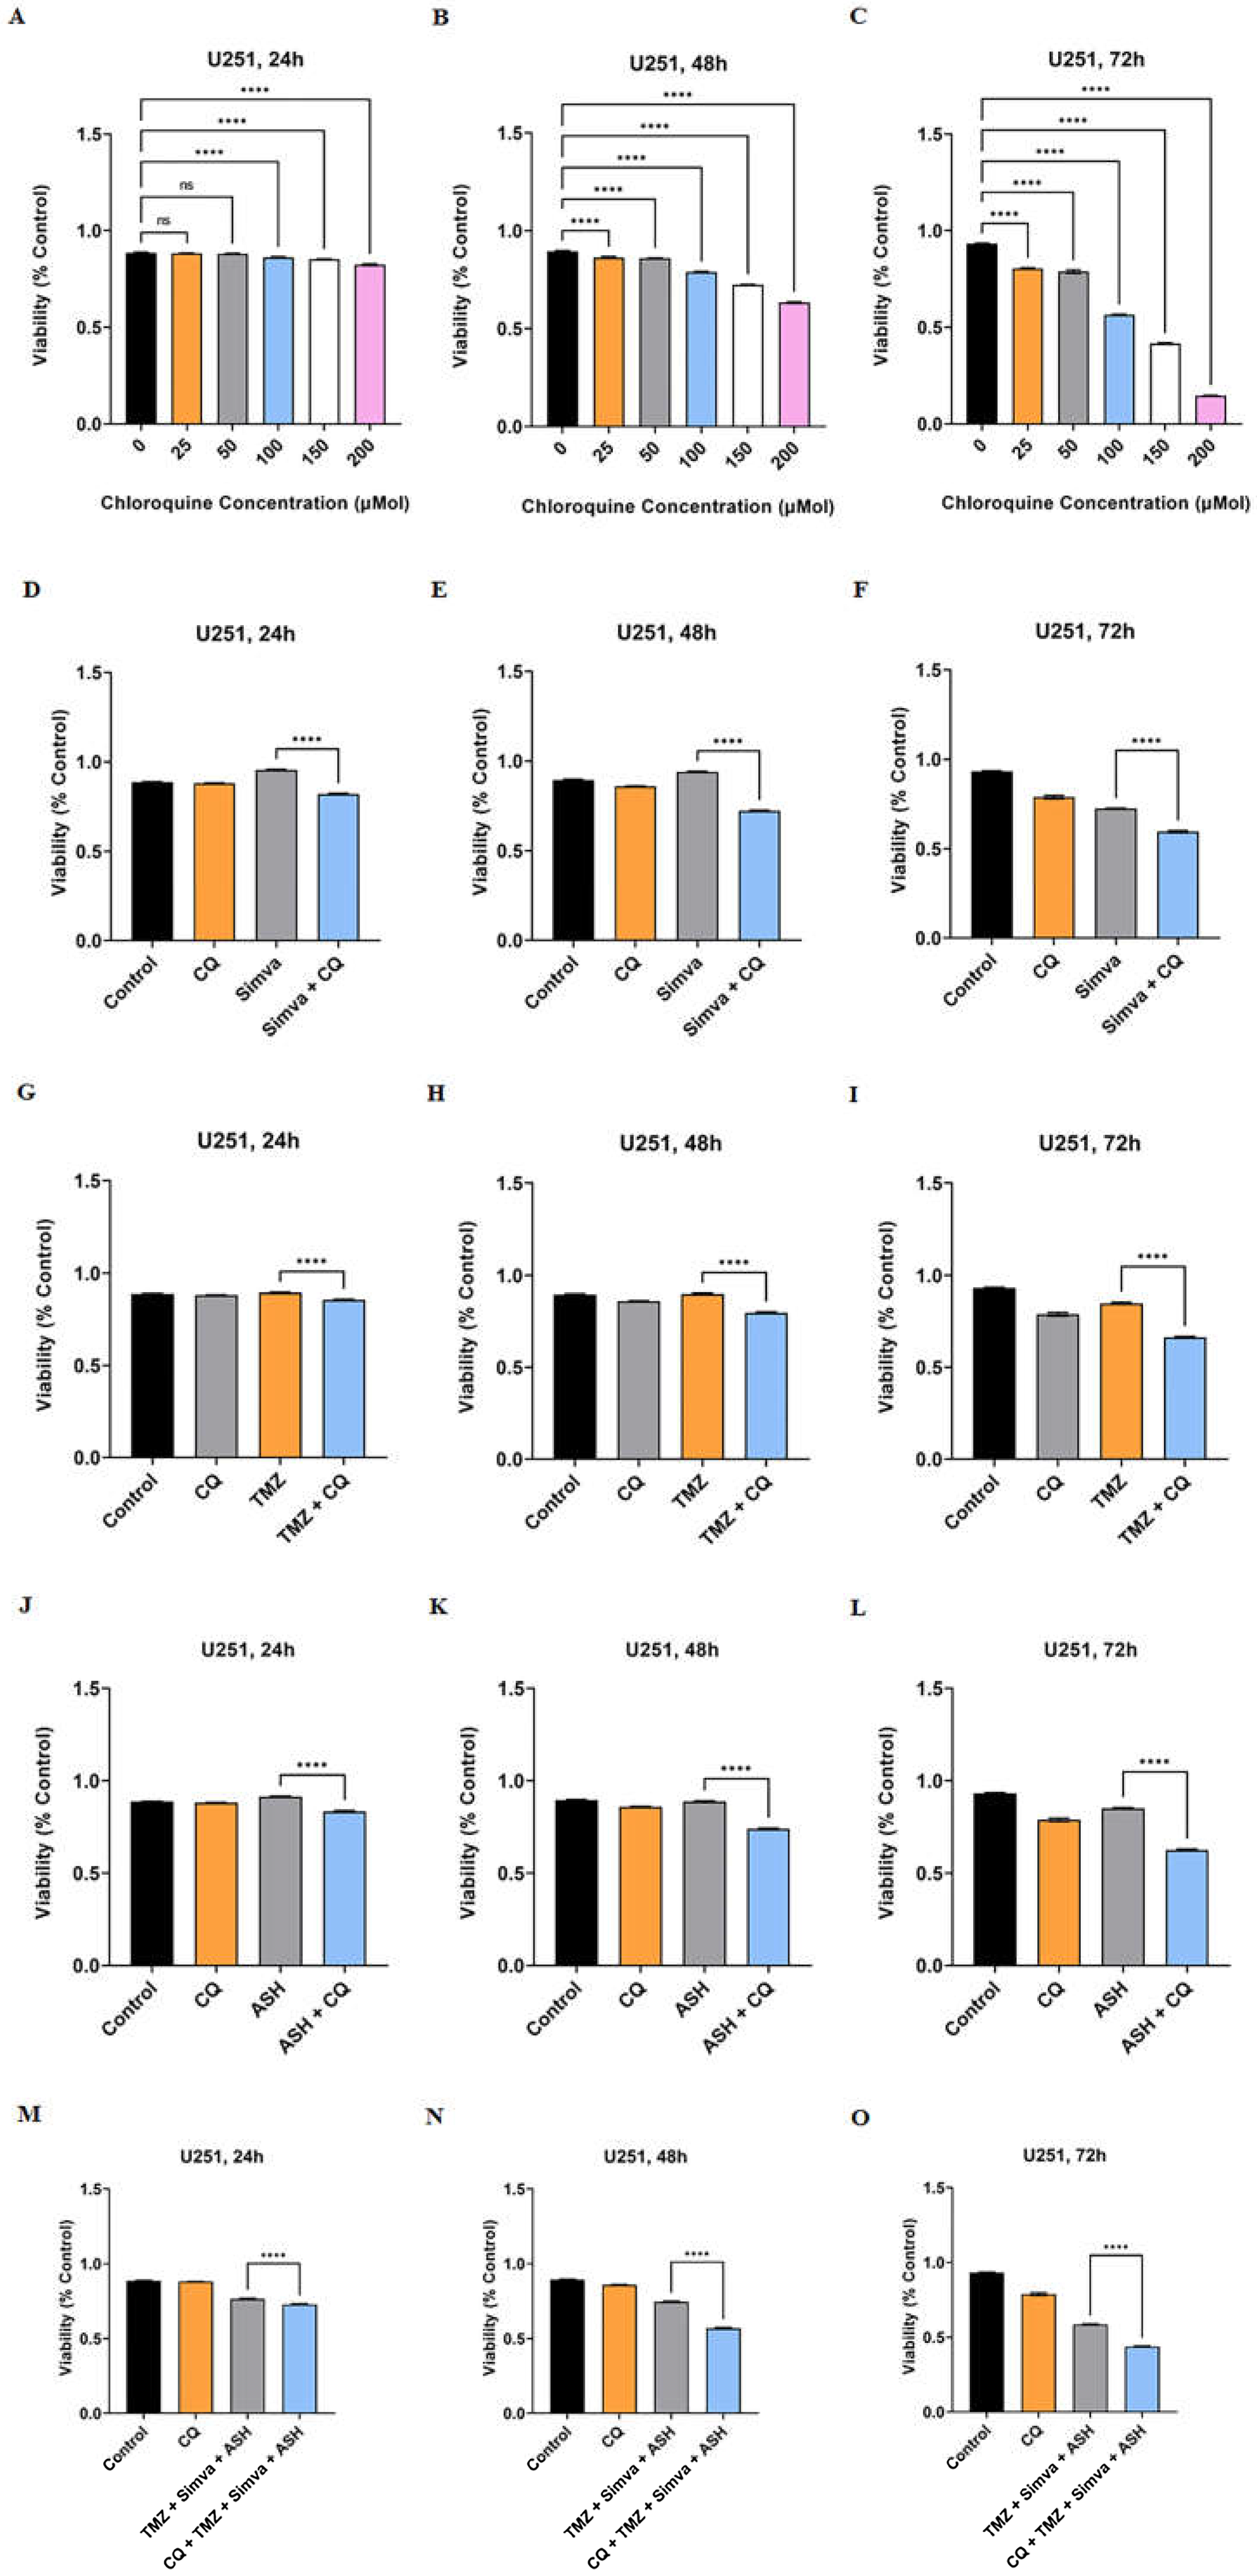
3.5. Autophagy Flux Inhibition Increases Simva, TMZ, ASH and Combination Triple Treatment-Induced Cell Death in GBM Cells
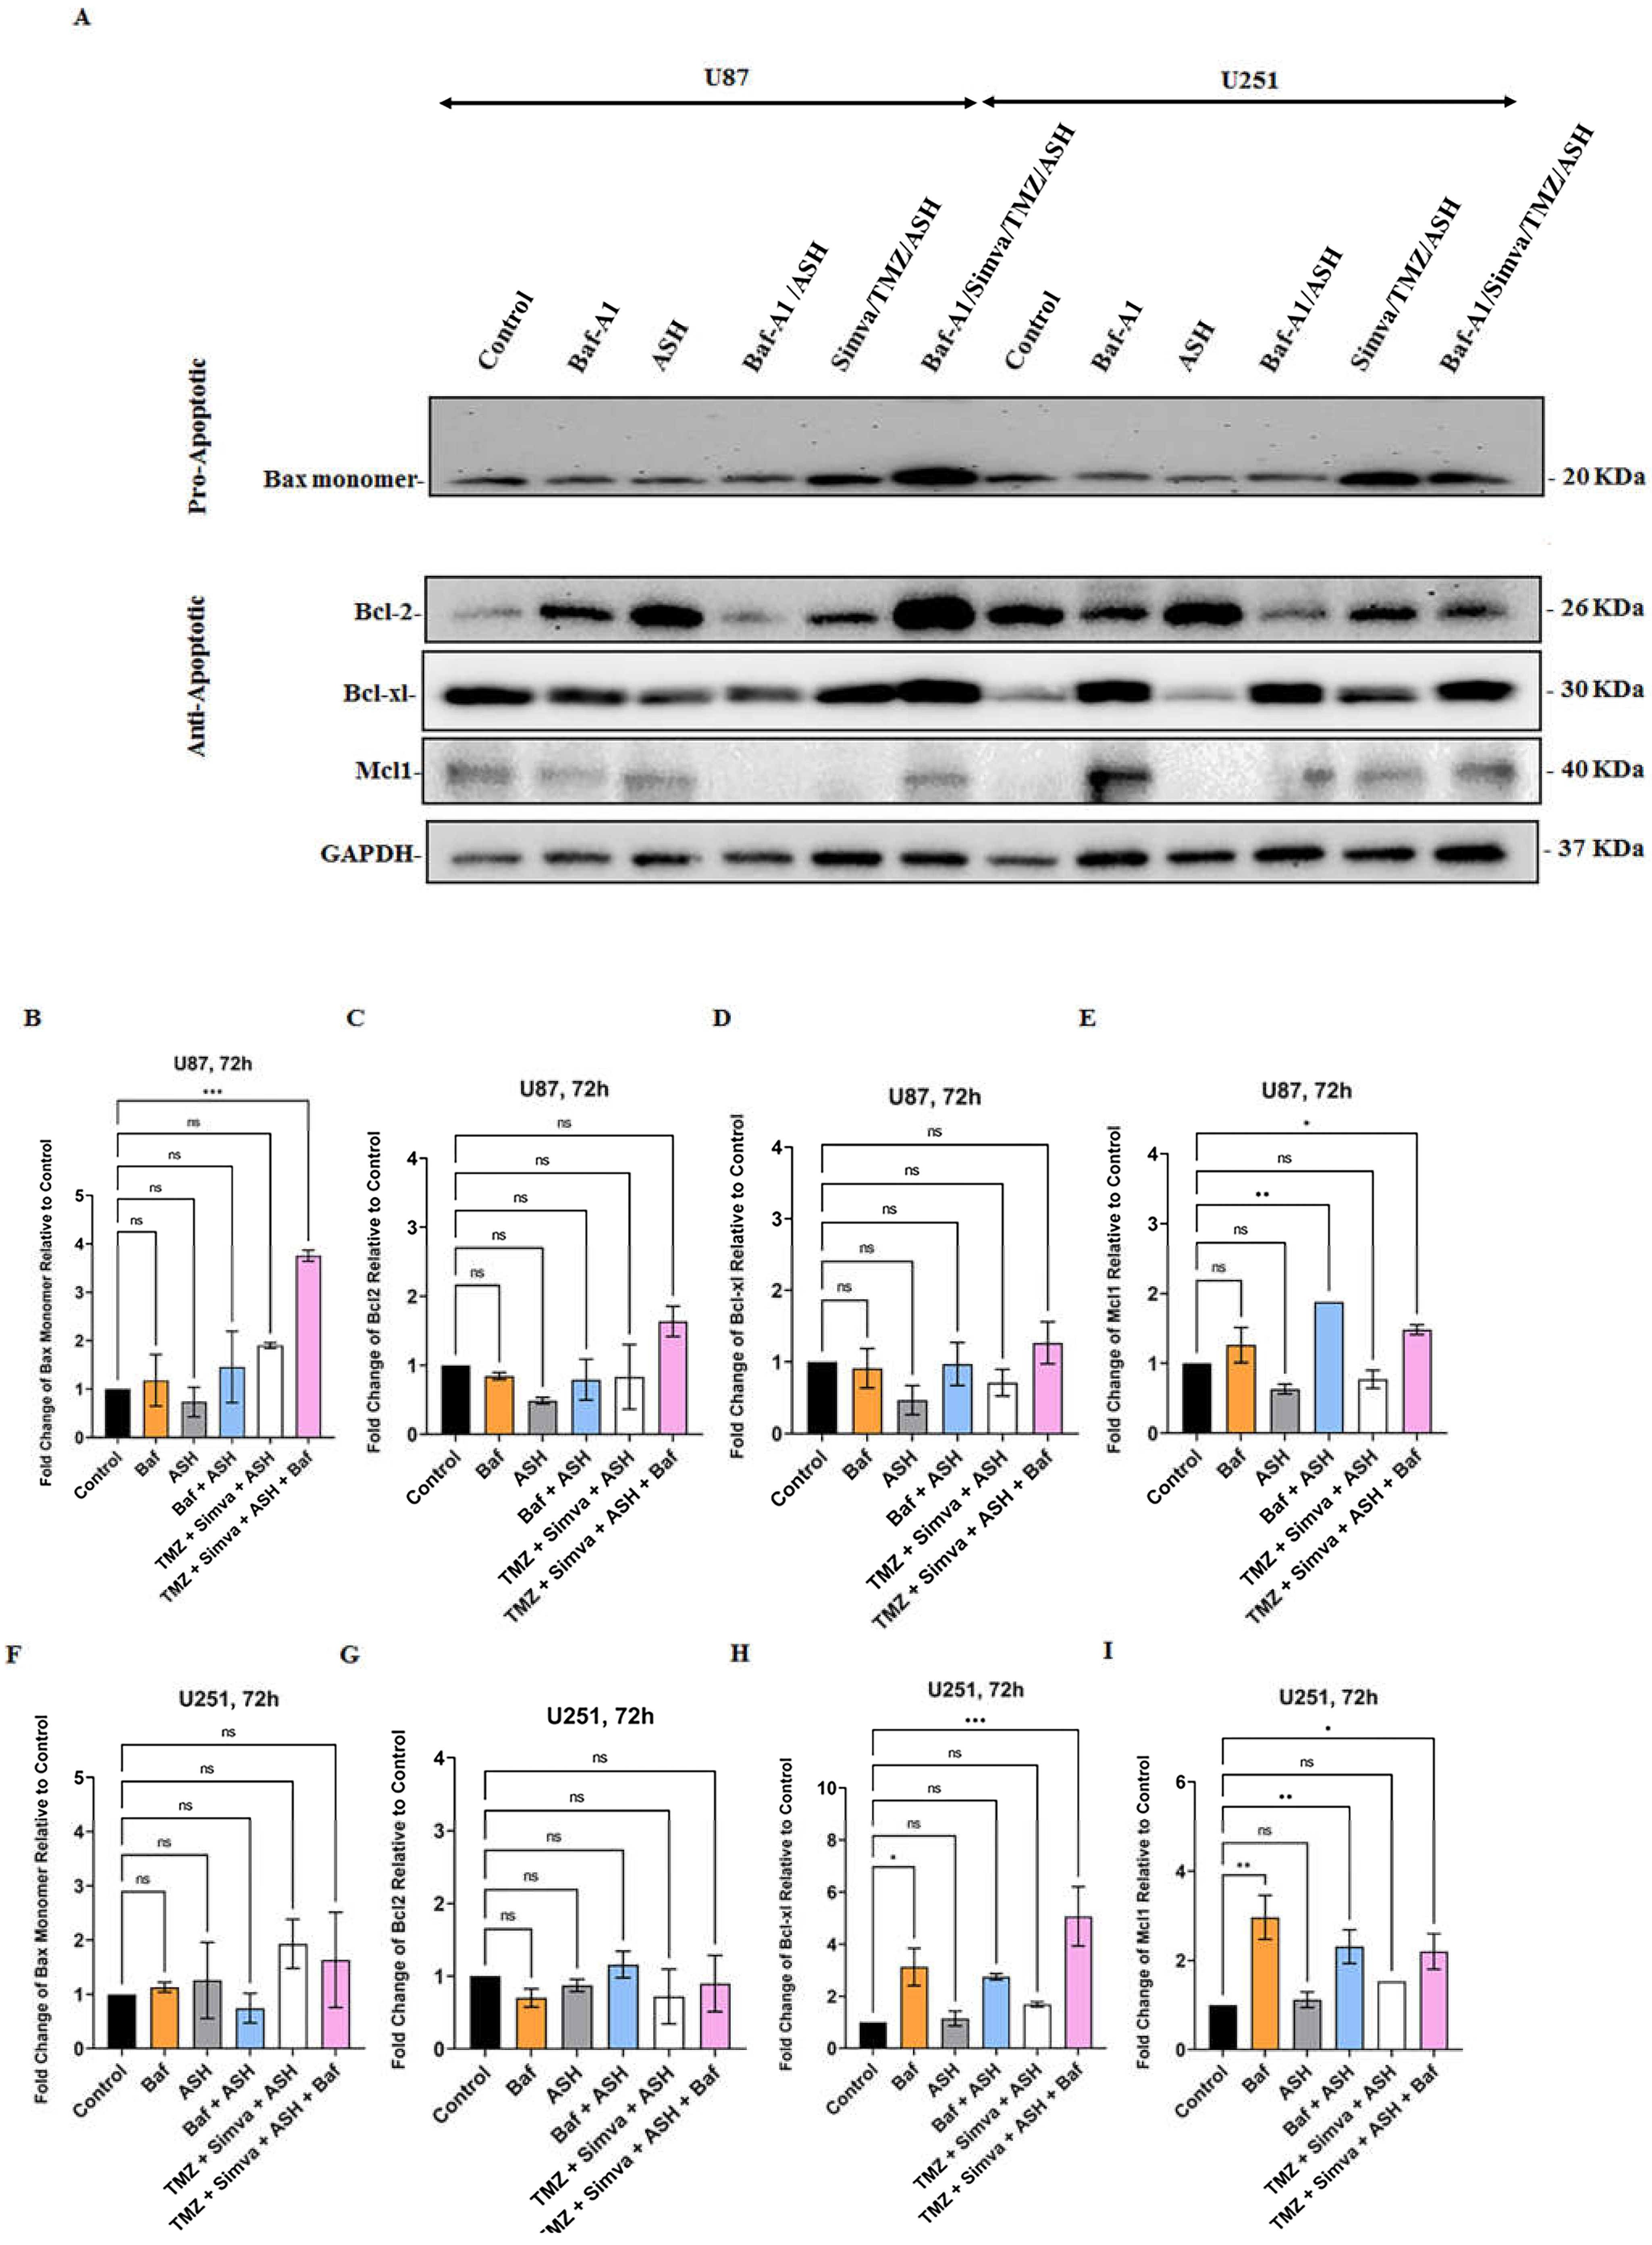
3.6. Role of Bcl2 pro- and anti-Apoptotic Family Proteins in TMZ/Simva/ASH Induced Cell Death in GBM cells
4. Discussion
5. Conclusions
Supplementary Materials
Author Contributions
Funding
Institutional Review Board Statement
Informed Consent Statement
Data Availability Statement
Acknowledgments
Conflicts of Interest
References
- Pirmoradi, L.; Seyfizadeh, N.; Ghavami, S.; Zeki, A.A.; Shojaei, S. Targeting cholesterol metabolism in glioblastoma: a new therapeutic approach in cancer therapy. J Investig Med. 2019, 67, 715–719. [Google Scholar] [CrossRef] [PubMed]
- Johannessen, T.C.; Hasan-Olive, M.M.; Zhu, H.; Denisova, O.; Grudic, A.; Latif, M.A.; Saed, H.; Varughese, J.K.; Røsland, G.V.; Yang, N. Thioridazine inhibits autophagy and sensitizes glioblastoma cells to temozolomide. Int J cancer. 2019, 144, 1735–1745. [Google Scholar] [CrossRef] [PubMed]
- Grochans, S.; Cybulska, A.M.; Simińska, D.; Korbecki, J.; Kojder, K.; Chlubek, D.; Baranowska-Bosiacka, I. Epidemiology of Glioblastoma Multiforme–Literature Review. Cancers. 2022, 14, 2412. [Google Scholar] [CrossRef]
- Liao, W.; Fan, S.; Zheng, Y.; Liao, S.; Xiong, Y.; Li, Y.; Liu, J. Recent advances on glioblastoma multiforme and nano-drug carriers: A review. Curr Med Chem. 2019, 26, 5862–5874. [Google Scholar] [CrossRef] [PubMed]
- Cruz, J.V.R.; Batista, C.; Afonso, B.H.; Alexandre-Moreira, M.S.; Dubois, L.G.; Pontes, B.; Moura Neto, V.; Mendes, F.A. Obstacles to Glioblastoma Treatment Two Decades after Temozolomide. Cancers (Basel) 2022, 14, 3203. [Google Scholar] [CrossRef]
- McMahon, D.J.; Gleeson, J.P.; O’Reilly, S.; Bambury, R.M. Management of newly diagnosed glioblastoma multiforme: current state of the art and emerging therapeutic approaches. Med Oncol. 2022, 39, 129. [Google Scholar] [CrossRef] [PubMed]
- Lee, J.H.; Park, H.R.; Choi, Y.W. Acetylshikonin inhibits growth of oral squamous cell carcinoma by inducing apoptosis. Arch Oral Biol. 2016, 70, 149–157. [Google Scholar] [CrossRef]
- Moghadam, A.R.; da Silva Rosa, S.C.; Samiei, E.; Alizadeh, J.; Field, J.; Kawalec, P.; Thliveris, J.; Akbari, M.; Ghavami, S.; Gordon, J.W. Autophagy modulates temozolomide-induced cell death in alveolar Rhabdomyosarcoma cells. Cell Death Discov. 2018, 4, 1–16. [Google Scholar] [CrossRef]
- Shojaei, S.; Alizadeh, J.; Thliveris, J.; Koleini, N.; Kardami, E.; Hatch, G.M.; Xu, F.; Hombach-Klonisch, S.; Klonisch, T.; Ghavami, S. Statins: a new approach to combat temozolomide chemoresistance in glioblastoma. J Investig Med. 2018, 66, 1083–1087. [Google Scholar] [CrossRef]
- Shojaei, S.; Koleini, N.; Samiei, E.; Aghaei, M.; Cole, L.K.; Alizadeh, J.; Islam, M.I.; Vosoughi, A.r.; Albokashy, M.; Butterfield, Y. Simvastatin increases temozolomide-induced cell death by targeting the fusion of autophagosomes and lysosomes. FEBS J. 2020, 287, 1005–1034. [Google Scholar] [CrossRef]
- Lin, C.-J.; Lee, C.-C.; Shih, Y.-L.; Lin, T.-Y.; Wang, S.-H.; Lin, Y.-F.; Shih, C.-M. Resveratrol enhances the therapeutic effect of temozolomide against malignant glioma in vitro and in vivo by inhibiting autophagy. Free Radic Biol Med. 2012, 52, 377–391. [Google Scholar] [CrossRef] [PubMed]
- Ghavami, S.; Zamani, M.; Ahmadi, M.; Erfani, M.; Dastghaib, S.; Darbandi, M.; Darbandi, S.; Vakili, O.; Siri, M.; Grabarek, B.O.; et al. Epigenetic regulation of autophagy in gastrointestinal cancers. Biochim Biophys Acta Mol Basis Dis 2022, 1868, 166512. [Google Scholar] [CrossRef] [PubMed]
- Sharma, P.; Alizadeh, J.; Juarez, M.; Samali, A.; Halayko, A.J.; Kenyon, N.J.; Ghavami, S.; Zeki, A.A. Autophagy, Apoptosis, the Unfolded Protein Response, and Lung Function in Idiopathic Pulmonary Fibrosis. Cells. 2021, 10, 1642. [Google Scholar] [CrossRef] [PubMed]
- Chen, Y.M.; Burrough, E. The Effects of Swine Coronaviruses on ER Stress, Autophagy, Apoptosis, and Alterations in Cell Morphology. Pathogens 2022, 11, 940. [Google Scholar] [CrossRef] [PubMed]
- Saptarshi, N.; Porter, L.F.; Paraoan, L. PERK/EIF2AK3 integrates endoplasmic reticulum stress-induced apoptosis, oxidative stress and autophagy responses in immortalised retinal pigment epithelial cells. Sci Rep 2022, 12, 13324. [Google Scholar] [CrossRef] [PubMed]
- Hsieh, M.J.; Chien, S.Y.; Lin, J.T.; Yang, S.F.; Chen, M.K. Polyphyllin G induces apoptosis and autophagy cell death in human oral cancer cells Phytomedicine. Phytomedicine. 2016, 23, 1545–1554. [Google Scholar] [CrossRef]
- Kataura, T.; Sedlackova, L.; Otten, E.G.; Kumari, R.; Shapira, D.; Scialo, F.; Stefanatos, R.; Ishikawa, K.I.; Kelly, G.; Seranova, E.; et al. Autophagy promotes cell survival by maintaining NAD levels. Dev Cell 2022, 57, 2584–2598. [Google Scholar] [CrossRef]
- Fairlie, W.D.; Tran, S.; Lee, E.F. Crosstalk between apoptosis and autophagy signaling pathways. Int Rev Cell Mol Biol 2020, 352, 115–158. [Google Scholar] [CrossRef]
- Kawalec, P.; Martens, M.D.; Field, J.T.; Mughal, W.; Caymo, A.M.; Chapman, D.; Xiang, B.; Ghavami, S.; Dolinsky, V.W.; Gordon, J.W. Differential impact of doxorubicin dose on cell death and autophagy pathways during acute cardiotoxicity. Toxicol Appl Pharmacol 2022, 453, 116210. [Google Scholar] [CrossRef]
- Dastghaib, S.; Shojaei, S.; Mostafavi-Pour, Z.; Sharma, P.; Patterson, J.B.; Samali, A.; Mokarram, P.; Ghavami, S. Simvastatin Induces Unfolded Protein Response and Enhances Temozolomide-Induced Cell Death in Glioblastoma Cells. Cells 2020, 9, 2339. [Google Scholar] [CrossRef]
- Nikoletopoulou, V.; Markaki, M.; Palikaras, K.; Tavernarakis, N. Crosstalk between apoptosis, necrosis and autophagy. Biochim Biophys Acta 2013, 1833, 3448–3459. [Google Scholar] [CrossRef] [PubMed]
- Samiei, E.; Seyfoori, A.; Toyota, B.; Ghavami, S.; Akbari, M. Investigating Programmed Cell Death and Tumor Invasion in a Three-Dimensional (3D) Microfluidic Model of Glioblastoma. Int J Mol Sci 2020, 21, 3162. [Google Scholar] [CrossRef] [PubMed]
- Emami, A.; Shojaei, S.; da Silva Rosa, S.C.; Aghaei, M.; Samiei, E.; Vosoughi, A.R.; Kalantari, F.; Kawalec, P.; Thliveris, J.; Sharma, P.; et al. Mechanisms of simvastatin myotoxicity: The role of autophagy flux inhibition. Eur J Pharmacol 2019, 862, 172616. [Google Scholar] [CrossRef] [PubMed]
- Nagakannan, P.; Iqbal, M.A.; Yeung, A.; Thliveris, J.A.; Rastegar, M.; Ghavami, S.; Eftekharpour, E. Perturbation of redox balance after thioredoxin reductase deficiency interrupts autophagy-lysosomal degradation pathway and enhances cell death in nutritionally stressed SH-SY5Y cells. Free Radic Biol Med 2016, 101, 53–70. [Google Scholar] [CrossRef] [PubMed]
- Ahmadi, M.; Amiri, S.; Pecic, S.; Machaj, F.; Rosik, J.; Los, M.J.; Alizadeh, J.; Mahdian, R.; da Silva Rosa, S.C.; Schaafsma, D.; et al. Pleiotropic effects of statins: A focus on cancer. Biochim Biophys Acta Mol Basis Dis 2020, 1866, 165968. [Google Scholar] [CrossRef] [PubMed]
- Jiang, W.; Hu, J.-W.; He, X.-R.; Jin, W.-L.; He, X.-Y. Statins: a repurposed drug to fight cancer. J Exp Clin Cancer Res 2021, 40, 241. [Google Scholar] [CrossRef] [PubMed]
- Nielsen, S.F.; Nordestgaard, B.G.; Bojesen, S.E. Statin use and reduced cancer-related mortality. N Engl J Med 2012, 367, 1792–1802. [Google Scholar] [CrossRef]
- Gobel, A.; Riffel, R.M.; Hofbauer, L.C.; Rachner, T.D. The mevalonate pathway in breast cancer biology. Cancer Lett 2022, 542, 215761. [Google Scholar] [CrossRef]
- Marciano, G.; Palleria, C.; Casarella, A.; Rania, V.; Basile, E.; Catarisano, L.; Vocca, C.; Bianco, L.; Pelaia, C.; Cione, E.; et al. Effect of Statins on Lung Cancer Molecular Pathways: A Possible Therapeutic Role. Pharmaceuticals (Basel) 2022, 15, 589. [Google Scholar] [CrossRef]
- Gaist, D.; Hallas, J.; Friis, S.; Hansen, S.; Sorensen, H.T. Statin use and survival following glioblastoma multiforme. Cancer Epidemiol 2014, 38, 722–727. [Google Scholar] [CrossRef]
- Alizadeh, J.; Zeki, A.A.; Mirzaei, N.; Tewary, S.; Rezaei Moghadam, A.; Glogowska, A.; Nagakannan, P.; Eftekharpour, E.; Wiechec, E.; Gordon, J.W.; et al. Mevalonate Cascade Inhibition by Simvastatin Induces the Intrinsic Apoptosis Pathway via Depletion of Isoprenoids in Tumor Cells. Sci Rep 2017, 7, 44841. [Google Scholar] [CrossRef] [PubMed]
- Sheikholeslami, K.; Ali Sher, A.; Lockman, S.; Kroft, D.; Ganjibakhsh, M.; Nejati-Koshki, K.; Shojaei, S.; Ghavami, S.; Rastegar, M. Simvastatin Induces Apoptosis in Medulloblastoma Brain Tumor Cells via Mevalonate Cascade Prenylation Substrates. Cancers (Basel) 2019, 11, 994. [Google Scholar] [CrossRef] [PubMed]
- Shojaei, S.; Koleini, N.; Samiei, E.; Aghaei, M.; Cole, L.K.; Alizadeh, J.; Islam, M.I.; Vosoughi, A.R.; Albokashy, M.; Butterfield, Y.; et al. Simvastatin increases temozolomide-induced cell death by targeting the fusion of autophagosomes and lysosomes. FEBS J 2020, 287, 1005–1034. [Google Scholar] [CrossRef] [PubMed]
- Zorman, J.; Sušjan, P.; Hafner-Bratkovič, I. Shikonin suppresses NLRP3 and AIM2 inflammasomes by direct inhibition of caspase-1. PloS one 2016, 11, e0159826. [Google Scholar] [CrossRef]
- Matias, D.; Balça-Silva, J.; Dubois, L.G.; Pontes, B.; Ferrer, V.P.; Rosário, L.; do Carmo, A.; Echevarria-Lima, J.; Sarmento-Ribeiro, A.B.; Lopes, M.C. Dual treatment with shikonin and temozolomide reduces glioblastoma tumor growth, migration and glial-to-mesenchymal transition. Cell Oncol 2017, 40, 247–261. [Google Scholar] [CrossRef] [PubMed]
- Chen, Q.; Han, H.; Lin, F.; Yang, L.; Feng, L.; Lai, X.; Wen, Z.; Yang, M.; Wang, C.; Ma, Y.; et al. Novel shikonin derivatives suppress cell proliferation, migration and induce apoptosis in human triple-negative breast cancer cells via regulating PDK1/PDHC axis. Life Sci 2022, 310, 121077. [Google Scholar] [CrossRef] [PubMed]
- Peng, J.; Hu, X.; Fan, S.; Zhou, J.; Ren, S.; Sun, R.; Chen, Y.; Shen, X.; Chen, Y. Inhibition of Mitochondrial Biosynthesis Using a “Right-Side-Out” Membrane-Camouflaged Micelle to Facilitate the Therapeutic Effects of Shikonin on Triple-Negative Breast Cancer. Adv Healthc Mater 2022, 11, e2200742. [Google Scholar] [CrossRef]
- Martelli, A.; Omrani, M.; Zarghooni, M.; Citi, V.; Brogi, S.; Calderone, V.; Sureda, A.; Lorzadeh, S.; da Silva Rosa, S.C.; Grabarek, B.O.; et al. New Visions on Natural Products and Cancer Therapy: Autophagy and Related Regulatory Pathways. Cancers (Basel) 2022, 14, 5839. [Google Scholar] [CrossRef]
- Wu, H.; Xie, J.; Pan, Q.; Wang, B.; Hu, D.; Hu, X. Anticancer agent shikonin is an incompetent inducer of cancer drug resistance. PloS one 2013, 8, e52706. [Google Scholar] [CrossRef]
- Wang, Y.; Hao, F.; Nan, Y.; Qu, L.; Na, W.; Jia, C.; Chen, X. PKM2 Inhibitor Shikonin Overcomes the Cisplatin Resistance in Bladder Cancer by Inducing Necroptosis. Int J Biol Sci 2018, 14, 1883–1891. [Google Scholar] [CrossRef]
- Xiong, W.; Luo, G.; Zhou, L.; Zeng, Y.; Yang, W. In vitro and in vivo antitumor effects of acetylshikonin isolated from Arnebia euchroma (Royle) Johnst (Ruanzicao) cell suspension cultures. Chin Med 2009, 4, 1–7. [Google Scholar] [CrossRef] [PubMed]
- Werner, M.; Lyu, C.; Stadlbauer, B.; Schrader, I.; Buchner, A.; Stepp, H.; Sroka, R.; Pohla, H. The role of Shikonin in improving 5-aminolevulinic acid-based photodynamic therapy and chemotherapy on glioblastoma stem cells. Photodiagnosis Photodyn Ther 2022, 39, 102987. [Google Scholar] [CrossRef] [PubMed]
- Matias, D.; Balca-Silva, J.; Dubois, L.G.; Pontes, B.; Ferrer, V.P.; Rosario, L.; do Carmo, A.; Echevarria-Lima, J.; Sarmento-Ribeiro, A.B.; Lopes, M.C.; et al. Dual treatment with shikonin and temozolomide reduces glioblastoma tumor growth, migration and glial-to-mesenchymal transition. Cell Oncol (Dordr) 2017, 40, 247–261. [Google Scholar] [CrossRef] [PubMed]
- Alizadeh, J.; Glogowska, A.; Thliveris, J.; Kalantari, F.; Shojaei, S.; Hombach-Klonisch, S.; Klonisch, T.; Ghavami, S. Autophagy modulates transforming growth factor beta 1 induced epithelial to mesenchymal transition in non-small cell lung cancer cells. Biochim Biophys Acta Mol Cell Res 2018, 1865, 749–768. [Google Scholar] [CrossRef]
- Hashemi, M.; Ghavami, S.; Eshraghi, M.; Booy, E.P.; Los, M. Cytotoxic effects of intra and extracellular zinc chelation on human breast cancer cells. Eur J Pharmacol 2007, 557, 9–19. [Google Scholar] [CrossRef] [PubMed]
- Ghavami, S.; Asoodeh, A.; Klonisch, T.; Halayko, A.J.; Kadkhoda, K.; Kroczak, T.J.; Gibson, S.B.; Booy, E.P.; Naderi-Manesh, H.; Los, M. Brevinin-2R1 semi-selectively kills cancer cells by a distinct mechanism, which involves the lysosomal-mitochondrial death pathway. J Cell Mol Med 2008, 12, 1005–1022. [Google Scholar] [CrossRef] [PubMed]
- Siri, M.; Behrouj, H.; Dastghaib, S.; Zamani, M.; Likus, W.; Rezaie, S.; Hudecki, J.; Khazayel, S.; Los, M.J.; Mokarram, P.; et al. Casein Kinase-1-Alpha Inhibitor (D4476) Sensitizes Microsatellite Instable Colorectal Cancer Cells to 5-Fluorouracil via Authophagy Flux Inhibition. Arch Immunol Ther Exp (Warsz) 2021, 69, 26. [Google Scholar] [CrossRef]
- Behrouj, H.; Seghatoleslam, A.; Mokarram, P.; Ghavami, S. Effect of casein kinase 1alpha inhibition on autophagy flux and the AKT/phospho-beta-catenin (S552) axis in HCT116, a RAS-mutated colorectal cancer cell line. Can J Physiol Pharmacol 2021, 99, 284–293. [Google Scholar] [CrossRef]
- Ghavami, S.; Sharma, P.; Yeganeh, B.; Ojo, O.O.; Jha, A.; Mutawe, M.M.; Kashani, H.H.; Los, M.J.; Klonisch, T.; Unruh, H.; et al. Airway mesenchymal cell death by mevalonate cascade inhibition: integration of autophagy, unfolded protein response and apoptosis focusing on Bcl2 family proteins. Biochim Biophys Acta 2014, 1843, 1259–1271. [Google Scholar] [CrossRef]
- Hinton, M.; Eltayeb, E.; Ghavami, S.; Dakshinamurti, S. Effect of pulsatile stretch on unfolded protein response in a new model of the pulmonary hypertensive vascular wall. Biochem Biophys Rep 2021, 27, 101080. [Google Scholar] [CrossRef]
- Alizadeh, J.; Kochan, M.M.; Stewart, V.D.; Drewnik, D.A.; Hannila, S.S.; Ghavami, S. Inhibition of Autophagy Flux Promotes Secretion of Chondroitin Sulfate Proteoglycans in Primary Rat Astrocytes. Mol Neurobiol 2021, 58, 6077–6091. [Google Scholar] [CrossRef] [PubMed]
- Ghavami, S.; Mutawe, M.M.; Schaafsma, D.; Yeganeh, B.; Unruh, H.; Klonisch, T.; Halayko, A.J. Geranylgeranyl transferase 1 modulates autophagy and apoptosis in human airway smooth muscle. Am J Physiol Lung Cell Mol Physiol 2012, 302, 420–428. [Google Scholar] [CrossRef] [PubMed]
- Ghavami, S.; Cunnington, R.H.; Yeganeh, B.; Davies, J.J.; Rattan, S.G.; Bathe, K.; Kavosh, M.; Los, M.J.; Freed, D.H.; Klonisch, T.; et al. Autophagy regulates trans fatty acid-mediated apoptosis in primary cardiac myofibroblasts. Biochim Biophys Acta 2012, 1823, 2274–2286. [Google Scholar] [CrossRef] [PubMed]
- Klionsky, D.J.; Abdel-Aziz, A.K.; Abdelfatah, S.; Abdellatif, M.; Abdoli, A.; Abel, S.; Abeliovich, H.; Abildgaard, M.H.; Abudu, Y.P.; Acevedo-Arozena, A. Guidelines for the use and interpretation of assays for monitoring autophagy. Autophagy 2021, 17, 1–382. [Google Scholar] [CrossRef] [PubMed]
- Dastghaib, S.; Shojaei, S.; Mostafavi-Pour, Z.; Sharma, P.; Patterson, J.B.; Samali, A.; Mokarram, P.; Ghavami, S. Simvastatin induces unfolded protein response and enhances temozolomide-induced cell death in glioblastoma cells. Cells 2020, 9, 2339. [Google Scholar] [CrossRef] [PubMed]
- Wang, Q.; Wang, J.; Wang, J.; Ju, X.; Zhang, H. Molecular mechanism of shikonin inhibiting tumor growth and potential application in cancer treatment. Toxicol Res 2021, 10, 1077–1084. [Google Scholar] [CrossRef] [PubMed]
- Shahsavari, Z.; Karami-Tehrani, F.; Salami, S. Shikonin induced necroptosis via reactive oxygen species in the T-47D breast cancer cell line. Asian Pac J Cancer Prev 2015, 16, 7261–7266. [Google Scholar] [CrossRef]
- Ma, X.; Yu, M.; Hao, C.; Yang, W. Shikonin induces tumor apoptosis in glioma cells via endoplasmic reticulum stress, and Bax/Bak mediated mitochondrial outer membrane permeability. J Ethnopharmacol 2020, 263, 113059. [Google Scholar] [CrossRef]
- Paskeh, M.D.A.; Entezari, M.; Clark, C.; Zabolian, A.; Ranjbar, E.; Farahani, M.V.; Saleki, H.; Sharifzadeh, S.O.; Far, F.B.; Ashrafizadeh, M.; et al. Targeted regulation of autophagy using nanoparticles: New insight into cancer therapy. Biochim Biophys Acta Mol Basis Dis 2022, 1868, 166326. [Google Scholar] [CrossRef]
- Yeganeh, B.; Rezaei Moghadam, A.; Alizadeh, J.; Wiechec, E.; Alavian, S.M.; Hashemi, M.; Geramizadeh, B.; Samali, A.; Bagheri Lankarani, K.; Post, M.; et al. Hepatitis B and C virus-induced hepatitis: Apoptosis, autophagy, and unfolded protein response. World J Gastroenterol 2015, 21, 13225–13239. [Google Scholar] [CrossRef]
- Moosavi, M.A.; Sharifi, M.; Ghafary, S.M.; Mohammadalipour, Z.; Khataee, A.; Rahmati, M.; Hajjaran, S.; Los, M.J.; Klonisch, T.; Ghavami, S. Photodynamic N-TiO(2) Nanoparticle Treatment Induces Controlled ROS-mediated Autophagy and Terminal Differentiation of Leukemia Cells. Sci Rep 2016, 6, 34413. [Google Scholar] [CrossRef] [PubMed]
- Ghavami, S.; Eshragi, M.; Ande, S.R.; Chazin, W.J.; Klonisch, T.; Halayko, A.J.; McNeill, K.D.; Hashemi, M.; Kerkhoff, C.; Los, M. S100A8/A9 induces autophagy and apoptosis via ROS-mediated cross-talk between mitochondria and lysosomes that involves BNIP3. Cell Res 2010, 20, 314–331. [Google Scholar] [CrossRef] [PubMed]
- da Silva Rosa, S.C.; Martens, M.D.; Field, J.T.; Nguyen, L.; Kereliuk, S.M.; Hai, Y.; Chapman, D.; Diehl-Jones, W.; Aliani, M.; West, A.R.; et al. BNIP3L/Nix-induced mitochondrial fission, mitophagy, and impaired myocyte glucose uptake are abrogated by PRKA/PKA phosphorylation. Autophagy 2021, 17, 2257–2272. [Google Scholar] [CrossRef] [PubMed]
- Chaabane, W.; Cieslar-Pobuda, A.; El-Gazzah, M.; Jain, M.V.; Rzeszowska-Wolny, J.; Rafat, M.; Stetefeld, J.; Ghavami, S.; Los, M.J. Human-gyrovirus-Apoptin triggers mitochondrial death pathway--Nur77 is required for apoptosis triggering. Neoplasia 2014, 16, 679–693. [Google Scholar] [CrossRef] [PubMed]
- Ghavami, S.; Eshragi, M.; Ande, S.R.; Chazin, W.J.; Klonisch, T.; Halayko, A.J.; Mcneill, K.D.; Hashemi, M.; Kerkhoff, C.; Los, M. S100A8/A9 induces autophagy and apoptosis via ROS-mediated cross-talk between mitochondria and lysosomes that involves BNIP3. Cell Res 2010, 20, 314–331. [Google Scholar] [CrossRef] [PubMed]
- Ghavami, S.; Mutawe, M.M.; Schaafsma, D.; Yeganeh, B.; Unruh, H.; Klonisch, T.; Halayko, A.J. Geranylgeranyl transferase 1 modulates autophagy and apoptosis in human airway smooth muscle. Am J Physiol Lung Cell Mol Physiol 2012, 302, 420–428. [Google Scholar] [CrossRef] [PubMed]
- Rashid, M.U.; Lorzadeh, S.; Gao, A.; Ghavami, S.; Coombs, K.M. PSMA2 knockdown impacts expression of proteins involved in immune and cellular stress responses in human lung cells. Biochim Biophys Acta Mol Basis Dis 2022, 1869, 166617. [Google Scholar] [CrossRef]
- Sharma, P.; McAlinden, K.D.; Ghavami, S.; Deshpande, D.A. Chloroquine: Autophagy inhibitor, antimalarial, bitter taste receptor agonist in fight against COVID-19, a reality check? Eur J Pharmacol 2021, 897, 173928. [Google Scholar] [CrossRef]
- Gupta, S.S.; Zeglinski, M.R.; Rattan, S.G.; Landry, N.M.; Ghavami, S.; Wigle, J.T.; Klonisch, T.; Halayko, A.J.; Dixon, I.M. Inhibition of autophagy inhibits the conversion of cardiac fibroblasts to cardiac myofibroblasts. Oncotarget 2016, 7, 78516–78531. [Google Scholar] [CrossRef]
- Ghavami, S.; Mutawe, M.M.; Hauff, K.; Stelmack, G.L.; Schaafsma, D.; Sharma, P.; McNeill, K.D.; Hynes, T.S.; Kung, S.K.; Unruh, H.; et al. Statin-triggered cell death in primary human lung mesenchymal cells involves p53-PUMA and release of Smac and Omi but not cytochrome c. Biochim Biophys Acta 2010, 1803, 452–467. [Google Scholar] [CrossRef]
- Ghavami, S.; Mutawe, M.M.; Sharma, P.; Yeganeh, B.; McNeill, K.D.; Klonisch, T.; Unruh, H.; Kashani, H.H.; Schaafsma, D.; Los, M.; et al. Mevalonate cascade regulation of airway mesenchymal cell autophagy and apoptosis: a dual role for p53. PLoS One 2011, 6, e16523. [Google Scholar] [CrossRef] [PubMed]
- Barzegar Behrooz, A.; Talaie, Z.; Jusheghani, F.; Los, M.J.; Klonisch, T.; Ghavami, S. Wnt and PI3K/Akt/mTOR Survival Pathways as Therapeutic Targets in Glioblastoma. Int J Mol Sci 2022, 23, 1353. [Google Scholar] [CrossRef] [PubMed]
- Fekrirad, Z.; Barzegar Behrooz, A.; Ghaemi, S.; Khosrojerdi, A.; Zarepour, A.; Zarrabi, A.; Arefian, E.; Ghavami, S. Immunology Meets Bioengineering: Improving the Effectiveness of Glioblastoma Immunotherapy. Cancers (Basel) 2022, 14, 3698. [Google Scholar] [CrossRef] [PubMed]
- Nakada, M.; Furuta, T.; Hayashi, Y.; Minamoto, T.; Hamada, J.-i. The strategy for enhancing temozolomide against malignant glioma. Front Oncol 2012, 2, 98. [Google Scholar] [CrossRef] [PubMed]
- Nielsen, S.F.; Nordestgaard, B.G.; Bojesen, S.E. Statin use and reduced cancer-related mortality. N Engl J Med 2013, 368, 576–577. [Google Scholar] [CrossRef] [PubMed]
- Gaist, D.; Hallas, J.; Friis, S.; Hansen, S.; Sørensen, H.T. Statin use and survival following glioblastoma multiforme. Cancer Epidemiol 2014, 38, 722–727. [Google Scholar] [CrossRef]
- Farwell, W.R.; Scranton, R.E.; Lawler, E.V.; Lew, R.A.; Brophy, M.T.; Fiore, L.D.; Gaziano, J.M. The association between statins and cancer incidence in a veterans population. J Natl Cancer Inst 2008, 100, 134–139. [Google Scholar] [CrossRef] [PubMed]
- Yeganeh, B.; Wiechec, E.; Ande, S.R.; Sharma, P.; Moghadam, A.R.; Post, M.; Freed, D.H.; Hashemi, M.; Shojaei, S.; Zeki, A.A. Targeting the mevalonate cascade as a new therapeutic approach in heart disease, cancer and pulmonary disease. Pharmacol Ther 2014, 143, 87–110. [Google Scholar] [CrossRef]
- Zhu, Z.; Zhang, P.; Li, N.; Kiang, K.M.Y.; Cheng, S.Y.; Wong, V.K.-W.; Leung, G.K.-K. Lovastatin enhances cytotoxicity of temozolomide via impairing autophagic flux in glioblastoma cells. Biomed Res Int 2019, 2019, 2710693. [Google Scholar] [CrossRef]
- Palko-Łabuz, A.; Środa-Pomianek, K.; Wesołowska, O.; Kostrzewa-Susłow, E.; Uryga, A.; Michalak, K. MDR reversal and pro-apoptotic effects of statins and statins combined with flavonoids in colon cancer cells. Biomed Pharmacother 2019, 109, 1511–1522. [Google Scholar] [CrossRef]
- Luput, L.; Sesarman, A.; Porfire, A.; Achim, M.; Muntean, D.; Casian, T.; Patras, L.; Rauca, V.F.; Drotar, D.M.; Stejerean, I. Liposomal simvastatin sensitizes C26 murine colon carcinoma to the antitumor effects of liposomal 5-fluorouracil in vivo. Cancer Sci 2020, 111, 1344–1356. [Google Scholar] [CrossRef]
- Hwang, K.-E.; Park, C.; Kwon, S.-J.; Kim, Y.-S.; Park, D.-S.; Lee, M.-K.; Kim, B.-R.; Park, S.-H.; Yoon, K.-H.; Jeong, E.-T. Synergistic induction of apoptosis by sulindac and simvastatin in A549 human lung cancer cells via reactive oxygen species-dependent mitochondrial dysfunction. Int J Oncol 2013, 43, 262–270. [Google Scholar] [CrossRef]
- Hwang, K.-E.; Kim, Y.-S.; Hwang, Y.-R.; Kwon, S.-J.; Park, D.-S.; Cha, B.-K.; Kim, B.-R.; Yoon, K.-H.; Jeong, E.-T.; Kim, H.-R. Enhanced apoptosis by pemetrexed and simvastatin in malignant mesothelioma and lung cancer cells by reactive oxygen species-dependent mitochondrial dysfunction and Bim induction. Int J Oncol 2014, 45, 1769–1777. [Google Scholar] [CrossRef] [PubMed]
- Alizadeh, J.; Zeki, A.A.; Mirzaei, N.; Tewary, S.; Rezaei Moghadam, A.; Glogowska, A.; Nagakannan, P.; Eftekharpour, E.; Wiechec, E.; Gordon, J.W. Mevalonate cascade inhibition by simvastatin induces the intrinsic apoptosis pathway via depletion of isoprenoids in tumor cells. Sci Rep 2017, 7, 1–14. [Google Scholar] [CrossRef] [PubMed]
- Cha, H.S.; Lee, H.K.; Park, S.H.; Nam, M.J. Acetylshikonin induces apoptosis of human osteosarcoma U2OS cells by triggering ROS-dependent multiple signal pathways. Toxicol in Vitro 2023, 86, 105521. [Google Scholar] [CrossRef] [PubMed]
- Lim, H.M.; Lee, J.; Yu, S.H.; Nam, M.J.; Cha, H.S.; Park, K.; Yang, Y.H.; Jang, K.Y.; Park, S.H. Acetylshikonin, A Novel CYP2J2 Inhibitor, Induces Apoptosis in RCC Cells via FOXO3 Activation and ROS Elevation. Oxid Med Cell Longev 2022, 2022, 9139338. [Google Scholar] [CrossRef]
- Lim, H.M.; Lee, J.; Nam, M.J.; Park, S.-H. Acetylshikonin induces apoptosis in human colorectal cancer HCT-15 and LoVo cells via nuclear translocation of FOXO3 and ROS level elevation. Oxid Med Cell Longev 2021, 2021, 6647107. [Google Scholar] [CrossRef]
- Lohberger, B.; Glanzer, D.; Kaltenegger, H.; Eck, N.; Leithner, A.; Bauer, R.; Kretschmer, N.; Steinecker-Frohnwieser, B. Shikonin derivatives cause apoptosis and cell cycle arrest in human chondrosarcoma cells via death receptors and MAPK regulation. BMC Cancer 2022, 22, 758. [Google Scholar] [CrossRef]
- Hao, G.; Zhai, J.; Jiang, H.; Zhang, Y.; Wu, M.; Qiu, Y.; Fan, C.; Yu, L.; Bai, S.; Sun, L.; et al. Acetylshikonin induces apoptosis of human leukemia cell line K562 by inducing S phase cell cycle arrest, modulating ROS accumulation, depleting Bcr-Abl and blocking NF-kappaB signaling. Biomed Pharmacother 2020, 122, 109677. [Google Scholar] [CrossRef]
- Zhao, Q.; Kretschmer, N.; Bauer, R.; Efferth, T. Shikonin and its derivatives inhibit the epidermal growth factor receptor signaling and synergistically kill glioblastoma cells in combination with erlotinib. Int J Cancer 2015, 137, 1446–1456. [Google Scholar] [CrossRef]
- Wang, X.; Welsh, N. Bcl-2 maintains the mitochondrial membrane potential, but fails to affect production of reactive oxygen species and endoplasmic reticulum stress, in sodium palmitate-induced beta-cell death. Ups J Med Sci 2014, 119, 306–315. [Google Scholar] [CrossRef] [PubMed]
- Hawkins, B.J.; Levin, M.D.; Doonan, P.J.; Petrenko, N.B.; Davis, C.W.; Patel, V.V.; Madesh, M. Mitochondrial complex II prevents hypoxic but not calcium- and proapoptotic Bcl-2 protein-induced mitochondrial membrane potential loss. J Biol Chem 2010, 285, 26494–26505. [Google Scholar] [CrossRef] [PubMed]
- Schimmer, A.D.; Hedley, D.W.; Pham, N.A.; Chow, S.; Minden, M.D. BAD induces apoptosis in cells over-expressing Bcl-2 or Bcl-xL without loss of mitochondrial membrane potential. Leuk Lymphoma 2001, 42, 429–443. [Google Scholar] [CrossRef] [PubMed]
- Ghavami, S.; Yeganeh, B.; Stelmack, G.L.; Kashani, H.H.; Sharma, P.; Cunnington, R.; Rattan, S.; Bathe, K.; Klonisch, T.; Dixon, I.M.; et al. Apoptosis, autophagy and ER stress in mevalonate cascade inhibition-induced cell death of human atrial fibroblasts. Cell Death Dis 2012, 3, e330. [Google Scholar] [CrossRef] [PubMed]
- Wu, M.D.; Zhang, Y.Y.; Yi, S.Y.; Sun, B.B.; Lan, J.; Jiang, H.M.; Hao, G.P. Acetylshikonin induces autophagy-dependent apoptosis through the key LKB1-AMPK and PI3K/Akt-regulated mTOR signalling pathways in HL-60 cells. J Cell Mol Med 2022, 26, 1606–1620. [Google Scholar] [CrossRef] [PubMed]
- Moon, J.; Koh, S.S.; Malilas, W.; Cho, I.R.; Kaewpiboon, C.; Kaowinn, S.; Lee, K.; Jhun, B.H.; Choi, Y.W.; Chung, Y.H. Acetylshikonin induces apoptosis of hepatitis B virus X protein-expressing human hepatocellular carcinoma cells via endoplasmic reticulum stress. Eur J Pharmacol 2014, 735, 132–140. [Google Scholar] [CrossRef] [PubMed]
- Ahmadi, M.; Madrakian, T.; Ghavami, S. Preparation and Characterization of Simvastatin Nanocapsules: Encapsulation of Hydrophobic Drugs in Calcium Alginate. Methods Mol Biol 2020, 2125, 47–56. [Google Scholar] [CrossRef]
- Yang, J.; Liu, X.; Bhalla, K.; Kim, C.N.; Ibrado, A.M.; Cai, J.; Peng, T.-I.; Jones, D.P.; Wang, X. Prevention of apoptosis by Bcl-2: release of cytochrome c from mitochondria blocked. Science 1997, 275, 1129–1132. [Google Scholar] [CrossRef]

Disclaimer/Publisher’s Note: The statements, opinions and data contained in all publications are solely those of the individual author(s) and contributor(s) and not of MDPI and/or the editor(s). MDPI and/or the editor(s) disclaim responsibility for any injury to people or property resulting from any ideas, methods, instructions or products referred to in the content. |
© 2023 by the authors. Licensee MDPI, Basel, Switzerland. This article is an open access article distributed under the terms and conditions of the Creative Commons Attribution (CC BY) license (http://creativecommons.org/licenses/by/4.0/).


