
Submitted:
27 November 2022
Posted:
29 November 2022
You are already at the latest version
Preprints on COVID-19 and SARS-CoV-2
Abstract
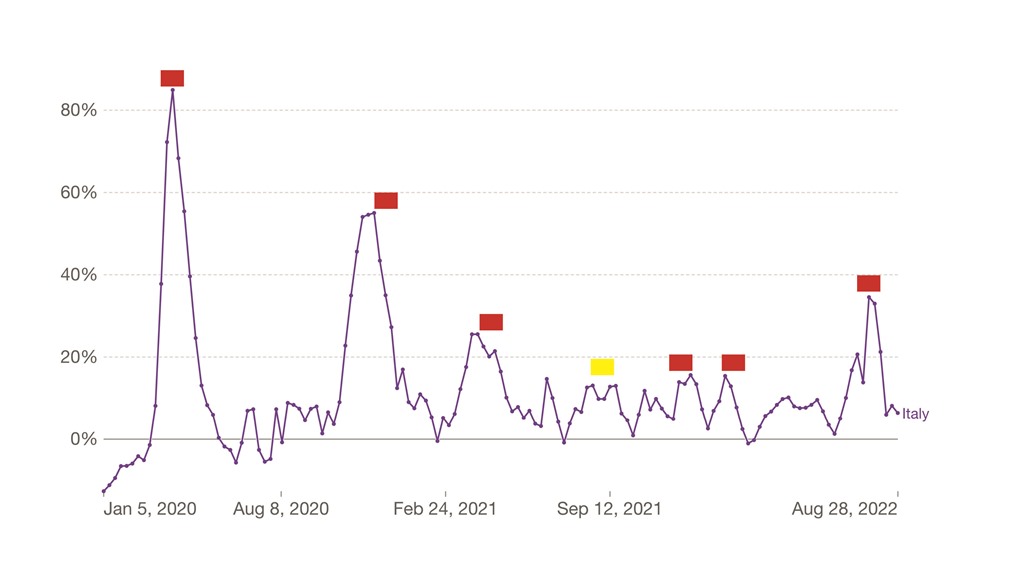
During a sanitary crisis, excess mortality measures the number of all-cause deaths, beyond what we would have expected if that crisis had not occurred. The high number of COVID-19 deaths started a debate in Italy with two opposite positions: those convinced that COVID-19 deaths were not, by default, excess deaths, because many COVID-19 deaths were not correctly registered, with the most part attributable to other causes and to the overall crisis conditions, and those who presented the opposite hypothesis. We analyzed the curve of the all-cause excess mortality, during the period January 5, 2020 – August 28, 2022, compared to the curve of the daily confirmed COVID-19 deaths, investigating the association between excess mortality and the recurrence of COVID-19 waves in Italy. We compared the two curves looking for the corresponding highest peaks and we found that 5 out of the 6 highest peaks (83.3%) of the excess mortality curve have occurred, on average, just a week before the concomitant COVID-19 waves hit their highest peaks of daily deaths (Mean 6.4 days; SD 2.4 days). This temporal correspondence between the moments when the excess mortality peaked and the highest peaks of the COVID-19 deaths provides further evidence that the all-cause excess mortality wave has been mostly driven by COVID-19 deaths
Keywords:
COVID-19
; pandemic
; Italy
; daily confirmed deaths
; all-cause excess mortality
; peak comparison
; public health
; epidemiology
; health informatics
Copyright: This open access article is published under a Creative Commons CC BY 4.0 license, which permit the free download, distribution, and reuse, provided that the author and preprint are cited in any reuse.


