
Submitted:
01 August 2019
Posted:
05 August 2019
You are already at the latest version
Abstract
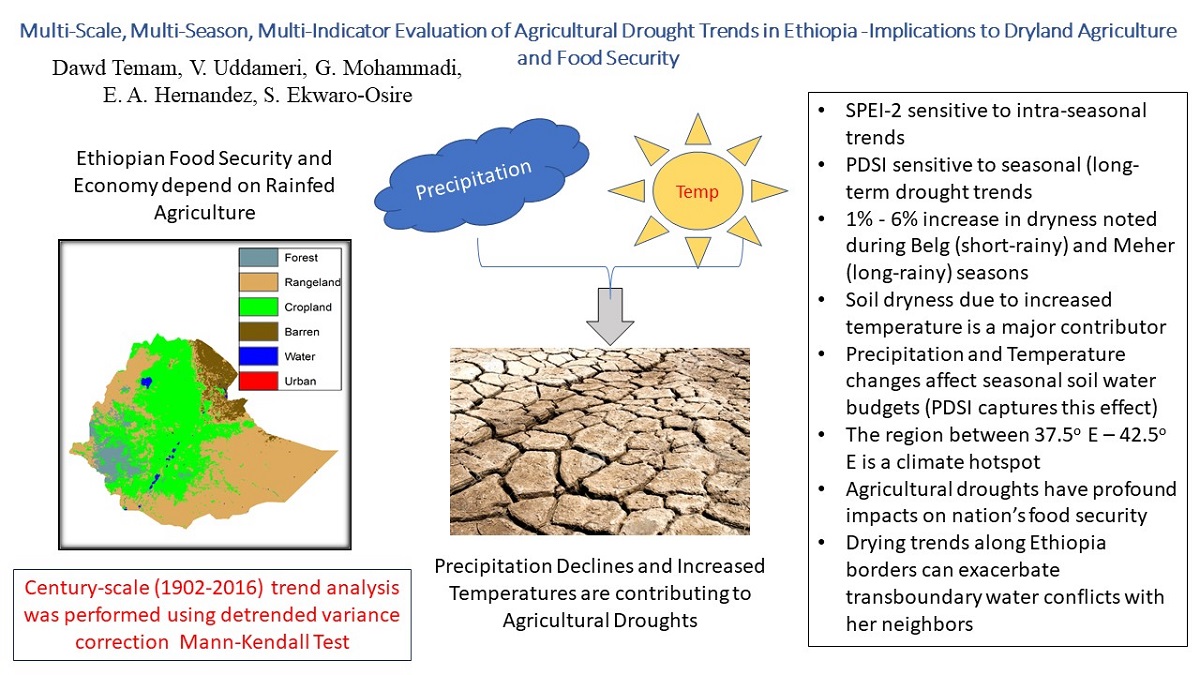
Ethiopian agriculture is not only affected by precipitation declines (meteorological droughts) but also soil dryness caused by temperature increases and associated long-term hydrological changes. Meteorological drought indicators (e.g., SPI), do not fully capture the water deficits in agricultural systems (i.e., agricultural droughts). An Ethiopia-wide assessment of meteorological and agricultural drought trends was carried out to characterize century-scale (1902 – 2016) changes in droughts. SPI and SPEI calculated using two-month accumulation and the Palmer Z-index were used for assessing intra-season drought trends. SPI and SPEI at six-month accumulations and PDSI were used to define full season droughts. Detrended variance corrected Mann-Kendall test was used for trend analysis during Bega (dry), Belg (short-rainy) and Meher (long-rainy) seasons. The SPEI-2 and PDSI were most aggressive in characterizing intra-season and seasonal-drought trends. There is on average 1% - 6% annual increase in dryness with the lower estimate based on precipitation declines and the upper end accounting for seasonal soil moisture dynamics. The area between 37.5° E – 42.5° E denotes a climate hot-spot. Precipitation declines in Belg along the Ethiopia-South-Sudan/Sudan border during Belg and along Eretria-Ethiopia border during Meher have the potential to exacerbate transboundary water conflicts and further threaten the food security of the region.
Keywords:
SPI
; SPEI
; PDSI
; Palmer Z-index
; Ethiopia
; food security
; climate change
; droughts
; trend analysis
; autocorrelation
Copyright: This open access article is published under a Creative Commons CC BY 4.0 license, which permit the free download, distribution, and reuse, provided that the author and preprint are cited in any reuse.


