
Submitted:
24 May 2019
Posted:
27 May 2019
You are already at the latest version
Abstract
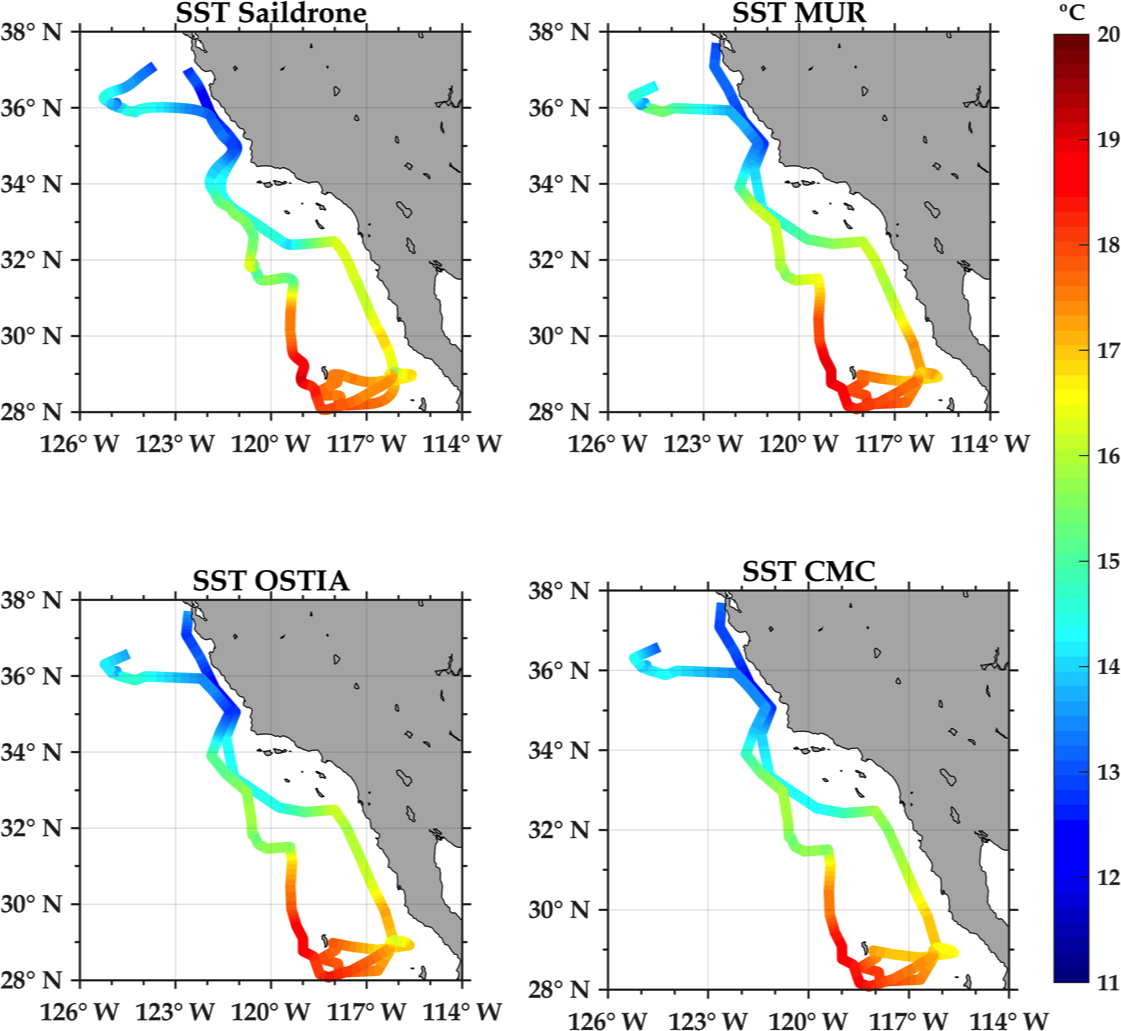
Traditional ways of validating satellite-derived sea surface temperature (SST) and sea surface salinity (SSS) products, using comparisons with buoy measurements, do not allow for evaluating the impact of mesoscale to submesoscale variability. Here we present the validation of remotely-sensed SST and SSS data against the unmanned surface vehicle (USV) – Saildrone – measurements from the Spring 2018 Baja deployment. More specifically, biases and root mean square differences (RMSD) were calculated between USV-derived SST and SSS values, and six satellite-derived SST (MUR, OSTIA, CMC, K10, REMSS, and DMI) and three SSS (JPLSMAP, RSS40, RSS70) products. Biases between the USV SST and OSTIA/CMC/DMI were approximately zero while MUR showed a bias of 0.2C. OSTIA showed the smallest RMSD of 0.36C while DMI had the largest RMSD of 0.5C. An RMSD of 0.4C between Saildrone SST and the satellite-derived products could be explained by the daily variability in USV SST which currently cannot be resolved by remote sensing measurements. For SSS, values from the JPLSMAP product showed saltier biases of 0.2 PSU, while RSS40 and RSS70 showed fresh biases of 0.3 PSU. An RMSD of 0.4 PSU could not be explained solely by the daily variability of the USV-derived SSS. Coherences were significant at the longer wavelengths, with a local maximum at 100 km that is most likely associated with the mesoscale turbulence in the California Current System.
Keywords:
MODIS
; oceanography
; remote sensing
; Saildrone
; sea surface salinity
; sea surface temperature
; SMAP
; validation
Copyright: This open access article is published under a Creative Commons CC BY 4.0 license, which permit the free download, distribution, and reuse, provided that the author and preprint are cited in any reuse.


