Submitted:
25 January 2026
Posted:
26 January 2026
You are already at the latest version
Abstract
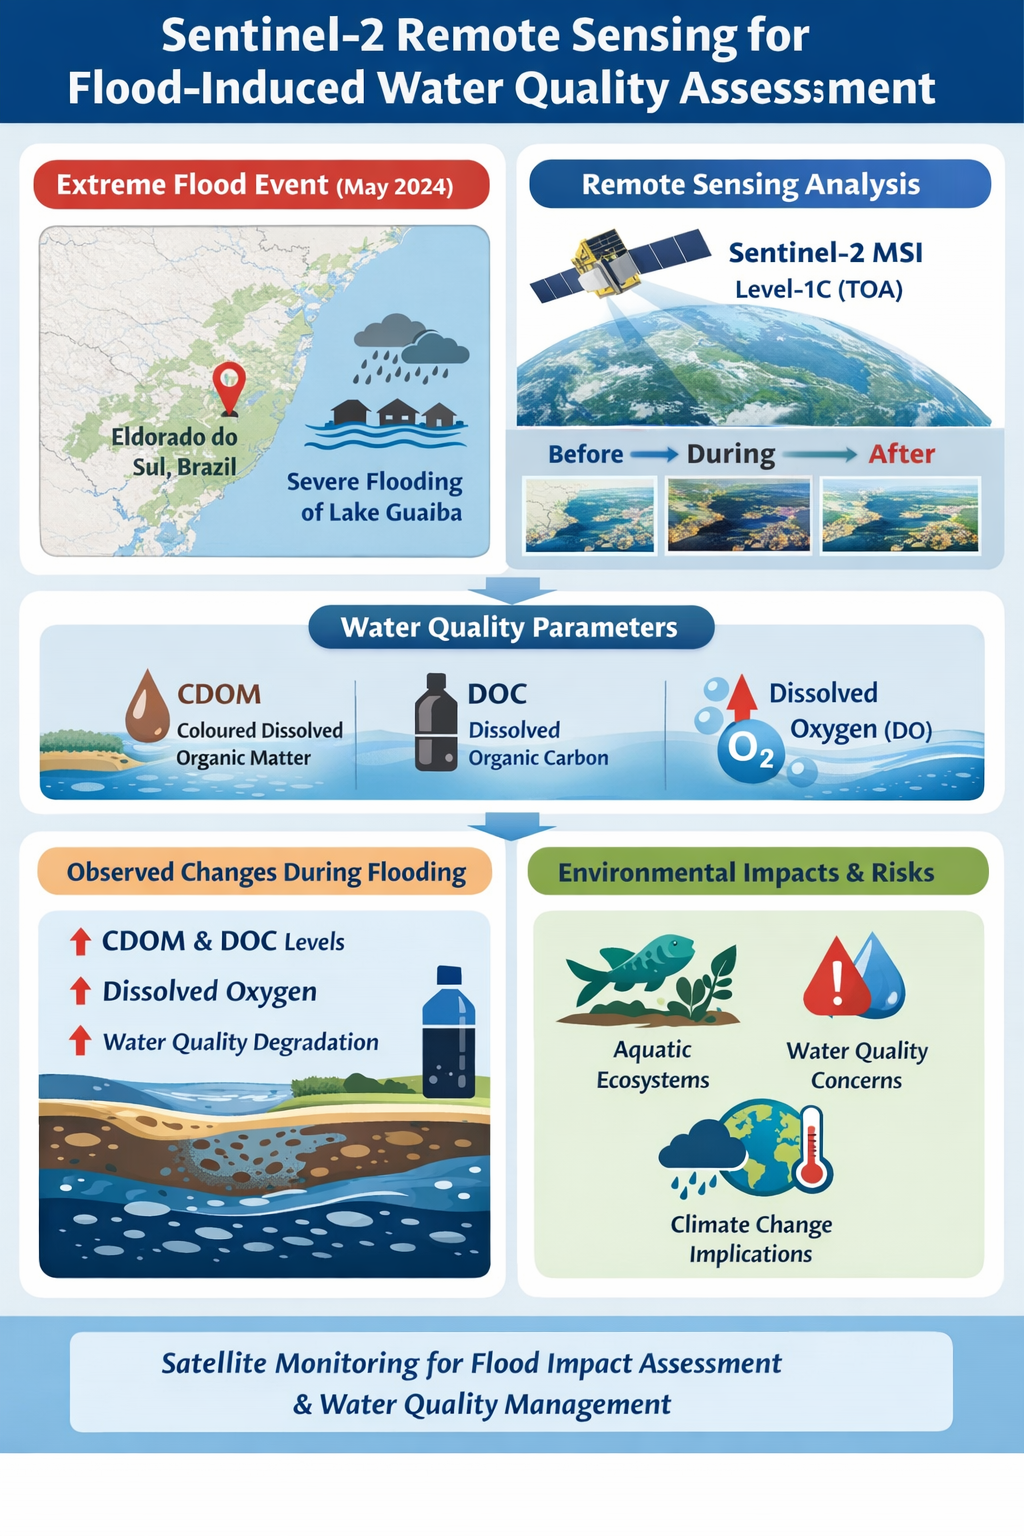
Satellite-based remote sensing has become an essential tool for territorial monitoring and environmental analysis, particularly in the context of extreme events. The European Union’s Copernicus Programme provides open-access satellite data that support near-real-time environmental assessment. Among its missions, the Sentinel-2 satellites, equipped with the Multispectral Instrument (MSI), offer high spatial and spectral resolution through 13 spectral bands, enabling the detection and monitoring of water quality parameters in inland and coastal water bodies.In early May 2024, intense rainfall events in Rio Grande do Sul, southern Brazil, triggered one of the most severe flooding episodes recorded in the region over the past 40 years. The objective of this study was to assess the environmental impacts of this event by mapping the flooded areas and analysing changes in water quality using Sentinel-2 imagery. Temporal analysis based on true-colour composite images allowed the observation of a significant increase in water extent over a seven-day period.Sentinel-2 Level-1C (Top-of-Atmosphere) products were processed using the Copernicus Browser to evaluate variations in coloured dissolved organic matter (CDOM) and dissolved organic carbon (DOC). The results revealed a marked increase in the concentrations of both parameters following the flooding event, indicating a degradation of water quality. Elevated CDOM and DOC levels are commonly associated with increased organic matter inputs and may have implications for water availability and suitability for human and animal consumption.Given the expected increase in the frequency and intensity of extreme weather events driven by climate change, this study highlights the importance of satellite-based remote sensing for rapid environmental monitoring. The Sentinel satellite constellation demonstrates strong potential for near-real-time assessment, offering timely information and broad spatial coverage to support environmental management and decision-making.
Keywords:
Sentinel-2
; Copernicus browser
; water quality
; CDOM
; DOC
; flooding in Rio Grande do Sul
1. Introduction
One of the most promising research directions in environmental sciences is the development of innovative techniques for the remote monitoring of river water quality, as these approaches offer several advantages, including low operational costs and the ability to deliver near-real-time information. Traditionally, water quality monitoring relies on in situ equipment, such as multiparameter probes, designed to measure a range of physicochemical parameters. However, the analysis of these parameters can be significantly enhanced through remote sensing techniques, which complement and optimise conventional monitoring strategies for water quality assessment.
Remote sensing methodologies reduce the time required for data acquisition and analysis, facilitating faster interpretation and enabling the implementation of more efficient, targeted, and timely management measures. The integration of remote sensing with environmental quality monitoring has been widely highlighted in recent studies for the assessment of water quality parameters such as chlorophyll, conductivity, turbidity, and dissolved oxygen (Couto et al., 2021). This methodological framework—combining satellite data with environmental monitoring—represents a rapidly expanding field of research, largely driven by its cost-effectiveness and rapid response capability (Costa and Bortolli, 2022).
The launch of the Multispectral Instrument (MSI) onboards the Sentinel-2 satellites in 2015 marked a significant advance in aquatic remote sensing applications. According to Toming et al. (2016), Sentinel-2 MSI imagery, with spatial resolutions of 10 m, 20 m, and 60 m and data acquisition across 13 spectral bands at a radiometric resolution of 12 bits, enables detailed environmental analysis, including the study of relatively small inland water bodies.
In the context of the global climate crisis, which has intensified the frequency and magnitude of extreme weather events, the use of Sentinel-2 data is particularly promising for the assessment of environmental disasters and their impacts on water quality. As flood events are expected to become more frequent under climate change scenarios, understanding how overland flow transports terrestrial nutrients, dissolved organic carbon (DOC), and living organisms into aquatic systems is essential for evaluating both soil and stream ecosystem conditions (Huong T. Le et al., 2022). Dissolved organic carbon (DOC) and coloured dissolved organic matter (CDOM) have been identified as key indicators of organic matter mineralisation processes and external inputs, and as potential predictors of dissolved CO₂ concentrations in aquatic systems (Sobek et al., 2005; Raymond et al., 2013; Klaus et al., 2019; Qi et al., 2023).
Despite this, the influence of overland flow and its associated bacterial communities on changes in stream bacterial diversity and structure during flood events remains poorly investigated, particularly in tropical regions where flash floods are especially frequent.
In this context, the main objective of this study was to evaluate the suitability of Sentinel-2 MSI data for mapping water quality parameters—specifically CDOM and DOC—during a major flood event in the state of Rio Grande do Sul, Brazil, with a focus on the municipality of Eldorado do Sul. This assessment was conducted using algorithms that have demonstrated strong performance in previous remote sensing studies.
2. Methods
2.1. Study Area and Sampling Sites Characterization
Rio Grande do Sul, Brazil, located in southern Brazil (29°59′49.7″ S, 51°18′28.3″ W), was the region affected by severe flooding events in early May. The state encompasses the Lake Guaíba basin, which covers an area of approximately 2,523 km². During the intense storm events that inundated large portions of Rio Grande do Sul, the water level of Lake Guaíba—which borders the metropolitan region of Porto Alegre—rose significantly, receiving an estimated additional volume of approximately 30 million litres of water between 5 and 6 May.
This information was provided by the Environmental Management Programme of the Port of Porto Alegre, developed through a partnership between the Port Authority of Porto Alegre and the Federal University of Rio Grande do Sul (UFRGS). Figure 1 illustrates the geographical location of the study area.
2.2. Remote Sensing Data Acquisition Platform: Sentinel 2 Satellites
Sentinel-2 data are widely used in scientific studies, particularly imagery acquired by the Multispectral Instrument (MSI). Sentinel-2 products are distributed at different processing levels. Level-1C (L1C) products provide Top-of-Atmosphere (TOA) reflectance, geometrically and radiometrically corrected, while Level-2A (L2A) products provide Bottom-of-Atmosphere (BOA) reflectance following atmospheric correction. In this study, Sentinel-2 MSI data were used to obtain surface reflectance information across 13 spectral bands, with central wavelengths ranging from 443 to 2190 nm (Figure 2).
The MSI spectral bands are characterised by three spatial resolutions: 10 m (Bands 2, 3, 4, and 8), 20 m (Bands 5, 6, 7, 8A, 11, and 12), and 60 m (Bands 1, 9, and 10), enabling the detailed analysis of inland water bodies and flood-affected areas at multiple spatial scales (Pereira et al., 2022).
Two types of orthorectified surface reflectance products are publicly available at the Copernicus Dataspace Ecosystem: Top-of-Atmosphere (L1C), and Bottom-of-Atmosphere (L2A). The latter are L1C atmospherically corrected products using the Sen2Cor algorithm developed by the European Space Agency. In this work we will use L1C products to perform the computations according to the models of each parameter, implemented in javascript and executed in the Copernicus Browser, a cloud computing platform.
2.3. The Remote Sensing Models and Parameter Computation
The parameter maps presented in this work were generated in the Copernicus Browser with the Se2WaQ [Pereira, N., 2022] script according to the models corresponding to each parameter (Toming,et al. 2016), showed in the following equations:
CDOM [mg/L] = 537e−2.93(B03/B04)
DOC [mg/L] = 432e−2.24(B03/B04)
The green (B03) to red (B04) ratio models have demonstrated the best performance for these parameters (Toming et al. 2016, and references therein). CDOM and DOC affect the treatability of drinking water (Eikebrokk, B. et al., 2004), hence the focus of this study to monitor the sudden change observed during the flood event.
3. Results and Discuss
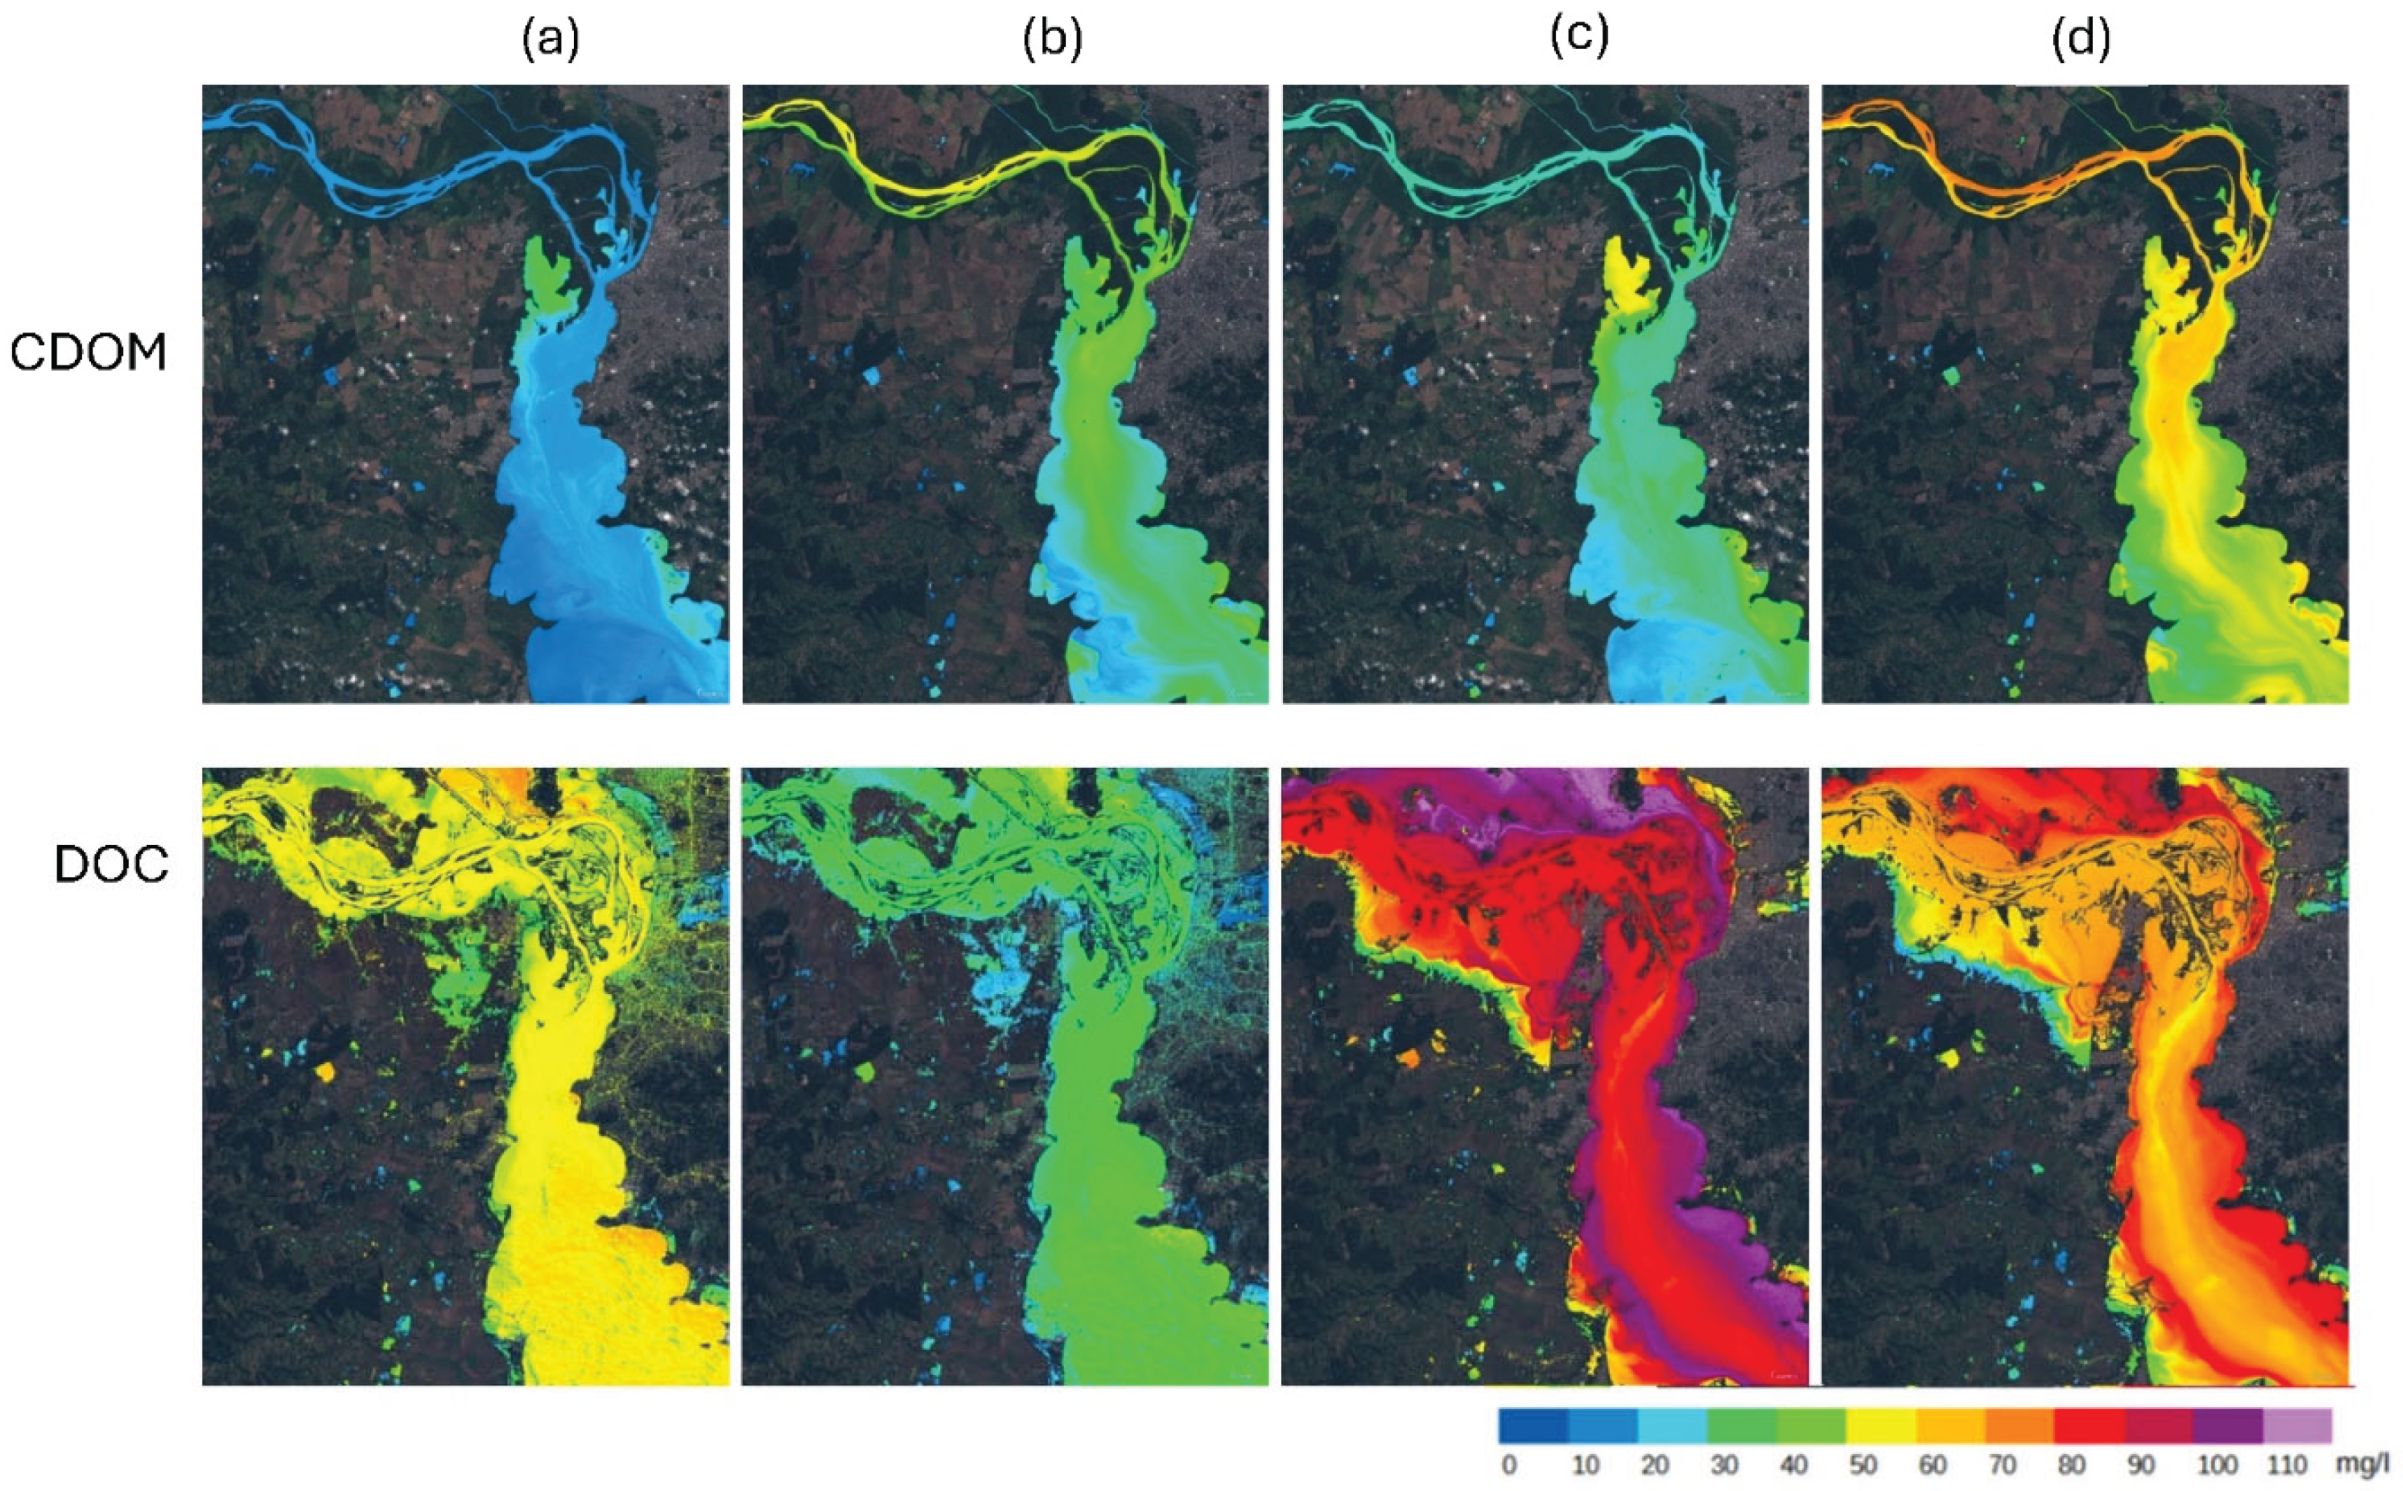
The initial results consisted of unfiltered maps depicting the area surrounding Eldorado do Sul, generated using Sentinel-2 imagery to illustrate pre- and post-flood conditions. Figure 3(a), acquired on 6 March, represents the pre-flood scenario, while Figure 3 (b), dated 16 March, shows the progression of the flooding event. Figure 3 (c), acquired on 6 May, corresponds to the peak of the flood, when the water level of Lake Guaíba reached 5.27 m, exceeding the historical record of 4.76 m observed in 1941. Following this peak, the lake exhibited a gradual recession (Dantas, 2024). Figure 3 (d), acquired on 21 May, indicates a partial reduction in water extent; however, extensive flooded areas remain clearly visible.
Such hydrological extremes have significant implications for both aquatic ecosystems and human populations. Flooding events can disrupt aquatic habitats and water quality, while also posing severe risks to human life and infrastructure. According to Munich Re (2023), global flood-related losses over the past five years have reached approximately USD 300 billion, of which only about USD 45 billion were insured (Schumann, 2024). In addition to economic impacts, floods represent a major public health concern. As reported by Yavarian et al. (2019), floods are among the most widespread natural disasters worldwide and are associated with a broad range of health impacts, including immediate hazards such as drowning and an increased risk of communicable and viral disease transmission during and after flood events.
Based on the temporal analysis and the maps presented in Figure 4, additional maps were generated using Sentinel-2 Level-1C (Top-of-Atmosphere) products with the application of specific spectral filters. The resulting outputs are presented in Figure 4 (a–d), where variations and an overall increase in dissolved oxygen can be observed across the analysed images.
Several studies have demonstrated that the combination of spectral bands can significantly improve the detection and classification of specific surface features. For instance, Myint et al. (2011) showed that object-based image analysis (OBIA) provides a substantially better performance than traditional pixel-based classification approaches. Their study evaluated the influence of different segmentation and classification parameters, including the combined use of composite and original spectral bands and the selection of multiple scale levels for urban land cover classification using high-resolution imagery. The object-based classifier achieved an overall accuracy of 90.4%, whereas the widely used maximum likelihood classifier resulted in a considerably lower accuracy of 67.6%.
More recent research has also focused on flood mapping techniques aimed at detecting flood extent and water depth, which are critical for managing the increasing flood risk associated with global warming. Lee and Li (2024) evaluated flood mapping approaches based on multispectral imagery and binary segmentation, incorporating deep active learning techniques. The authors developed a deep learning-based model for flood mapping and highlighted the need for future research to adopt active learning frameworks that integrate multimodal remote sensing data and advanced interpretation methods.
Numerous studies and review papers have consistently highlighted the significant potential of remote sensing—particularly satellite-based remote sensing—for flood mapping and monitoring applications (Smith, 1997; Schumann and Moller, 2015; Schumann et al., 2018; Domeneghetti et al., 2019; Landuyt et al., 2019; Albertini et al., 2022).
This study aimed to assess the impact of major flood events on water quality degradation in the study region. The colour scale used in the generated maps clearly illustrates temporal changes in water quality parameters. Notably, an increase in dissolved oxygen concentrations was observed, suggesting a potential improvement in water quality following the flood event (Figure 4d). In the applied colour scale, more intense red shades correspond to higher dissolved oxygen concentrations. This increase is likely associated with the large input of organic matter introduced into the aquatic system during flooding.
An increase in dissolved organic carbon (DOC) concentration was observed during the rising stage of the flood, suggesting enhanced inputs of soil-derived DOC into the stream system. Similar and significant increases in DOC concentrations have been reported in the Hunter River and its tributaries in Australia following major flood events (Carney et al., 2015).
This process is expected to become increasingly recurrent, according to studies based on climate projections from the Coupled Model Intercomparison Project Phase 6 (CMIP6), which integrates modelling outputs from global climate models such as NASA’s Goddard Institute for Space Studies (GISS) ModelE. Extreme precipitation events observed in the study region are consistent with broader climate change patterns driven by rising atmospheric concentrations of carbon dioxide and other greenhouse gases. According to the Sixth Assessment Report of the Intergovernmental Panel on Climate Change (IPCC), southern South America is projected to experience substantial increases in total annual precipitation and in the magnitude of annual five-day maximum precipitation events by 2050.
4. Conclusions
This study documents the environmental disaster that affected Eldorado do Sul, Brazil, in May 2024 and demonstrates the potential of Sentinel-2 remote sensing data for assessing flood-related impacts on water quality. The analysis highlights the relevance of coloured dissolved organic matter (CDOM) and dissolved organic carbon (DOC) as key parameters for evaluating water quality dynamics and for anticipating post-flood conditions as water levels recede.
Variations in dissolved oxygen concentrations were also observed, a factor that directly influences aquatic ecosystems and may have implications for soil quality in the affected region. These findings underscore the importance of monitoring physicochemical water quality parameters during and after extreme hydrological events.
Satellite-based remote sensing, particularly through multispectral imaging systems such as Sentinel-2, plays a crucial role in enhancing the understanding of the environmental impacts of extreme weather events. Its capacity for rapid data acquisition, large spatial coverage, and repeated observations makes it a valuable tool for assessing water quality degradation and supporting risk evaluation and environmental management in flood-prone regions.
Declaration of competing interest:
The authors declare that they have no known competing financial interests or personal relashionship that could have appeared to influence thw work reported in this paper.
References
- Albertini, C., Gioia, A., Iacobellis, V., and Manfreda, S. (2022). Detection of surface water and floods with multispectral satellites. Remote Sens. 14 (23), 6005. [CrossRef]
- Campos, Z. J., da Silva, F. M. O., Pereira, N. S. A., Monitoring the Water Quality of the Guadiana River with Multispectral Imagens from Sentinel-2 Satellites, poster presented at the 3rd International Conference on Water Management and its Surroundings – Theoretical and Practical Aspects, 2023. https://10.13140/RG.2.2.12597.04323.
- Carney RL, Mitrovic SM, Jeffries T, Westhorpe D, Curlevski N, Sey- mour JR (2015) River bacterioplankton community responses to a high inflow event. Aquat Microb Ecol 75:187–205 . [CrossRef]
- Couto FT, Cardoso EHC, Costa MJ, Salgado R, Guerrero-Rascado JL, Salgueiro V (2021) How a mesoscale cyclonic vortex over Sahara leads to a dust outbreak in South-western Iberia. Atmospheric Research, 249, 105302. [CrossRef]
- Domeneghetti, A., Schumann, G. J.-P., and Tarpanelli, A. (2019). Preface: remote sensing for flood mapping and monitoring of flood dynamics. Remote Sens. 11 (8), 943. [CrossRef]
- Eikebrokk, B.; Vogt, R.D.; Liltved, H. NOM increase in Northern European source waters: Discussion of possible causes and impacts on coagulation/contact filtration processes. Water Sci. Technol. Water Supply 2004, 4, 47–54. [CrossRef]
- Hunter, P.D.; Tyler, A.N.; Carvalho, L.; Codd, G.A.; Maberly, S.C. Hyperspectral remote sensing of cyanobacterial pigments as indicators for cell populations and toxins in eutrophic lakes. Remote Sens. Environ. (2010), 114, 2705–2718. [CrossRef]
- Hyunho Lee, Wenwen Li, Improving interpretability of deep active learning for flood inundation mapping through class ambiguity indices using multi-spectral satellite imagery, Remote Sensing of Environment, Vol 309, (2024), 114213. [CrossRef]
- Landuyt, L., Van Wesemael, A., Schumann, G. J.-P., Hostache, R., Verhoest, N. E. C., and Van Coillie, F. M. B. (2019). Flood mapping based on synthetic aperture radar: an assessment of established approaches. IEEE Trans. Geoscience Remote Sens. 57 (2), 722–739. [CrossRef]
- M. Klaus, D.A. Seekell, W. Lidberg, J. Karlsson Evaluations of climate and land management effects on lake carbon cycling need to account for temporal variability in CO2 concentrations Glob. Biogeochem. Cycles, 33 (2019), pp. 243-265 . [CrossRef]
- Maria João Costa; Daniele Bortoli. "Editorial for the Special Issue “Air Quality Research Using Remote Sensing”". Remote Sensing (2022): . [CrossRef]
- Marina Dantas. https://www.correiobraziliense.com.br/brasil/2024/05/6854937-chuvas-no-rs-guaiba-recebeu-mais-de-30-milhoes-de-litros-de-agua-em-dois-dias.html post in 10/05/2024 17:09 / update 10/05/2024 17:15.
- Munich Re (2023). Riscos de inundação em ascensão. Disponível em: https://www.munichre.com/en/risks/natural-disasters/floods.html (Acessado em 11 de novembro de 2023).
- Painel Intergovernamental sobre Mudanças Climáticas (2021) Ficha técnica regional — América Central e do Sul. Acessado em 28 de maio de 2024.
- Pereira, N. S. A., Haut J. M., Plaza, J., Plaza, A., Single board computers for efficient on-board multispectral image processing, Finnish Satellite Workshop (2021),. [CrossRef]
- Pereira, N. S. A.: Se2WaQ v2 (2022). [CrossRef]
- Raymond, P., Hartmann, J., Lauerwald, R. et al. Global carbon dioxide emissions from inland waters. Nature 503, 355–359 (2013). [CrossRef]
- S. Sobek, L.J. Tranvik, J.J. Cole Independência da temperatura da supersaturação de dióxido de carbono em lagos globais Glob. Biogeoquímica. Ciclos, 19 (2005), Artigo GB 2003.
- Schumann, G. J.-P., and Moller, D. K. (2015). Microwave remote sensing of flood inundation. Phys. Chem. Earth 83-84, 84–95. 83–84. [CrossRef]
- Schumann, G. J.-P., Brakenridge, G. R., Kettner, A. J., Kashif, R., and Niebuhr, E. (2018). Assisting flood disaster response with earth observation data and products: a critical assessment. Remote Sens. 10 (8), 1230. [CrossRef]
- Schumann Guy, J-P., Breakthroughs in satellite remote sensing of floods, Frontiers in Remote Sensing, Vol 4, (2024). [CrossRef]
- Smith, L. C. (1997). Satellite remote sensing of river inundation area, stage, and discharge: a review. Hydrol. Process. 11, 1427–1439. [CrossRef]
- Soe W. Myint, Patricia Gober, Anthony Brazel, Susanne Grossman-Clarke, Qihao Weng, Per-pixel vs. object-based classification of urban land cover extraction using high spatial resolution imagery, Remote Sensing of Environment, Volume 115, Issue 5, (2011), Pages 1145-1161. [CrossRef]
- Tianci Qi, Ming Shen, Tiit Kutser, Qitao Xiao, Zhigang Cao, Jinge Ma, Juhua Luo, Dong Liu, Hongtao Duan, Remote sensing of dissolved CO2 concentrations in meso-eutrophic lakes using Sentinel-3 imagery, Remote Sensing of Environment, Volume 286, (2023), 113431. [CrossRef]
- Toming, K.; Kutser, T.; Laas, A.; Sepp, M.; Paavel, B.; Nõges, T. First Experiences in Mapping Lake Water Quality Parameters with Sentinel-2 MSI Imagery. Remote Sens. (2016), 8, 640 . [CrossRef]
- Yavarian J, Shafiei-Jandaghi NZ, Mokhtari-Azad T. Possible viral infections in flood disasters: a review considering (2019) spring floods in Iran. Iran J Microbiol. (2019) Apr;11(2):85-89. PMID: 31341561; PMCID: PMC6635310. [CrossRef]
Figure 1.
Location of the flood-affected areas in Rio Grande do Sul, Brazil, based on Google Maps and OpenStreetMap (OSM) data.
Figure 1.
Location of the flood-affected areas in Rio Grande do Sul, Brazil, based on Google Maps and OpenStreetMap (OSM) data.
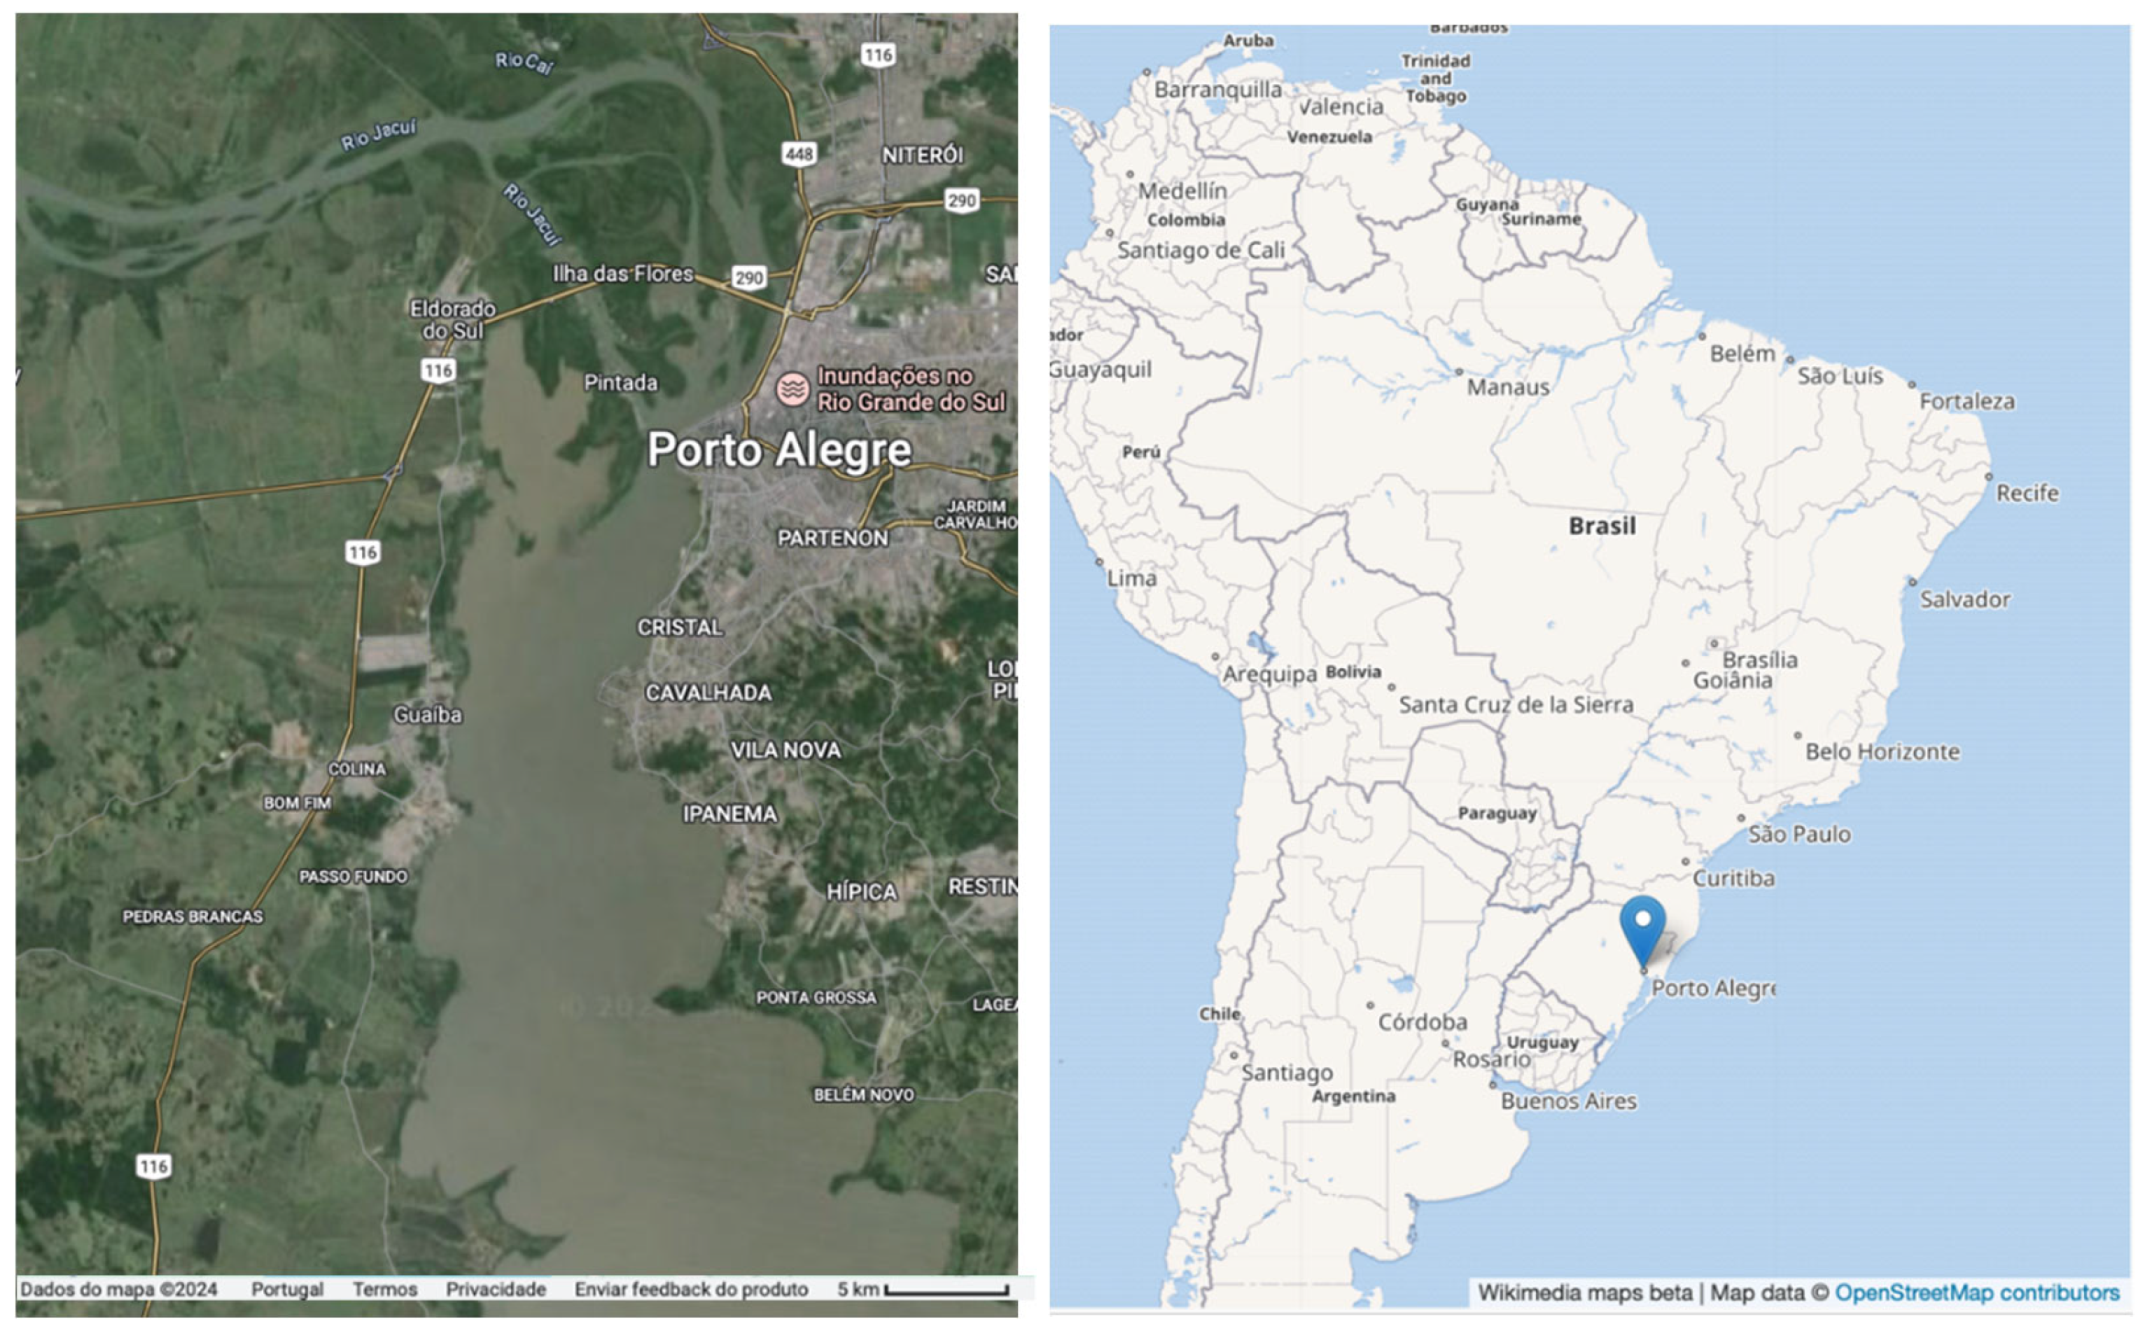
Figure 2.
Band list, bandwidth and corresponding spatial resolution of the multispectral imaging instrument of Sentinel 2 satellites [Pereira et al., 2021].
Figure 2.
Band list, bandwidth and corresponding spatial resolution of the multispectral imaging instrument of Sentinel 2 satellites [Pereira et al., 2021].
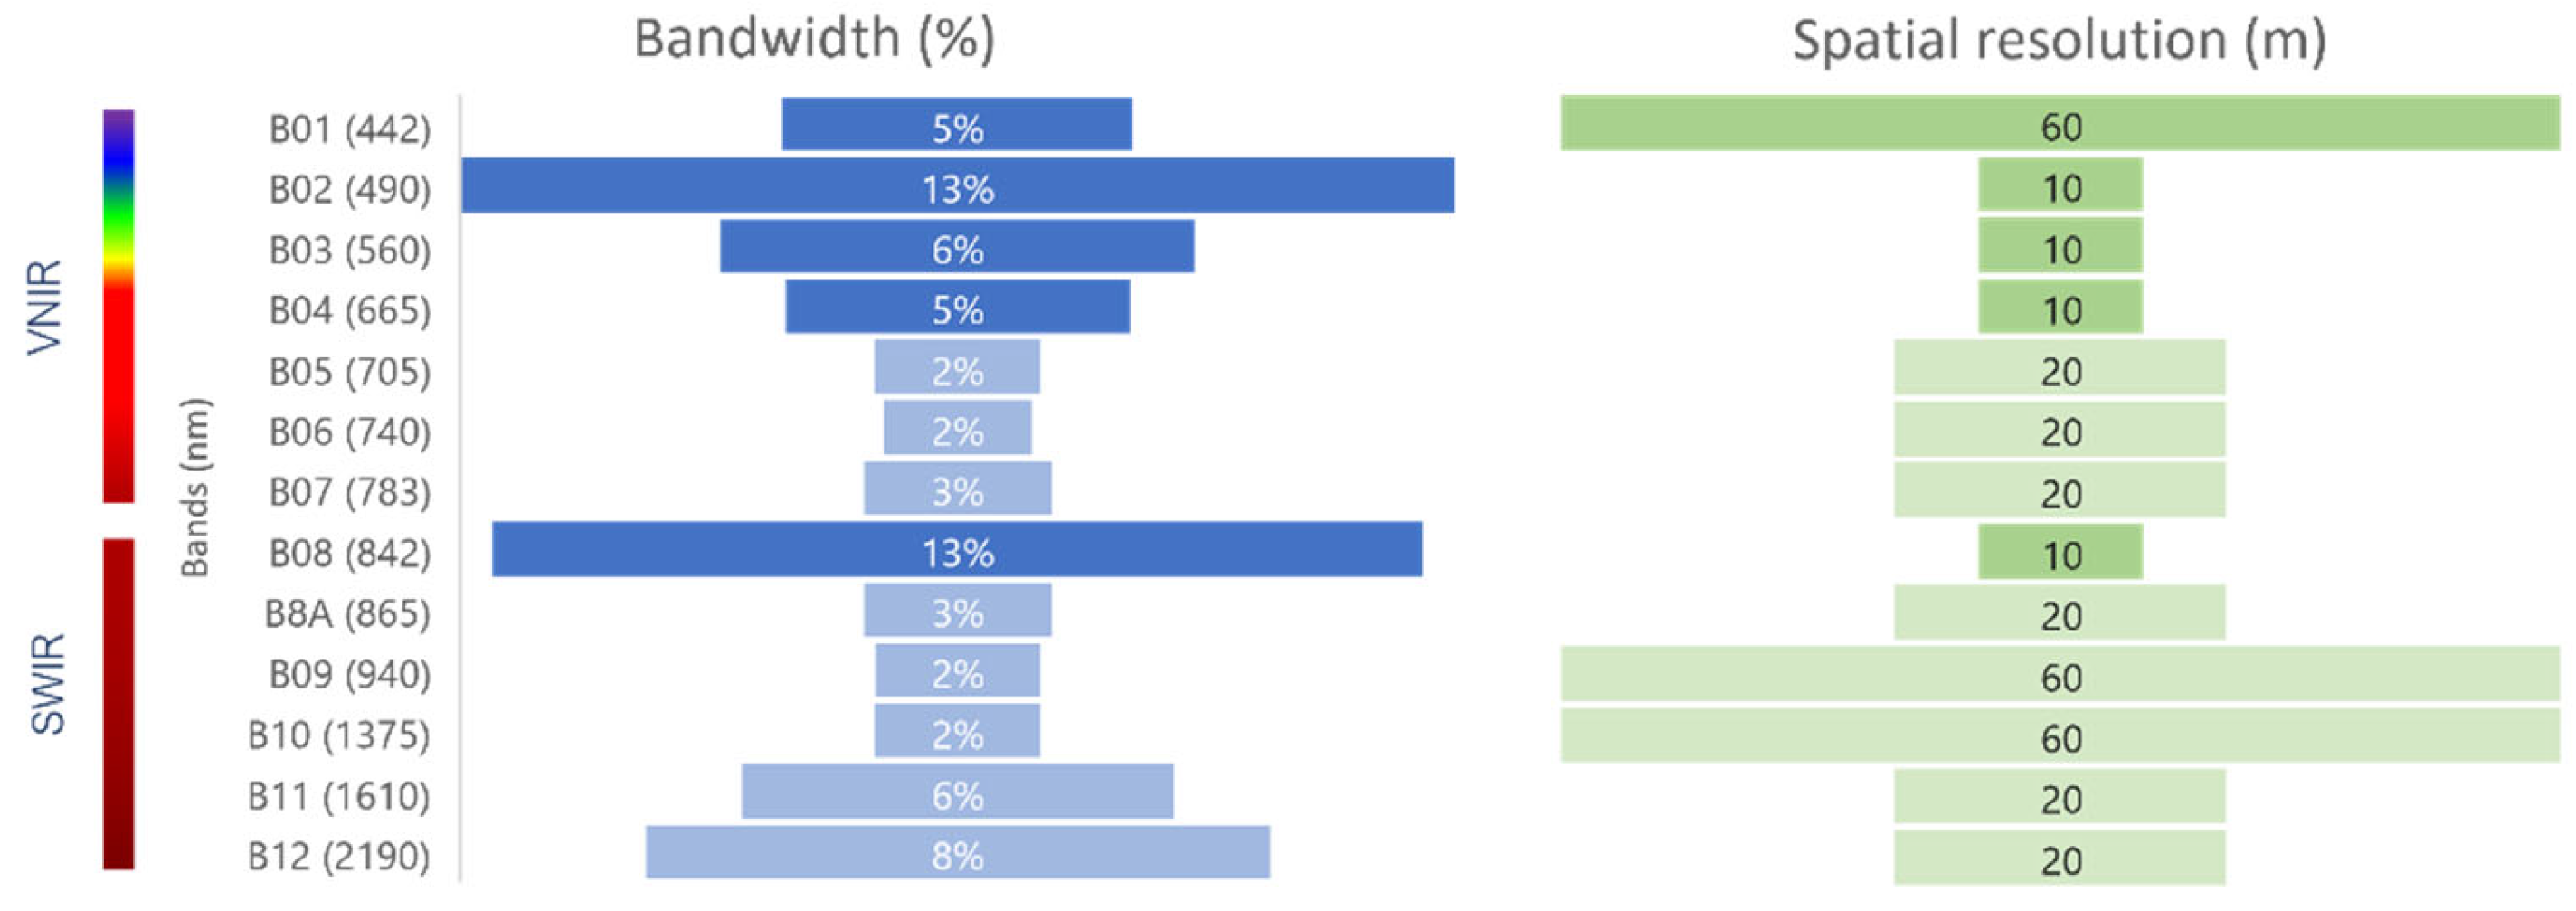
Figure 3.
True-colour composite images generated using Sentinel-2 data on the Copernicus Browser, illustrating the flooding event in Eldorado do Sul, Brazil, on 6 March (a), 16 March (b), 6 May (c), and 21 May (d) 2024.
Figure 3.
True-colour composite images generated using Sentinel-2 data on the Copernicus Browser, illustrating the flooding event in Eldorado do Sul, Brazil, on 6 March (a), 16 March (b), 6 May (c), and 21 May (d) 2024.
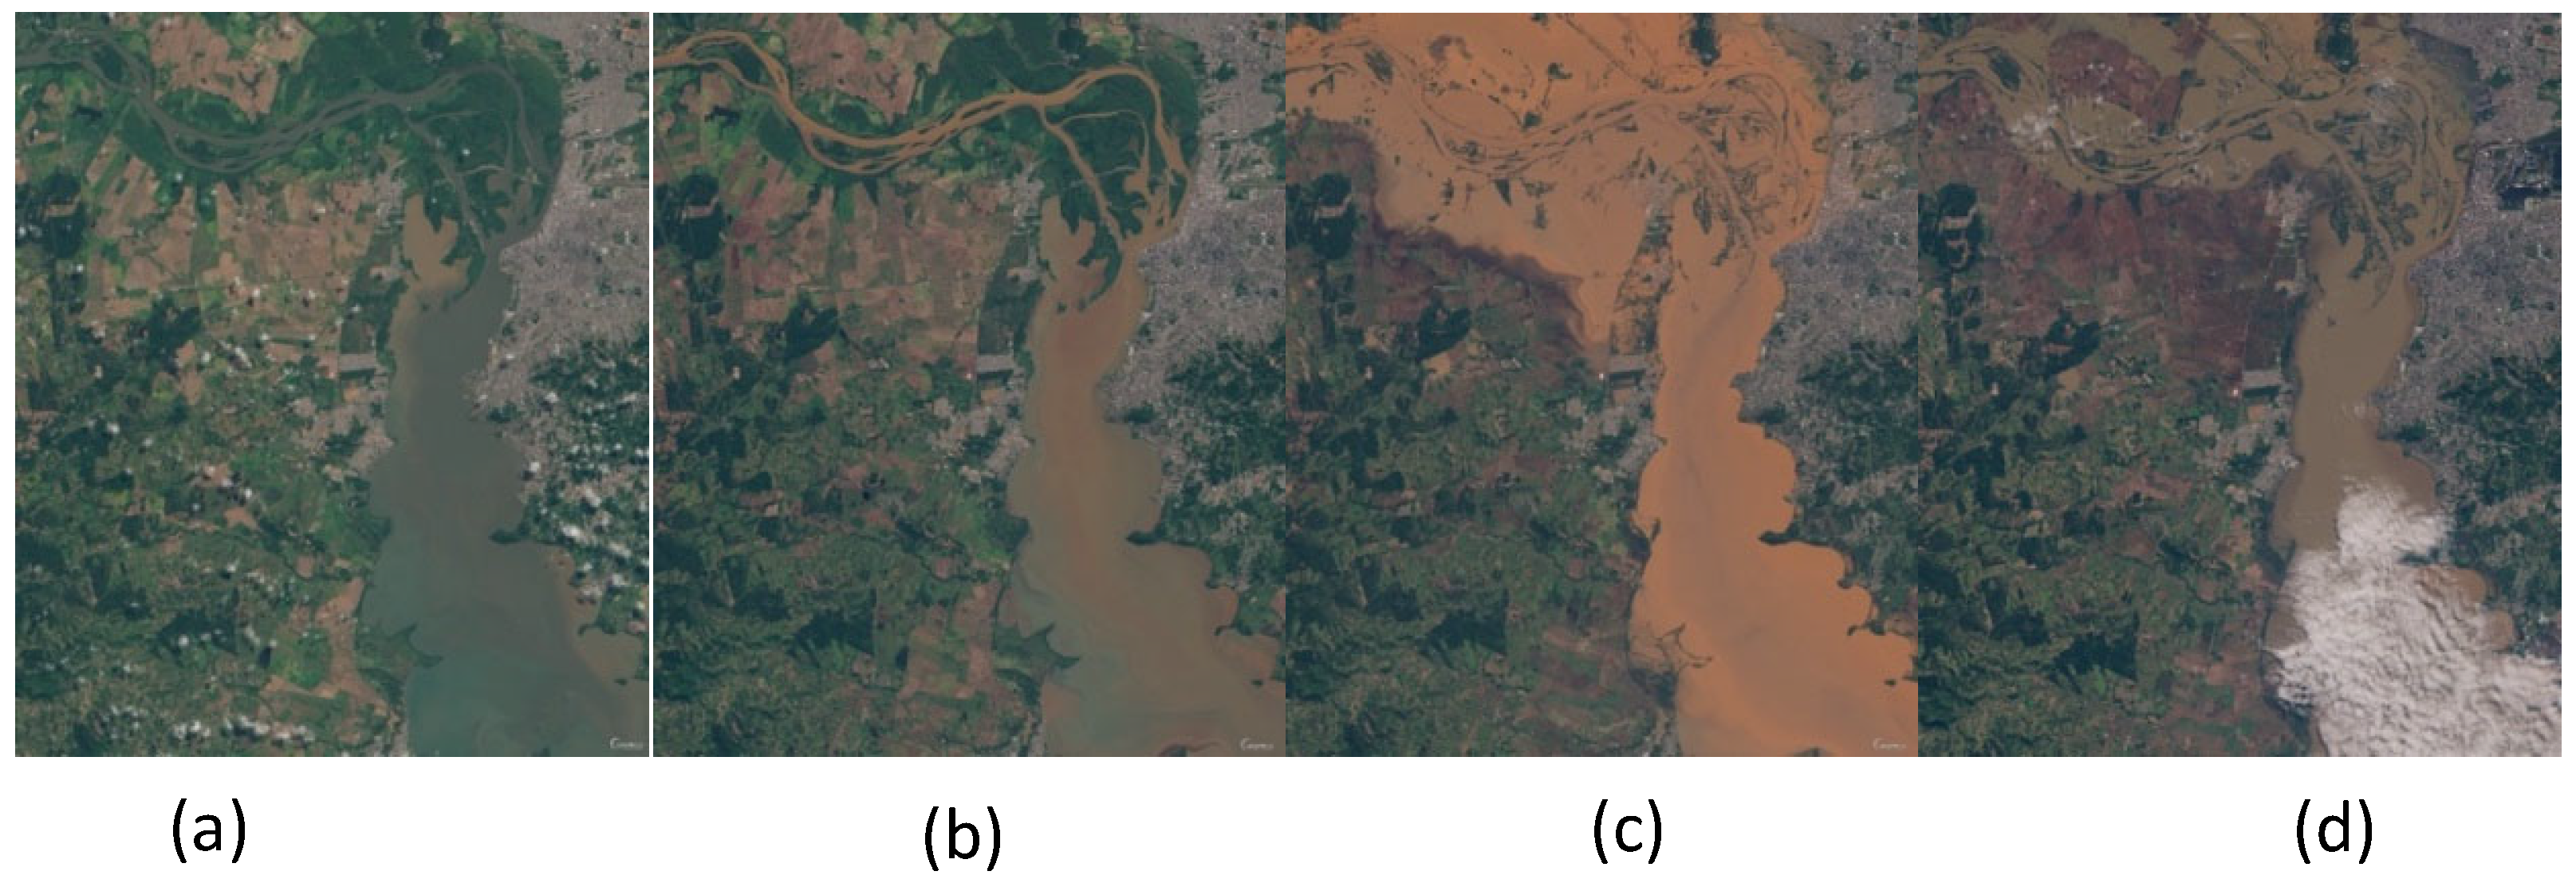
Figure 4.
Maps generated for 6 March (a), 16 March (b), 6 May (c), and 21 May (d) 2024 using the Se2WaQ script and Sentinel-2 Level-1C products on the Copernicus Browser, illustrating water quality conditions during the flooding event in Eldorado do Sul, Brazil. The colour scale was adapted to enhance visual contrast.
Disclaimer/Publisher’s Note: The statements, opinions and data contained in all publications are solely those of the individual author(s) and contributor(s) and not of MDPI and/or the editor(s). MDPI and/or the editor(s) disclaim responsibility for any injury to people or property resulting from any ideas, methods, instructions or products referred to in the content. |
© 2026 by the authors. Licensee MDPI, Basel, Switzerland. This article is an open access article distributed under the terms and conditions of the Creative Commons Attribution (CC BY) license.
Copyright: This open access article is published under a Creative Commons CC BY 4.0 license, which permit the free download, distribution, and reuse, provided that the author and preprint are cited in any reuse.


