
Submitted:
05 January 2026
Posted:
12 January 2026
You are already at the latest version
Abstract
Knee osteoarthritis (KOA) is a progressive degenerative joint disorder characterized by cartilage loss, subchondral bone remodeling, and inflammation, ultimately leading to pain and impaired mobility. Early and accurate assessment of KOA severity is essential for personalized clinical management. Although the Kellgren–Lawrence (KL) grading system remains the radiographic gold standard, it is limited by subjectivity and inter-observer variability. This study evaluates a radiomics-based machine learning framework using Teachable Machine for automated KOA grading from knee X-ray images. Radiographs were categorized into KL Grades 0–4, and radiomic features capturing intensity and texture patterns were used to train models under varying epoch and batch-size configurations. The results demonstrate that model performance varied significantly across grades, with consistently higher accuracy for extreme grades (G0 and G4) and lower performance for early and intermediate grades (G1–G3), reflecting the subtle nature of mild KOA changes. Optimal performance was observed at moderate training durations (80–90 epochs) and larger batch sizes, while extended training (100 epochs) led to overfitting and reduced generalizability. Despite these challenges, the radiomics-based approach shows potential for objective and reproducible KOA severity assessment. This work highlights the feasibility of accessible ML platforms for supporting clinical decision-making and improving KOA diagnostic workflows.
Keywords:
knee osteoarthritis
; X-ray radiomics
; Kellgren–Lawrence grading
; machine learning
; texture analysis
; diagnostic imaging
Introduction
Knee osteoarthritis (KOA) is a chronic, progressive musculoskeletal disorder characterized by the deterioration of articular cartilage, subchondral bone remodeling, osteophyte formation, and synovial inflammation (1). It is one of the leading causes of pain, disability, and reduced quality of life among adults worldwide, with its prevalence expected to raise due to aging populations and increasing obesity rates (2). Early identification and accurate grading of KOA are essential for timely intervention, monitoring disease progression, and guiding personalized treatment strategies. The Kellgren–Lawrence (KL) classification remains the clinical gold standard for radiographic assessment; however, its reliance on subjective interpretation contributes to substantial inter- and intra-observer variability (3 and 4). Advances in medical imaging and computational analysis have enabled the emergence of radiomics, a quantitative approach that extracts high-dimensional features from medical images to characterize disease phenotypes more objectively (5). Radiomics has demonstrated strong potential in oncology, neurology, and musculoskeletal imaging, offering enhanced reproducibility and deeper image-derived insights beyond visual assessment alone. In KOA research, radiomic descriptors capturing texture, intensity, and shape features have shown promise in detecting early structural changes, predicting disease progression, and improving diagnostic consistency (6).
Machine learning (ML) methods further enhance the value of radiomics by enabling automated KOA classification and severity prediction. While deep learning approaches have shown strong performance, their black-box nature limits interpretability. In contrast, radiomics-based ML offers a more transparent and interpretable alternative, potentially supporting clinical decision-making through explainable biomarkers. This study investigates the feasibility of using radiomics and accessible ML platforms to classify KOA severity, addressing the need for scalable, objective, and reproducible diagnostic tools.
Materials and Methods
We used a curated radiomics dataset of KOA X-ray images from Kaggle (CC0 license), allowing unrestricted reuse. The dataset includes knee joint detection images and KL grades: Grade 0 (healthy), Grade 1 (doubtful narrowing/possible lipping), Grade 2 (definite osteophytes), Grade 3 (multiple osteophytes), and Grade 4 (large osteophytes). Two radiologists independently verified all annotations. Five Grade 0 images were excluded due to poor quality. To maintain balanced classes, we selected 200 images per grade for model development. No patient-identifiable data were present, so ethical approval was not required.
The dataset was uploaded to Google Teachable Machine (GTM), a web-based ML platform using TensorFlow.js. GTM automatically preprocesses images by resizing them to 224×224 pixels, normalizing pixel values to the 0–1 range, and randomly shuffling samples for balanced training. The images were organized into five class folders, each representing a diagnostic category. GTM automatically divided the dataset into 85% for training and 15% for internal validation. Model development was carried out using GTM’s advanced settings, which allow manual hyperparameter configuration. Based on platform recommendations and initial exploratory tests, the model was trained for 50 epochs with a batch size of 16 and a learning rate of 0.0001 (Figure 1). GTM uses transfer learning by fine-tuning pre-trained CNN architectures such as MobileNet on the uploaded dataset, with optimization performed using the Adam optimizer.
Images were automatically resized and normalized before training. GTM also provides real-time plots of training and validation accuracy and loss, which were monitored to ensure stable convergence and to detect signs of over fitting. Preliminary tests with alternative hyperparameters such as higher learning rates or different epoch settings resulted in poorer accuracy and unstable loss behavior, confirming that the selected configuration offered the best performance for this feasibility study. Due to platform limitations, cross-validation, data augmentation, and regularization techniques (e.g., dropout) were not applied. Their absence may affect the model’s generalizability and robustness, which is acknowledged in the study limitations. Future work incorporating more advanced hyperparameter tuning and augmentation strategies may further improve classification performance.
Results and Discussion
The performance evaluation of the GTM-based radiomics classification model for KOA across KL grades (G0–G4) revealed a diverse range of accuracies depending on the training configurations, specifically the combination of epochs (50–100) and batch sizes (16, 32, 64) (Table 1). At the lower training duration of 50 epochs, the model demonstrated moderate but inconsistent predictive ability across grades, with the highest accuracy observed for G2 (0.57 at batch size 32) and relatively stable performance for G0. As the training duration increased to 60 epochs, notable improvements began to emerge: for instance, G0 accuracy increased substantially, reaching 0.83 at batch size 64, while G4 also showed enhanced precision (0.65 at batch size 64), suggesting that the model benefited from additional training iterations. However, the intermediate grades (G1–G3), particularly G1, exhibited pronounced inconsistencies, with accuracies frequently falling below 0.30, indicating the challenges associated with identifying subtle radiographic features characteristic of early KOA. Further increases in training duration to 70 and 80 epochs provided mixed results; although certain grades improved such as G4 is achieving 0.65 at 70 epochs with batch size 16, and G0 reaching 0.81 at 80 epochs with batch size 32 the mid-grades still fluctuated unpredictably. These variations point to the influence of class imbalance or less distinctive morphological transitions in mild or moderate stages. When the model was trained for 90 epochs, performance peaked for several classes, with G0 reaching 0.70 (batch size 32) and G2 achieving its highest accuracy of 0.60 (batch size 64). Nonetheless, this improvement did not generalize across all grades, as G1 and G3 remained unstable, further highlighting the complexity of distinguishing between adjacent KL grades using radiomic signatures alone. Notably, at 100 epochs, the model displayed signs of overfitting: despite the highest single-class accuracy recorded for G0 at 0.85 (batch size 16), performance for other grades, particularly G4, deteriorated significantly, with multiple configurations yielding an accuracy of 0.0. This indicates that excessive iterations may have caused the model to memorize training features rather than generalize effectively.
Across all experiments, batch size played a crucial role in determining predictive stability. Batch size 16, although capable of producing high peaks, tended to generate volatile results, while batch size 32 provided moderate but more consistent outputs. In contrast, batch size 64 delivered some of the strongest class-wise accuracies overall, especially for the extreme classes (G0 and G4), suggesting that larger batches may help stabilize gradient updates in radiomic image classification tasks. Overall, the results indicate that KOA grade prediction using Teachable Machine is most reliable for extreme grades, where visual differences are more pronounced, while early and intermediate grades remain difficult to classify due to subtle radiographic distinctions. Optimal training performance was achieved around 80–90 epochs with larger batch sizes, though careful tuning is required to avoid overfitting and maintain balanced performance across all KOA severity levels. Because of the study’s pilot nature and small sample size, no formal statistical tests were performed. Confidence intervals were reported instead, and larger datasets will be required for future hypothesis-driven analyses.
The performance of the GTM–based radiomics model for KOA classification demonstrates that the severity extremes (G0 and G4) are more consistently and accurately predicted than intermediate grades. This pattern is common in osteoarthritis imaging studies, where early and mild disease (G1–G2) exhibit subtle radiographic changes that are difficult for both clinicians and machine learning models to detect. The variability in accuracy across training configurations suggests that the model is highly sensitive to hyperparameters, particularly batch size and number of epochs. Larger batch sizes generally improved stability, while moderate training durations (~80–90 epochs) produced the most reliable overall performance. However, the decline in accuracy at 100 epochs indicates over fitting, where the model begins to memorize training images rather than learning generalizable patterns.
The moderate performance in G2 and G3 further highlights the need for enhanced feature extraction, potentially integrating additional radiomic descriptors, clinical metadata, or deep feature embeddings. Class imbalance may also have influenced the inconsistent predictions, especially for mid-grades that naturally have fewer labeled examples. Overall, the results emphasize that while Teachable Machine offers a simple and accessible platform for model development, achieving robust KOA grade classification requires refined training strategies and improved dataset quality.
Limitations
This study has several limitations. First, the dataset may have been imbalanced, particularly for mid-grade KOA classes, potentially biasing the model toward high performance in extreme grades while underperforming in G1–G3. Second, GTM provides limited control over advanced model architectures, feature extraction, and hyperparameter tuning, restricting optimization. Third, the radiomic features extracted from X-rays may not fully capture the complexity of early KOA changes. Additionally, the study lacks external validation, which limits generalizability. Finally, image variability related to acquisition conditions and preprocessing may have influenced classification accuracy.
Conclusions
The study demonstrates that GTM can reliably classify extreme KOA grades (G0 and G4) using radiomic features, while predicting early and intermediate grades remains challenging. Optimal performance was achieved at moderate training durations and larger batch sizes, though the model exhibited overfitting at higher epochs. These findings highlight the potential of automated image-based KOA screening tools but also emphasize the need for improved datasets, balanced class representation, and more advanced model architectures. Overall, this work provides a foundation for developing accessible ML tools for osteoarthritis assessment, with opportunities for refinement through enhanced radiomics and deep learning integration.
Funding
The author(s) received no financial support for this article's research, authorship, and/or publication.
Acknowledgments
The authors are acknowledged to the AVMC&H, Vinayaka Mission’s Research Foundation (Deemed to be University), Puducherry Campus for providing all the required facilities to complete this study.
Conflicts of Interests
The authors have none to declare.
Disclosures
None.
References
- Felson DT, Lawrence RC, Dieppe PA, Hirsch R, Helmick CG, Jordan JM, Kington RS, Lane NE, Nevitt MC, Zhang Y, Sowers M. Osteoarthritis: new insights. Part 1: the disease and its risk factors. Annals of internal medicine. 2000 Oct 17;133(8):635-46.
- Hunter DJ, March L, Chew M. Osteoarthritis in 2020 and beyond: a Lancet Commission. The Lancet. 2020 Nov 28; 396(10264):1711-2.
- Kellgren JH, Lawrence J. Radiological assessment of osteo-arthrosis. Ann Rheum Dis. 1957 Dec 1;16(4):494-502.
- Damen J, Schiphof D, Ten Wolde S, Cats HA, Bierma-Zeinstra SM, Oei EH. Inter-observer reliability for radiographic assessment of early osteoarthritis features: the CHECK (cohort hip and cohort knee) study. Osteoarthritis and Cartilage. 2014 Jul 1;22(7):969-74.
- Lambin P, Rios-Velazquez E, Leijenaar R, Carvalho S, Van Stiphout RG, Granton P, Zegers CM, Gillies R, Boellard R, Dekker A, Aerts HJ. Radiomics: extracting more information from medical images using advanced feature analysis. European journal of cancer. 2012 Mar 1;48(4):441-6.
- Li S, Cao P, Li J, Chen T, Luo P, Ruan G, Zhang Y, Wang X, Han W, Zhu Z, Dang Q. Integrating radiomics and neural networks for knee osteoarthritis incidence prediction. Arthritis & Rheumatology. 2024 Sep;76(9):1377-86.
Figure 1.
Dataset distribution and training interface in GTM for KOA Classification. This figure illustrates the dataset composition and training configuration used for developing the KOA classification model. KL grades were incorporated: G0 (n = 2286), G1 (n = 1046), G2 (n = 1516), G3 (n = 757), and G4 (n = 173). Each panel displays representative knee X-ray samples uploaded for the corresponding class. The right section of the figure shows the GTM training interface, where key hyperparameters epochs, batch size, and learning rate were adjusted to evaluate the effect of different training settings on classification performance. This setup provided a visual overview of class imbalance, with substantially fewer images in higher severity grades, particularly G4, which influenced model accuracy.
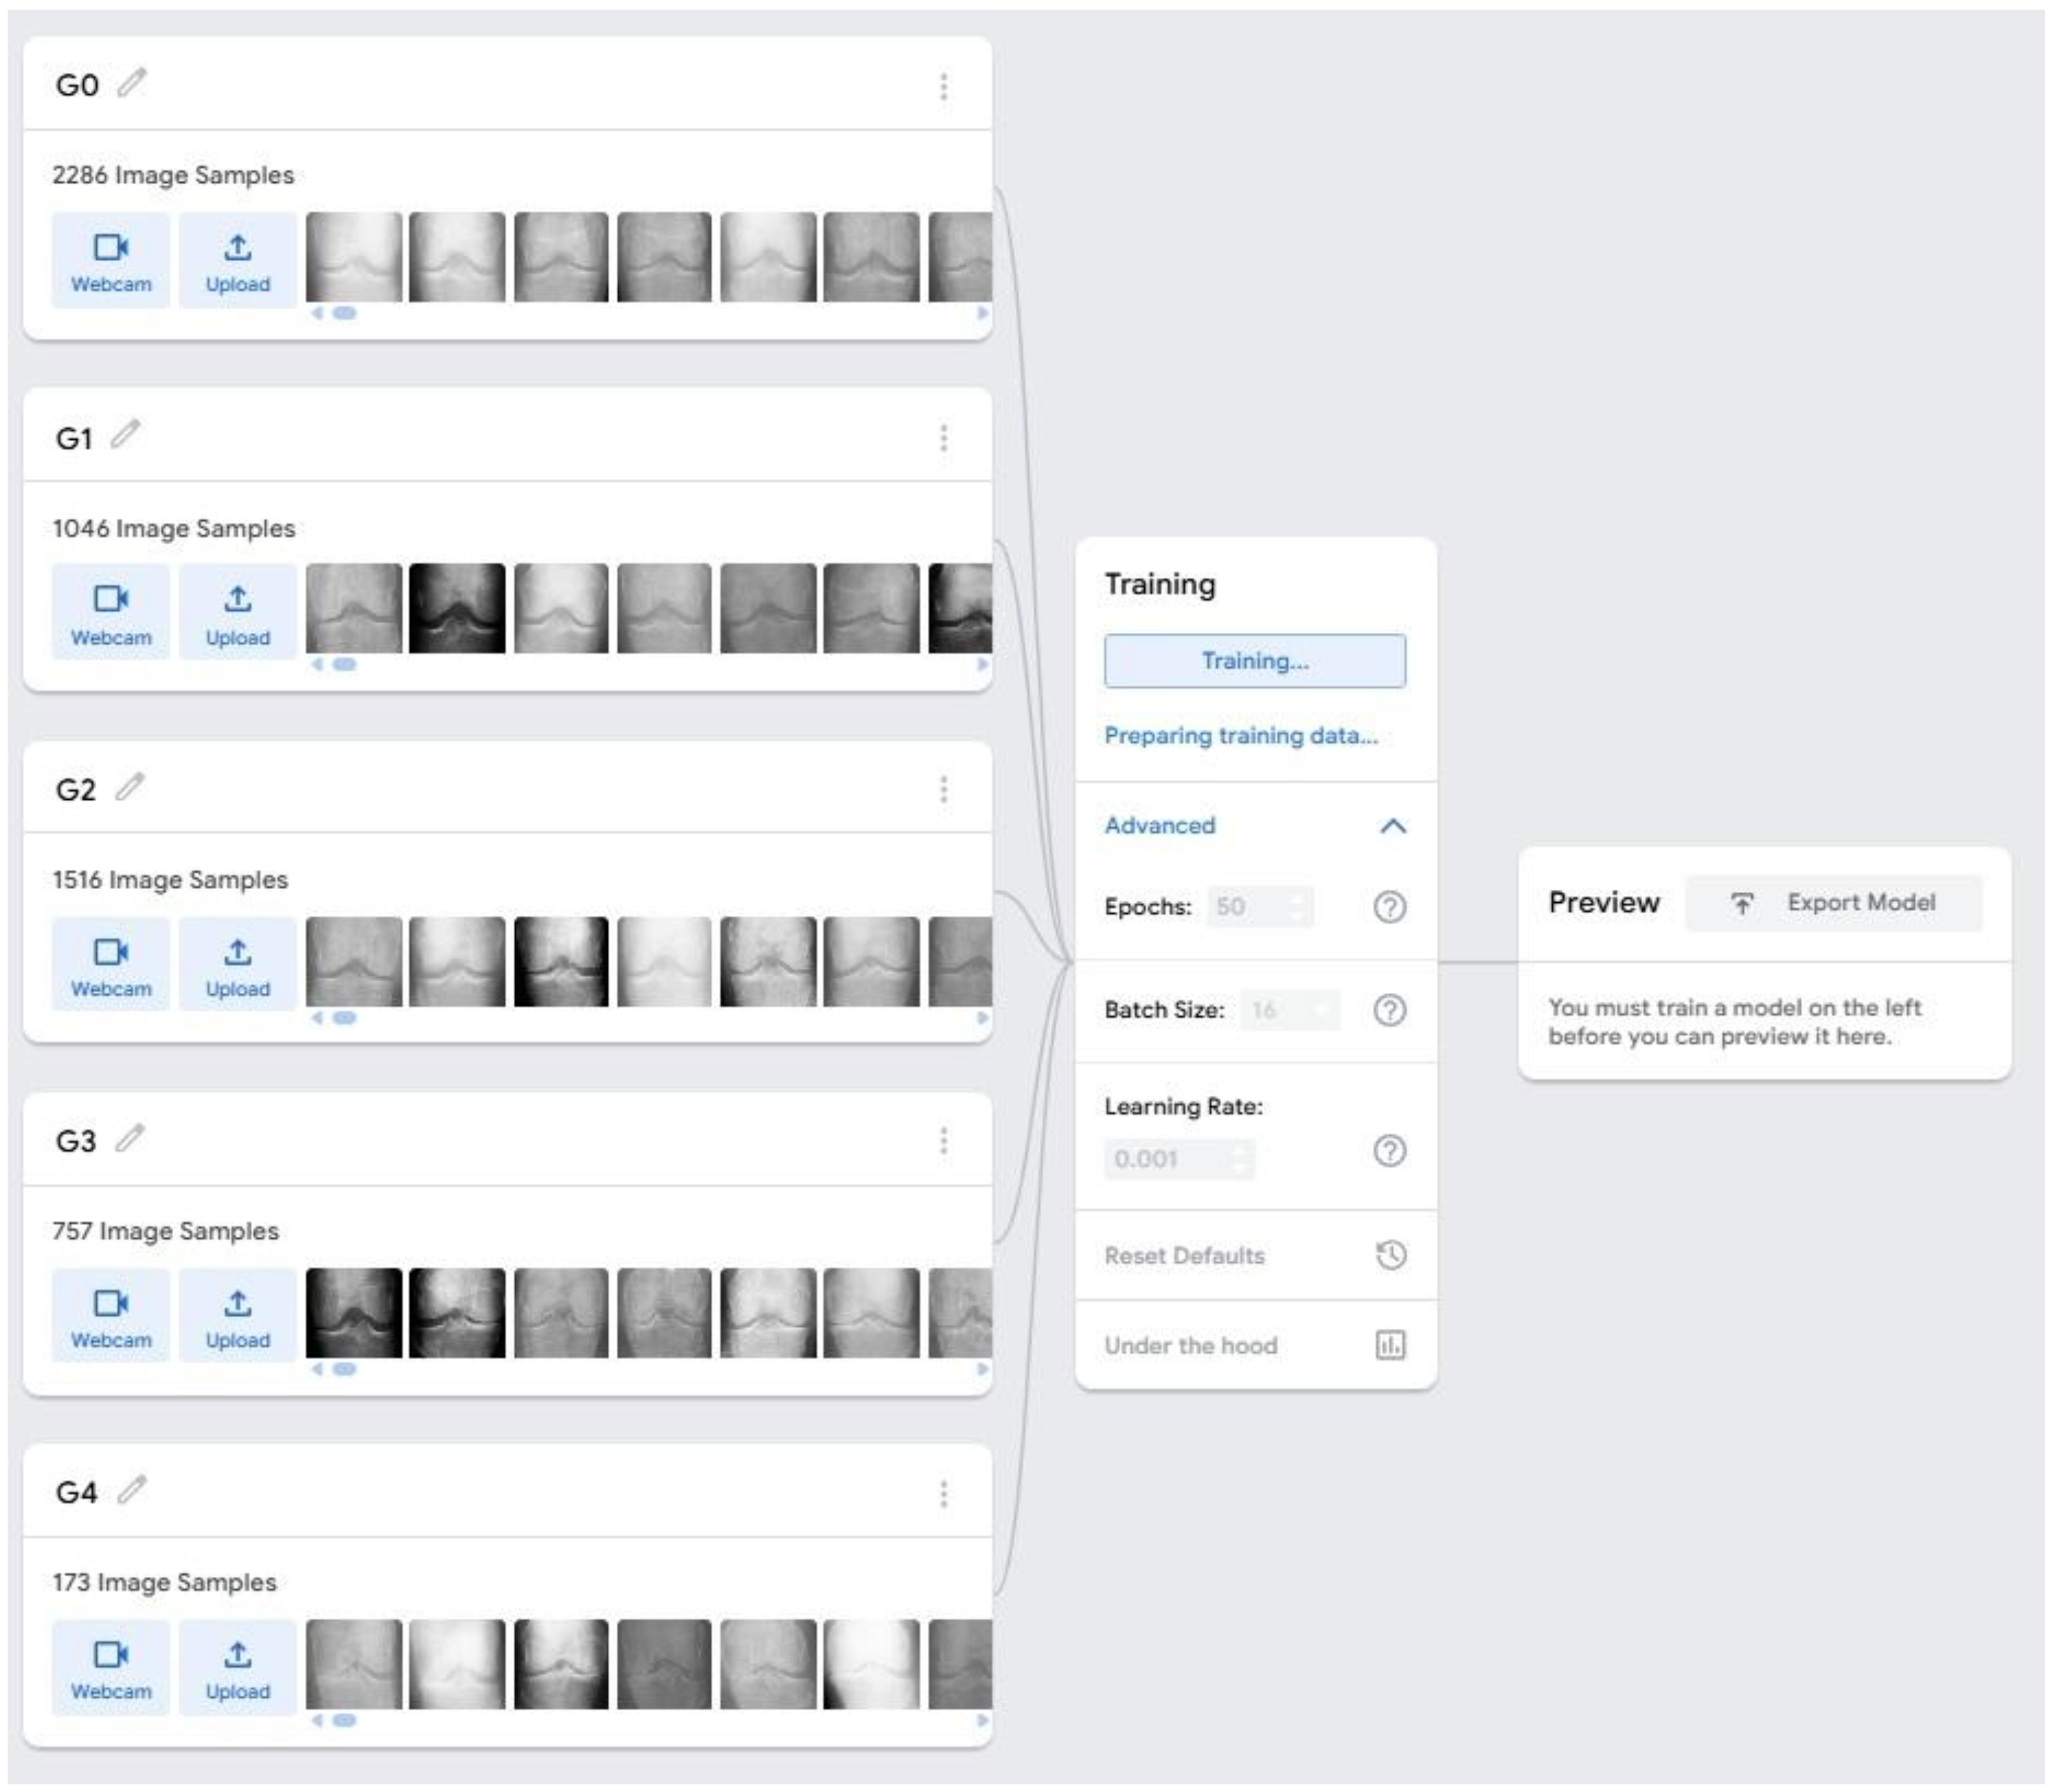

Table 1.
Grade-Wise Accuracy (G0–G4) obtained from GTM models trained with different Epochs and Batch Sizes.
Table 1.
Grade-Wise Accuracy (G0–G4) obtained from GTM models trained with different Epochs and Batch Sizes.
| EPOCHS | BATCH SIZE | ACCURACY | ||||
|---|---|---|---|---|---|---|
| G0 | G1 | G2 | G3 | G4 | ||
| 50 | 16 | 0.42 | 0.43 | 0.43 | 0.53 | 0.46 |
| 50 | 32 | 0.52 | 0.22 | 0.57 | 0.42 | 0.54 |
| 50 | 64 | 0.64 | 0.26 | 0.49 | 0.22 | 0.5 |
| 60 | 16 | 0.77 | 0.07 | 0.37 | 0.52 | 0.19 |
| 60 | 32 | 0.69 | 0.29 | 0.42 | 0.19 | 0.46 |
| 60 | 64 | 0.83 | 0.2 | 0.38 | 0.46 | 0.65 |
| 70 | 16 | 0.46 | 0.63 | 0.18 | 0.38 | 0.65 |
| 70 | 32 | 0.64 | 0.13 | 0.36 | 0.56 | 0.42 |
| 70 | 64 | 0.77 | 0.27 | 0.34 | 0.14 | 0.54 |
| 80 | 16 | 0.35 | 0.46 | 0.39 | 0.49 | 0.54 |
| 80 | 32 | 0.81 | 0.13 | 0.21 | 0.38 | 0.69 |
| 80 | 64 | 0.67 | 0.23 | 0.27 | 0.67 | 0.15 |
| 90 | 16 | 0.3 | 0.3 | 0.52 | 0.41 | 0.35 |
| 90 | 32 | 0.7 | 0.11 | 0.39 | 0.5 | 0.27 |
| 90 | 64 | 0.54 | 0.32 | 0.6 | 0.21 | 0.46 |
| 100 | 16 | 0.85 | 0.01 | 0.19 | 0.15 | 0 |
| 100 | 31 | 0.53 | 0.17 | 0.34 | 0.25 | 0 |
| 100 | 64 | 0.7 | 0.01 | 0.4 | 0.21 | 0.2 |
Disclaimer/Publisher’s Note: The statements, opinions and data contained in all publications are solely those of the individual author(s) and contributor(s) and not of MDPI and/or the editor(s). MDPI and/or the editor(s) disclaim responsibility for any injury to people or property resulting from any ideas, methods, instructions or products referred to in the content. |
© 2026 by the authors. Licensee MDPI, Basel, Switzerland. This article is an open access article distributed under the terms and conditions of the Creative Commons Attribution (CC BY) license (http://creativecommons.org/licenses/by/4.0/).
Copyright: This open access article is published under a Creative Commons CC BY 4.0 license, which permit the free download, distribution, and reuse, provided that the author and preprint are cited in any reuse.


