
Submitted:
05 January 2026
Posted:
06 January 2026
You are already at the latest version
Abstract
Accurate, large-scale building-use information at very high spatial resolution is critical for urban, economic, and risk-related applications. We present a nationwide framework for building-use mapping at 50~cm resolution in China by fusing very-high-resolution RGB imagery with points-of-interest (POI) data. A multi-task U-Net with a ResNet-34 backbone jointly predicts building footprints and three building-use classes (residential, commercial, industrial), using POI-based probability maps as additional input channels. We construct a labeled dataset of approximately 100{,}000 buildings from 90 cities and a 351-million-tile inference dataset covering about 54\% of China's land area. Experiments show that POI fusion and multi-task learning significantly improve performance over imagery-only baselines. In the final nationwide product, the residential, commercial, and industrial classes achieve per-class accuracies of 0.9711, 0.9664, and 0.9854, with F1-scores of 0.8416, 0.5828, and 0.8143, respectively. The resulting building-use database can support a wide range of downstream applications, including catastrophe risk assessment, exposure mapping, and urban analytics.
Keywords:
building-use mapping
; multi-modal fusion
; multi-task learning
; very-high-resolution remote sensing
; urban analytics
; risk assessment
1. Introduction
Building-use classification, especially at the level of individual buildings and at very high spatial resolution, plays a critical role in many application domains. In urban planning, detailed building-use information supports the rational allocation of residential, commercial, and industrial zones, improves the efficiency of land-use and infrastructure layout, and facilitates the planning of public facilities such as schools and hospitals. In urban and regional development analysis, such information provides a fine-grained picture of the spatial distribution of built-up areas and land-use types, which is valuable for assessing urban expansion dynamics and optimizing land-use and development policies [1,2,3,4,5,6]. In public administration, building-use information underpins targeted safety and firefighting strategies and is essential for prioritizing rescue operations during natural disasters and other emergencies. It is also a basic input for ecological and environmental management, supporting land-use regulation and scenario analysis under policy and environmental uncertainty [7]. In addition, detailed building-use layers can assist in protecting sensitive ecological and cultural heritage sites, for example by informing zoning controls and monitoring human activities around heritage sites.
For risk assessment and catastrophe modeling, building-use information is a key component of exposure models. The loss severity induced by hazards such as earthquakes, typhoons, or floods depends strongly on the structural characteristics and functional use of buildings. Reliable quantification of catastrophe risk therefore requires high-resolution, building-level exposure data, including precise building-use attributes. In principle, such information can be collected by field surveys. In practice, however, nationwide field surveys at the individual-building level are extremely labor-intensive, time-consuming, and expensive. Large-scale risk surveys may take several years to complete, and the resulting datasets already suffer from temporal obsolescence due to continuous urban expansion, redevelopment, and land-use change. This motivates the development of automated approaches based on remote sensing and ancillary data.
Optical remote sensing imagery is a natural choice for extracting building-related information over large areas. With the rapid development of high-resolution satellite sensors and deep learning, a number of studies have achieved high-quality building footprint extraction and roof segmentation. For example, Zhang et al. [8] built a deep segmentation model with spatially stratified sampling to extract 0.6 m rooftop footprints for 90 cities in China. Liu et al. [9] proposed a super-resolution segmentation framework (STSR-Seg), jointly exploiting 2.5 m and 10 m imagery to derive a nationwide rooftop footprint dataset. Sun et al. [10] combined a remote sensing foundation model with region proposal networks and ancillary building-occupancy data to generate a fine-grained 3D building model of China at 0.8 m resolution. Huang et al. [11] adopted transformer-based models to classify roof types from GF-2 and GF-3 imagery. These works significantly advance large-scale building footprint extraction and roof-level classification, but they primarily focus on geometric or physical attributes (location, footprint, height, roof type) rather than socio-economic attributes such as building use. When building-use labels are derived solely from roof type, noticeable discrepancies with actual functional use may occur, leading to a semantic gap between physical roof characteristics and functional building use.
In parallel, another line of research has explored urban functional zone classification by leveraging POI data, sometimes in combination with remote sensing and street-level imagery. Luo et al. [12] used POI features and a traditional machine-learning model to classify urban functional zones. Kong et al. [13] integrated building vector data, satellite imagery, street-view images, and POI data into a graph convolutional framework for functional zone classification. Chen et al. [14] combined GF-2 imagery with POI data and employed deep neural networks and SVMs for regional building-use classification at 1 m resolution. These studies demonstrate the effectiveness of POI data and multi-source fusion for understanding urban functions at the zone level.
Despite these advances, most existing work targets urban functional zones rather than individual buildings. Compared with traditional land-cover or land-use classes, functional zones encode richer spatial structure and semantic information, but their information density is still much lower than that of building-level labels. Inferring the use of each individual building is a considerably more challenging task, both in terms of spatial resolution requirements and semantic granularity. Moreover, the vast majority of existing building-use studies are confined to limited urban areas and do not scale to national coverage. To the best of our knowledge, current methods cannot directly support high-resolution, nationwide building-use classification at the individual-building level in China.
The urgent need for nationwide, very-high-resolution building-use information, combined with the limitations of traditional surveys and existing remote sensing methods, motivates this study. We focus on a three-class building-use taxonomy consisting of residential, commercial, and industrial categories, which is widely adopted in exposure modeling and urban analysis. The taxonomy is derived from the national POI standard “GB/T 35648–2017”, which includes 16 top-level categories. These categories are aggregated into the three building-use classes in a way that is compatible with many risk assessment and exposure modeling practices.
In this paper, we make the following main contributions:
- Multi-modal, multi-task framework for building-use classification. We design a deep learning framework that jointly ingests 50 cm RGB imagery and POI-based probability maps through early fusion, and performs building footprint segmentation and building-use classification in a unified encoder–decoder architecture. The auxiliary building footprint task provides precise spatial localization, which helps reduce spurious use predictions in non-building areas and mitigates mixed-use ambiguities within large buildings.
- POI probability mapping and large-scale dataset construction. We propose a distance-based method in geographic coordinates to transform sparse POI point data into dense probability maps at the same resolution as the imagery, thereby enhancing the contribution of socio-economic information. On top of this, we construct a high-quality training dataset comprising about 100,000 buildings from 90 cities with pixel-level building-use annotations, and a nationwide inference dataset of approximately 351 million multi-band tiles covering about 54% of China’s land area.
- Nationwide 50 cm building-use mapping. We develop a scalable workflow for high-throughput data preprocessing and large-scale model inference, including built-up area masking and overlapping sliding-window tiling. Using this workflow, we generate a nationwide building-use map at 50 cm resolution and demonstrate that the resulting building-use database achieves high per-class accuracy and F1-scores across residential, commercial, and industrial buildings, providing a valuable basis for diverse downstream applications such as risk assessment and urban analytics.
2. Methods
2.1. Overall Framework
Figure 1 provides an overview of the proposed framework. The method takes as input very-high-resolution (50 cm) RGB satellite imagery together with POI-based probability maps, and produces two pixel-wise outputs: a binary building footprint mask and a three-class building-use map (residential, commercial, industrial). The network follows an encoder–decoder design with a shared backbone and two task-specific heads. The encoder is based on ResNet-34, while the decoder adopts a U-Net-style topology with multi-scale skip connections.
The processing pipeline begins with data preparation (data sources, dataset construction, and radiometric/geometric correction of the optical imagery), followed by the construction of POI-based probability maps and their fusion with the RGB imagery. On top of this multi-band input, a multi-task encoder–decoder network jointly predicts building footprints and building uses. Finally, large-scale tiling and sliding-window inference are employed to extend the model to nationwide mapping.
2.2. Building-Use Taxonomy and Label Definition
The study adopts a three-class building-use taxonomy that is compatible with common practices in exposure modeling and urban applications. Buildings used primarily for residence and lodging, including housing and related residential services, are assigned to the residential (R) class. Buildings dedicated to commerce, services, and public functions, such as retail, finance, education, healthcare, administration, and leisure, are assigned to the commercial (C) class. Buildings used for production, logistics, and transportation, including factories, warehouses, and transportation facilities, are assigned to the industrial (I) class.
This taxonomy is derived from the Chinese national standard “GB/T 35648–2017”, which defines 16 top-level POI categories. These categories are aggregated into the three building-use classes in a way that reflects differences in functional use and their relevance for downstream applications such as risk assessment and urban planning. Table 1 summarizes the mapping at the top-level category.
2.3. Data Sources and Dataset Construction
2.3.1. Very-High-Resolution Optical Imagery
The primary input imagery consists of nationwide very-high-resolution (VHR) optical data covering China. In this study, three spectral bands (red, green, blue) are used, each with a spatial resolution of 0.5 m (50 cm). The imagery is provided as tiled RGB scenes, and the main objects of interest are elements of the built environment, including residential areas, commercial districts, industrial zones, ports, and photovoltaic farms.
Figure 2 shows a representative example of 50 cm resolution imagery, namely a high-precision remote sensing image of a port. The high spatial resolution enables individual buildings, roofs, and local structural patterns to be clearly distinguished, which is crucial for building-level use classification.
2.3.2. POI Data
The POI data are provided by a commercial mapping company and consist of point features with geographic coordinates, names, addresses, and standardized semantic categories. The provider follows the national standard “GB/T 35648–2017”, which specifies a hierarchical taxonomy with 16 top-level categories, 50 mid-level categories, and 273 subcategories.
For the purpose of building-use classification, POIs relevant to the built environment—such as those associated with residential complexes, retail and service facilities, financial institutions, healthcare and educational facilities, as well as industrial and logistics sites—are extracted and aggregated into three groups corresponding to the residential, commercial, and industrial use classes defined in Section 2.2.
2.3.3. Training Dataset Construction
For supervised training and validation, a labeled dataset is constructed that spans 90 cities across China. The set includes first-tier municipalities and special administrative regions (for example, Beijing, Shanghai, Chongqing, Hong Kong, and Macau), provincial capitals and sub-provincial cities (such as Guangzhou, Chengdu, Wuhan, Xi’an, and Nanjing), as well as major prefecture-level cities and regional centers distributed across different climate zones and terrain types.
Taken together, these 90 cities cover about 40% of China’s population and exhibit diverse urban forms, including multi-core metropolitan regions, mono-centric medium-sized cities, plain-based urban agglomerations, and valley cities with linear settlement patterns.
From the 90 cities, a subset of 111,426 buildings with high-quality annotations is selected for model training and evaluation. For each selected area, a six-band image patch is constructed, consisting of three RGB channels and three POI probability channels (residential, commercial, and industrial) as described in Section 2.5. In parallel, a binary building footprint mask (mask A) is generated by rasterizing the aligned building polygons at 0.5 m resolution, and a three-class building-use mask (mask B) is obtained by rasterizing the building-use attributes, with labels assigned at the pixel level according to the underlying building polygon.
Figure 3 shows an example of a training sample, including the multi-band input and the two masks. Building polygons that do not correspond to the current imagery—for example, due to demolition or recent construction—are removed or corrected during quality control in order to reduce label noise.
The labeled dataset is split into training, validation, and test subsets with a ratio of 6:2:2 at the building level. Buildings from the same spatial tile are constrained to appear in only one subset, so that spatial leakage between training and evaluation data is avoided. This split is used consistently for the ablation studies and quantitative evaluation reported in Section 3.
2.3.4. Nationwide Inference Dataset
- Built-up area masking.
Running nationwide 50 cm inference on all land pixels in China is computationally prohibitive and unnecessary, as large areas are uninhabited (e.g., high mountains, deserts, forests, lakes). We therefore construct a built-up mask by combining three reference products: WSF 2019 (a global 10 m human-settlement mask from Sentinel-1/2, in EPSG:4326 GeoTIFF tiles), CLCD 2023 (a 30 m China land-cover map from 335 709 Landsat scenes in D_WGS_1984), and RESP 2017 (a national remote-sensing image dataset with building-related annotations).
All three datasets are resampled and aligned to the national VHR grid, yielding 636 774 grids for WSF 2019, 486 967 for CLCD 2023, and 472 174 for RESP 2017. Grid cells identified as built-up or settlement-related in any product are retained, and their union forms a conservative built-up mask. This mask removes uninhabited regions such as snow-covered mountains, large lakes, and dense forests, reducing the area requiring 50 cm inference to about 54% of China’s land area (Figure 4).
- Tiling and multi-band input construction.
Within the built-up mask, a nationwide inference dataset is generated in the form of 50 cm tiles. Following the early-fusion strategy described in Section 2.6, each tile is represented as a multi-band image that includes three channels of VHR RGB imagery together with one residential, one commercial, and one industrial POI probability map. The tiling scheme yields approximately 351 million such multi-band tiles, each covering a fixed spatial extent at 50 cm resolution.
To enable high-throughput processing, a parallelized workflow is adopted that combines batched access to imagery and POI data with efficient generation of POI probability maps over the national grid. Multi-process input/output operations are used to exploit available network bandwidth and disk throughput, while spatial indexing and vectorized distance computations accelerate the construction of POI probability maps. These optimizations make it feasible to prepare POI probability maps and multi-band tiles for nationwide inference within practical computational budgets.
- Sliding-window inference.
For model inference, each large VHR tile is processed using an overlapping sliding window in order to mitigate boundary effects. A window size of 1024×1024 pixels is adopted, corresponding to a square patch of 512 m × 512 m at 50 cm resolution, with an overlap of 128 pixels in both horizontal and vertical directions. For each window, the model predicts building footprints and building-use labels for all pixels, but only the central 768×768 region is retained. These central regions are then stitched together to form seamless maps.
This strategy ensures that pixels near the final tile boundaries are inferred with sufficient contextual information, while redundant computation at the outermost margins is avoided. The combination of built-up area masking, multi-band tiling, and sliding-window inference enables nationwide building-use prediction at 50 cm resolution under realistic computational constraints. The resulting outputs are post-processed into vector building layers with associated use attributes, which can then be used to construct detailed building-level exposure and land-use databases for subsequent analysis.
2.4. Data Preprocessing
Several preprocessing steps are applied to the raw imagery and vector data before model training and inference. These steps address illumination variations, cloud contamination, geometric alignment, and data augmentation.
2.4.1. Illumination Correction
Due to varying acquisition times, sensor viewing angles, and atmospheric conditions, the raw optical images exhibit significant illumination and contrast variations, which can adversely affect model training. To mitigate this issue, a Retinex-based enhancement scheme is employed. Retinex theory assumes that the observed image can be decomposed into illumination and reflectance components. In practice, a logarithmic transformation is first performed, followed by the estimation of a smooth illumination field (for example, via grayscale smoothing). This illumination component is then subtracted in the log domain to obtain an estimate of the reflectance. The enhanced RGB image is reconstructed from this reflectance component, resulting in more uniform brightness and improved local contrast.
2.4.2. Cloud and Artifact Handling
Clouds and cloud shadows are inevitable in large-scale optical imagery. For regions affected by clouds, a spatial interpolation strategy inspired by geostatistics is adopted. Valid pixels are treated as spatial samples, and missing values in cloud-covered areas are estimated by Kriging interpolation. A semivariogram model is first fitted to cloud-free data and then used to compute optimal linear weights for predicting unknown pixels, ensuring unbiasedness and minimal variance under second-order stationarity assumptions.
2.4.3. Geometric Alignment and Semantic Label Generation
Authoritative building footprint polygons and their associated use attributes are used as vector data for 90 cities. To obtain pixel-level labels, these polygons are manually adjusted and aligned with the optical imagery to correct residual offsets arising from acquisition time differences and parallax effects. Once aligned, the building footprints are rasterized to construct a binary building mask (mask A), in which building pixels are labeled as 1 and non-building pixels as 0. The building-use attributes are similarly rasterized to obtain a single-band building-use mask (mask B), where pixels belonging to residential, commercial, or industrial buildings are assigned distinct integer labels. During this process, buildings that have been demolished or newly constructed but are not yet reflected in the vector data are manually corrected, so that the resulting masks are consistent with the optical imagery.
2.4.4. Data Augmentation
To improve generalization and alleviate overfitting, standard data augmentation techniques are applied to both imagery and masks. The operations include horizontal and vertical flips, 90-degree rotations, transposition, and scale adjustments. All augmentations are implemented in a synchronized manner so that the pixel-level correspondence between images and masks is preserved.
2.5. POI Probability Map Generation
The raw POI data consist of point features with geographic coordinates and semantic categories. A naive rasterization of POI points would yield highly sparse maps, especially for large industrial facilities that span many pixels but are represented by only a few POI points. To better capture the spatial influence of POIs, the point data are converted into dense probability maps using a distance-decay scheme in geographic coordinates.
Let denote the geographic coordinates (longitude and latitude) of pixel i, and let be the coordinates of the nearest POI of a given type (residential, commercial, or industrial). The distance between pixel i and POI j is defined using a great-circle approximation,
where denotes the geodesic distance on the ellipsoid (for example, computed via the haversine formula). For each building-use type , the distance from pixel i to its nearest POI of type k is computed.
To control the dynamic range and avoid the influence of extreme distances, type-specific distance thresholds are introduced, and min–max normalization is applied,
where reflects an effective influence radius for type k (for instance, residential and commercial POIs may be assigned shorter influence ranges than industrial facilities). The normalized distance is then converted into a probability-like score,
Pixels closer to POIs of type k therefore receive higher , indicating a higher prior probability of being associated with that building-use type. This process yields three POI probability maps, one for each class, at the same spatial resolution and extent as the RGB imagery.
2.6. Multi-Source Early Fusion
The final input to the network is a six-band image formed by concatenating the three optical channels (R, G, B) with the three POI probability maps,
where are the RGB channels and are the residential, commercial, and industrial POI probability maps, respectively.
An early-fusion strategy is adopted: the six-band input is fed into the first convolutional layer of the encoder, which learns joint low-level representations of spectral, spatial, and POI-derived features. Early fusion is particularly suitable here because the POI probability maps are geometrically aligned with the imagery, share the same pixel grid, and are intended to inform building-level classification rather than coarse functional zones. In this setting, early fusion ensures that local building geometry and nearby POI signals are jointly exploited in subsequent layers, facilitating fine-grained use discrimination at the building scale.
2.7. Network Architecture: U-Net with ResNet Backbone
The core of the framework is a multi-task encoder–decoder network built upon a ResNet-34 backbone and a U-shaped decoder. The encoder consists of an initial convolutional stem followed by four stages of residual blocks with progressively decreasing spatial resolution and increasing channel depth. The residual connections in ResNet-34 alleviate vanishing-gradient and degradation problems, allowing the model to be sufficiently deep to capture both low-level structural cues (edges, corners, textures) and high-level semantic patterns related to building use.
The decoder follows the U-Net design [15], with four upsampling stages. At each stage, the upsampled feature maps are concatenated with corresponding encoder features via skip connections, enabling the network to recover spatial details that were lost during downsampling. The skip connections propagate fine-grained localization information, such as building boundaries, from shallow encoder layers to the decoders, and they simultaneously allow the decoders to combine high-level semantic features with low-level geometric cues.
On top of the shared encoder, two decoder heads are attached. One head produces a single-channel building footprint mask that distinguishes building from non-building pixels. The other head outputs a three-channel map in which each channel represents the probability of residential, commercial, or industrial use at each pixel. The two heads share the same overall U-Net topology but have separate parameters in their final layers to accommodate their different label spaces.
2.8. Multi-Task Learning Formulation
Let denote the predicted building footprint mask and denote the predicted building-use probabilities for the three classes. The corresponding ground-truth masks are and . Pixel-wise learning for both tasks is formulated using Dice loss, which is known to be robust to class imbalance in segmentation problems.
For the binary building footprint task, the Dice loss is defined as
where i indexes pixels, and are predicted and true labels, and is a small constant for numerical stability.
For the three-class building-use task, a multi-class Dice loss is adopted by averaging per-class Dice losses,
where c indexes the building-use classes and and are the predicted and ground-truth membership values for class c at pixel i.
The overall loss is a weighted sum of the two task losses,
where and control the relative contribution of the auxiliary footprint task and the main building-use task. In practice, these weights are set to comparable magnitudes so that both tasks are effectively learned. The shared encoder and skip connections allow gradients from both tasks to jointly shape the feature representations, encouraging the model to learn features that are simultaneously informative for spatial localization and semantic classification.
This multi-task design brings two main benefits. The footprint head enforces precise building boundary prediction, which reduces false positive use predictions in non-building regions. At the same time, the use head benefits from the auxiliary spatial constraints, helping to resolve mixed-use ambiguities within large or complex buildings by promoting spatially coherent predictions that align with the building footprint.
3. Experiments
3.1. Implementation Details
All models are implemented in PyTorch and trained on a local multi-GPU server equipped with eight NVIDIA A6000 GPUs. Unless otherwise stated, the training configuration is kept fixed. The optimizer is Adam with an initial learning rate of , and a cosine annealing schedule is used to gradually decay the learning rate during training. The batch size is set to 16 per iteration across all GPUs. The loss function combines the binary and multi-class Dice losses described in Section 2.8. All convolutional layers use ReLU activations. Training proceeds for up to 3700 iterations, with early stopping based on the validation loss to avoid overfitting. Weight decay and random weight initialization are applied as regularization measures. Data augmentation is performed on the fly as described in Section 2.4. For ablation studies, the input patch size and the set of input modalities are varied while the remaining settings are kept unchanged.
3.2. Evaluation Metrics
Model performance is evaluated at the pixel level for each building-use class using three standard metrics. Per-class accuracy (Acc) is computed in a one-vs-rest setting and measures the proportion of correctly classified pixels (true positives and true negatives) among all pixels when treating a given class as the positive class. Recall measures the proportion of true positive pixels among all ground-truth pixels of that class. The F1-score is defined as the harmonic mean of precision and recall,
Per-class accuracy reflects the overall correctness of predictions for a given class in the one-vs-rest sense, whereas recall and F1-score are more sensitive to missed detections and class imbalance.
3.3. Ablation Study: Impact of POI and Multi-Task Learning
The first ablation study investigates the impact of incorporating POI information and of using a multi-task learning strategy. To this end, three model variants with the same network depth and a fixed input patch size of 224×224 pixels are considered. The first variant uses only the three RGB bands as input and predicts building use with a single decoder head, corresponding to a single-task setting without POI information. The second variant extends the input to six bands by adding the POI probability maps but still predicts only building use with a single decoder head. The third variant is the full proposed model, which uses both imagery and POI inputs and jointly predicts building footprints and building uses through two decoder heads.
The results of this comparison are summarized in Table 2. Adding POI information consistently improves performance over the imagery-only baseline across all three building-use classes. For example, the residential F1-score increases from 0.7777 in the imagery-only model to 0.8097 in the single-task model with POI inputs. Introducing the auxiliary footprint segmentation task further boosts performance, particularly for the commercial and industrial classes, which are more prone to mixed-use and boundary ambiguities. In the full multi-task model, the industrial F1-score reaches 0.7598, compared with 0.6536 for the imagery-only baseline.
The comparison reveals two main effects. First, POI-derived probability maps provide complementary socio-economic information that cannot be inferred from imagery alone, which improves the discrimination between residential, commercial, and industrial buildings. Second, multi-task learning with a footprint segmentation head imposes additional spatial constraints, sharpening building boundaries and reducing spurious use predictions in non-building areas. Together, these effects translate into higher per-class accuracy and F1-scores for all three building-use classes.
3.4. Ablation Study: Impact of Input Patch Size
A second ablation study examines the effect of input patch size on performance. Larger patches provide a wider receptive field and richer contextual information, which is beneficial for understanding building use in its neighborhood context, but they also increase memory usage and can reduce the effective batch size.
Three patch sizes are considered: 224×224, 1024×1024, and 2048×2048 pixels. For each size, the full multi-task model with imagery and POI inputs is trained under otherwise identical settings. The resulting per-class accuracies and F1-scores for the three building-use classes are reported in Table 3.
Moving from 224×224 to 1024×1024 yields clear gains in both per-class accuracy and F1-score for residential and industrial buildings, indicating that the additional contextual information substantially benefits these classes. For commercial buildings, the improvements are more modest, which is consistent with the high intra-class variability and mixed-use nature of many commercial areas. Increasing the patch size further to 2048×2048 does not lead to consistent gains. The commercial F1-score improves slightly, but the industrial F1-score decreases marginally, which can be attributed to GPU memory constraints at the largest patch size. These constraints necessitate a reduced batch size and may negatively affect optimization stability. Considering this trade-off between performance and computational efficiency, an input patch size of 1024×1024 is adopted as the default setting for nationwide inference.
3.5. Quantitative Performance
The full multi-task model with imagery and POI inputs at 1024×1024 patch size achieves strong performance on the held-out test set. For residential buildings, the per-class accuracy reaches 0.9722, with an F1-score of 0.8417. For commercial buildings, the per-class accuracy is 0.9658, with an F1-score of 0.5770. For industrial buildings, the per-class accuracy reaches 0.9863, with an F1-score of 0.8263.
When evaluated in the nationwide inference setting described in Section 2.3.4, aggregated metrics remain at a similar level. For the final nationwide map, the residential, commercial, and industrial classes achieve per-class accuracies of 0.9711, 0.9664, and 0.9854, with F1-scores of 0.8416, 0.5828, and 0.8143, respectively. As expected, the commercial class shows a lower F1-score than the residential and industrial classes. This behavior is largely due to the heterogeneous nature of commercial activities, which encompass a wide range of building forms and mixed-use configurations. In many exposure modeling and urban analysis settings, visually diverse and semantically complex categories are grouped under the commercial class, leading to higher intra-class variability and more challenging classification.
4. Conclusion
In this paper, we presented a nationwide framework for building-use classification at 50 cm resolution over China. The proposed approach integrates very-high-resolution RGB imagery with POI-derived probability maps in an early-fusion manner, and employs a multi-task encoder–decoder network to jointly predict building footprints and building-use labels. On a large labeled dataset covering 90 cities and about 100,000 buildings, the framework significantly outperforms imagery-only and single-task baselines. Applied at the national scale, it yields a building-use database with per-class accuracies of 0.9711, 0.9664, and 0.9854 and F1-scores of 0.8416, 0.5828, and 0.8143 for residential, commercial, and industrial buildings, respectively.
On the data side, we constructed a high-quality training dataset with pixel-level building-use annotations and a nationwide inference dataset of roughly 351 million multi-band tiles covering 54% of China’s land area. On the modeling side, we designed a multi-modal, multi-task architecture and demonstrated its effectiveness through systematic ablation studies and cross-scale experiments. The resulting nationwide building-use maps provide a detailed building-level database that can support a variety of downstream tasks, including catastrophe risk assessment, exposure modeling, and urban analytics.
Author Contributions
Conceptualization: Li Tianhao, Zhang Hang; Methodology: Li Tianhao, Zhang Hang; Software: Li Tianhao, Zhang Hang; Validation: Li Tianhao, Zhang Hang; Formal Analysis: Zhang Hang; Investigation: Li Tianhao; Resources: Li Tianhao; Data Curation: Zhang Hang; Writing—Original Draft Preparation: Li Tianhao; Writing—Review and Editing: Li Tianhao; Visualization: Li Tianhao; Supervision: Li Tianhao; Project Administration: Zhang Hang; Funding Acquisition: Li Tianhao.
Funding
This research was funded by the National Key Research and Development Program of China (Grant No. 2023YFC3805200), entitled "Key Technologies Research and Application for Urban System Resilience Enhancement". The APC was also funded by this program.
Data Availability Statement
Not applicable.
Acknowledgments
The authors would like to express their gratitude to the School of Artificial Intelligence, Tianjin University for the valuable guidance provided during the research process of this manuscript.
Conflicts of Interest
The authors declare no conflict of interest.
References
- Yin, J.; Yin, Z.; Zhong, H.; Xu, S.; Hu, X.; Wang, J.; Wu, J. Monitoring urban expansion and land use/land cover changes of Shanghai metropolitan area during the transitional economy (1979–2009) in China. Environmental monitoring and assessment 2011, 177, 609–621. [Google Scholar] [CrossRef] [PubMed]
- Liu, X.; Ma, L.; Li, X.; Ai, B.; Li, S.; He, Z. Simulating urban growth by integrating landscape expansion index (LEI) and cellular automata. International Journal of Geographical Information Science 2014, 28, 148–163. [Google Scholar] [CrossRef]
- Yao, Y.; Li, X.; Liu, X.; Liu, P.; Liang, Z.; Zhang, J.; Mai, K. Sensing spatial distribution of urban land use by integrating points-of-interest and Google Word2Vec model. International Journal of Geographical Information Science 2017, 31, 825–848. [Google Scholar] [CrossRef]
- Zhou, L.; Zhang, X.; Wang, J.; Bai, X.; Tong, L.; Zhang, L.; Zhou, J.; Hancock, E. Subspace structure regularized nonnegative matrix factorization for hyperspectral unmixing. IEEE Journal of Selected Topics in Applied Earth Observations and Remote Sensing 2020, 13, 4257–4270. [Google Scholar] [CrossRef]
- Zhou, L.; Bai, X.; Liu, X.; Zhou, J.; Hancock, E.R. Learning binary code for fast nearest subspace search. Pattern Recognition 2020, 98, 107040. [Google Scholar] [CrossRef]
- Shan, Z.; Liu, Y.; Zhou, L.; Yan, C.; Wang, H.; Xie, X. Ros-sam: High-quality interactive segmentation for remote sensing moving object. In Proceedings of the Proceedings of the Computer Vision and Pattern Recognition Conference, 2025; pp. 3625–3635. [Google Scholar]
- Regan, C.M.; Bryan, B.A.; Connor, J.D.; Meyer, W.S.; Ostendorf, B.; Zhu, Z.; Bao, C. Real options analysis for land use management: Methods, application, and implications for policy. Journal of environmental management 2015, 161, 144–152. [Google Scholar] [CrossRef] [PubMed]
- Zhang, Z.; Qian, Z.; Zhong, T.; Chen, M.; Zhang, K.; Yang, Y.; Zhu, R.; Zhang, F.; Zhang, H.; Zhou, F.; et al. Vectorized rooftop area data for 90 cities in China. Scientific Data 2022, 9, 66. [Google Scholar] [CrossRef] [PubMed]
- Liu, Z.; Tang, H.; Feng, L.; Lyu, S. China Building Rooftop Area: The first multi-annual (2016–2021) and high-resolution (2.5 m) building rooftop area dataset in China derived with super-resolution segmentation from Sentinel-2 imagery. Earth System Science Data 2023, 15, 3547–3572. [Google Scholar] [CrossRef]
- Sun, X.; Huang, X.; Mao, Y.; Sheng, T.; Li, J.; Wang, Z.; Lu, X.; Ma, X.; Tang, D.; Chen, K. GABLE: A first fine-grained 3D building model of China on a national scale from very high resolution satellite imagery. Remote Sensing of Environment 2024, 305, 114057. [Google Scholar] [CrossRef]
- Huang, X.; Chen, K.; Tang, D.; Liu, C.; Ren, L.; Sun, Z.; Hänsch, R.; Schmitt, M.; Sun, X.; Huang, H.; et al. Urban building classification (UBC) V2—A benchmark for global building detection and fine-grained classification from satellite imagery. IEEE Transactions on Geoscience and Remote Sensing 2023, 61, 1–16. [Google Scholar] [CrossRef]
- Luo, G.; Ye, J.; Wang, J.; Wei, Y. Urban functional zone classification based on POI data and machine learning. Sustainability 2023, 15, 4631. [Google Scholar] [CrossRef]
- Kong, B.; Ai, T.; Zou, X.; Yan, X.; Yang, M. A graph-based neural network approach to integrate multi-source data for urban building function classification. Computers, Environment and Urban Systems 2024, 110, 102094. [Google Scholar] [CrossRef]
- Chen, Y.; Shi, W.; Dang, X.; Wu, C.; Li, S. Classification of urban functional zones by integrating spatial features of VHR satellite images and semantic features of POI data. In Proceedings of the 2022 29th International Conference on Geoinformatics. IEEE, 2022; pp. 1–6. [Google Scholar]
- Ronneberger, O.; Fischer, P.; Brox, T. U-net: Convolutional networks for biomedical image segmentation. In Proceedings of the International Conference on Medical image computing and computer-assisted intervention, 2015; Springer; pp. 234–241. [Google Scholar]
Figure 1.
Overview of the proposed multi-modal, multi-task framework for nationwide building-use classification at 50 cm resolution. Very-high-resolution RGB imagery and POI-based probability maps are fused as multi-band inputs. A shared encoder with a ResNet-34 backbone and a U-Net decoder jointly predicts building footprints and building-use categories (residential, commercial, and industrial).
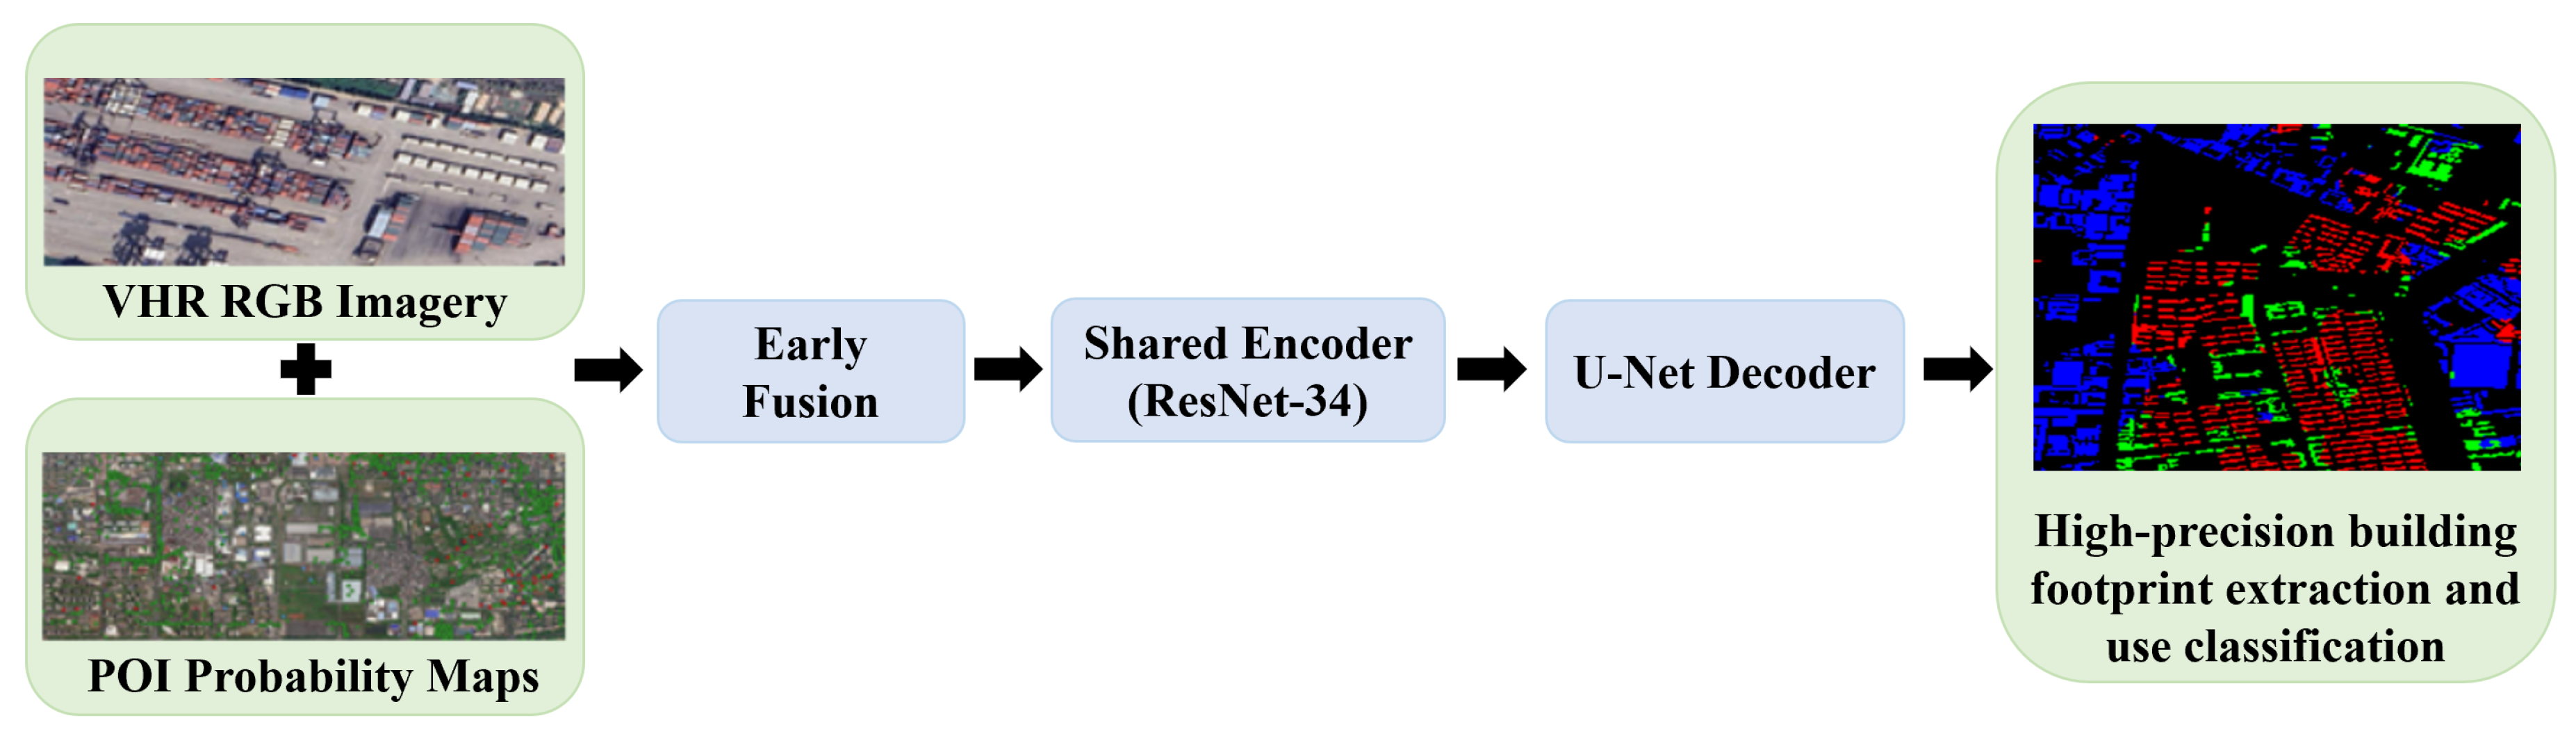
Figure 2.
Examples of 50 cm RGB satellite imagery used in this study.
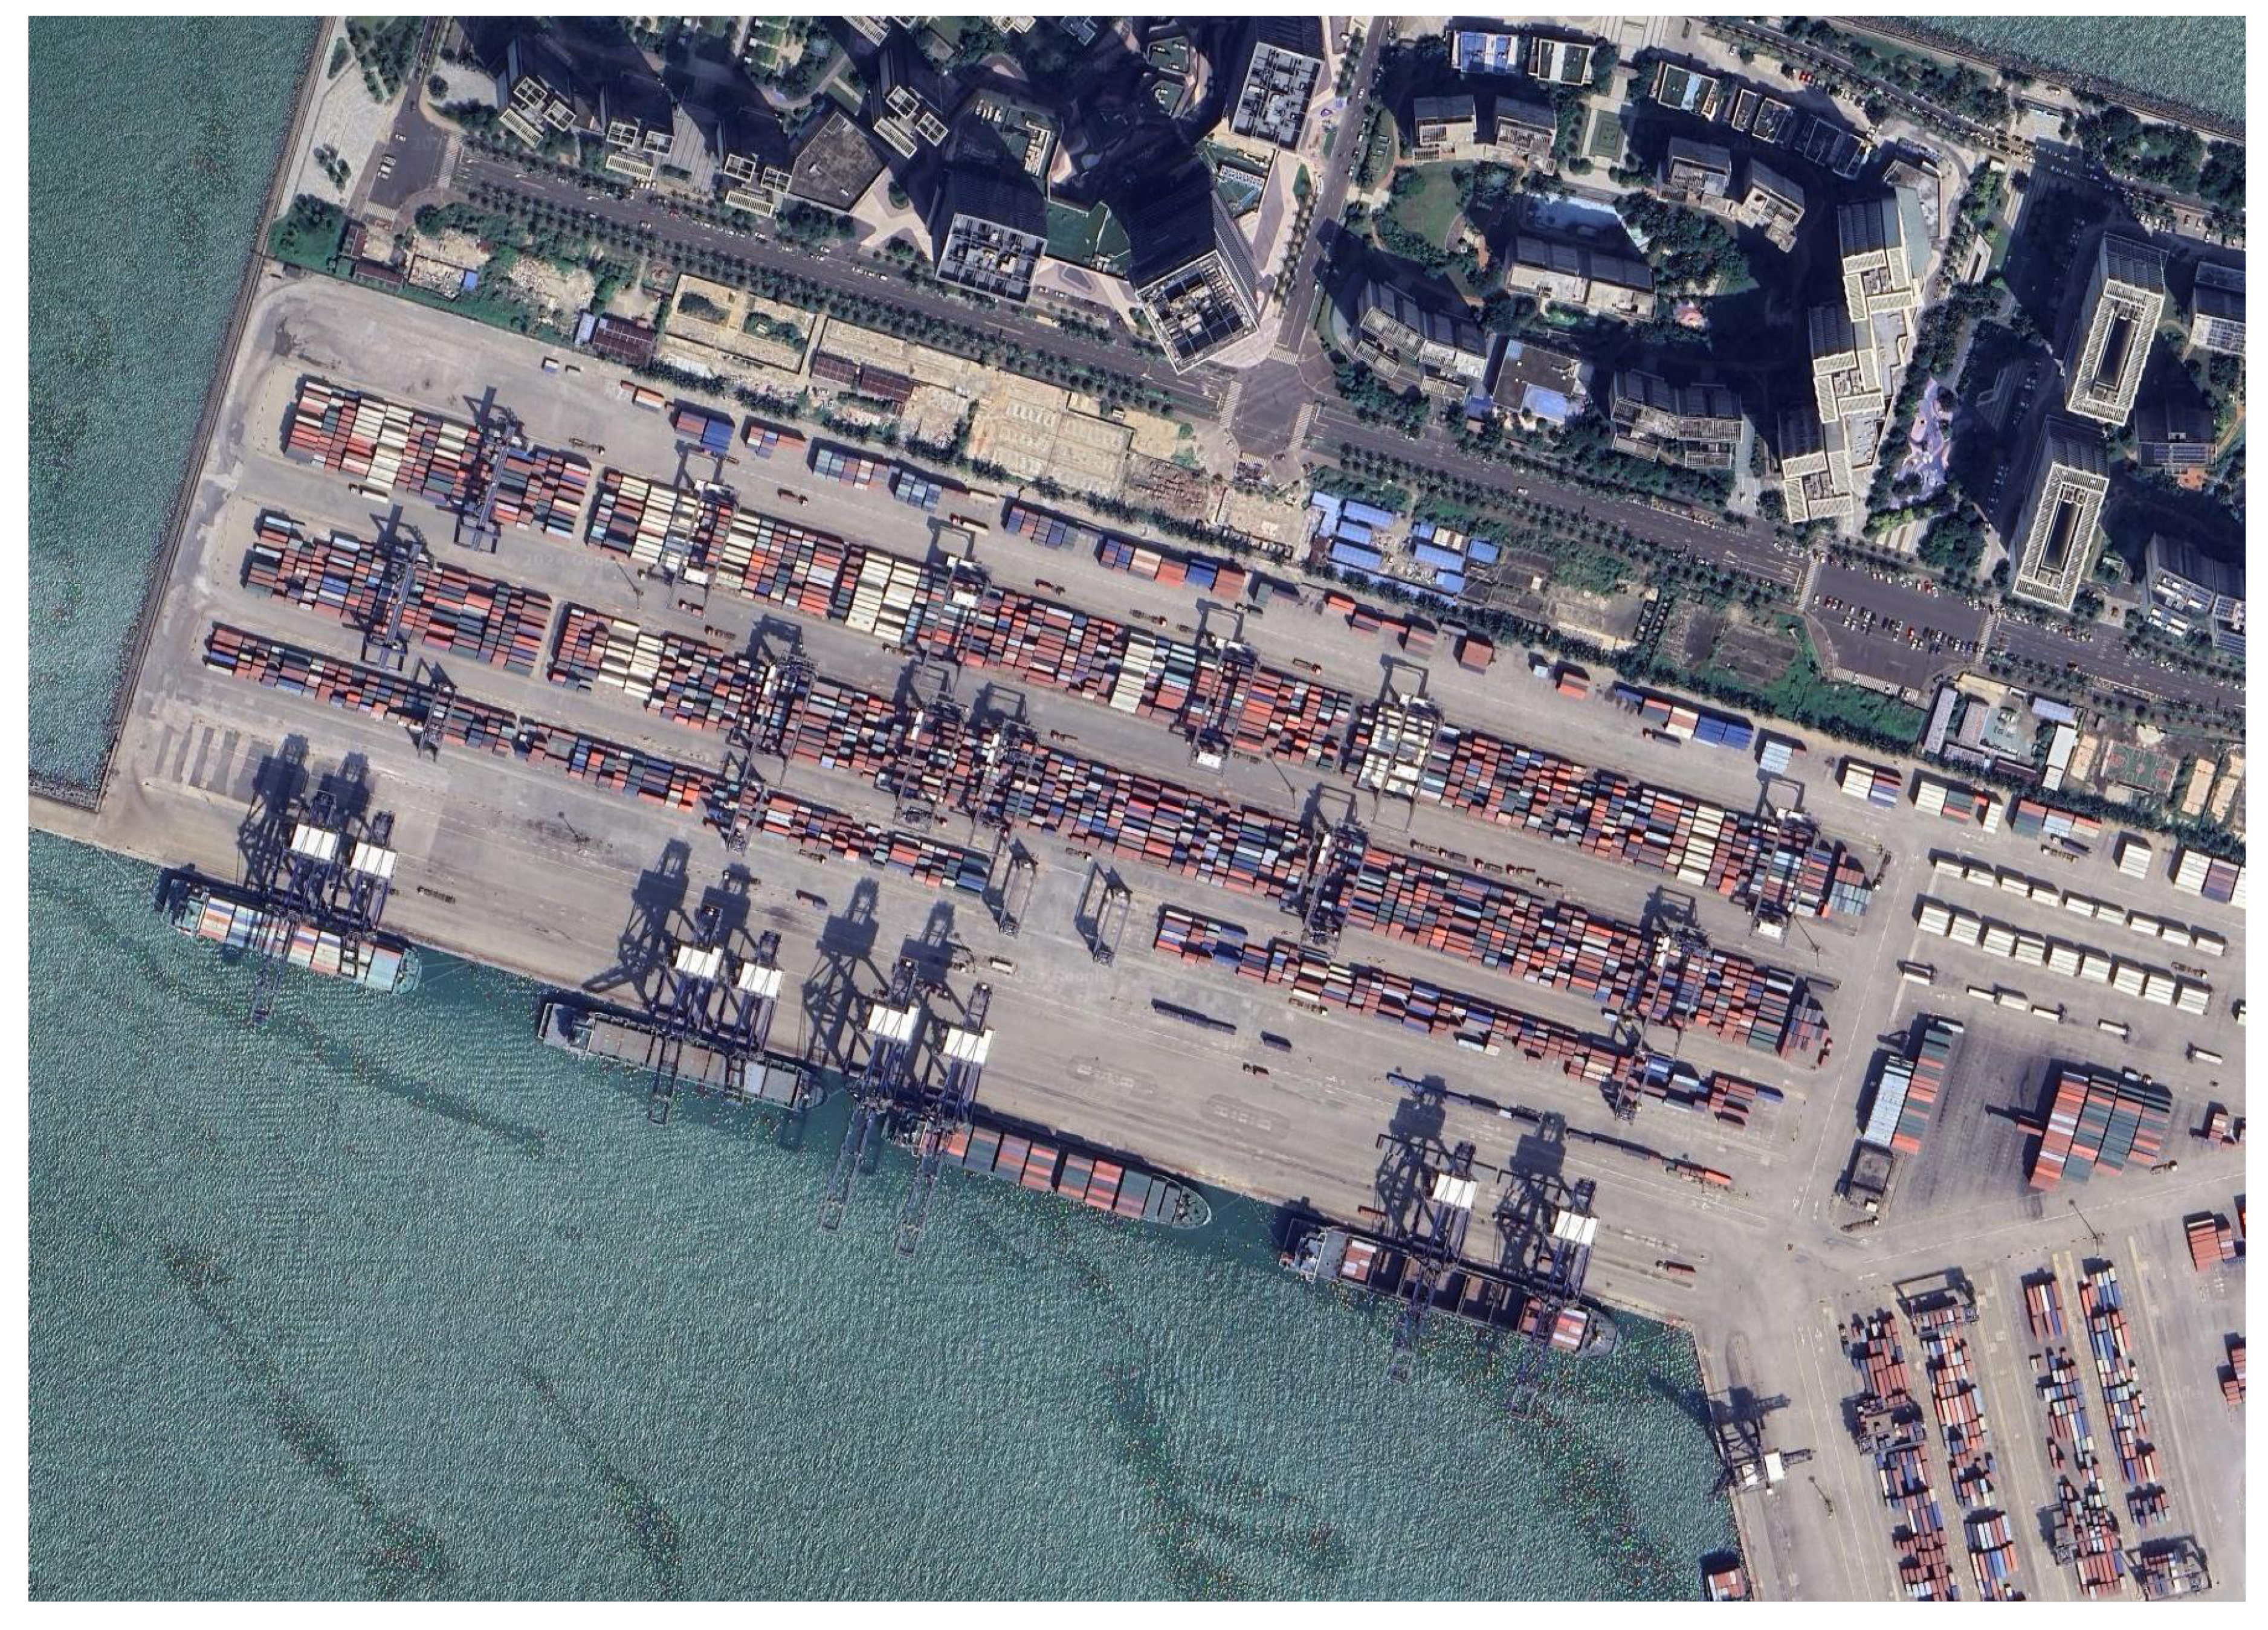
Figure 3.
Example of a labeled training sample. (a) Six-band input: RGB channels plus three POI probability maps; (b) binary building footprint mask (mask A); (c) three-class building-use mask (mask B).
Figure 3.
Example of a labeled training sample. (a) Six-band input: RGB channels plus three POI probability maps; (b) binary building footprint mask (mask A); (c) three-class building-use mask (mask B).
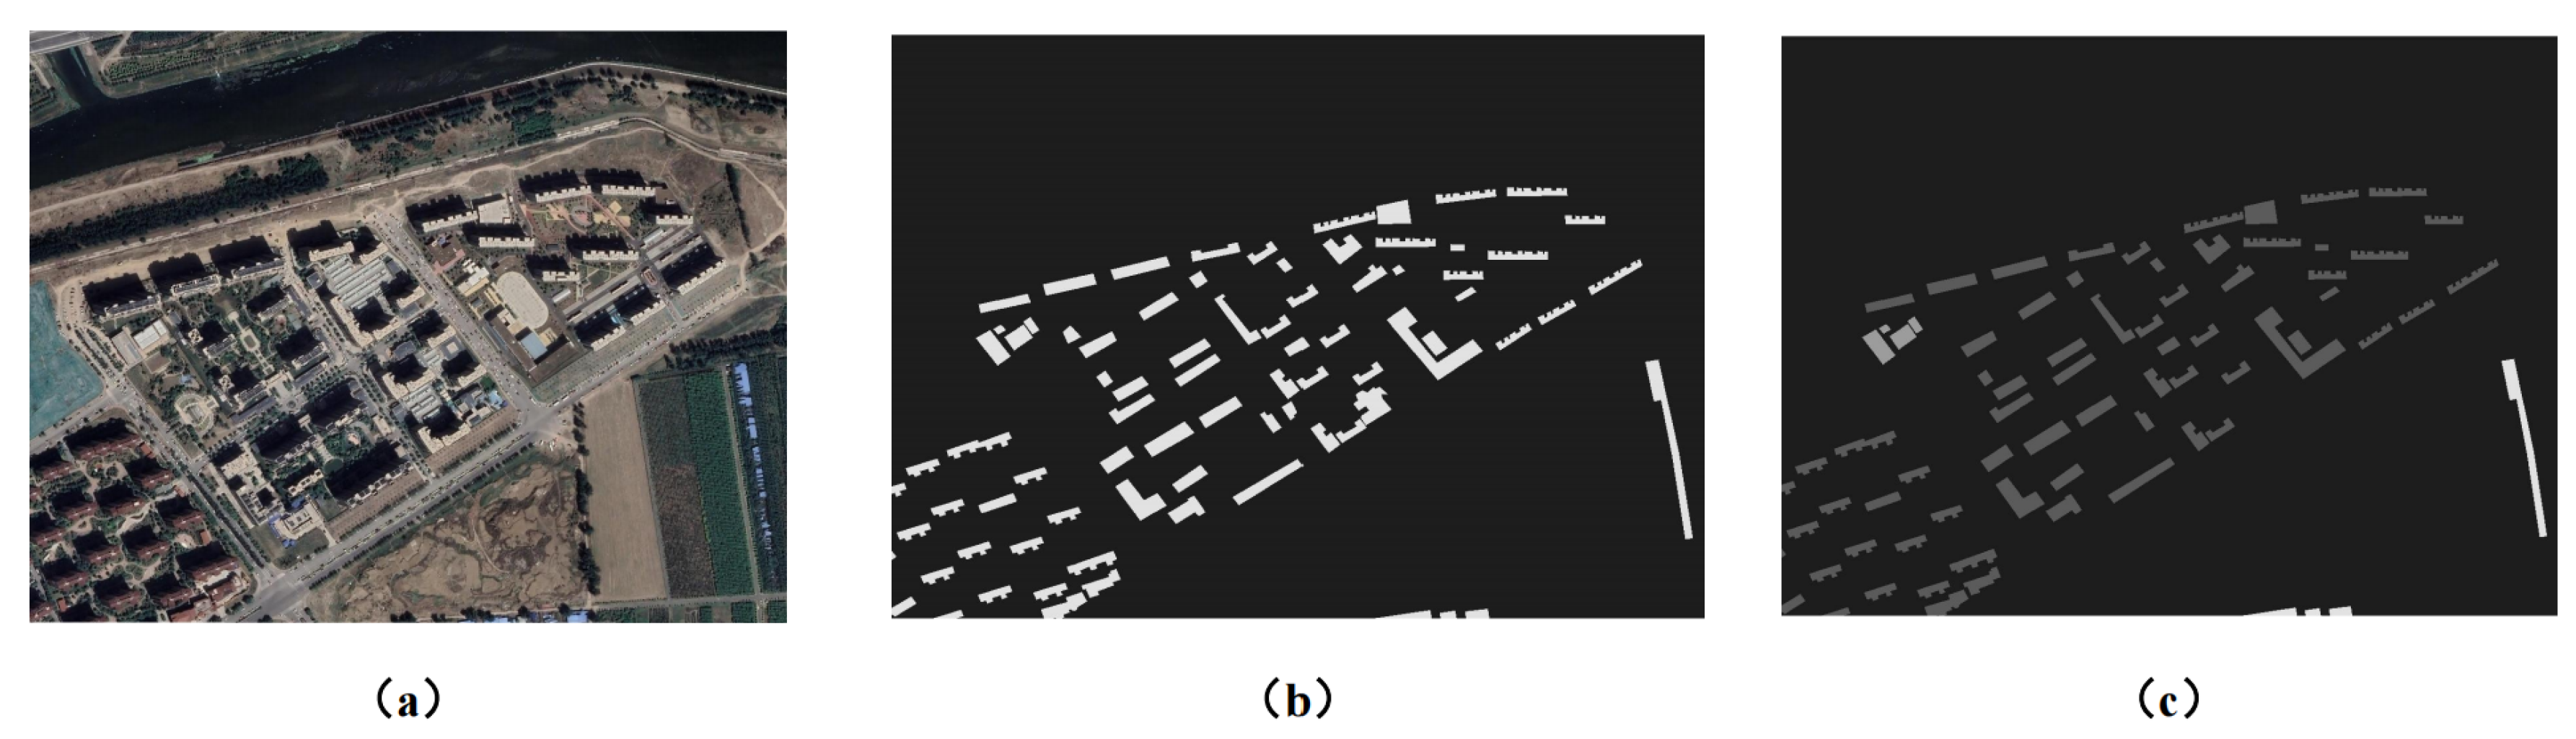
Figure 4.
Construction of the nationwide built-up mask from WSF 2019, CLCD 2023, and RESP 2017, and their union used to guide nationwide inference.
Figure 4.
Construction of the nationwide built-up mask from WSF 2019, CLCD 2023, and RESP 2017, and their union used to guide nationwide inference.
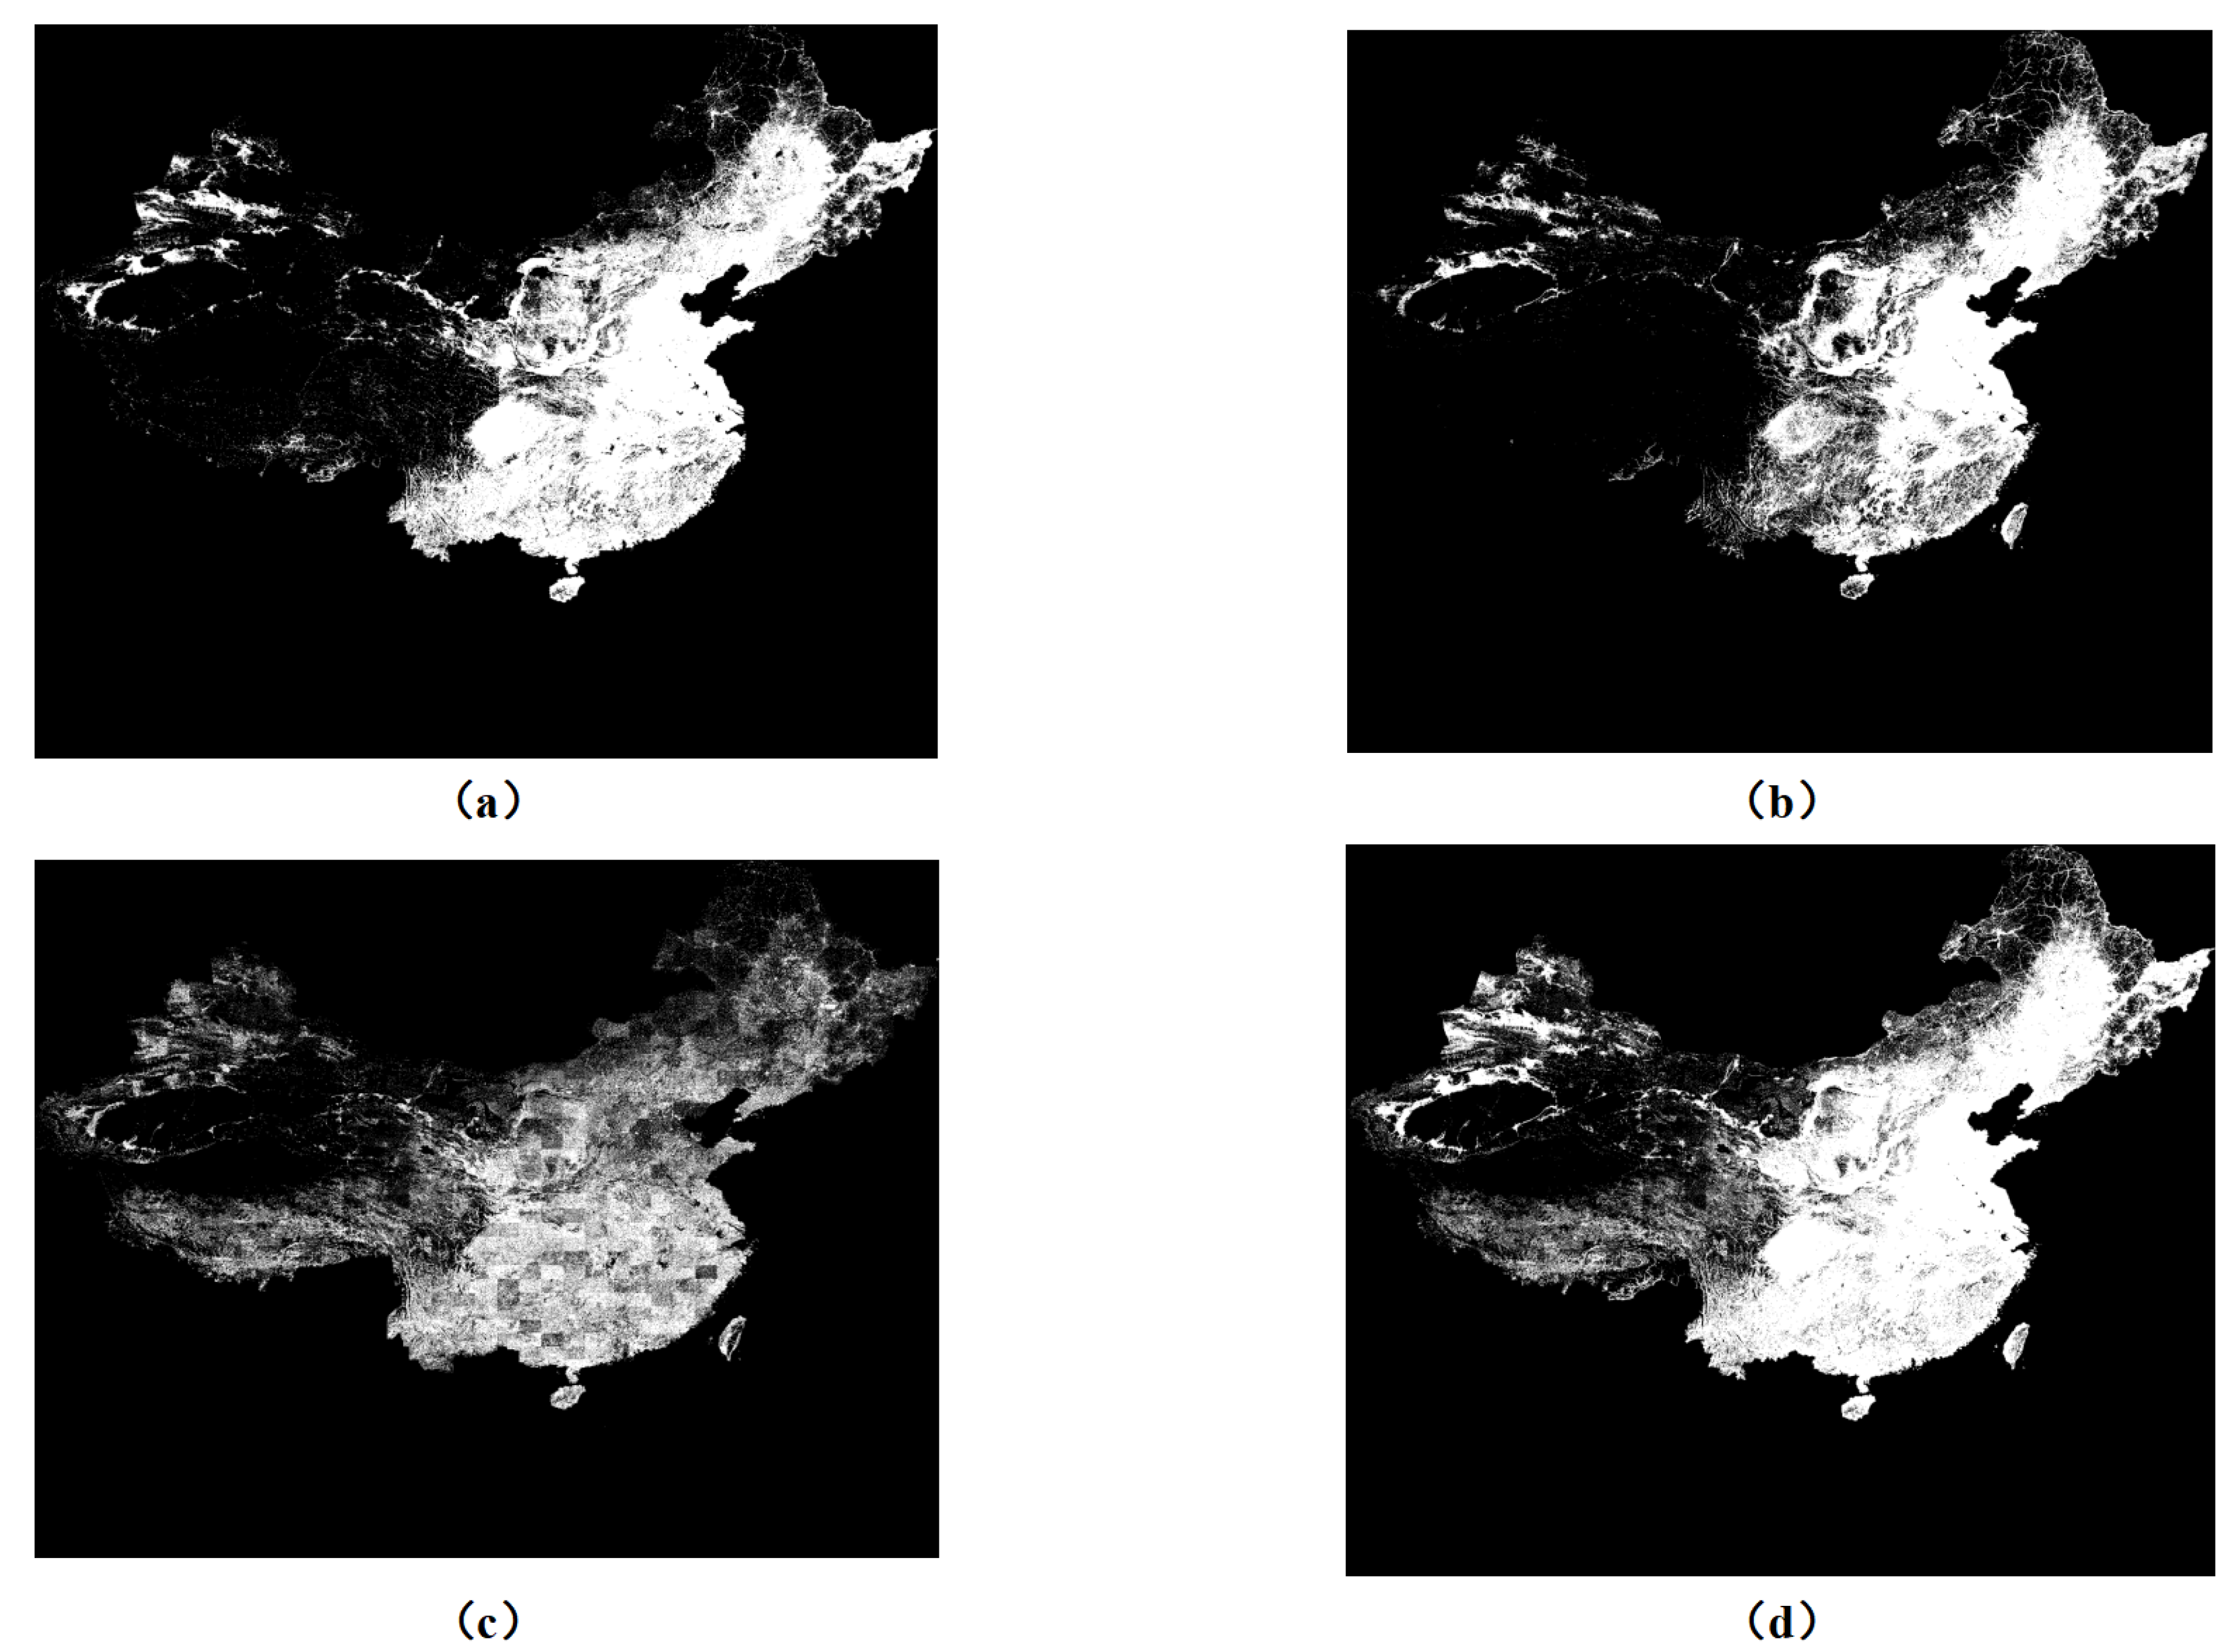

Table 1.
Mapping from GB/T 35648–2017 top-level POI categories to the three-class building-use taxonomy adopted in this study.
Table 1.
Mapping from GB/T 35648–2017 top-level POI categories to the three-class building-use taxonomy adopted in this study.
| Building-Use Class | Mapped POI Top-Level Categories (examples) |
|---|---|
| Residential (R) | Residence and lodging; resident services |
| Commercial (C) | Catering; wholesale and retail; vehicle sales and service; |
| finance and insurance; education and culture; healthcare and | |
| social services; sports and leisure; government and public | |
| institutions; commercial facilities and services; research | |
| institutes; primary sector services; place names and addresses | |
| Industrial (I) | Enterprises and companies; transportation and warehousing |
Table 2.
Ablation study on the impact of POI information and multi-task learning (input patch size 224×224). Per-class accuracy (Acc) and F1 are reported for each building-use class on the test set.
Table 2.
Ablation study on the impact of POI information and multi-task learning (input patch size 224×224). Per-class accuracy (Acc) and F1 are reported for each building-use class on the test set.
| Model | Residential | Commercial | Industrial | |||
|---|---|---|---|---|---|---|
| Acc | F1 | Acc | F1 | Acc | F1 | |
| Imagery only, single-task | 0.9643 | 0.7777 | 0.9533 | 0.4857 | 0.9720 | 0.6536 |
| Imagery + POI, single-task | 0.9683 | 0.8097 | 0.9595 | 0.5448 | 0.9802 | 0.7426 |
| Imagery + POI, multi-task (proposed) | 0.9698 | 0.8125 | 0.9598 | 0.5683 | 0.9813 | 0.7598 |
Table 3.
Ablation study on the impact of input patch size for the full multi-task model (imagery + POI). Per-class accuracy (Acc) and F1 are reported for each building-use class on the test set.
Table 3.
Ablation study on the impact of input patch size for the full multi-task model (imagery + POI). Per-class accuracy (Acc) and F1 are reported for each building-use class on the test set.
| Patch Size | Residential | Commercial | Industrial | |||
|---|---|---|---|---|---|---|
| Acc | F1 | Acc | F1 | Acc | F1 | |
| 224×224 | 0.9698 | 0.8125 | 0.9598 | 0.5683 | 0.9813 | 0.7598 |
| 1024×1024 | 0.9722 | 0.8417 | 0.9658 | 0.5770 | 0.9863 | 0.8263 |
| 2048×2048 | 0.9711 | 0.8416 | 0.9664 | 0.5828 | 0.9854 | 0.8143 |
Disclaimer/Publisher’s Note: The statements, opinions and data contained in all publications are solely those of the individual author(s) and contributor(s) and not of MDPI and/or the editor(s). MDPI and/or the editor(s) disclaim responsibility for any injury to people or property resulting from any ideas, methods, instructions or products referred to in the content. |
© 2026 by the authors. Licensee MDPI, Basel, Switzerland. This article is an open access article distributed under the terms and conditions of the Creative Commons Attribution (CC BY) license.
Copyright: This open access article is published under a Creative Commons CC BY 4.0 license, which permit the free download, distribution, and reuse, provided that the author and preprint are cited in any reuse.


