Submitted:
19 December 2025
Posted:
22 December 2025
You are already at the latest version
Abstract
Traditional log alerting systems suffer from high false positive rates and delayed anomaly diagnosis. This paper proposes an intelligent log analysis framework integrating self-supervised temporal modeling with vectorized semantic retrieval. The system constructs a log collection pipeline using the ELK Stack, employs BERT-derived models for semantic encoding of log fragments, and utilizes a Temporal Contrastive Learning module to capture cross-temporal anomaly patterns. By integrating Cluster-based Outlier Detection and an Attention-based visualization mechanism, it enables interpretable diagnosis of complex system behaviors. Experiments conducted on a production dataset of 120 million logs achieved a 14.7% improvement in F1 score, reduced detection latency by 48%, and attained an average alert accuracy of 92.3%. This framework significantly enhances the intelligent operations and maintenance capabilities of full-stack systems in AIOps environments.
Keywords:
log analysis
; self-supervised learning
; anomaly detection
; AIOps
; semantic modeling
; explainability
1. Introduction
In modern Web systems, log data flows are generated in large volumes across distributed, heterogeneous components, which pose challenges in structure, semantics, and time consistency. Traditional rules matching and statistical feature engineering are not able to capture heterogeneous semantic anomalies across multiple time windows. In order to overcome these challenges, a new approach to build a context-aware log behavior model, which combines temporal coding and semantic clustering, has been proposed as a promising approach to improve the performance of complex systems.
2. Log Data Modeling and Semantic Vector Representation
2.1. Log Collection and Structured Processing Workflow Based on ELK Stack
Within the intelligent operations framework for web systems, log In the intelligent operations framework, log collection and structuring form the input layer of anomaly detection. This study builds a log pipeline using the ELK Stack, with Filebeat deployed in a multi-node container environment to sample logs at 500 ms intervals [1]. Logstash parses raw logs via Grok and extracts fields like IP and location using GeoIP. Logs are stored in Elasticsearch in JSON format. Each entry includes 12–15 standardized fields—such as timestamp, host ID, service name, module path, log level, and message—under a unified schema to support efficient semantic modeling.
2.2. Log Semantic Embedding Transfer and Adaptation Based on BERT and Its Derivative Models
To handle the heterogeneity in log syntax, terminology, and context, BERT-based pre-trained models are adopted for semantic embedding. A transfer adaptation mechanism is introduced to better process non-natural language sequences (see Figure 1). Standard BERT struggles with semantic degradation in high-frequency templates; thus, LogBERT and DistilBERT are used as backbones, enhanced by domain-specific self-supervised tuning and optimized positional embeddings [2]. The transfer strategy combines parameter sharing with local freezing, and incorporates a residual attention fusion mechanism within intermediate Transformer layers:
where denotes the final semantic embedding representation, is the intermediate representation output from theth Transformer layer, represents the attention fusion weights for that layer, and is the total number of layers [3]. This mechanism enables the model to dynamically adjust the contribution of features from different layers to the final semantic vector during transfer, enhancing its ability to represent structural symbol sequences (e.g., paths, stack information, variable names) [4].
2.3. Attention Mechanism and Interpretable Vector Representation for Anomaly Semantic Modeling
In modeling log anomaly detection, accurately capturing local semantic shifts and contextual anomaly behavior features is critical for modeling effectiveness[5]. We construct an anomaly semantic enhancement model based on a multi-head attention fusion mechanism, introducing cross-granular attention pathways in the contextual encoding layer to dynamically compute the dependency weights of anomalous fragments on the global log sequence. The attention matrix for the input sequence is defined as follows [6]:
where and represent the Query and Key vectors generated by the th token, respectively. denotes the Key vector dimension for scaling normalization. The attention output vector is aggregated via the Value weight to obtain the anomaly representation:
To enhance interpretability, this study constructs a vector attribution graph ( ), where represents the interpretable weight of the th anomaly token for the th input fragment. The calculation combines attention cumulative propagation with gradient response mapping strategies. To align semantic explanation vectors with anomaly event labels, the vector output structure of the explanation layer is defined as shown in Table 1. The mapping relationship is established between token-level attention fusion values and high-frequency anomaly codes, facilitating visualization and root cause analysis for downstream modules.
3. Building a Self-Supervised Learning-Based Temporal Anomaly Detection Model
3.1. Principles of Self-Supervised Temporal Contrastive Learning
To achieve anomaly detection modeling without manual labeling, we introduce a self-supervised temporal contrastive learning framework. This captures potential anomaly behavior features by constructing temporal sequence context representation consistency and dynamic pattern deviation metrics. Within this framework, raw log semantic sequences are first divided into consecutive segments using a fixed window length ( ). Positive and negative sample pairs are then constructed for the central segment. Positive samples originate from adjacent windows within the same sequence but at different time spans, while negative samples are constructed through temporal perturbations, content substitutions, and semantic reordering [7].
For each segment , its representation after passing through the encoder is defined as . The contrastive learning loss function is defined based on the temperature-scaled InfoNCE form as follows:
where denotes the positive sample representation for the th sample, is the negative candidate for the th sample, represents the cosine similarity between vectors, and is the temperature parameter controlling the smoothness of the similarity distribution.
3.2. Positive and Negative Sample Construction and Window Mechanism Design
To model semantic deviations in log sequences, a time-window-based sampling strategy is combined with semantic-aware construction of positive and negative samples. As shown in Figure 2, the raw log stream is modeled as an ordered sequence L={l1,l2,…,ln}, where each lil_ili is a structured fragment. A sliding window of fixed length w and stride 1 generates overlapping segments S={s1,s2,…,sn−w+1}, with each si={li,li+1,…,li+w−1}. For each target segment sis_isi, positive samples are drawn from adjacent windows si−1 or si+1 to maintain semantic and temporal continuity [8]. Negative samples are created by applying perturbations such as time shifting, token substitution, or semantic recombination to unrelated windows, disrupting sequence coherence. Each segment is encoded as a feature vector zi∈Rdz_i \in \mathbbzi∈Rd and Ni representing the corresponding positive and negative sample sets used in contrastive loss computation.s:
Here, denotes the sample sampling space unrelated to the context of window, generated from a set of log fragments controlled by offset threshold.
3.3. Anomaly Detection Discrimination Strategy and Cluster-Based Detection Method
The core of anomaly discrimination in the latent embedding space lies in measuring the deviation between the current temporal window representation and the learned distribution of normal behaviors. During training, the K-Means algorithm is applied to construct a set of semantic cluster centroids, dynamically adjusted based on the behavioral complexity of the log corpus[9]. For each log segment, its anomaly score is computed as the minimum Euclidean distance to these centroids, effectively identifying deviations from clustered patterns of normal operation.However, this global clustering strategy may yield false negatives in scenarios with localized density variations. To address this limitation, a local reachable density scoring method is introduced. Each segment’s k-nearest neighbor set is constructed to compute its average distance-based density. Anomaly scores are then refined by comparing this local density with that of surrounding segments, thereby enhancing the model’s sensitivity to sparse or isolated abnormal behaviors.This dual-level approach—combining global cluster deviation and local density contrast—enables the system to accurately detect both structured and subtle anomalies in high-dimensional semantic embedding spaces, without relying on manual rule tuning[10].
4. Experimental Design and Performance Validation
4.1. Dataset Description
The dataset was collected over 90 consecutive days from a large-scale e-commerce platform, generating approximately 124 million structured logs at 500 ms intervals. It covers 15 service nodes, including front-end, middleware, and backend APIs. The log pipeline, based on Filebeat and Logstash, supports high-throughput streaming and preprocessing.Each log entry contains 12–15 standardized fields (e.g., timestamp, service_name, path, log_level, trace_id, message; see Table 2), uniformly indexed in Elasticsearch to support semantic modeling.
Ground truth was annotated via a hybrid method combining rule-based triggers and tenant-level degradation logs, with expert validation to ensure accuracy. Anomalies fall into three categories: authentication failures, service unavailability, and high latency, totaling 0.82% of logs, with service unavailability being the most frequent. This fine-grained labeling supports reliable evaluation of precision, recall, and F1-score.
4.2. Experimental Setup
Experiments were conducted using a PyTorch-based self-supervised temporal contrastive learning framework. The proposed model adopts a dual-tower Transformer with 6 encoder layers, 512-dimensional embeddings, and 8 attention heads. Training was performed for 100 epochs with a batch size of 64, using Adam optimizer (learning rate = 1e-4).To ensure fairness, all models use the same structured log input. Log sequences are segmented with a sliding window of length 10 and stride 1, and each fragment is encoded into a 512-dimensional vector via the same pre-trained embedding model.Four baselines are included for comparison:
1.LSTM: Three-layer architecture, hidden size of 256, dropout rate 0.3, trained for 60 epochs, learning rate 5e-4.2.Temporal Convolutional Network (TCN): Eight convolutional layers with kernel size 3, exponentially increasing dilation, residual blocks, and 128 channels.3.Isolation Forest: Constructed with 100 estimators, max_samples=256, and contamination set to auto.4.One-Class SVM: Utilizes an RBF kernel with hyperparameters ν = 0.05 and γ = ‘scale’.Model performance is evaluated using three key metrics:
1.F1-score: Harmonic mean of precision and recall;
2.Accuracy: Proportion of correctly identified fragments;
3.Alert latency: Defined as the time difference between the ground-truth anomaly trigger and the system’s detection output, formally given by:
All metrics are computed at the log fragment level. This unified design of data input and strict control of hyperparameters ensures the reproducibility, comparability, and interpretability of the experimental results.
4.3. Experimental Results Analysis
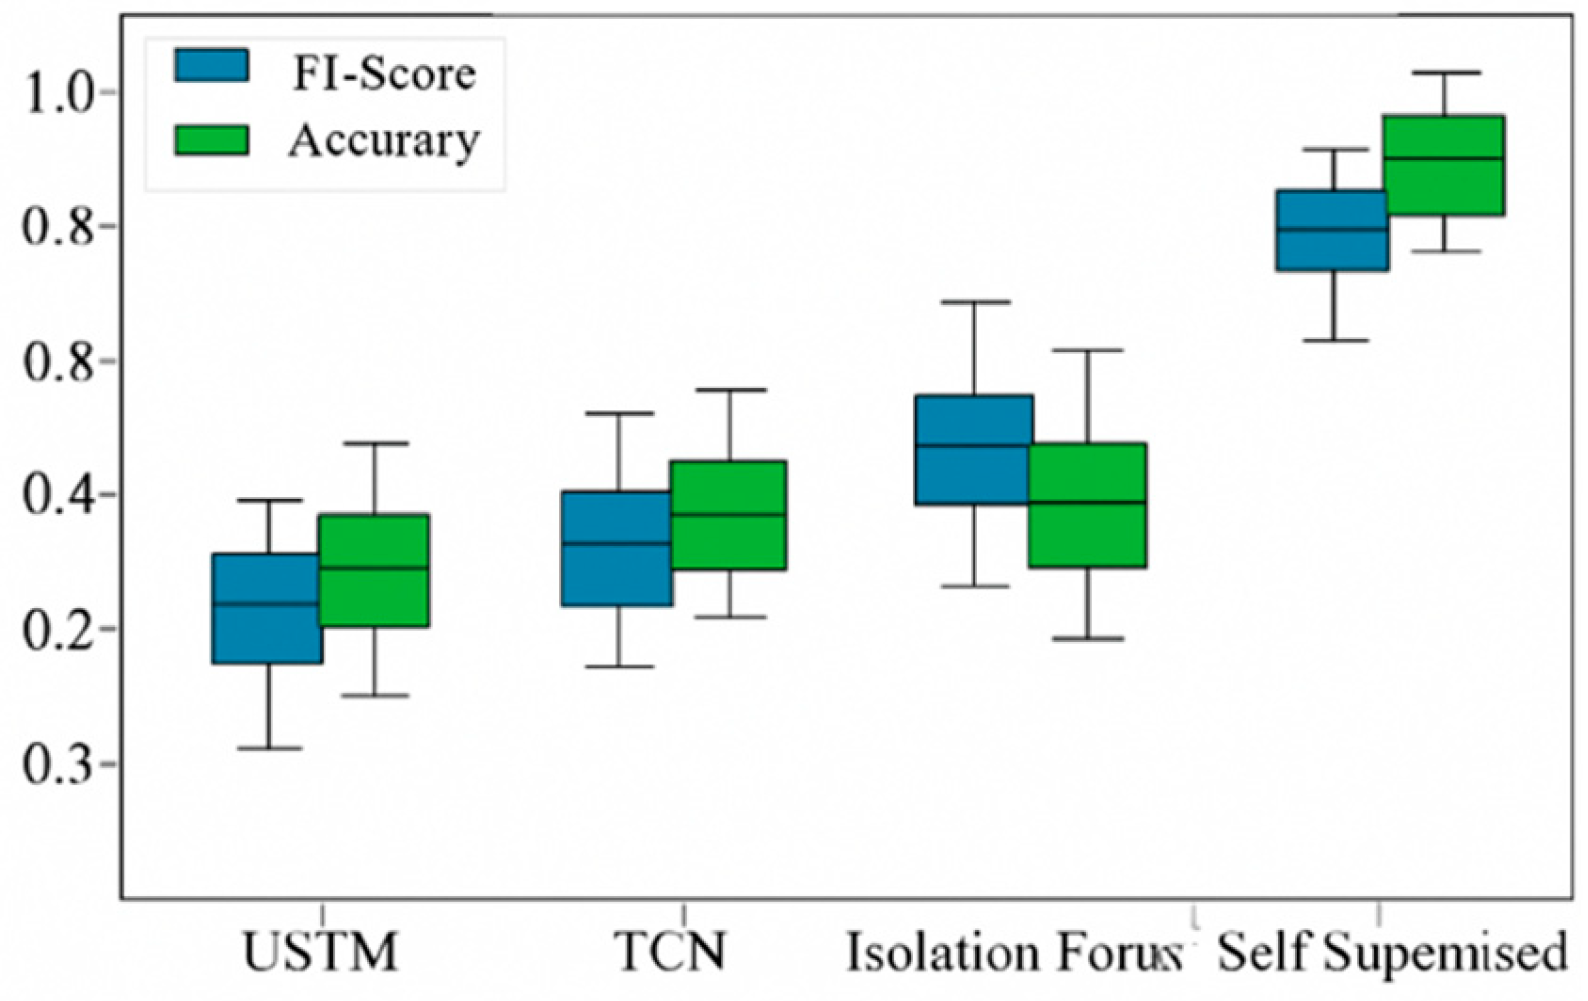
To evaluate model performance, three aspects are analyzed: detection accuracy, alert latency, and interpretability. All metrics are computed at the log fragment level and averaged over five runs for statistical reliability.For detection, the proposed model achieves an average F1-score of 0.914 and precision of 0.907, outperforming LSTM (F1 = 0.797) and Isolation Forest (F1 = 0.761) by 14.7% and 20.1%, respectively. Overall accuracy remains at 92.3%, confirming the effectiveness of temporal contrastive learning and cluster-based scoring in detecting semantic deviations.In terms of latency, the model reduces mean detection delay to 1.73 seconds, significantly faster than LSTM (3.33 s) and TCN (2.91 s), benefiting from dynamic window aggregation that captures context shifts earlier—advantageous for real-time monitoring.Interpretability is evaluated via attention attribution maps, which show better localization and semantic focus than Grad-CAM and Attention Rollout baselines. This enables clear differentiation of structural (e.g., path changes) and content-level (e.g., value anomalies) issues. The effectiveness of this module is further supported by ablation results in Section 4.
Figure 3.
Detection Accuracy Comparison.
4.4. Ablation Studies
To further validate the contribution of key modules to overall performance, ablation experiments were designed to remove core components and observe performance changes, evaluating their practical efficacy in anomaly detection. Ablation targets include: ① Log Semantic Modeling Module, capturing contextual dependencies in log sequences; ② Self-Supervised Pretraining Mechanism, enhancing model generalization on unlabeled data; ③ Multi-Scale Attention Mechanism, designed to enhance sensitivity to complex patterns. Experiments were conducted using identical datasets and parameter configurations, evaluated across four metrics: Accuracy, Recall, Precision, and F1 score.
As shown in Figure 4, the full model achieves optimal performance across all metrics, with an F1 score of 91.4%. Removing the self-supervised module reduces the F1 score to 86.3%, indicating that pretraining significantly enhances anomaly pattern recognition. Removing the semantic modeling module reduced the F1 score to 84.1%, highlighting the critical role of context modeling in log information comprehension. Conversely, removing the multi-scale attention mechanism caused a substantial decline in Recall, demonstrating its pivotal importance in capturing low-frequency anomalies. Overall, the synergistic collaboration of these three modules substantially enhances the model’s adaptability and robustness within complex web systems.
5. Conclusions
We constructed a comprehensive detection framework spanning log modeling, semantic encoding, self-supervised learning, and interpretable anomaly detection, effectively enhancing the system’s precision and timeliness in responding to multi-source log anomalies. Future work may extend the model’s generalizable deployment to multi-task scenarios, improving adaptive detection capabilities for unstructured anomalies in multi-tenant environments.
References
- Zheng, X., Chen, X., Gong, S., Griffin, X., & Slabaugh, G. (2025, September). Xfmamba: Cross-fusion mamba for multi-view medical image classification. In International Conference on Medical Image Computing and Computer-Assisted Intervention (pp. 672-682). Cham: Springer Nature Switzerland.
- Cao, J; Di, X; Liu, X; et al. Towards robust log parsing using self-supervised learning for system security analysis[J]. Intelligent Data Analysis 2024, 28(4), 1093–1113. [Google Scholar] [CrossRef]
- Nakıp, M; Gelenbe, E. Online self-supervised deep learning for intrusion detection systems[J]. IEEE Transactions on Information Forensics and Security 2024, 19, 5668–5683. [Google Scholar] [CrossRef]
- Xie, Y; Zhang, H; Babar, M A. Logsd: Detecting anomalies from system logs through self-supervised learning and frequency-based masking[J]. Proceedings of the ACM on Software Engineering 2024, 1(FSE), 2098–2120. [Google Scholar] [CrossRef]
- Mozaffari, M; Doshi, K; Yilmaz, Y. Self-supervised learning for online anomaly detection in high-dimensional data streams[J]. Electronics 2023, 12(9), 1971. [Google Scholar] [CrossRef]
- Ali, T; Iqbal, R; Ansari, N M; et al. AI-POWERED ANOMALY DETECTION IN SOFTWARE LOGS: A MACHINE LEARNING APPROACH FOR PROACTIVE FAULT DIAGNOSIS AND SELF-HEALING SYSTEMS[J]. Spectrum of Engineering Sciences 2025, 3(3), 302–322. [Google Scholar]
- Ye, M; Zhang, Q; Xue, X; et al. A novel self-supervised learning-based anomalous node detection method based on an autoencoder for wireless sensor networks[J]. IEEE Systems Journal 2024, 18(1), 256–267. [Google Scholar] [CrossRef]
- Tunde-Onadele, O; Lin, Y; Gu, X; et al. Self-supervised machine learning framework for online container security attack detection[J]. ACM Transactions on Autonomous and Adaptive Systems 2024, 19(3), 1–28. [Google Scholar] [CrossRef]
- Cao, J; Di, X; Liu, X; et al. Anomaly detection for in-vehicle network using self-supervised learning with vehicle-cloud collaboration update[J]. IEEE Transactions on Intelligent Transportation Systems 2024, 25(7), 7454–7466. [Google Scholar] [CrossRef]
- Sattar, S; Khan, S; Khan, M I; et al. Anomaly detection in encrypted network traffic using self-supervised learning[J]. Scientific Reports 2025, 15(1), 26585. [Google Scholar] [CrossRef] [PubMed]
Figure 1.
Architecture for Log Semantic Embedding Transfer and Adaptation Based on BERT and Its Derivatives.
Figure 1.
Architecture for Log Semantic Embedding Transfer and Adaptation Based on BERT and Its Derivatives.
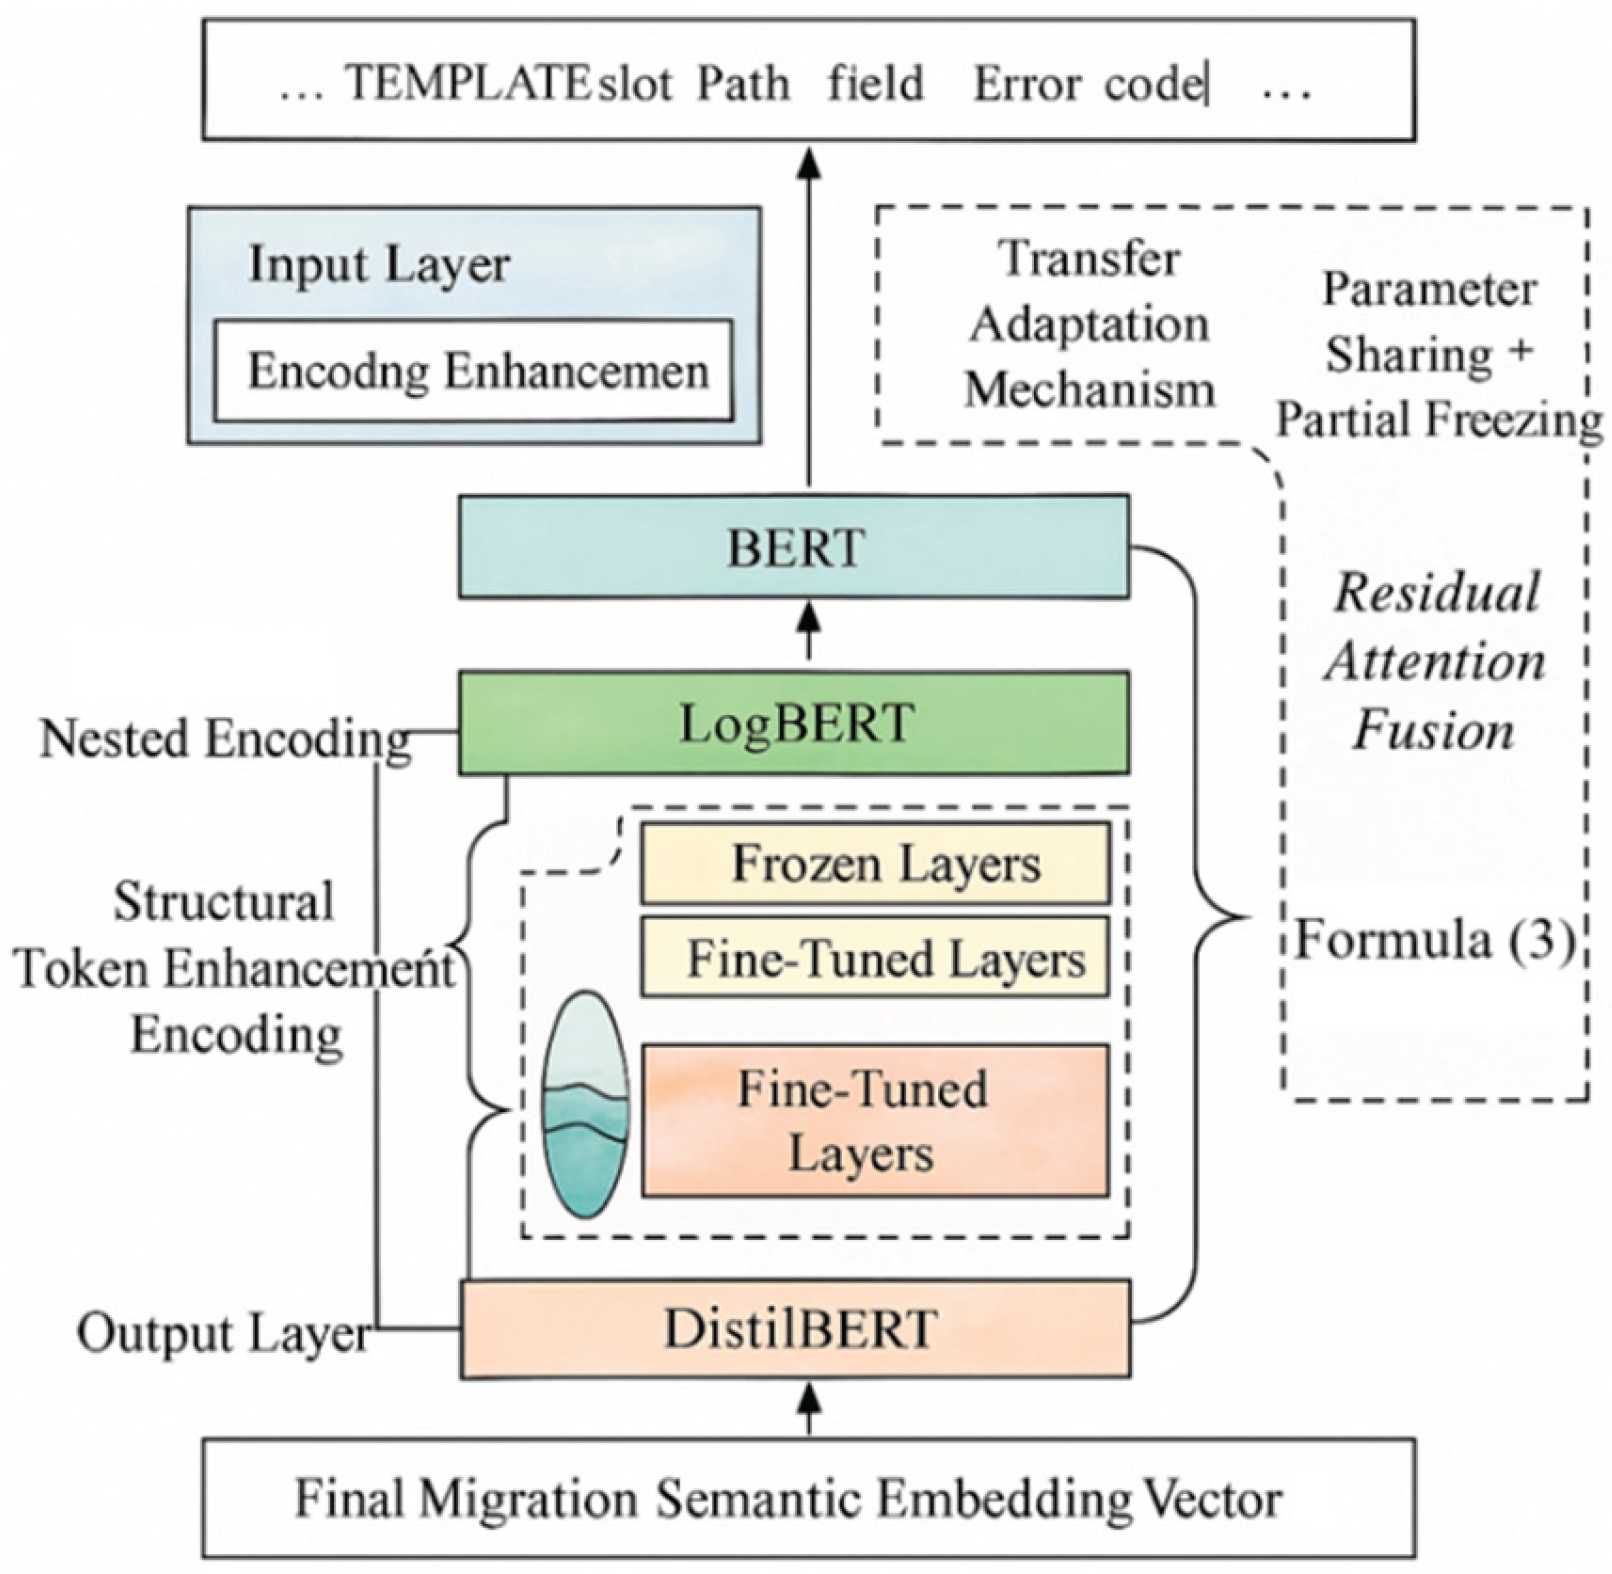
Figure 2.
Schematic of positive and negative sample construction mechanism based on time windows.
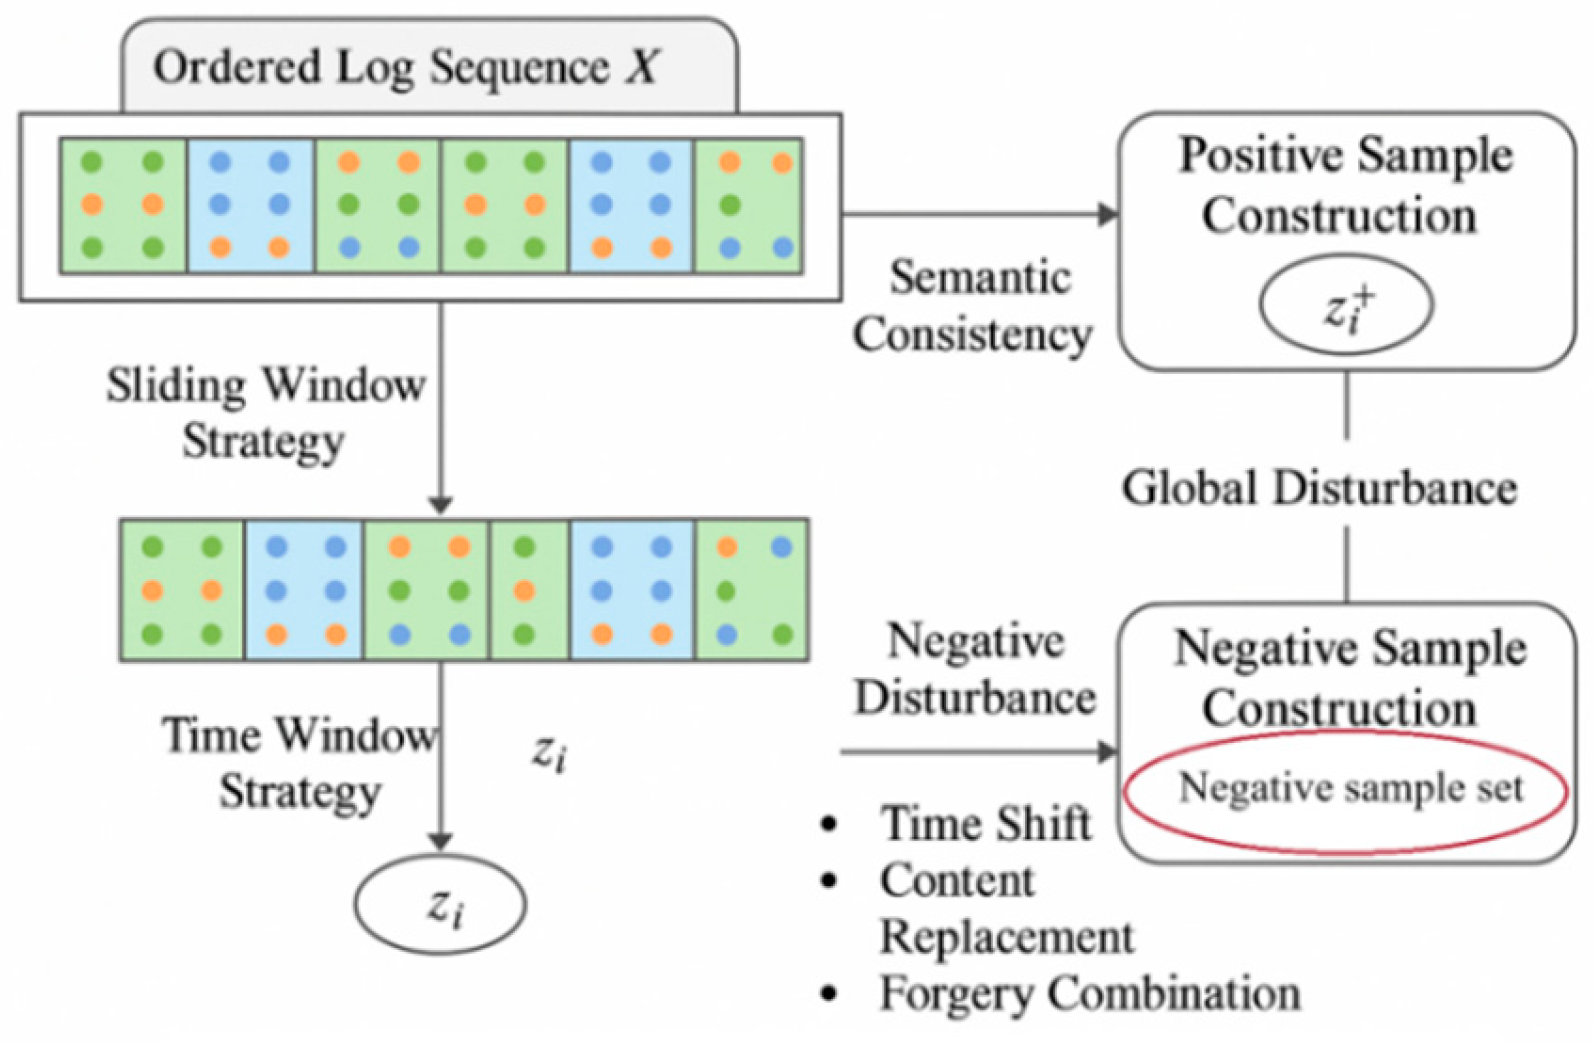
Figure 4.
Ablation experiment results.
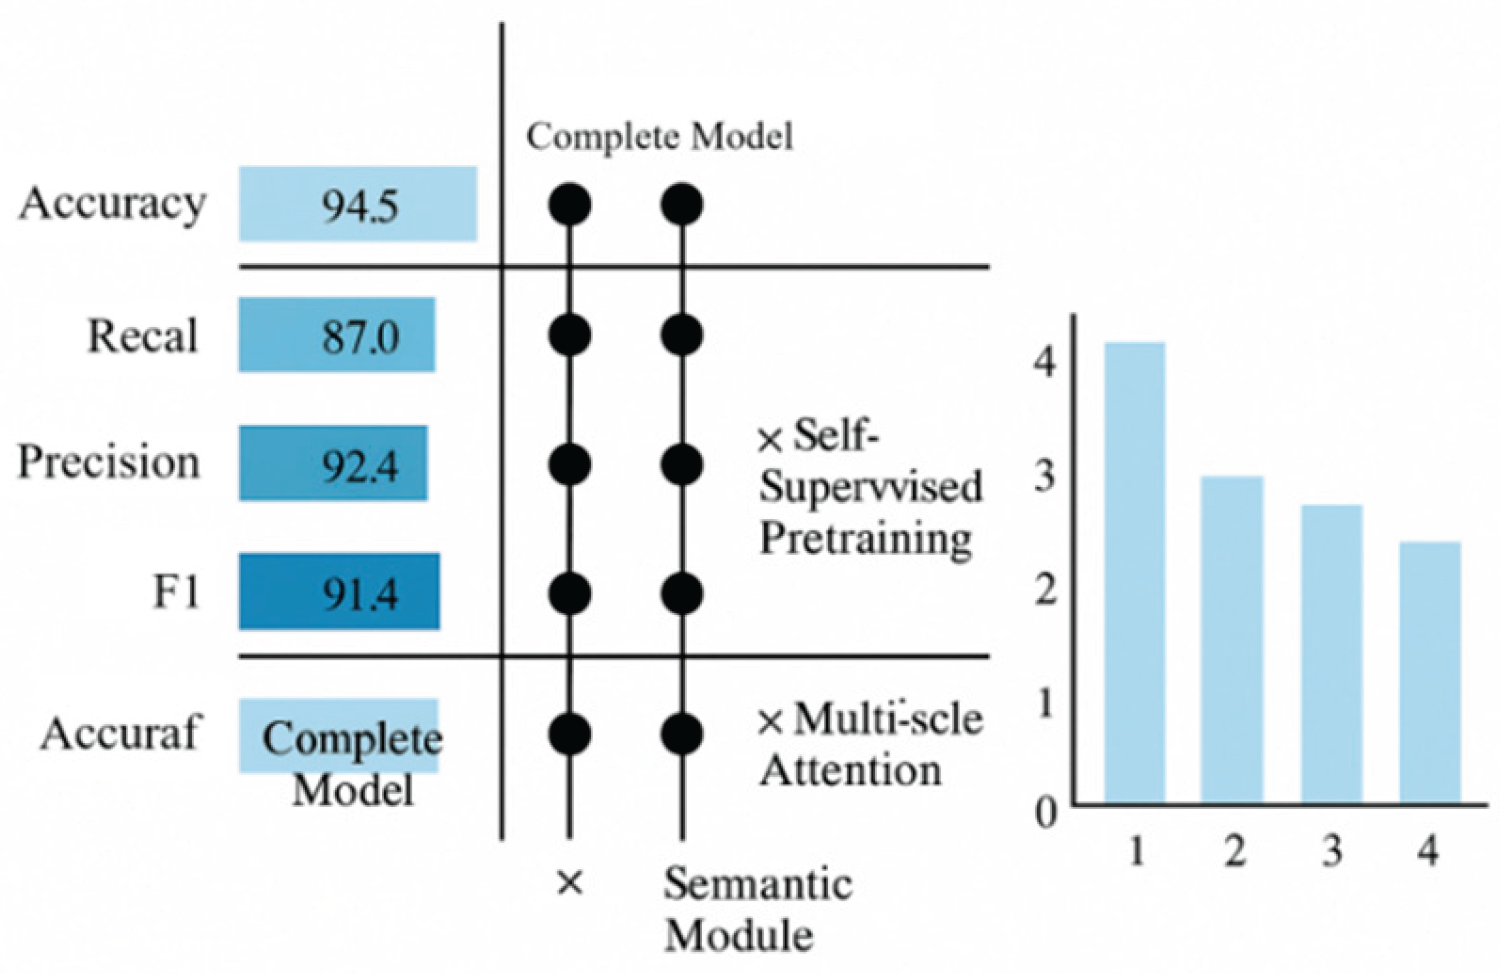

Table 1.
Configurable Mapping of Explainable Semantic Vector Output Structure and Dimensions.
| Encoding Level | Vector Output Dimension | Mapping Field | Corresponding Explanation Target |
| Attention Matrix | (n × n) | Token Pair Weight Matrix | Dependency Paths Between Anomalous Tokens |
| Attribution Vector | (1 × n) | Grad-CAM Aggregate Value | Anomaly-Sensitive Weight Distribution |
| Explanation Embedding | (1 × 512) | Encoder Fusion Results | Visualization of high-dimensional anomaly vector explanations |
Table 2.
Log Field Composition and Structural Distribution.
| Field Name | Field Type | Example | Average Length | Description |
| timestamp | datetime | 2023-10-01T15:23:11.342Z | 24 | Log generation timestamp, precision in milliseconds |
| service_name | string | user-auth-service | 21 | Service identifier associated with the log |
| path | string | /api/v1/auth/login | 25 | Business path triggering the log |
| log_level | enum | ERROR | 5 | Log Level (INFO/WARN/ERROR) |
| trace_id | string | f9a1d23c7c19fae08… | 32 | Trace ID |
| message | text | User token expired… | 70–120 | Core log content body, supporting nested structures |
Disclaimer/Publisher’s Note: The statements, opinions and data contained in all publications are solely those of the individual author(s) and contributor(s) and not of MDPI and/or the editor(s). MDPI and/or the editor(s) disclaim responsibility for any injury to people or property resulting from any ideas, methods, instructions or products referred to in the content. |
© 2025 by the authors. Licensee MDPI, Basel, Switzerland. This article is an open access article distributed under the terms and conditions of the Creative Commons Attribution (CC BY) license (http://creativecommons.org/licenses/by/4.0/).
Copyright: This open access article is published under a Creative Commons CC BY 4.0 license, which permit the free download, distribution, and reuse, provided that the author and preprint are cited in any reuse.


