
Submitted:
16 December 2025
Posted:
17 December 2025
You are already at the latest version
Abstract
Determining the concentration of fatty acid ethyl esters (FAEEs), ethyl sulfate (EtS), and ethyl glucuronide (EtG) is crucial for establishing the actual scale of prenatal alcohol ex-posure (PAE) and the early diagnosis of Fetal Alcohol Spectrum Disorders (FASD). The study’s main objective was to compare two methods of detecting PAE: retrospective sur-veys of maternal alcohol consumption and chromatographic analysis of newborn meco-nium for these alcohol biomarkers. The study involved 478 mothers from the Pomeranian Province, with parallel samples of newborn meconium collected for analysis. Biomarker analysis involved determining the concentration of 9 FAEEs by Gas Chromatography–Mass Spectrometry (GC-MS) and EtG and EtS by Liquid Chromatography–Tandem Mass Spectrometry (LC-MS/MS). The study also aimed to determine the cut-off concentrations and usefulness of these PAE markers. Only approximately 4% of mothers reported drink-ing alcohol during pregnancy, suggesting a significant underestimation of the actual PAE scale compared to objective biomarker analysis. The use of the cumulative biomarker in-dex (CBI2) ≥ 5 suggests that alcohol consumption during pregnancy affected approximate-ly 3% of the studied population, highlighting the low reliability of maternal self-declarations. The most reliable information about PAE was provided by a combination of EtG and EtS biomarkers. The study confirms the difficulty in obtaining a reliable history of alcohol exposure during pregnancy.
Keywords:
alcohol consumption biomarkers
; EtG
; EtS
; FAEEs
; meconium
; fetal alcohol spectrum disorders
; reliability of survey and chemical analyses
; liquid chromatography and gas chromatography with mass spectrometry
1. Introduction
Prenatal alcohol exposure (PAE) is a key issue in attempting to diagnose fetal alcohol spectrum disorders (FASD) at an early stage of a child’s development. Proper diagnosis of these disorders is generally based on the child’s medical history and observations.
According to prospective studies conducted by Australian pediatricians, the median age of diagnosis for children with FASD was 3.3 years, with only 6.5% diagnosed at birth and 63% diagnosed at age 5 [1].
In the US, between 2011 and 2013, approximately 10% of pregnant women reported alcohol consumption in the last 30 days, and approximately 1-5% of American school-age children met the criteria for FASD. In Poland, FASD is rarely diagnosed, and its prevalence in school-age children (7–9 years old) was estimated in one study to be no less than 2%. Poland is one of the countries where pregnant women consume alcohol in about 10% of cases. This is the global average, but it is relatively low compared to other European countries [2,3].
It is difficult to obtain reliable information about alcohol consumption by women during pregnancy. Many women conceal this fact for fear of stigmatization. For this reason, it is necessary to find objective criteria unrelated to medical history that would indicate prenatal exposure to alcohol (e.g., in the form of PAE biomarkers) [4]. Diagnostic tests related to alcohol consumption can be considered depending on the time window for the detection of ethanol and its oxidative and non-oxidative metabolites. PAE biomarkers are usually EtG, EtS, and FAEEs measured in biological materials such as meconium, hair, nails, or the umbilical cord of a newborn. In recent years, it has been increasingly suggested that the most reliable information on PAE is provided by a combination of selected biomarkers such as EtG, EtS, and FAEEs. Bakhireva et al. [5,6] found that the most common PAE biomarkers were EtS (7.8%) and ethyl oleate - EE 18:1 (6.9%). It was also found that 5.4% of meconium samples tested positive for at least two biomarkers. Table 1 presents the results of meconium analyses in previous studies in which PAE biomarkers were determined to estimate the cut-off values differentiating women who drank and did not drink alcoholic beverages during pregnancy.
According to Bakhirev et al. (Bakhirev 2011), an ideal PAE biomarker should have the following characteristics: (1) the ability to detect low to moderate alcohol consumption over a longer period of time since the last episode of alcohol consumption; (2) a high probability of detecting alcohol consumption during pregnancy (i.e., high sensitivity and detectability); and (3) a low false positive rate (i.e., it should be highly specific). In addition, the authors indicated that the ideal PAE method is one in which: (1) the biological sample is easily accessible through a minimally invasive and clinically acceptable procedure, (2) requires little or no sample preparation for testing, (3) the analytical procedure is simple and relatively inexpensive, and (4) provides rapid results, preferably at the point of care. Unfortunately, in practice, only one or two of the above attributes of PAE biomarkers are met.
The aim of the study was to compare two methods of detecting FAE during the prenatal period through: (1) retrospective questionnaire surveys concerning, among other things, alcohol consumption by women before and during prenatal periods, and (2) chromatographic analysis of newborn meconium and measurement of the concentration of 9 FAEEs, EtG, and EtS. In addition, the study aimed to determine the cut-off concentration and usefulness of PAE markers in meconium that would indicate FAE.
2. Materials and Methods
2.1. Retrospective Survey
Meconium samples were collected and cross-sectional surveys were conducted among 495 mothers who gave birth between June 16, 2019, and April 24, 2020, at the Neonatology Clinic (NC) of the University Clinical Center (UCC) of the Medical University of Gdańsk (MUG) in Gdańsk. The NC is a center with the highest level III reference status, which works closely with the Maternity Clinic (MC) of MUG and UCC, providing a full range of neonatal care for healthy and sick newborns, including those born prematurely. The NC admits, among others, newborns who are transported by a neonatal ambulance N (equipped with resuscitation equipment) as part of a three-level neonatal care system from hospitals in the Pomeranian Province. The NC provides a full range of neonatal care services, including for extremely immature newborns (premature babies), children born in severe asphyxia with congenital defects, and children with retinopathy of prematurity. The MC provides diagnosis and treatment of multiple pregnancies, diabetes in pregnancy, congenital defects, premature births, and other pregnancy complications. Obstetric and neonatal patients from lower-level hospitals in the Pomeranian Province are referred to the UCC MUG for diagnosis and treatment.
The survey (n = 495) was based on mothers’ self-assessment using an original questionnaire (supplementary materials - Table S1), in which women described their health status and any disorders occurring before and during pregnancy, as well as medications, stimulants, and dietary supplements taken during pregnancy. The study was anonymized (each questionnaire and meconium sample was assigned an individual identification number) and all participating mothers gave their written and informed consent to participate in the study. We analyzed the socio-demographic and economic characteristics of the mothers, their habits, previous obstetric history, chronic diseases, and pregnancy complications. Only single pregnancies were included in the study.
2.2. Sampling and Determination of PAE Biomarkers
Meconium samples (n = 495) were collected from children born at the NC UCC MUG within the first 24 hours after birth. Meconium was scraped off diapers with a plastic spatula as soon as possible after birth. It was then placed in plastic vials (Falcons) and frozen at −20 °C to prevent degradation of the analytes. The enrichment and isolation of analytes (FAEEs, EtG, EtS) was carried out at the Department of Analytical Chemistry (DAC) of Gdańsk University of Technology (GUT). Instrumental analyses of the obtained meconium extracts were performed at the Department of Forensic Medicine of the MUG (GC-MS analysis) and at the DAC GUT (LC-MS/MS analysis). Several meconium samples were collected in cases where mothers stated that they did not drink alcohol during pregnancy, and these were used as blank samples throughout the validation process. In addition, the chromatographic study confirmed that the collected blank samples were free of analytes and occurred in concentrations below the limits of detection (LOD). Based on the results of the survey, some of the results have already been published [12], but they concerned other areas of interest, in particular the question of whether socio-demographic, economic, and lifestyle factors, professional status, or chronic diseases contributed to preterm birth in a group of women from the Pomeranian region.
The diagnostic procedure, including validation of analytical parameters, used to determine the concentration of 9 FAEEs, EtS, and EtG in meconium samples has been described in detail in an earlier publication [13]. The most important elements of this procedure are summarized below. During the study, 9 FAEEs were determined, which included the following analytes: ethyl laurate (EE 12:0), ethyl myristate (EE 14:0), ethyl palmitate (EE 16:0), ethyl stearate (EE 18:0), ethyl oleate (EE 18:1), ethyl linoleate (EE 18:2), ethyl linolenate (EE 18:3), ethyl arachidate (EE 20:0), and ethyl arachidonate (EE 20:4). Due to the highly diverse properties of the analytes, two separate analytical procedures were prepared (after preliminary extraction) for the determination of more non-polar and lipophilic 9 FAEEs (with final determination by GC-MS) and more polar and hydrophilic EtS and EtG with final determination (LC-MS/MS).
The meconium sample was left to thaw for 1 hour at room temperature and homogenized. Then, 200 ± 5 mg of meconium was weighed, solutions of deuterated internal standards were added, and the mixture was stirred. The liquid-liquid extraction step was performed using methanol and hexane. The upper hexane layer was transferred to a solid-phase extraction (SPE) column, and FAEEs were eluted using dichloromethane. After elution from the SPE column and evaporation (in a gentle stream of nitrogen), the dry residue was dissolved in 100 μl of hexane and analyzed in a GC-MS system (FAEEs). It was noted that FAEEs easily volatilize during the evaporation to dryness step at 35 °C, so the nitrogen stream was stopped immediately after removal of the solvent to minimize losses.
Acetonitrile and methanol were added to the remaining portion of the meconium sample, and extraction was performed on SPE columns (NH2 aminopropyl-modified silica weak anion-exchange) to isolate EtG and EtS. The dry residues after evaporation were dissolved in 100 μl of mobile phase solution and transferred to autosampler vials for chromatographic analysis in an LC-MS/MS system (EtG, EtS). The LOD values for FAEEs determination by GC-MS ranged from 0.8 to 7.5 ng/g, while the LOD for EtS and EtG by LC-MS/MS were 0.2 ng/g and 0.8 ng/g, respectively. The LOQ values for FAEEs ranged from 5 to 25 ng/g, and for EtS and EtG they were 1 ng/g and 2.5 ng/g, respectively. Precision values ranged from 3.5 to 9.7% and recovery values ranged from 89.1 to 109%.
2.3. Statistical Analysis of Results
Basic statistical analysis of the survey results and PAE biomarkers (in particular, calculation of the mean, median, standard deviation, two-parameter and box plots) was performed using Microsoft Excel 365, while statistical analysis with correlation estimation between multiple variables was performed using the R language R Core Team [14] , RStudio Posit team [15], and R packages such as tidyverse [16].
3. Results
The results of all surveys conducted among pregnant women at the NC of the MUG are summarized in the supplementary materials in Tables S2-S8. The results of all GC-MS-SIM and LC-ESI-MS/MS chemical analyses of infant meconium collected on the first day after birth at the NC of the MUG are summarized in the supplementary materials in mass concentration units µg/g (Table S9) and in molar concentration units nmol/g (Table S10).
In order to compare the results of retrospective surveys and PAE biomarkers concentrations in meconium, the number of compared results was reduced from 495 to 478 due to incomplete responses in some surveys and insufficient biological material from meconium. The surveys were conducted among pregnant women aged 14 to 45 (median age 31, mean age 31).
3.1. Results of Retrospective Survey
Table S11 in the supplementary materials summarizes the survey results, indicating the number and percentage share of individual responses. Questions related to alcohol consumption were deliberately incorporated into questions from other areas of social life in order to distract the attention of the women participating in the study.
Figure 1 shows women’s responses to question 13 concerning information provided by doctors during pregnancy. Figure 2 shows women’s responses to question 14 concerning the daily dose of alcohol that they consider safe for pregnant women.
A comparison of women’s responses to questions 20 and 21, i.e., on the frequency of alcohol consumption before and during pregnancy, is shown in Figure 3. Fifteen women admitted to consuming alcohol once a month or less during pregnancy, and five women admitted to consuming alcohol 2 to 4 times a month. A total of 20 women (4.2%) consumed alcohol during pregnancy. Before becoming pregnant, 389 women admitted to consuming alcohol with varying frequency (87.4%).
Women were also asked questions about: the type of alcoholic beverage consumed during pregnancy (Figure 4), the time (trimester) of alcohol consumption during this period (Figure 5), and the largest amount of alcohol they drank at one time during pregnancy (Figure 6).
Figure 7 shows a summary of mothers’ responses (represented by personal identification numbers) confirming PAE in three different questionnaire questions numbered 21 (n=21), 22 (n=19), 23 (n=19), and 24 (n=16).
3.2. Results of PAE Biomarkers Determination
Based on the results of chemical tests for mass concentrations (Tables S9 and S10), a statistical summary of the concentrations of FAEEs, EtS, and EtG biomarkers in children’s meconium was compiled (Table 2), with the concentrations of PAE markers in meconium (Cmax, Cmin, SD, Caverage, Cmedian) were compiled for results above the limits of quantification (LOQ), where LOQ = 3 * LOD was assumed (LOD values were determined and described in Woźniak et al. [13].
In order to check the correlation between PAE biomarker concentrations in meconium, all results were compiled in pairs: EtS versus total FAEEs (Figure 8), EtG versus total FAEEs (Figure 9) and EtS versus EtG (Figure 10), taking into account the mothers’ declarations of alcohol consumption during pregnancy. Illustrative cut-off lines were added to each of the above graphs, which were initially intended to differentiate between alcohol consumption and abstinence in women during pregnancy:
Figure 8.
Summary of EtS concentrations relative to total FAEEs (a) for alcohol consumption declared in the survey (at least one positive response to questions 21, 22, or 23) during pregnancy (×) and declared abstinence during pregnancy (○). In figure ‘b’, the results of declared abstinence during pregnancy have been removed and sample numbers have been added.
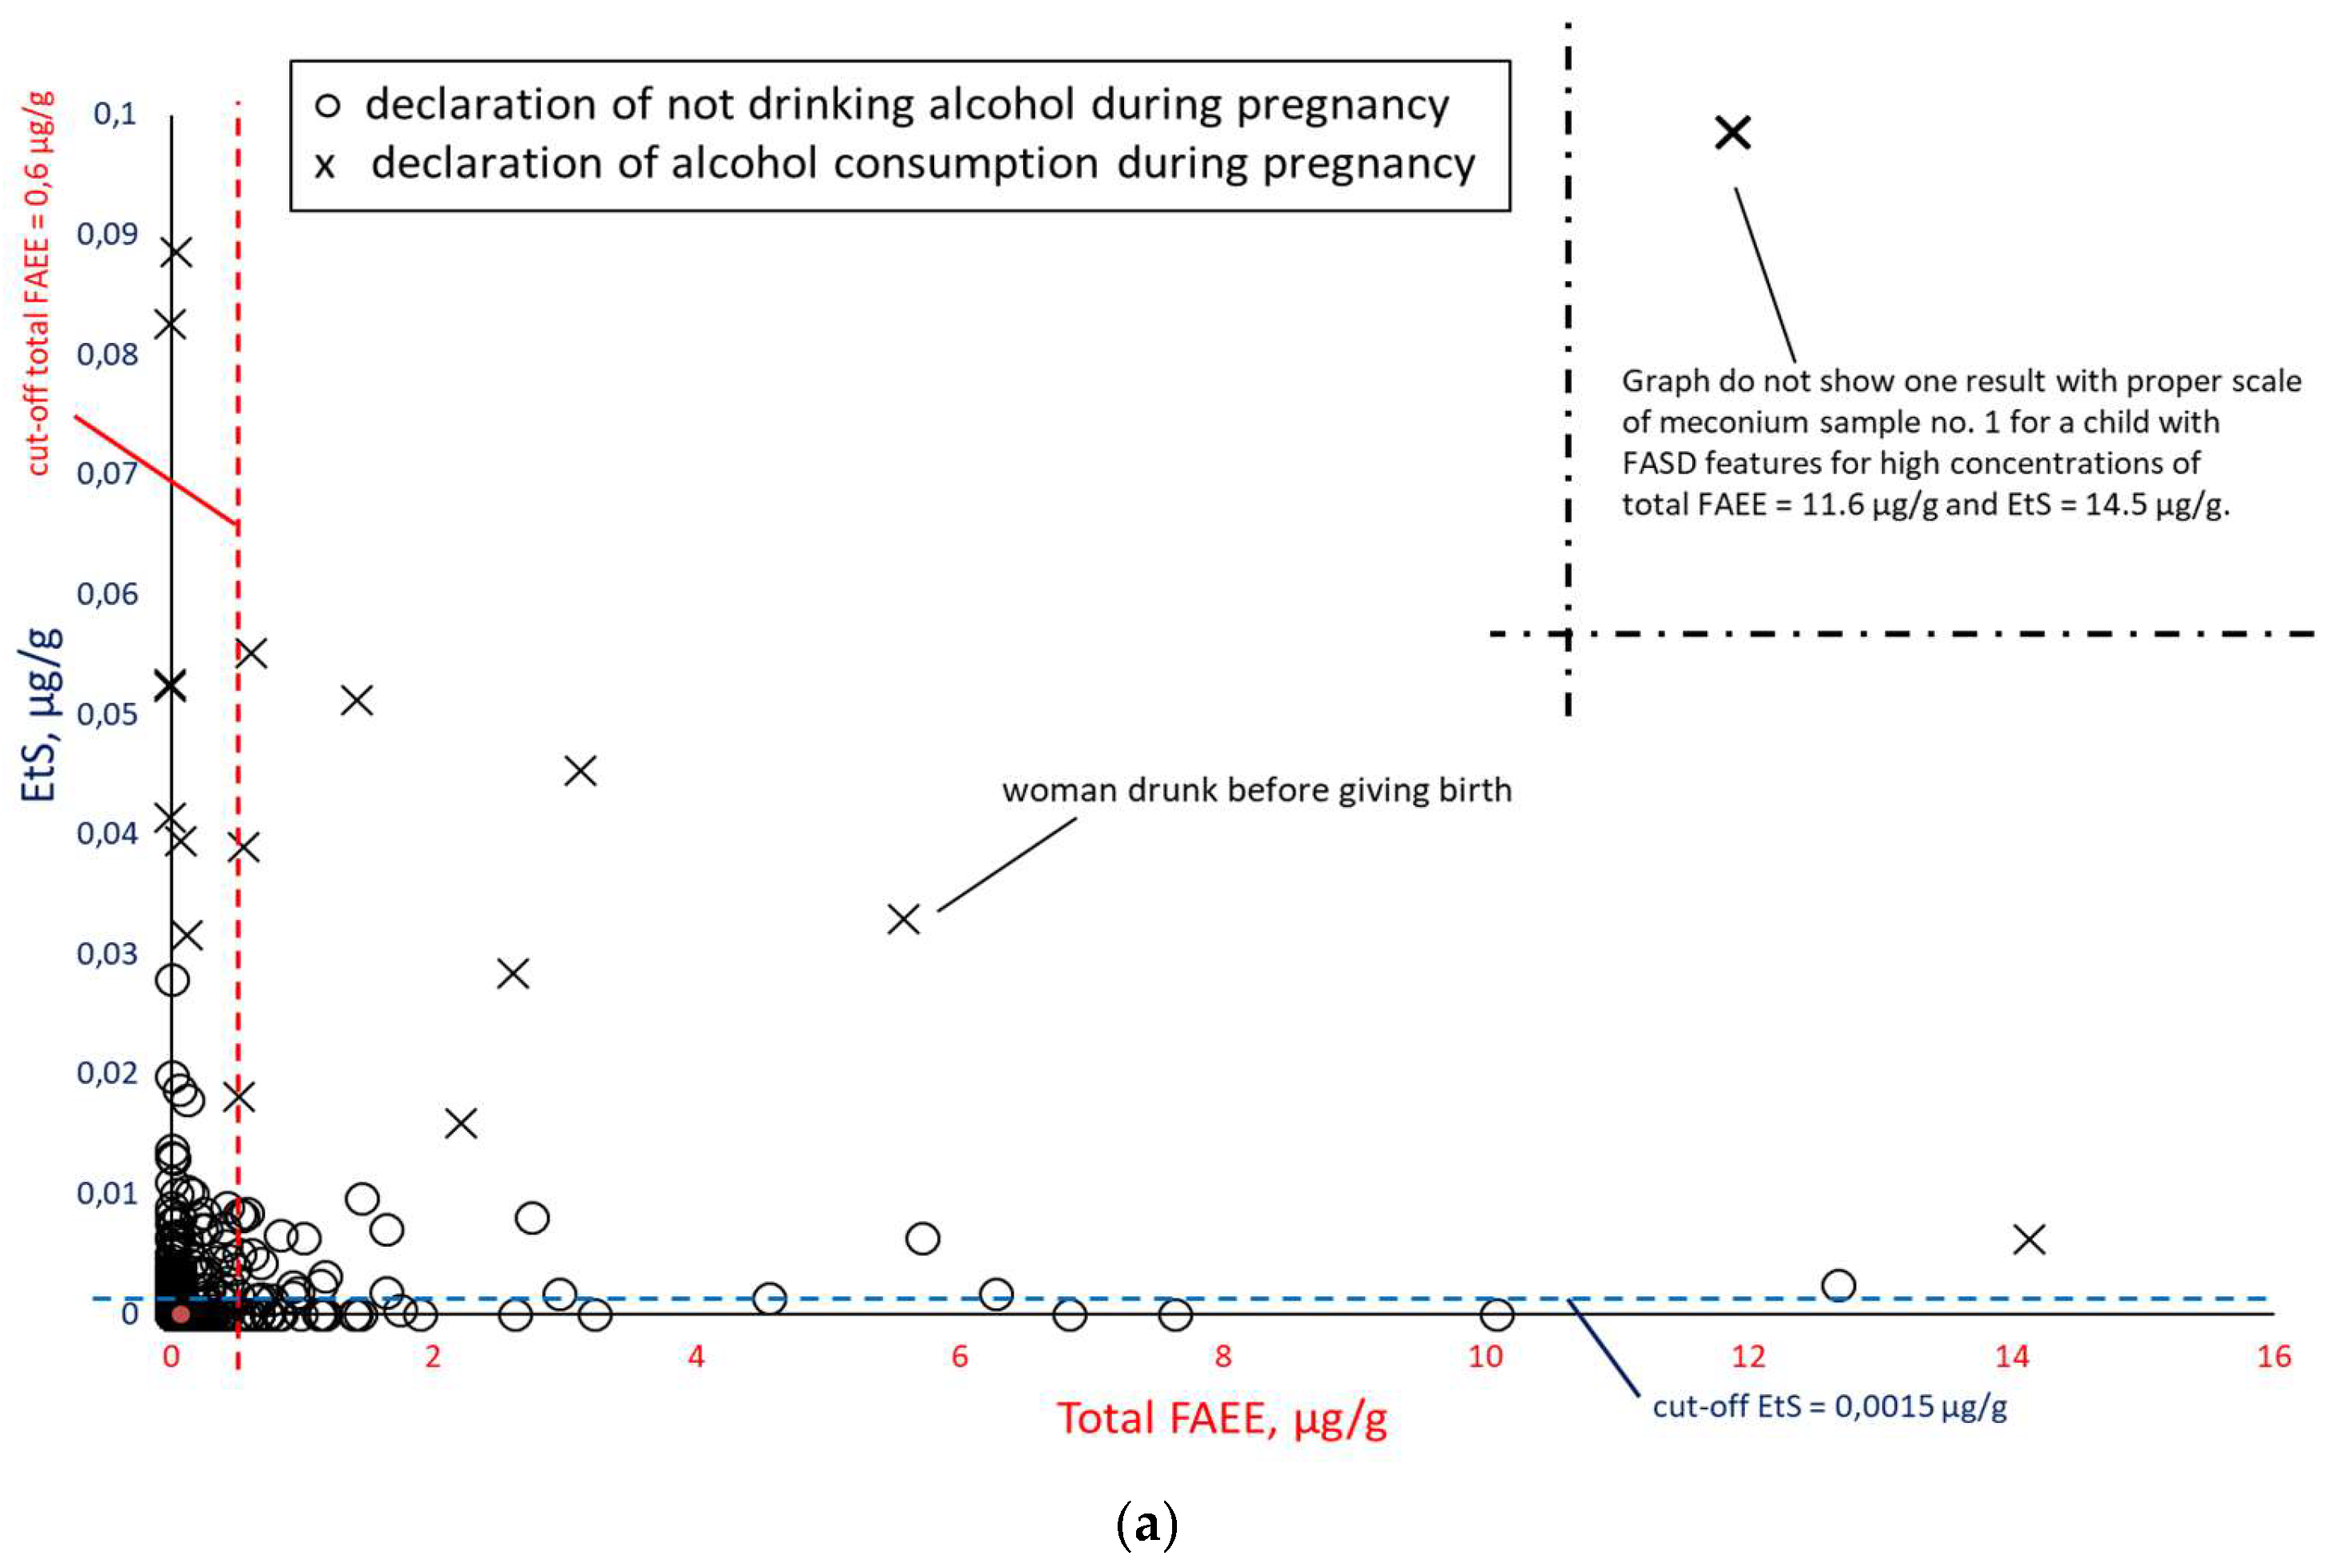
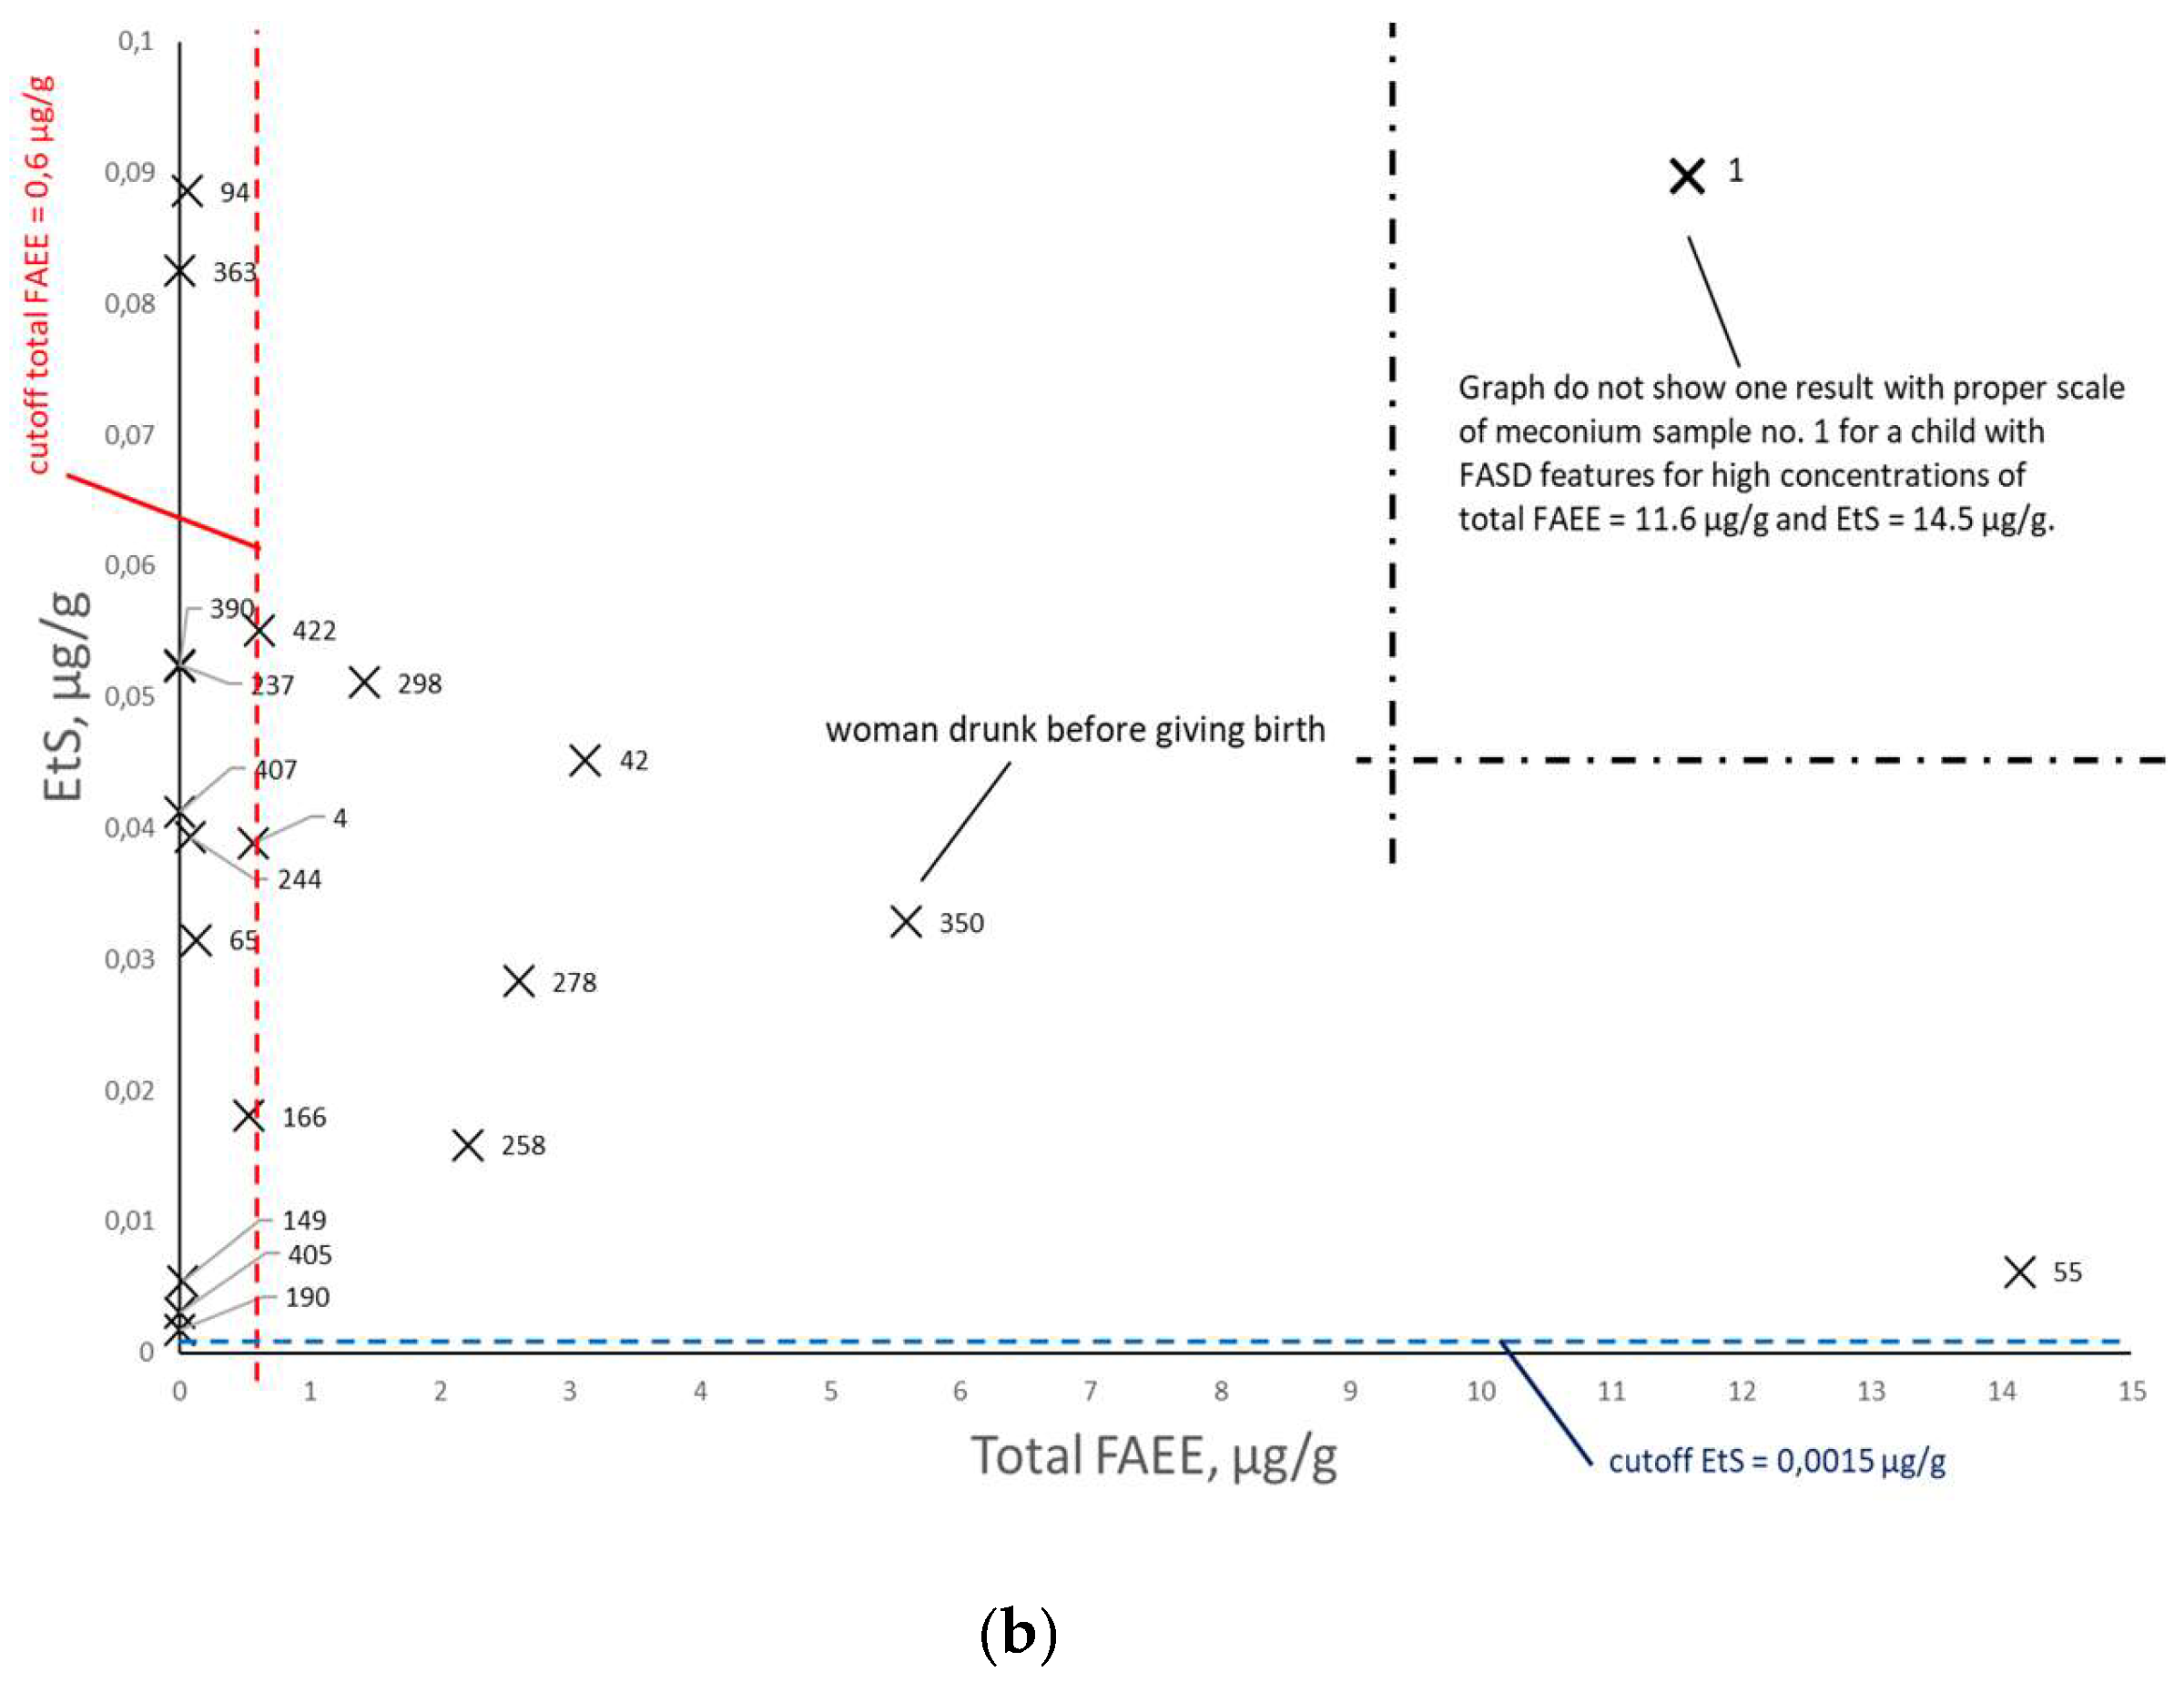
Figure 9.
Summary of EtG concentrations relative to total FAEEs (a) for alcohol consumption declared in surveys (at least one positive response to questions 21, 22, or 23) during pregnancy (×) and declared abstinence during pregnancy (○). In figure ‘b’, the results of declared abstinence during pregnancy have been removed and sample numbers have been added.
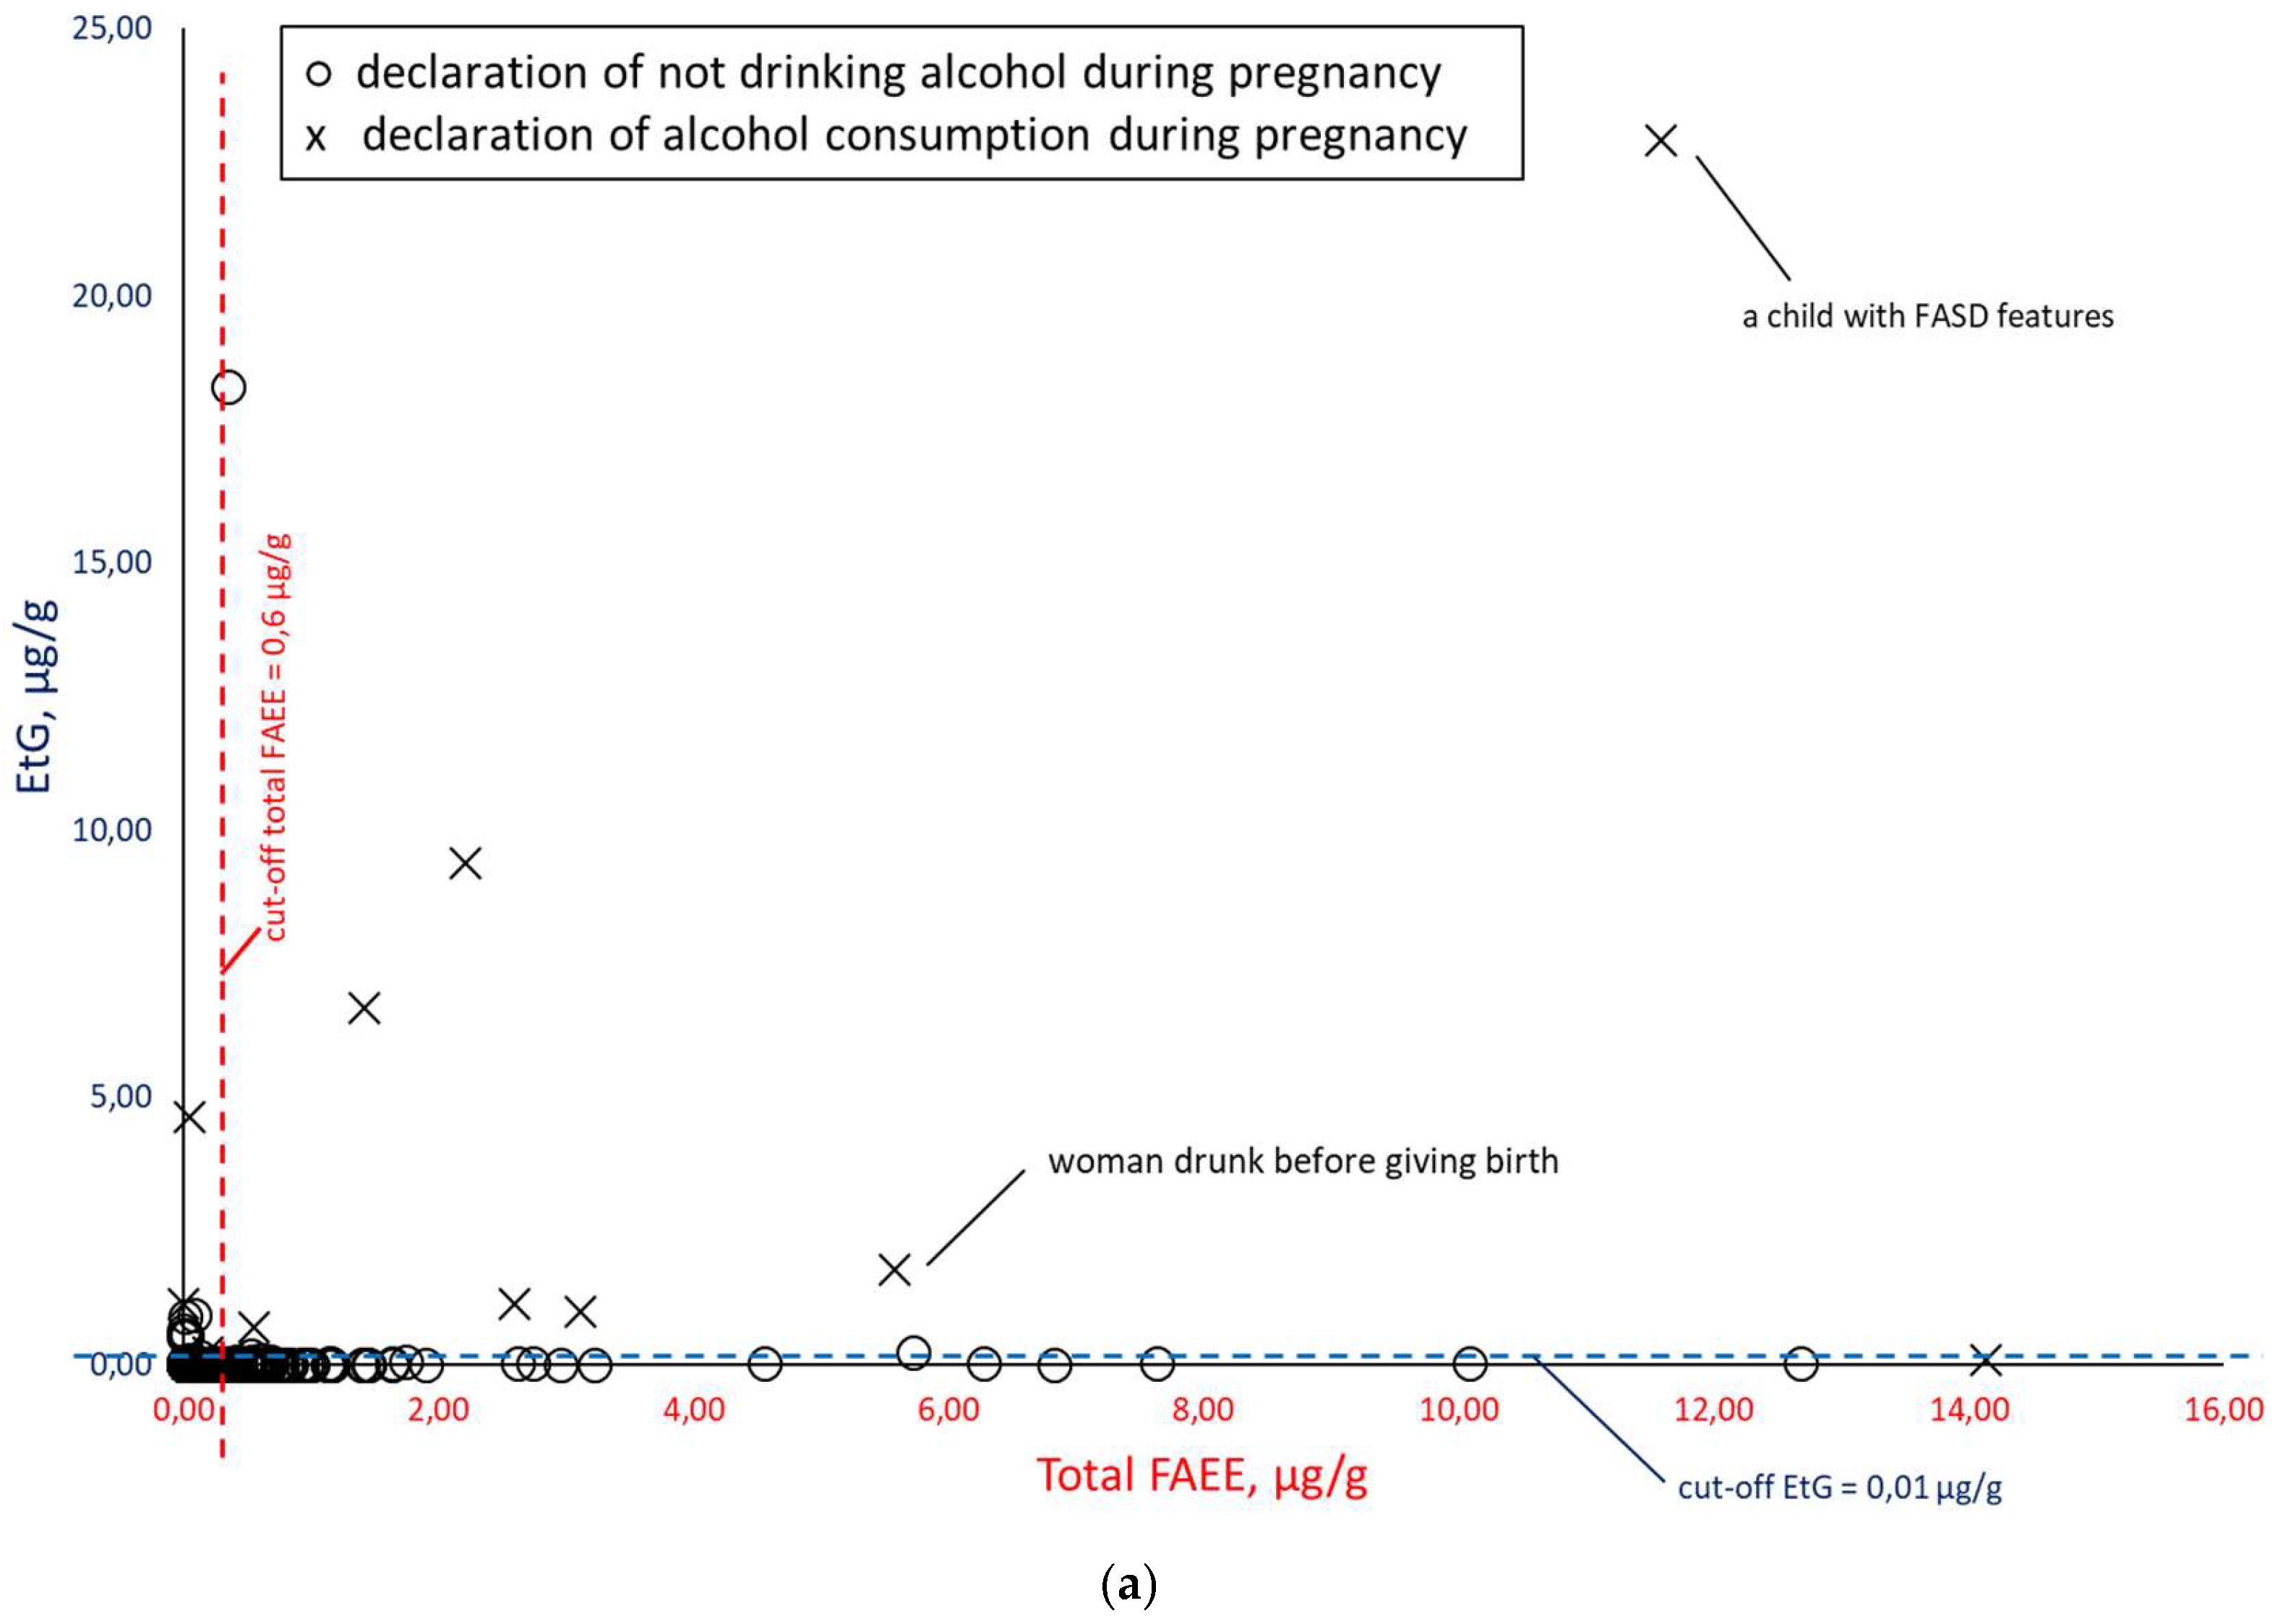
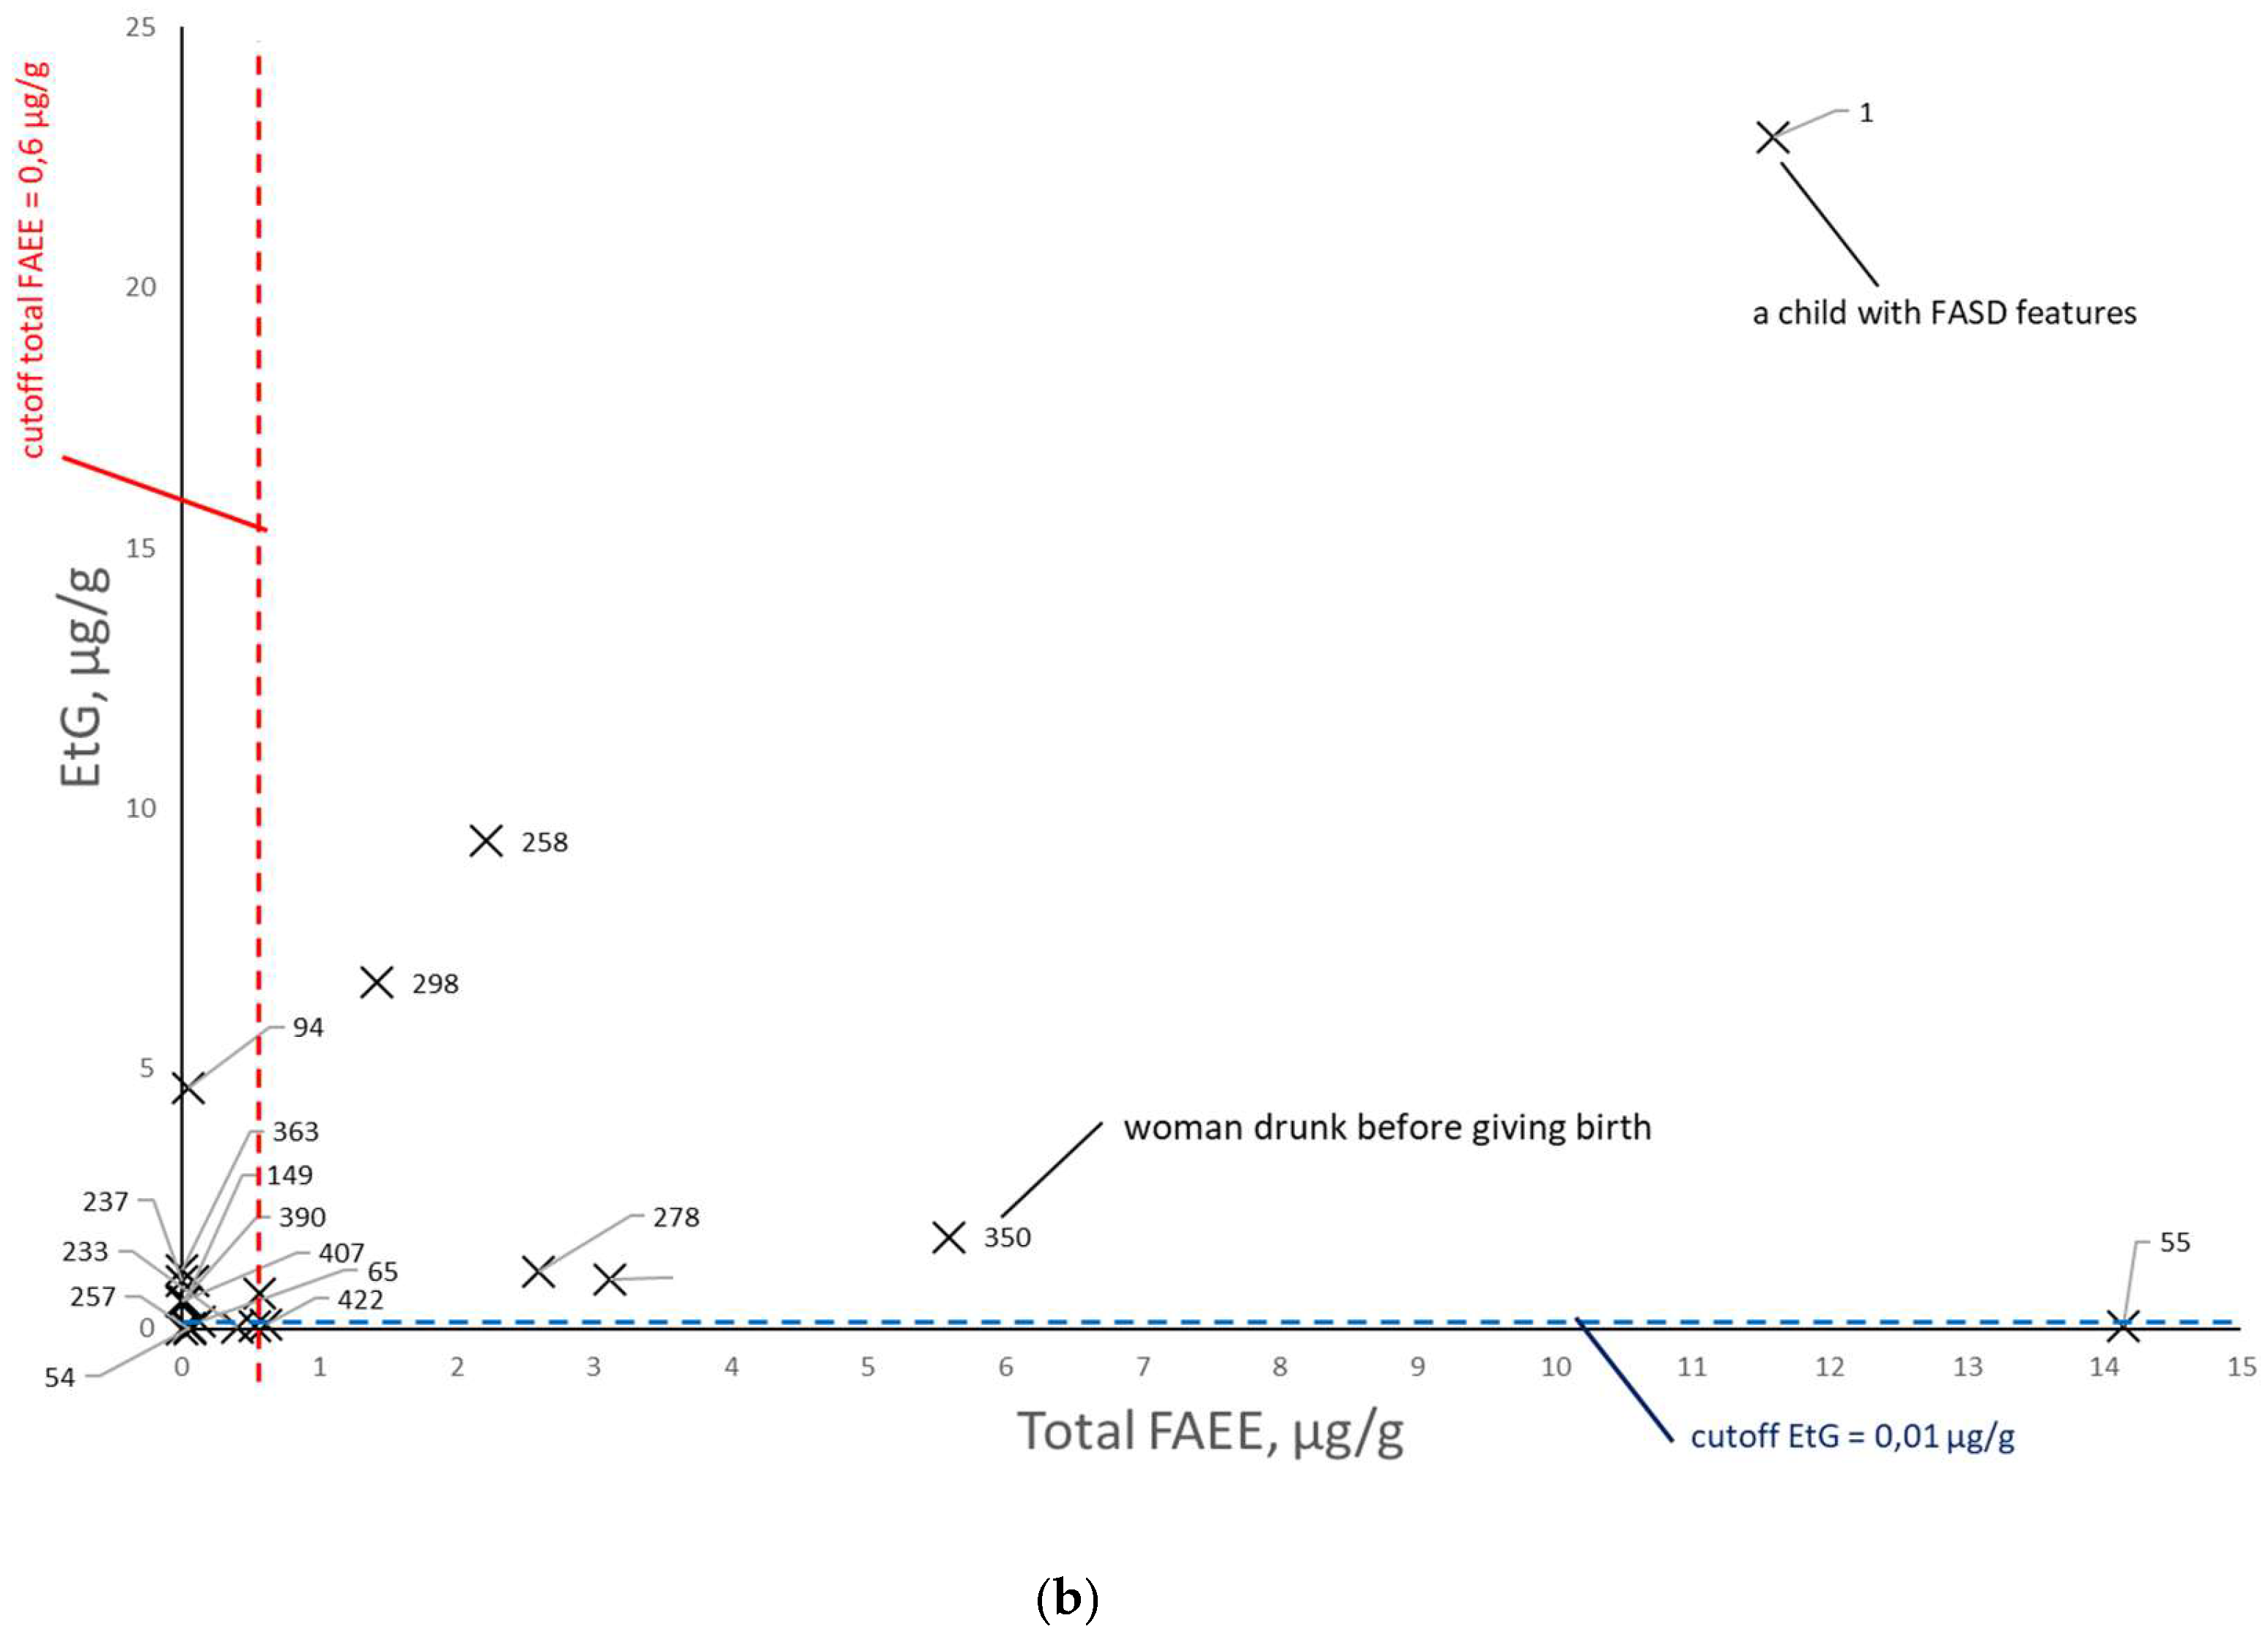
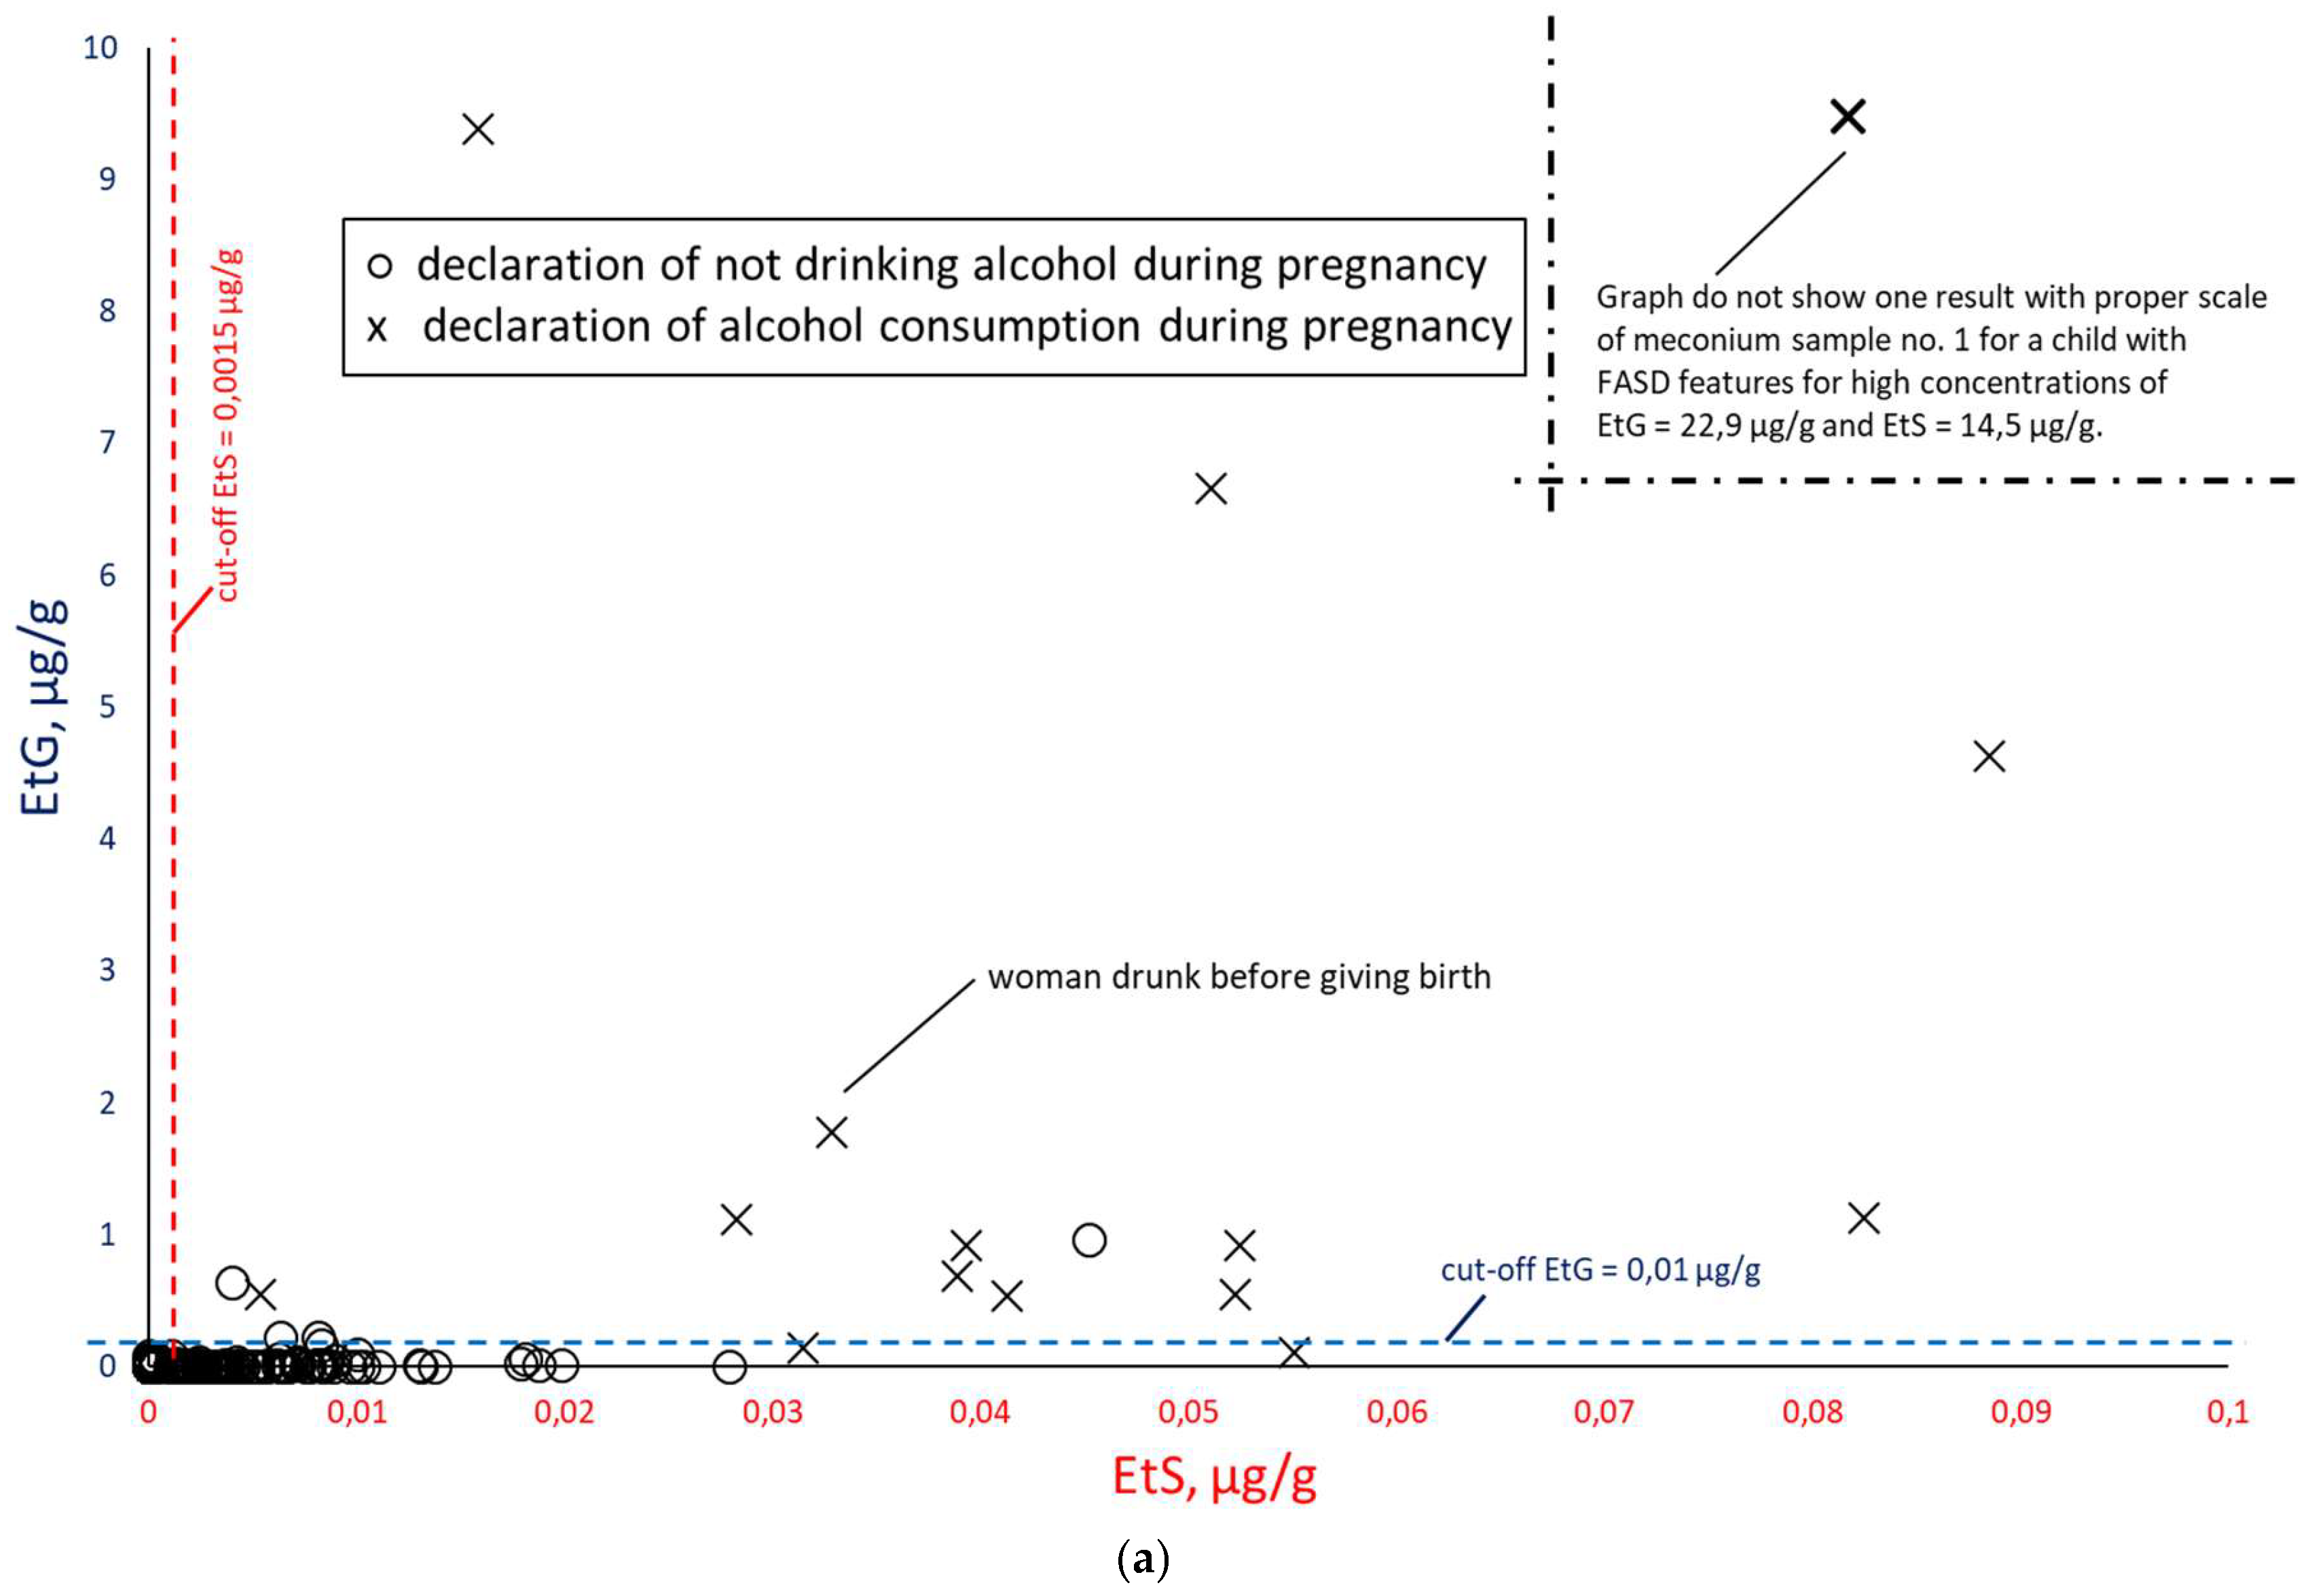
Figure 10.
Comparison of EtS and EtG concentrations (a) for alcohol consumption declared in the survey (at least one positive answer to questions 21, 22, or 23) during pregnancy (×) and declared abstinence during pregnancy (○). In figure ‘b’, the results of declared abstinence during pregnancy have been removed and sample numbers have been added.
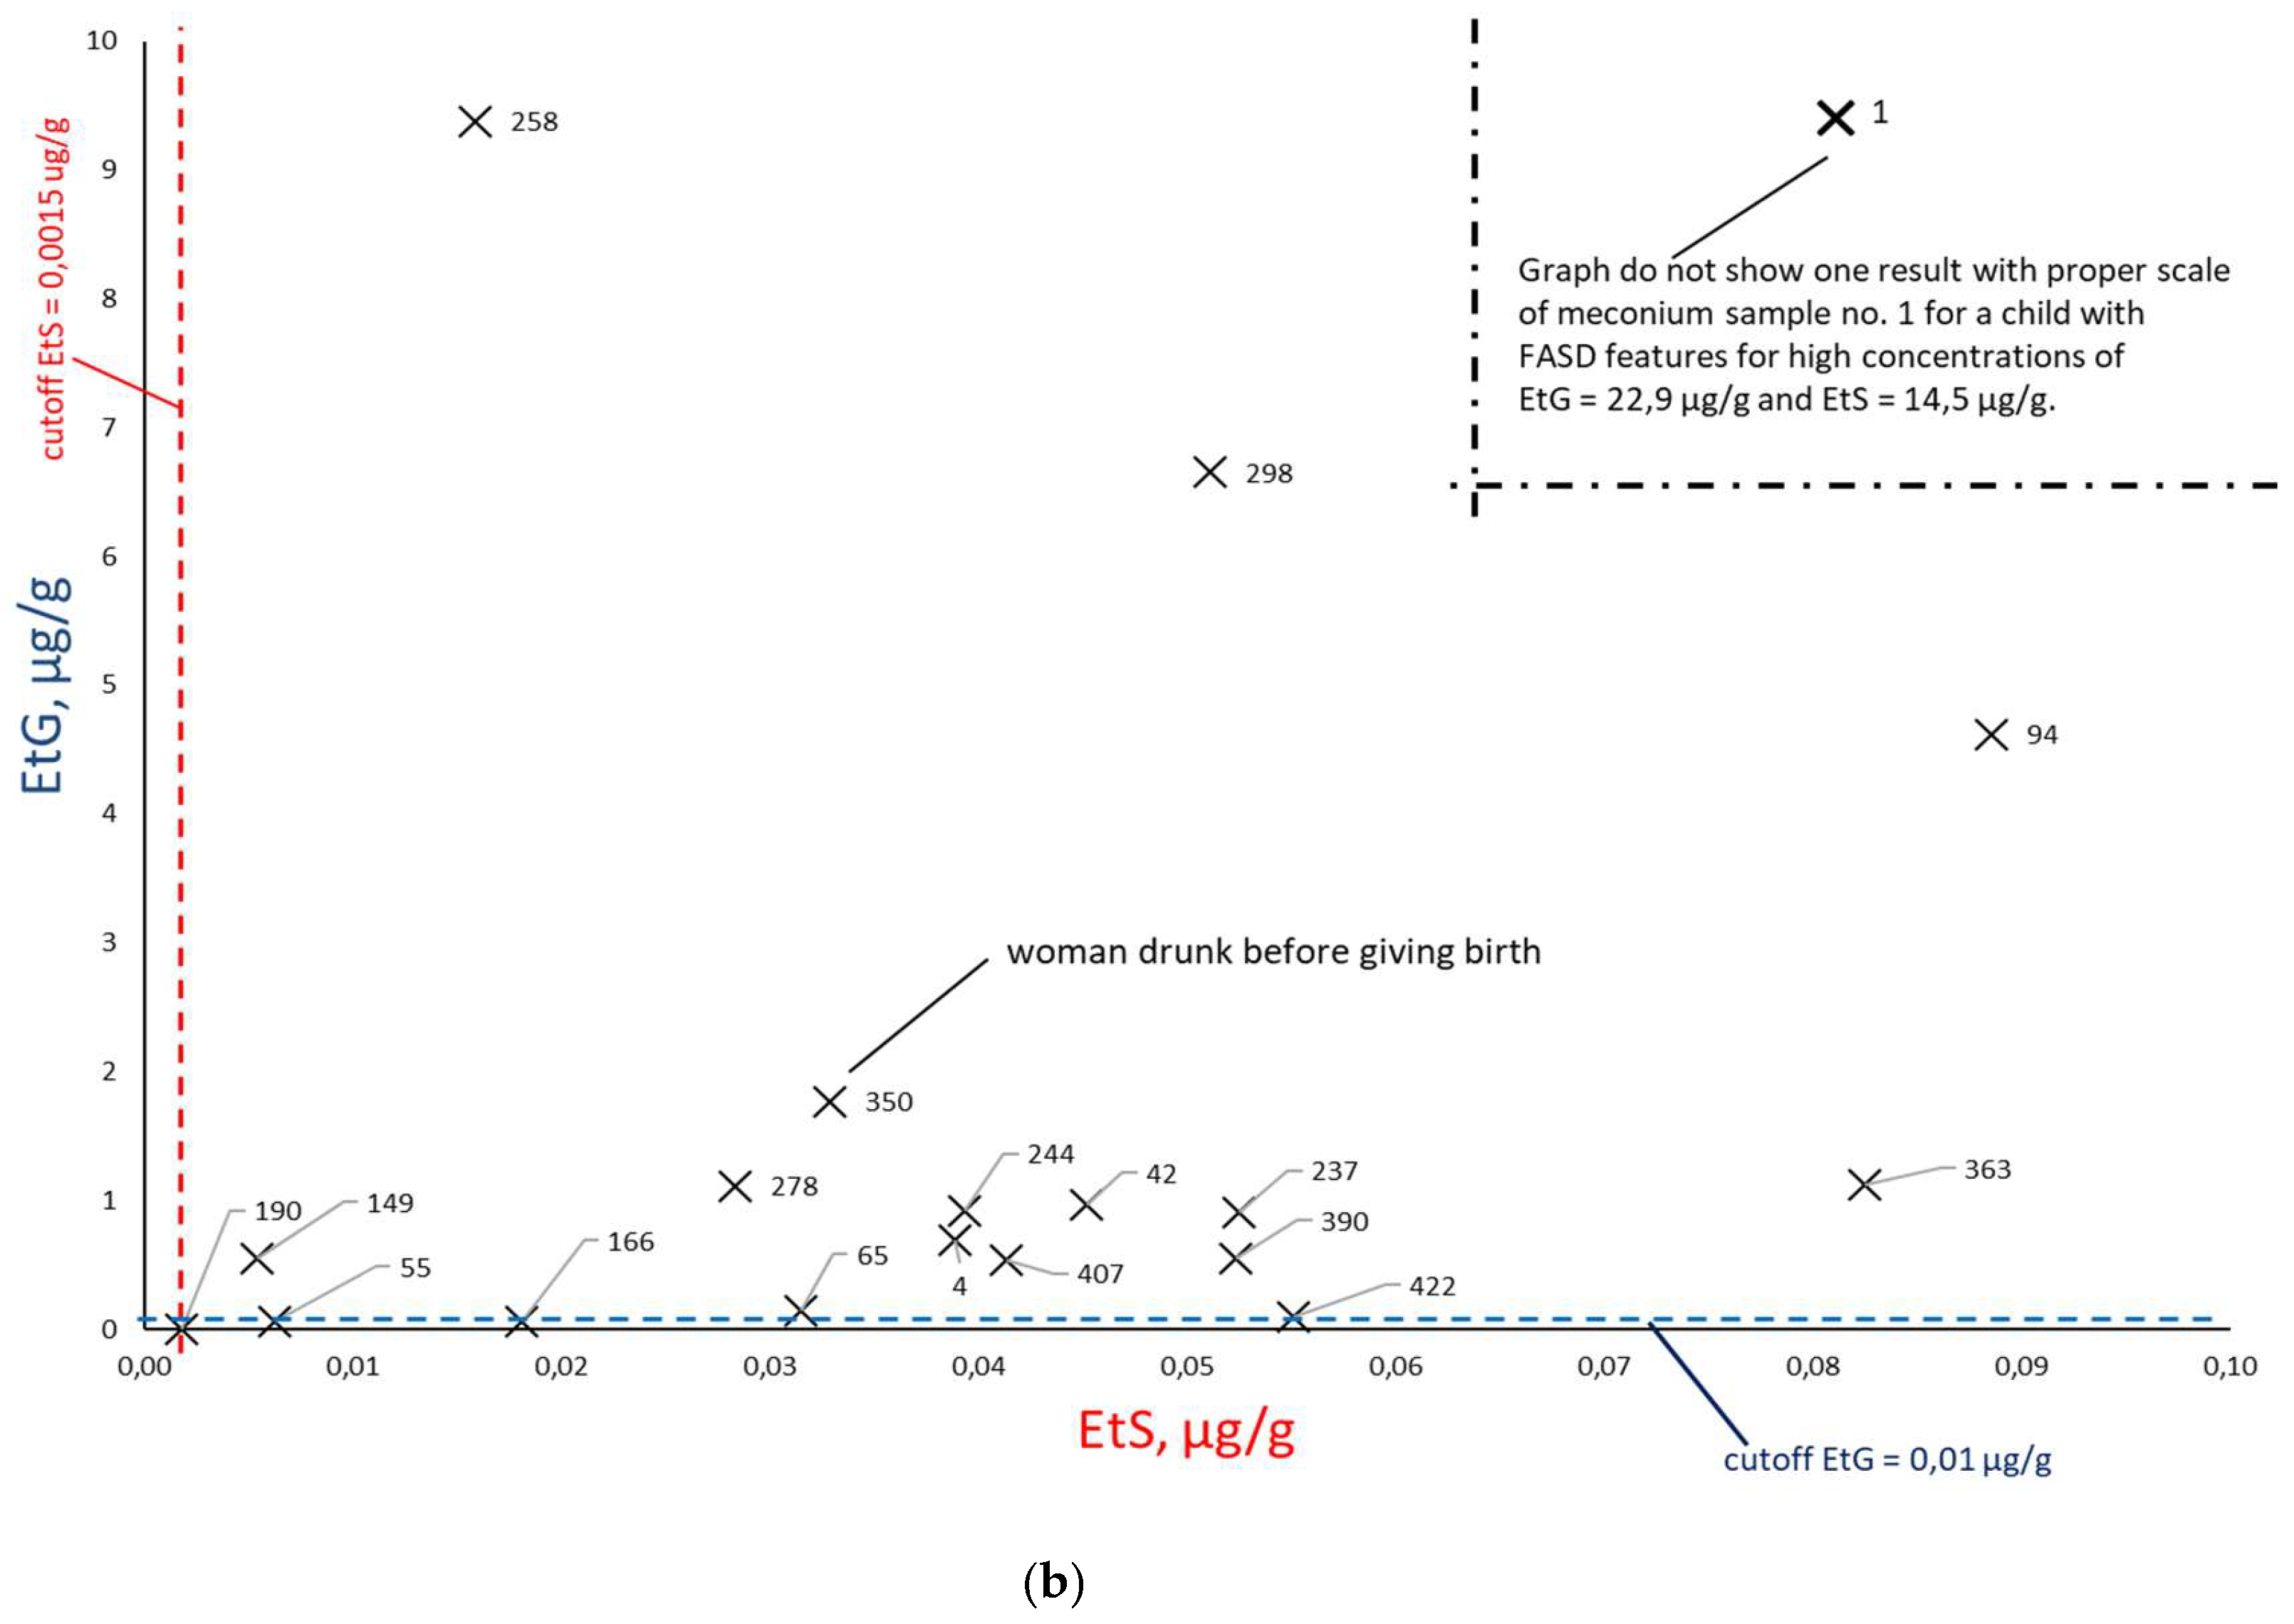
3.3. Comparison of Retrospective Survey and PAE Biomarkers Results
Taking into account the results of the survey for questions 21-24 presented in Figure 7, they were compiled together in Table 3 with the results of chemical tests for PAE biomarkers and their concentrations.
The results of chemical analyses for all PAE biomarkers were compared with the results of question 21 on the frequency of alcohol consumption (Figure 11, Figure 12 and Figure 13). In the box plots in Figure 11, Figure 12 and Figure 13, the center line inside the box represents the median, the lower edge of the box is the first quartile (Q1, 25th percentile), and the upper edge of the box is the third quartile (Q3, 75th percentile).
3.4. Multiparameter Analysis of Results
3.4.1. EFA Analysis
Unfortunately, the research results did not include a natural dependent variable. It was not possible to collect objective and measurable information that a given person consumed alcohol during pregnancy (with the exception of women described as no. 1 and no. 360). The data identified two questionnaire-type variables related to alcohol consumption during pregnancy, including question no. 21. An attempt was made to select from the ‘physiological variables’ (PV) criteria to determine whether a given measurement level of PAE biomarker concentrations indicates a high probability of alcohol consumption by women during pregnancy. The measurement of meconium PAE biomarker concentrations was represented by 12 PV: EtS, EtG, total FAEEs, EE 12:0, EE 14:0, EE 16:0, EE 18:0, EE 18:1, EE 18:2, EE 18:3, EE 20:0, EE 20:4, including one being a linear combination of 9 of them (total FAEEs), so 11 unique variables were actually identified. Preliminary PV analysis at this stage was divided into two parts:
- analysis of mutual correlations between PVs to assess their linear relationships;
- exploratory factor analysis (EFA) to identify potential latent variables among PVs.
The dataset contained 478 rows in the database with survey results and chemical concentrations of PAE biomarkers (see ‘Retrospective survey’ and ‘Sampling and determination of PAE biomarkers’). In the PV, missing data were replaced with a value of zero, corresponding to the absence of a given substance (below the detection limit LOD of the PAE biomarker). Due to the high skewness of the variable distributions, Spearman’s correlation coefficient was used for the calculations. (Correlations of PV variables in the form of marked PAE biomarkers with p-values indicating statistical significance are presented in Table S5). The next step was to attempt to identify latent factors from 11 PVs (excluding the total FAEEs variable). Spearman’s correlation was again used for the calculations. The purpose of the EFA analysis was to determine the number of latent factors expected in the PV data, as indicated by generally accepted criteria. Despite the insufficient fit of the EFA model (TLI < 0.09 and RMSEA > 0.10), it was shown that one of the significant PV factors are the variables EtS, EtG, and EE 20:0. The EFA analysis confirms the poor fit of the model to the data, but also indicates a clearer division of variables across the range of substances determined: the loadings for the EtS and EtG variables are significantly lower than for the other variables in the model. The EFA analysis did not reveal the existence of reliable variables underlying PV.
3.4.2. Cluster Analysis
The next step in the analysis was an attempt to identify the dependent variable by revealing potential clusters of results in the PV variables. The approach used the clustering method for the same data on which the EFA analysis was performed (data with at least one non-zero observation, 11 PV variables, without the FAEEs_total variable). In the first stage, the number of potential clusters was examined. Euclidean metrics were used in the calculations.
The analysis in the 2-cluster model was performed with a maximum number of iterations equal to 100 and 50 different random initial conditions. The resulting clustering did not meet the basic criterion for considering the result reliable (it is generally accepted that each cluster should contain at least 10% of the sample). Apart from this fact, the results obtained indicate in particular two variables that differentiate the results for two meconium samples with EE 18:1 and EE 20:4. In the 3-cluster model, an additional cluster indicated 3 meconium samples with the highest PV variable scores. However, the frequencies of individuals assigned to clusters still did not allow this model to be considered to meet the required criteria for a good fit. In the 4-cluster model, an additional cluster indicated another 6 individuals with relatively high PV scores. As in the case of 3 clusters, here too we did not obtain a sufficient number of cases in the selected clusters, and therefore the model did not meet the necessary conditions for a good fit. Cluster analyses were also performed on standardized data and a similar result was obtained. Neither variable grouping (EFA) nor observation grouping (clustering) allowed us to identify a dependent variable for further analysis.
3.4.3. Analysis Based on the Dependent Variable
The main challenge of the analysis was the lack of a clear concentration cut-off point for PV, which would allow us to conclude with a high degree of certainty that a woman consumed alcohol during pregnancy. Therefore, a method was used that allowed for the creation of a dependent variable depending on the adopted parameter. For the first version of the analysis, the following assumptions were made: the base variable for the variable named “Exposure” will be the EtS variable, and the cut-off point above which we will consider that there is a high probability that the woman was exposed to alcohol during pregnancy will be the level of the first quartile of non-zero values of the EtS variable. For these assumptions, the calculated threshold for the EtS variable was 0.0013 µg/g, and n=135 people exceeding this threshold were recorded in the entire data set. In the above model, the relationship between the “Exposure” variable and the age of the subjects was tested using logistic regression. This relationship was found to be borderline statistically significant at a significance level of 0.05 (p-value = 0.0343). The regression coefficient was negative, which in the case of logistic regression should be interpreted as meaning that with increasing age, the chance that a woman will be exposed decreases.
The data was reanalyzed assuming the correctness of the dependent variable ‘Exposure’, with a questionnaire variable where the women surveyed answered question 21 (‘How often did you consume alcoholic beverages while pregnant?’). Assuming that those who admitted to drinking alcohol in this variable certainly did so, a new variable, ‘Drinking during pregnancy’ was created and compared with the ‘Exposure’ variable and PV. Due to the small number of non-trivial responses, a new dichotomous variable was constructed for further analysis – ‘no consumption’ and ‘consumption’ (n=20) of alcohol during pregnancy. Fisher’s test indicated a significant relationship between the two variables ‘Exposure’ and ‘alcohol consumption’. However, this relationship is not of great practical significance: the statistical significance of the relationship results rather from the size of the sample than from the size of the effect studied, as indicated by the cross-tabulation of the frequencies of both variables (Table 4):
Data with the accepted exposure assessment cut-off indicate that 20% of individuals who declared that they consumed alcohol were not included in the chemical exposure test (EtS), which called into question the effectiveness of differentiation based on the EtS cut-off concentration (exposure) or declarations of alcohol consumption.
In view of the above, and recognizing that FAEEs correlate poorly with responses about declared alcohol consumption during pregnancy, a Cumulative Biomarker Index for two biomarkers (CBI2) as a multiple of exceeding the thresholds (cut-off for EtS = 0.0015 µg/g and cut-off for EtG = 0.01 µg/g) given in the literature [6,7] according to the following formula (1):
where
CEtS – EtS concentration in µg/g meconium;
CEtG – EtG concentration in µg/g meconium.
For concentrations of both biomarkers at the EtS = 0.0015 µg/g limit and the EtG = 0.01 µg/g cut-off, the proposed CBI2 value is 1, but the concentrations of both biomarkers may differ. For the CIB2 index, an expert cut-off point of 5 was determined (CBI2_5), which means that the cut-off concentrations CEtS=0.0075 µg/g and CEtG=0.05 µg/g were adopted (assuming an equal share in the concentrations of both biomarkers). The variables thus created were intended to indicate whether a woman was exposed to alcohol during pregnancy.
By taking the CBI2_5 variable as the dependent variable, we were able to compare it with the other variables in the study. We then analyzed the relationship between the CBI2_5 variable and the variables and responses indicated in the questionnaires. In some cases, due to the lack of similarity of the distributions to normal, the Mann-Whitney U test was used. The tests indicated a statistical relationship between the variables in the case of:
- answers to question 14. ‘In your opinion, what is the daily and safe amount of alcohol consumption for women during pregnancy?’
- answers to the question ‘Do you smoke/did you smoke cigarettes?’
- answers to the question ‘How often did you drink any alcoholic beverages before pregnancy?’
- answers to question 21 ‘How often did you consume alcoholic beverages while pregnant?’
- answers to question 22 ‘What type of alcoholic beverage did you drink during pregnancy?’ (you can select several answers): a) wine, b) beer’ (strong alcohol was removed from the analysis due to lack of variance);
- answers to question no. 23 ‘When during your pregnancy did you consume alcohol? (you can select several answers): a) 1st trimester, b) 2nd trimester, c) 3rd trimester’
- answers to question no. 24 ‘What was the maximum amount of alcohol you consumed at one time during your pregnancy?’
- answers to question no. 26 ‘Where did you get information about toxic factors affecting the fetus? (you can select several answers) – antenatal classes’
- answers to the question ‘What is your level of education?’
When the absence of a response (n/a) was replaced with a negative response, the result was similar to the one above. Table 5 shows the calculated CBI2 score together with positive responses to questions no. 21, 23, and 24 concerning alcohol consumption during pregnancy.
The above analyses of the relationships between the CBI2_5 variable and the study variables show that only the small number of variables have significant relationships with CBI2_5. Despite demonstrating significant correlations between these variables and the CBI2_5 variable, a broader analysis was conducted based on a logistic regression model with Firth’s correction for the analysis of rare events (taking into account the frequencies of the CBI2_5 variable categories). Since most of the variables in the model proved to be insignificant, it was decided to use the backward model reduction method. One variable at a time was removed from the model, which was assessed as the most burdensome for the model, and the p-value was adopted as the selection criterion.
4. Discussion
Comparing the results of total FAEEs and EtS concentrations in meconium in Figure 8a. broken down by declaration of alcohol consumption during pregnancy (at least one positive answer to questions 21, 22, or 23) and declaration of abstinence, it can be seen that the proposed cut-off values for total FAEEs and EtS are too low. Assuming the accuracy of PAE declarations (positive response to any of questions 21, 22, and 23), the cut-off concentration should be increased at least fivefold to a cut-off level of EtS = 0.0075 µg/g in order to better differentiate between positive and negative cases related to PAE. In the case of total FAEEs, there are a large number of positive and negative results, and increasing the total FAEEs cut-off concentration would not have the desired effect. After rejecting the results with declared abstinence, Figure 8b shows that greater consistency between the declarations and the chemical analysis results of meconium was achieved for EtS than for total FAEEs.
Comparing the results of total FAEEs and EtG concentrations in meconium in Figure 9a. broken down by declaration of alcohol consumption during pregnancy (at least one positive answer to questions 21, 22, or 23) and declaration of abstinence, it can be seen that the proposed cut-off values for total FAEEs and EtG are also too low. As in the case of EtS, after rejecting the results with declared abstinence in Figure 9b, it can be seen that greater consistency between the declarations and the chemical analysis results of the meconium was obtained for EtG than for total FAEEs. Increasing the cut-off concentration at least fivefold to a cut-off level of EtG = 0.05 µg/g better differentiates between positive and negative cases associated with PAE.
When comparing the results of EtS and EtG determination in Figure 10a, a greater concentration of results around the concentration point EtS = 0 µg/g and EtG = 0 µg/g is visible, which indicates a better correlation with PAE of these two biomarkers in relation to total FAEEs. After rejecting the results with declared abstinence, Figure 10b shows that EtS and EtG best reflect PAE. In Figure 10b, very low EtG concentrations (and elevated EtS) were obtained for meconium samples associated with women who declared alcohol consumption only in the first trimester of pregnancy (meconium samples numbered 55, 65, 190, 422) or in the case of the woman associated with sample no. 166, who stated that she never drank alcohol during pregnancy, but elsewhere the same woman stated that she consumed beer in the third trimester of pregnancy. At the same time, in her child’s meconium samples, we found concentrations of both EtS and EtG above the proposed cut-off point.
A summary of all survey responses (Table 3) in which women (in at least one of the three questions 21-24) indicated alcohol consumption during pregnancy is characterized by inconsistency in responses. The most surprising are the responses of four women (nos. 16, 54, 166, 405), who answered question no. 21 that they did not consume alcohol during pregnancy, and then in subsequent questions indicated consumption of wine, beer, vodka, or alcohol in the first or third trimester of pregnancy. Taking into account the survey results and answers to questions 21-24 separately, the following number of women admitted to drinking alcohol during pregnancy: n=20 (positive answer to question no. 21), n=19 (positive answer to question 22), n=19 (positive answer to question 23) and n=16 (positive answer to question 24). As shown in Figure 4, more than one answer could be given to question 22, and woman no. 54 declared that she had consumed all three alcoholic beverages (answers a, b, c), while women no. 186 and 237 declared that they had consumed beer and wine (answers a, b) . Similarly, in the case of answers to question 23, there were more answers than the number of women who answered them, with women no. 42 and 363 declaring that they consumed alcoholic beverages in all trimesters (answers a, b, c), and women nos. 4 and 244 declared that they consumed alcohol in the 2nd and 3rd trimesters (answers b, c).
Summarizing the positive results of four questions 21-24 presented in Figure 7, it can be concluded that only 12 women were most consistent in their answers (the common part of four sets of answers to questions 21-24 related to PAE, i.e., 4, 42, 94, 186, 237, 244, 278, 298, 363, 390, 407, 422). The remaining positive responses related to PAE were consistent for three, two, and sometimes only one survey question. Thus, if at least one positive response in questions 21-24 is assumed to be true, then a maximum of 24 women consumed alcohol during pregnancy.
The summary of survey results with positive responses to question 21 in conjunction with the total FAEEs concentration results in the box-plot (Figure 11) do not correlate with the predicted concentration increase trend. For those who declared that they did not consume alcohol during pregnancy, the median total FAEEs was 0.14 µg/g and the interquartile range (IQR) was 0.03-0.40 µg/g. For those who declared alcohol consumption of 1 per month or less, the median was 0.62 µg/ml and the IQR was 0.13-2.60, while for those who declared consumption of 2 to 4 times per month, the median was 0.02 µg/g and the IRQ was 0.00-0.05 µg/g.
A similar comparison of survey responses with a positive answer to question 21 in relation to EtS concentration results (Figure 12) shows a clear upward trend, and the IQR range overlaps to a lesser extent than for total FAEEs. For those who declared that they did not consume alcohol during pregnancy, the median EtS was 0.002 µg/g and the interquartile range (IQR) was 0.001-0.006 µg/g. For those who declared alcohol consumption of 1 per month or less, the median was 0.035 µg/ml and the IQR was 0.009-0.050, while for those who declared consumption of 2 to 4 times per month, the median EtS was 0.053 µg/g and the IQR was 0.023-0. 0.086 µg/g.
A similar comparison of survey responses with positive answers to question 21 in relation to EtG concentration results (Figure 13) shows a clear upward trend, and the IRQ range overlaps to a lesser extent than for total FAEEs. For those who declared that they did not consume alcohol during pregnancy, the median EtG was 0.008 µg/g and the IQR range was 0.004-0.016 µg/g. For those who declared alcohol consumption 1 per month or less, the median was 0.54 µg/ml and the IRQ was 0.07-0.97 µg/g, while for those who reported drinking 2 to 4 times per month, the median EtS was 0.91 µg/g and the IRQ was 0.54-1.12 µg/g.
The declared alcohol consumption in the first trimester of pregnancy indicated in Table 5 resulted in a relatively higher frequency of CBI2 scores of 0 or 1 compared to the declared alcohol consumption in the second and third trimesters, which may indicate the inability to detect PAE with the declared consumption in the first months of pregnancy (no possibility of biomarker accumulation in meconium). In most cases, the calculated CBI2 values exceeded 1 several times, while the analysis of the cut-off points for this indicator allows PAE to be differentiated from a value of 5. Table 6 summarizes the number of responses with CBI2 ≥ 5 and CBI2 < 5 to questions 21, 23, and 24:
5. Conclusions
The study indicates the need to implement the detection of PAE biomarkers (EtG, EtS, FAEEs) in the meconium of newborns as an objective and independent method of identifying fetal alcohol exposure. This is crucial because only about 4% of mothers reported drinking alcohol during pregnancy, which may underestimate the actual scale of PAE in the study population. These are approximate values because there were inconsistent answers to each of the questions about PAE (the same people did not always answer the question about PAE): 15 women (3.2%) admitted to consuming alcohol 1 per month or less, 5 women admitted to consuming alcohol 2 to 4 times per month (1.1%) admitted to drinking wine, beer, or high-proof alcohol, and the same number of women (19, or 4.0%) admitted to drinking in the 1st, 2nd, or 3rd trimester. Slightly fewer positive responses were given to question 24 about consumption of 1 small beer, or 1 glass of wine, or 1 glass of vodka, or 1 cocktail, which was answered by 14 people (3.0%), and 3 small beers, or 3 glasses of wine, or 3 glasses of vodka, or 3 cocktails, with 2 people (0.2%) responding positively. The most reliable information on PAE exposure is most likely provided by a combination of selected biomarkers (in particular, the more specific EtG and EtS, and to a lesser extent FAEEs), rather than a single marker. The frequency of alcohol consumption declared in the questionnaires (2 to 4 times per month) correlated better with positive EtS and EtG results than total FAEEs. Multivariate statistical analysis (EFA, cluster analysis, and dependent variable analysis) did not provide reliable and useful information due to the small number of women with PAE. Proposal of the CBI2 index and a cut-off value of 5 (cut-off concentration CEtS=0.0075 µg/g and cut-off CEtG=0.05 µg/g, assuming an equal share in the concentrations of both biomarkers) suggested that alcohol consumption during pregnancy affected approximately 3% of the studied population of women. CBI2 values ≥ 5 in combination with a positive response regarding alcohol consumption once a month or less and in the 2nd-4th month were reported by 15 women (3.2%), in the 1st, 2nd, or 3rd trimester by 18 women (3.8%), while 12 women (2.5%) gave a positive response to 1 small beer or 1 glass of wine, or 1 shot of vodka, or 1 cocktail, and 3 small beers or 3 glasses of wine, or 3 shots of vodka, or 3 cocktails. The need to standardize analytical procedures and validate uniform limit values is essential for the implementation of PAE biomarkers in routine clinical diagnostics.
Supplementary Materials
The following supporting information can be downloaded at the website of this paper posted on Preprints.org, Table S1: Author’s survey questionnaire (English version); Table S2: Results of survey questions 1 to 5 (n=478) in pregnant women conducted at the Neonatology Clinic of the Medical University of Gdańsk in the Pomeranian Province between June 16, 2019, and April 24, 2020 ; Table S3: Results of the survey questions 6a to 6o (n=478) in pregnant women conducted at the Neonatology Clinic of the Medical University of Gdańsk in the Pomeranian Province between June 16, 2019, and April 24, 2020. ; Table S4: Results of the survey questions 7 to 11d (n=478) in pregnant women conducted at the Neonatology Clinic of the Medical University of Gdańsk in the Pomeranian Province between June 16, 2019, and April 24, 2020 ; Table S5: Results of survey questions 12 to 18 (n=478) in pregnant women conducted at the Neonatology Clinic of the Medical University of Gdańsk in the Pomeranian Province between June 16, 2019, and April 24, 2020; Table S6: Results of survey questions 19a to 23c (n=478) in pregnant women conducted at the Neonatology Clinic of the Medical University of Gdańsk in the Pomeranian Province between June 16, 2019, and April 24, 2020; Table S7: Results of survey questions 24 to 26 (n=478) in pregnant women conducted at the Neonatology Clinic of the Medical University of Gdańsk in the Pomeranian Province between June 16, 2019, and April 24, 2020; Table S8: Data on pregnant women (personal details) from 1 to 7g (n=478) in a survey conducted at the Neonatology Clinic of the Medical University of Gdańsk in the Pomeranian Province between June 16, 2019, and April 24, 2020; Table S9: Results of GC-MS-SIM and LC-ESI-MS-MS chemical analyses (in mass concentration units - µg/g) for infant tar (n=478) collected on the first day after birth at the Neonatology Clinic of the Medical University of Gdańsk in the Pomeranian Province between June 16, 2019, and April 24, 2020; Table S10: Results of GC-MS-SIM and LC-ESI-MS-MS chemical analyses (in mole concentration units - nmol/g) for infant meconium (n=478) collected on the first day after birth at the Neonatology Clinic of the Medical University of Gdańsk in the Pomeranian Province between June 16, 2019, and April 24, 2020; Table S11: Results of survey questionnaire (478 surveys were compiled, but a variable number of people responded to individual questions).
Author Contributions
Conceptualization, M.W., I.J., J.W., M.K.W., and M.B.; methodology, M.W., I.J., J.W., M.K.W., and M.B.; investigation M.W., I.J., J.W., M.K.W., and M.B.; writing—original draft preparation, M.W., I.J.; writing—review and editing, M.W., I.J., J.W., M.C.K., M.K.W., A.K.W., M.B., J.S.A., D.S., M.G., and K.H.; visualization, M.W.; supervision, M.W., I.J., M.B..; project administration, M.B.. All authors have read and agreed to the published version of the manuscript.
Funding
This research was funded by the program ‘OPUS’ awarded for the years 2016–2019 by National Science Centre, Poland (Project no: 2015/19/B/ST4/02725). Title of the research ‘Estimation and usefulness of determination of biomarkers indicating alcohol consumption by pregnant women in neonatal meconium to diagnose prenatal exposure to alcohol.’
Institutional Review Board Statement
The study was conducted in accordance with the Helsinki Declaration, and was approved by the Local Ethics Committee of the Medical University of Gdansk for studies involving humans: NKBB/309/2015.
Informed Consent Statement
Informed consent was obtained from all subjects involved in the study.
Data Availability Statement
All supporting data are included in the Appendix A.
Acknowledgments
The authors would like to thank Michał Olech from the Division of Quality of Life Research MUG for his contribution to the statistical analyses, which significantly contributed to the quality and reliability of this work.
Conflicts of Interest
The authors declare no conflicts of interest.
Abbreviations
The following abbreviations are used in this manuscript:
| CBI2 | Cumulative Biomarker Index for 2 biomarkers |
| CBI2_5 | Cumulative Biomarker Index for 2 biomarkers equals 5 |
| DAC | Department of Analytical Chemistry |
| EE 12:0 | ethyl laurate |
| EE 14:0 | ethyl myristate |
| EE 16:0 | ethyl palmitate |
| EE 16:1 | ethyl palmitoleate |
| EE 18:0 | ethyl stearate |
| EE 18:1 | ethyl oleate |
| EE 18:2 | ethyl linoleate |
| EE 18:3 | ethyl linolenate |
| EE 20:0 | ethyl arachidate |
| EE 20:4 | ethyl arachidonate |
| EFA | Exploratory Factor Analysis |
| EtG | Ethyl Glucuronide |
| EtS | Ethyl Sulfate |
| FAEEs | Fatty Acid Ethyl Esters |
| FASD | Fetal Alcohol Spectrum Disorders |
| GC-MS | Gas Chromatography–Mass Spectrometry |
| GUT | Gdańsk University of Technology |
| IQR | Interquartile Range |
| LC-MS/MS | Liquid Chromatography–Tandem Mass Spectrometry |
| LOD | Limits of Detection |
| LOQ | Limits of Quantification |
| MC | Maternity Clinic |
| MUG | Medical University of Gdańsk |
| NC | Neonatology Clinic |
| PAE | Prenatal Alcohol Exposure |
| PV | Physiological Variable |
| RMSEA | Root Mean Square Error of Approximation |
| SD | Standard Deviation |
| TLI | Tucker-Lewis Index |
| UCC | University Clinical Center |
References
- Elliott, E.J.; Payne, J.; Morris, A.; Haan, E.; Bower, C. Fetal alcohol syndrome: a prospective national surveillance study. Arch Dis Child 2008, 93, 732–737. [Google Scholar] [CrossRef] [PubMed]
- Mårdby, A.-Ch.; Lupattelli, A.; Hensing, G.; Nordeng, H. Consumption of alcohol during pregnancy - A multinational European study. Women and Birth 2017, 30, e207–e213. [Google Scholar] [CrossRef] [PubMed]
- Popova, S.; Lange, S.; Probst, Ch.; Gmel, G.; Rehm, J. Estimation of national, regional, and global prevalence of alcohol use during pregnancy and fetal alcohol syndrome: a systematic review and meta-analysis. The Lancet, Global Health 2017, 5, e290–e299. [Google Scholar] [CrossRef] [PubMed]
- Bager, H.; Christensen, L.P.; Husby, S.; Bjerregaard, L. Biomarkers for the Detection of Prenatal Alcohol Exposure: A Review. Alcohol Clin Exp Res 2017, 41, 251–261. [Google Scholar] [CrossRef] [PubMed]
- Bakhireva, L.N.; Savage, D.D. Focus on: biomarkers of fetal alcohol exposure and fetal alcohol effects. Alcohol Res Health 2011, 34, 56–63. [Google Scholar]
- Bakhireva, L.N.; Kane, M.A.; Bearer, C.F.; Bautista, A.; Jones, J.W.; Garrison, L.; Begay, M.-G.; Ozechowski, T.; Lewis, J. Prenatal alcohol exposure prevalence as measured by direct ethanol metabolites in meconium in a Native American tribe of the southwest. Birth Defects Res. 2019, 111, 53–61. [Google Scholar] [CrossRef] [PubMed]
- Himes, S. K.; Dukes, K. A.; Tripp, T.; Petersen, J. M.; Raffo, C.; Burd, L.; Huestis, M. A. Clinical sensitivity and specificity of meconium fatty acid ethyl ester, ethyl glucuronide, and ethyl sulfate for detecting maternal drinking during pregnancy. Clinical Chemistry 2015, 61, 523–532. [Google Scholar] [CrossRef]
- Morini, L.; Marchei, E.; Vagnarelli, F.; Garcia Algar, O.; Groppi, A.; Mastrobattista, L.; Pichini, S. Ethyl glucuronide and ethyl sulfate in meconium and hair-potential biomarkers of intrauterine exposure to ethanol. Forensic Science International 2010, 196, 74–77. [Google Scholar] [CrossRef]
- Morini, L.; Groppi, A.; Marchei, E.; Vagnarelli, F.; Algar, O.G.; Zuccari, P.; Pichini, S. Population Baseline of Meconium Ethyl Glucuronide and Ethyl Sulfate Concentrations in Newborns of Nondrinking Women in 2 Mediterranean Cohorts. Ther Drug Monitor 2010, 32, 359–363. [Google Scholar] [CrossRef] [PubMed]
- Pichini, S.; Morini, L.; Marchei, E.; Palmi, I.; Rotolo, M.C.; Vagnarelli, F.; Garcia-Algar, O.; Vall, O.; Zuccaro, P. Ethylglucuronide and ethylsulfate in meconium to assess gestational ethanol exposure: preliminary results in two Mediterranean cohorts. Canadian Journal of Clinical Pharmacology 2009, 16, e370–e375. [Google Scholar]
- Dos Santos, F.S.; de Martinis, B.S.; Furtado, E.F. The detection of fetal alcohol exposure by FAEEs meconium analysis. Curr Dev Disord Reports 2016, 3, 325–241. [Google Scholar] [CrossRef]
- Jańczewska, I.; Cichoń-Kotek, M.; Glińska, M.; Deptulska-Hurko, K.; Basiński, K.; Woźniak, M.; Wiergowski, M.; Biziuk, M.; Szablewska, A.; Cichoń, M.; Wierzba, J. Contributors to preterm birth: data from a single polish perinatal center. Children 2023, 10, 447. [Google Scholar] [CrossRef] [PubMed]
- Woźniak, M.K.; Banaszkiewicz, L.; Aszyk, J.; Wiergowski, M.; Jańczewska, I.; Wierzba, J.; Kot-Wasik, A.; Biziuk, M. Development and validation of a method for the simultaneous analysis of fatty acid ethyl esters, ethyl sulfate and ethyl glucuronide in neonatal meconium: application in two cases of alcohol consumption during pregnancy. Analytical and Bioanalytical Chemistry 2021, 413, 3093–3105. [Google Scholar] [CrossRef] [PubMed]
- R Core Team, A language and environment for statistical computing. R Foundation for Statistical Computing, Vienna, Austria. Available online: https://www.R-project.org/ (accessed on 12 Dec 2025).
- Posit team. RStudio: Integrated Development Environment for R. Posit Software, PBC, Boston, MA. Available online: http://www.posit.co (accessed on 12 Dec 2025).
- Wickham, H.; Averick, M.; Bryan, J.; Chang, W.; McGowan, L.D.; François, R.; Grolemund, G.; Hayes, A.; Henry, L.; Hester, J.; Kuhn, M.; Pedersen, T.L.; Miller, E.; Bache, S.M.; Müller, K.; Ooms, J.; Robinson, D.; Seidel, D.P.; Spinu, V.; Takahashi, K.; Vaughan, D.; Wilke, C.; Woo, K.; Yutani, H. Welcome to the tidyverse. Journal of Open Source Software 2019, 4, 1686. [Google Scholar] [CrossRef]
Figure 1.
Responses of women (n = 429) to question 13 concerning information provided by doctors during pregnancy.
Figure 1.
Responses of women (n = 429) to question 13 concerning information provided by doctors during pregnancy.
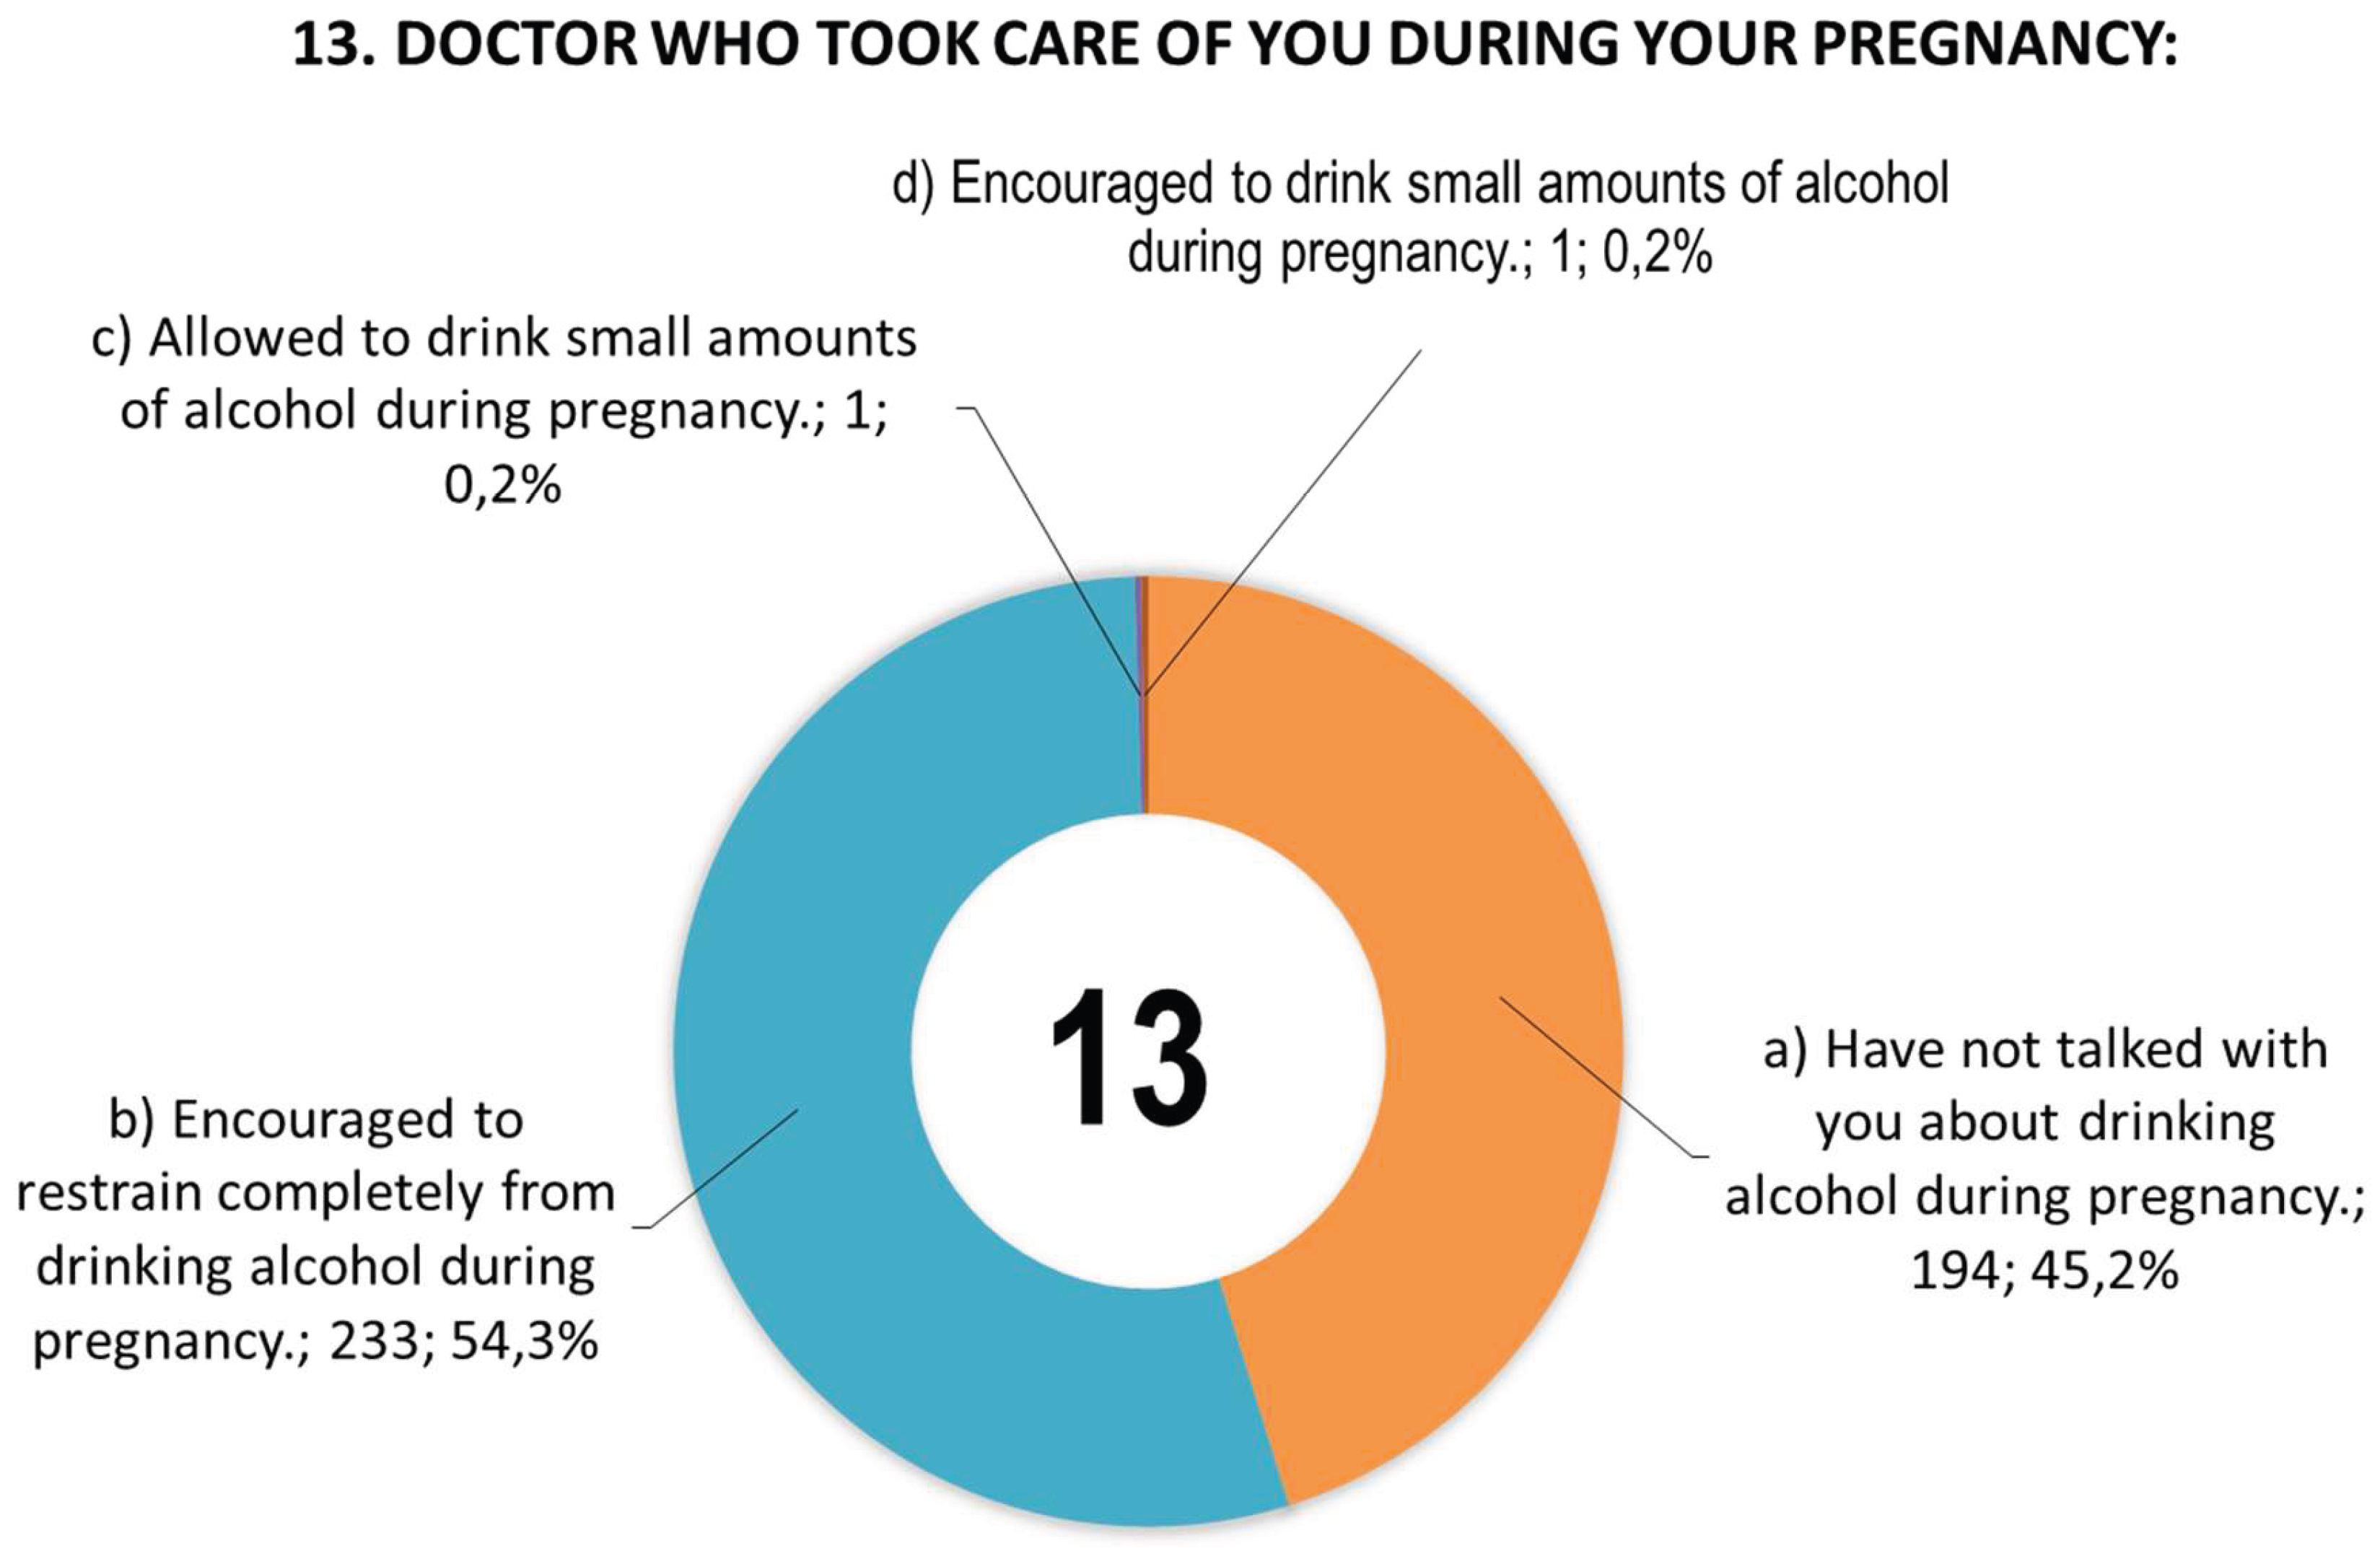
Figure 2.
Responses of women (n = 432) to question 14 regarding the daily alcohol consumption that they consider safe for pregnant women.
Figure 2.
Responses of women (n = 432) to question 14 regarding the daily alcohol consumption that they consider safe for pregnant women.
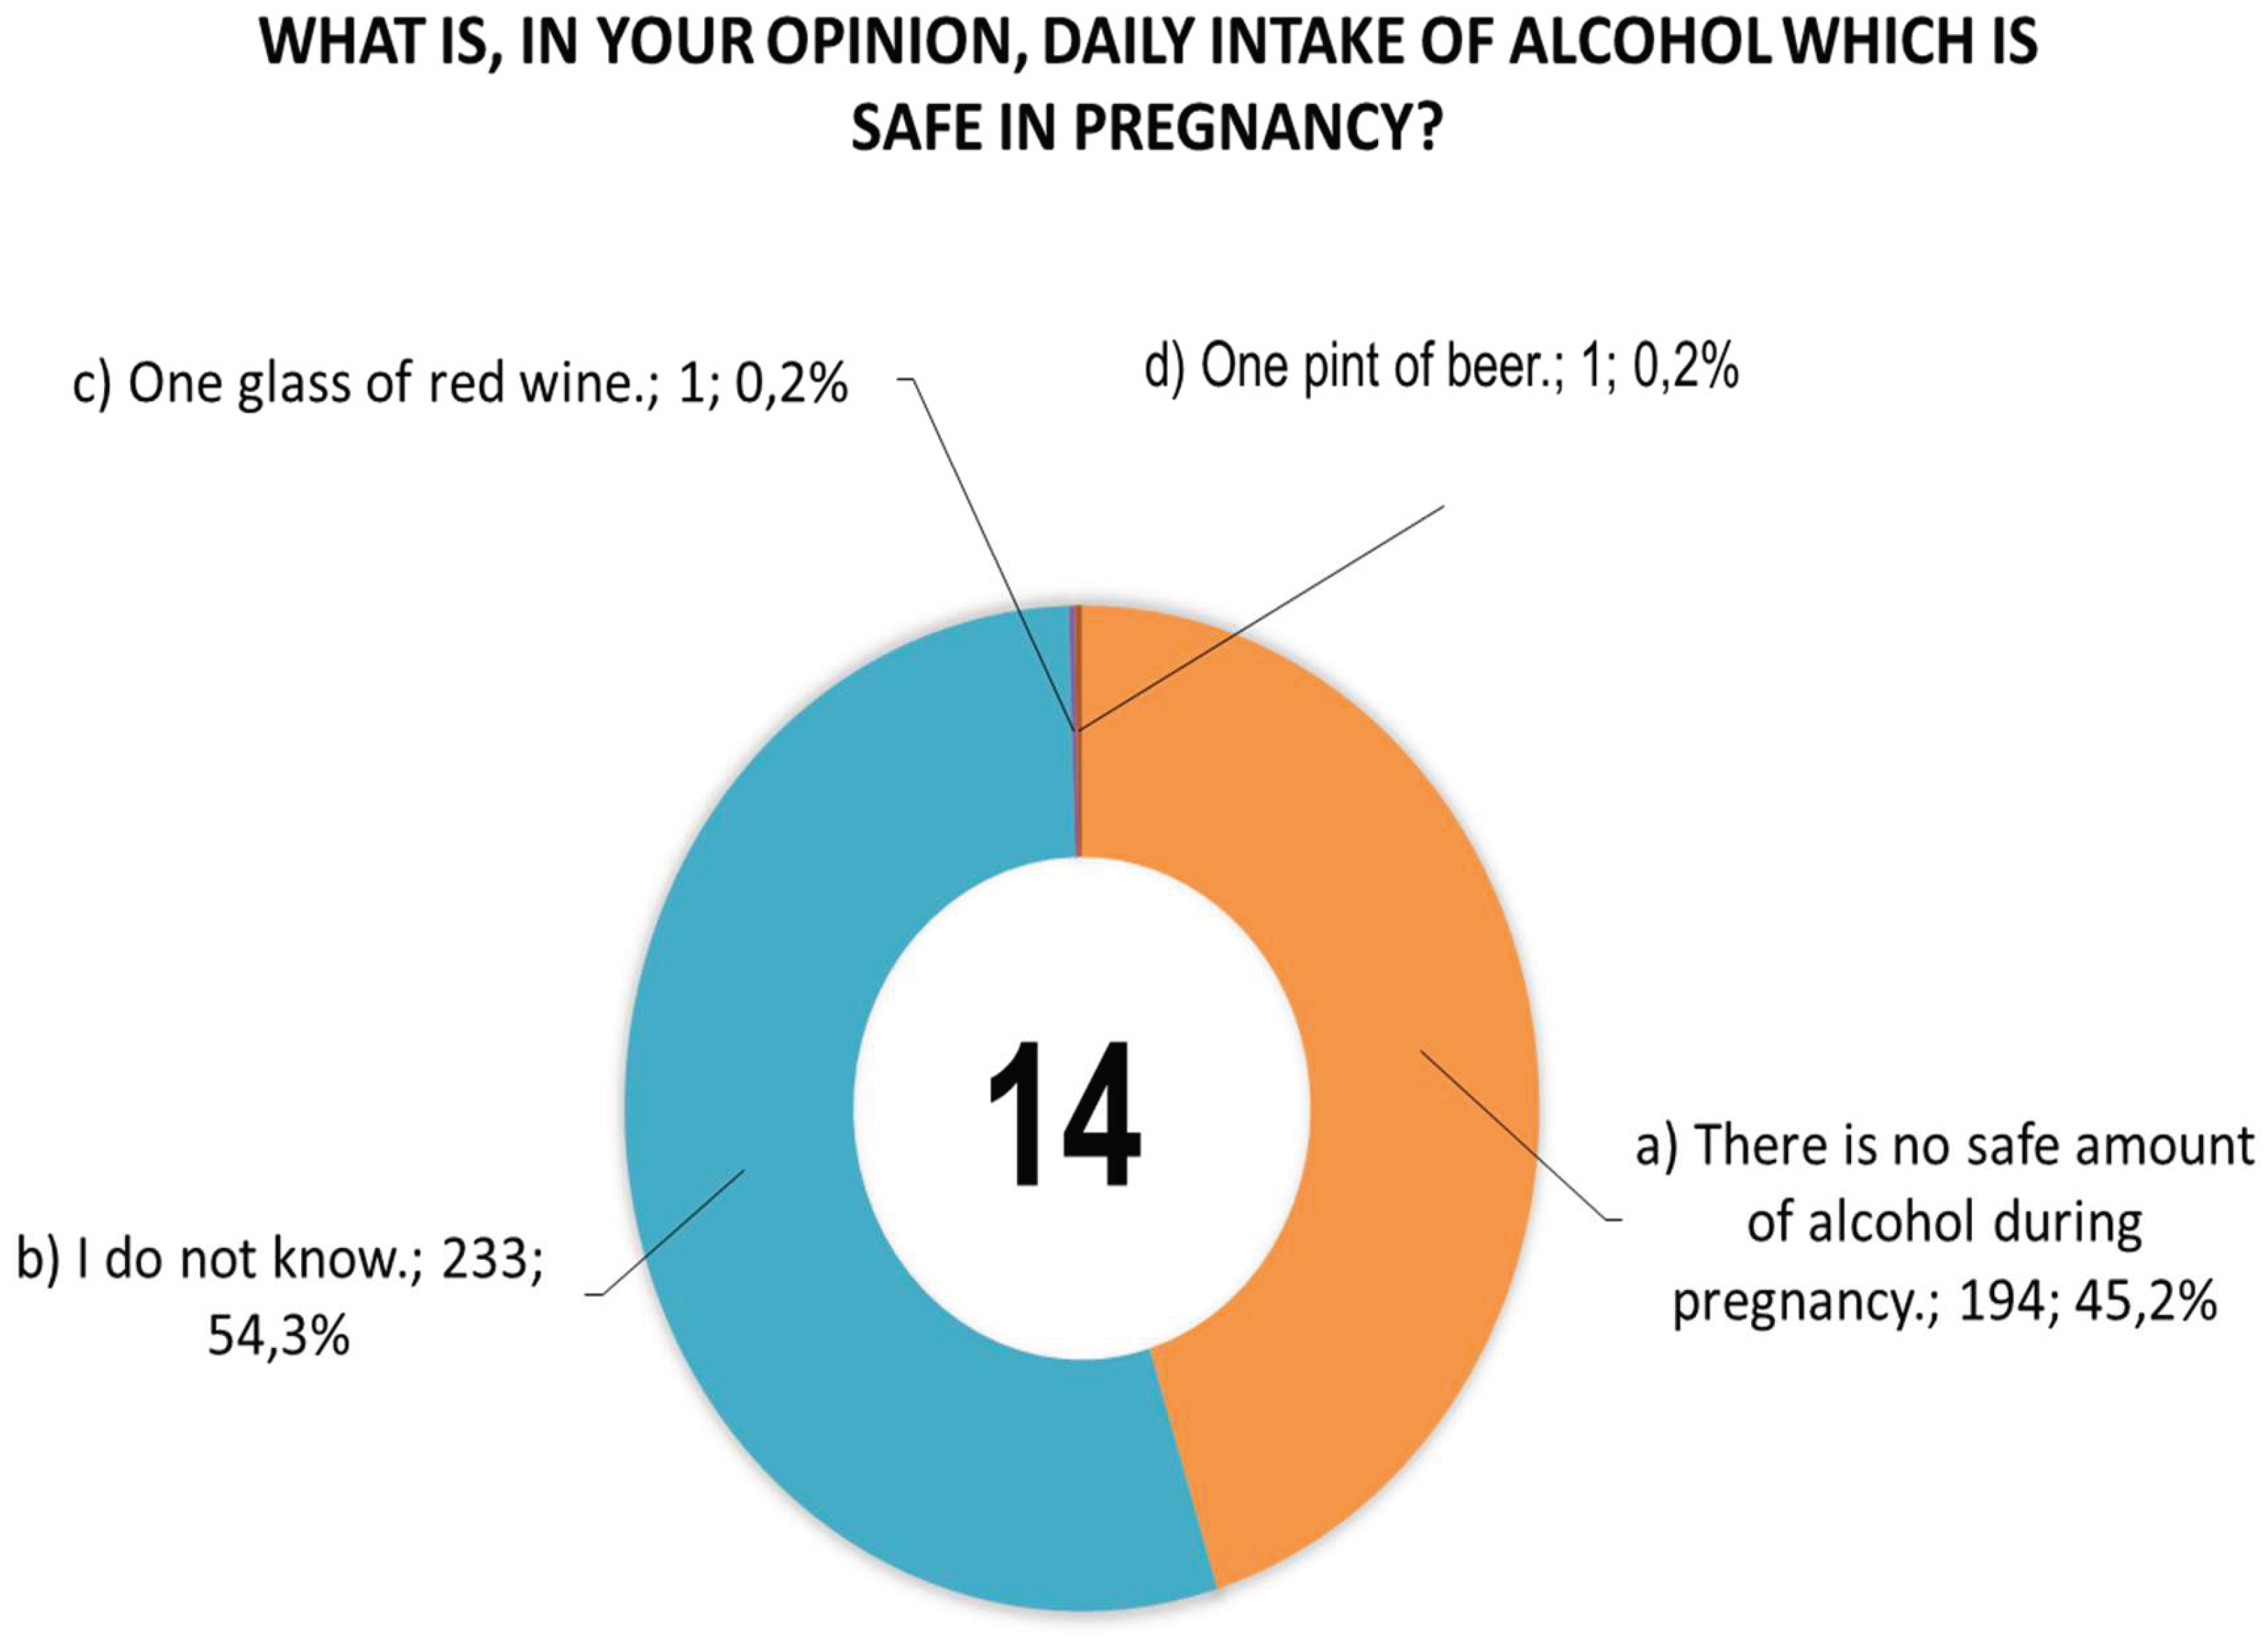
Figure 3.
Women’s responses to questions 20 and 21 about the frequency of alcohol consumption before pregnancy (n = 445) and during pregnancy (n = 474).
Figure 3.
Women’s responses to questions 20 and 21 about the frequency of alcohol consumption before pregnancy (n = 445) and during pregnancy (n = 474).
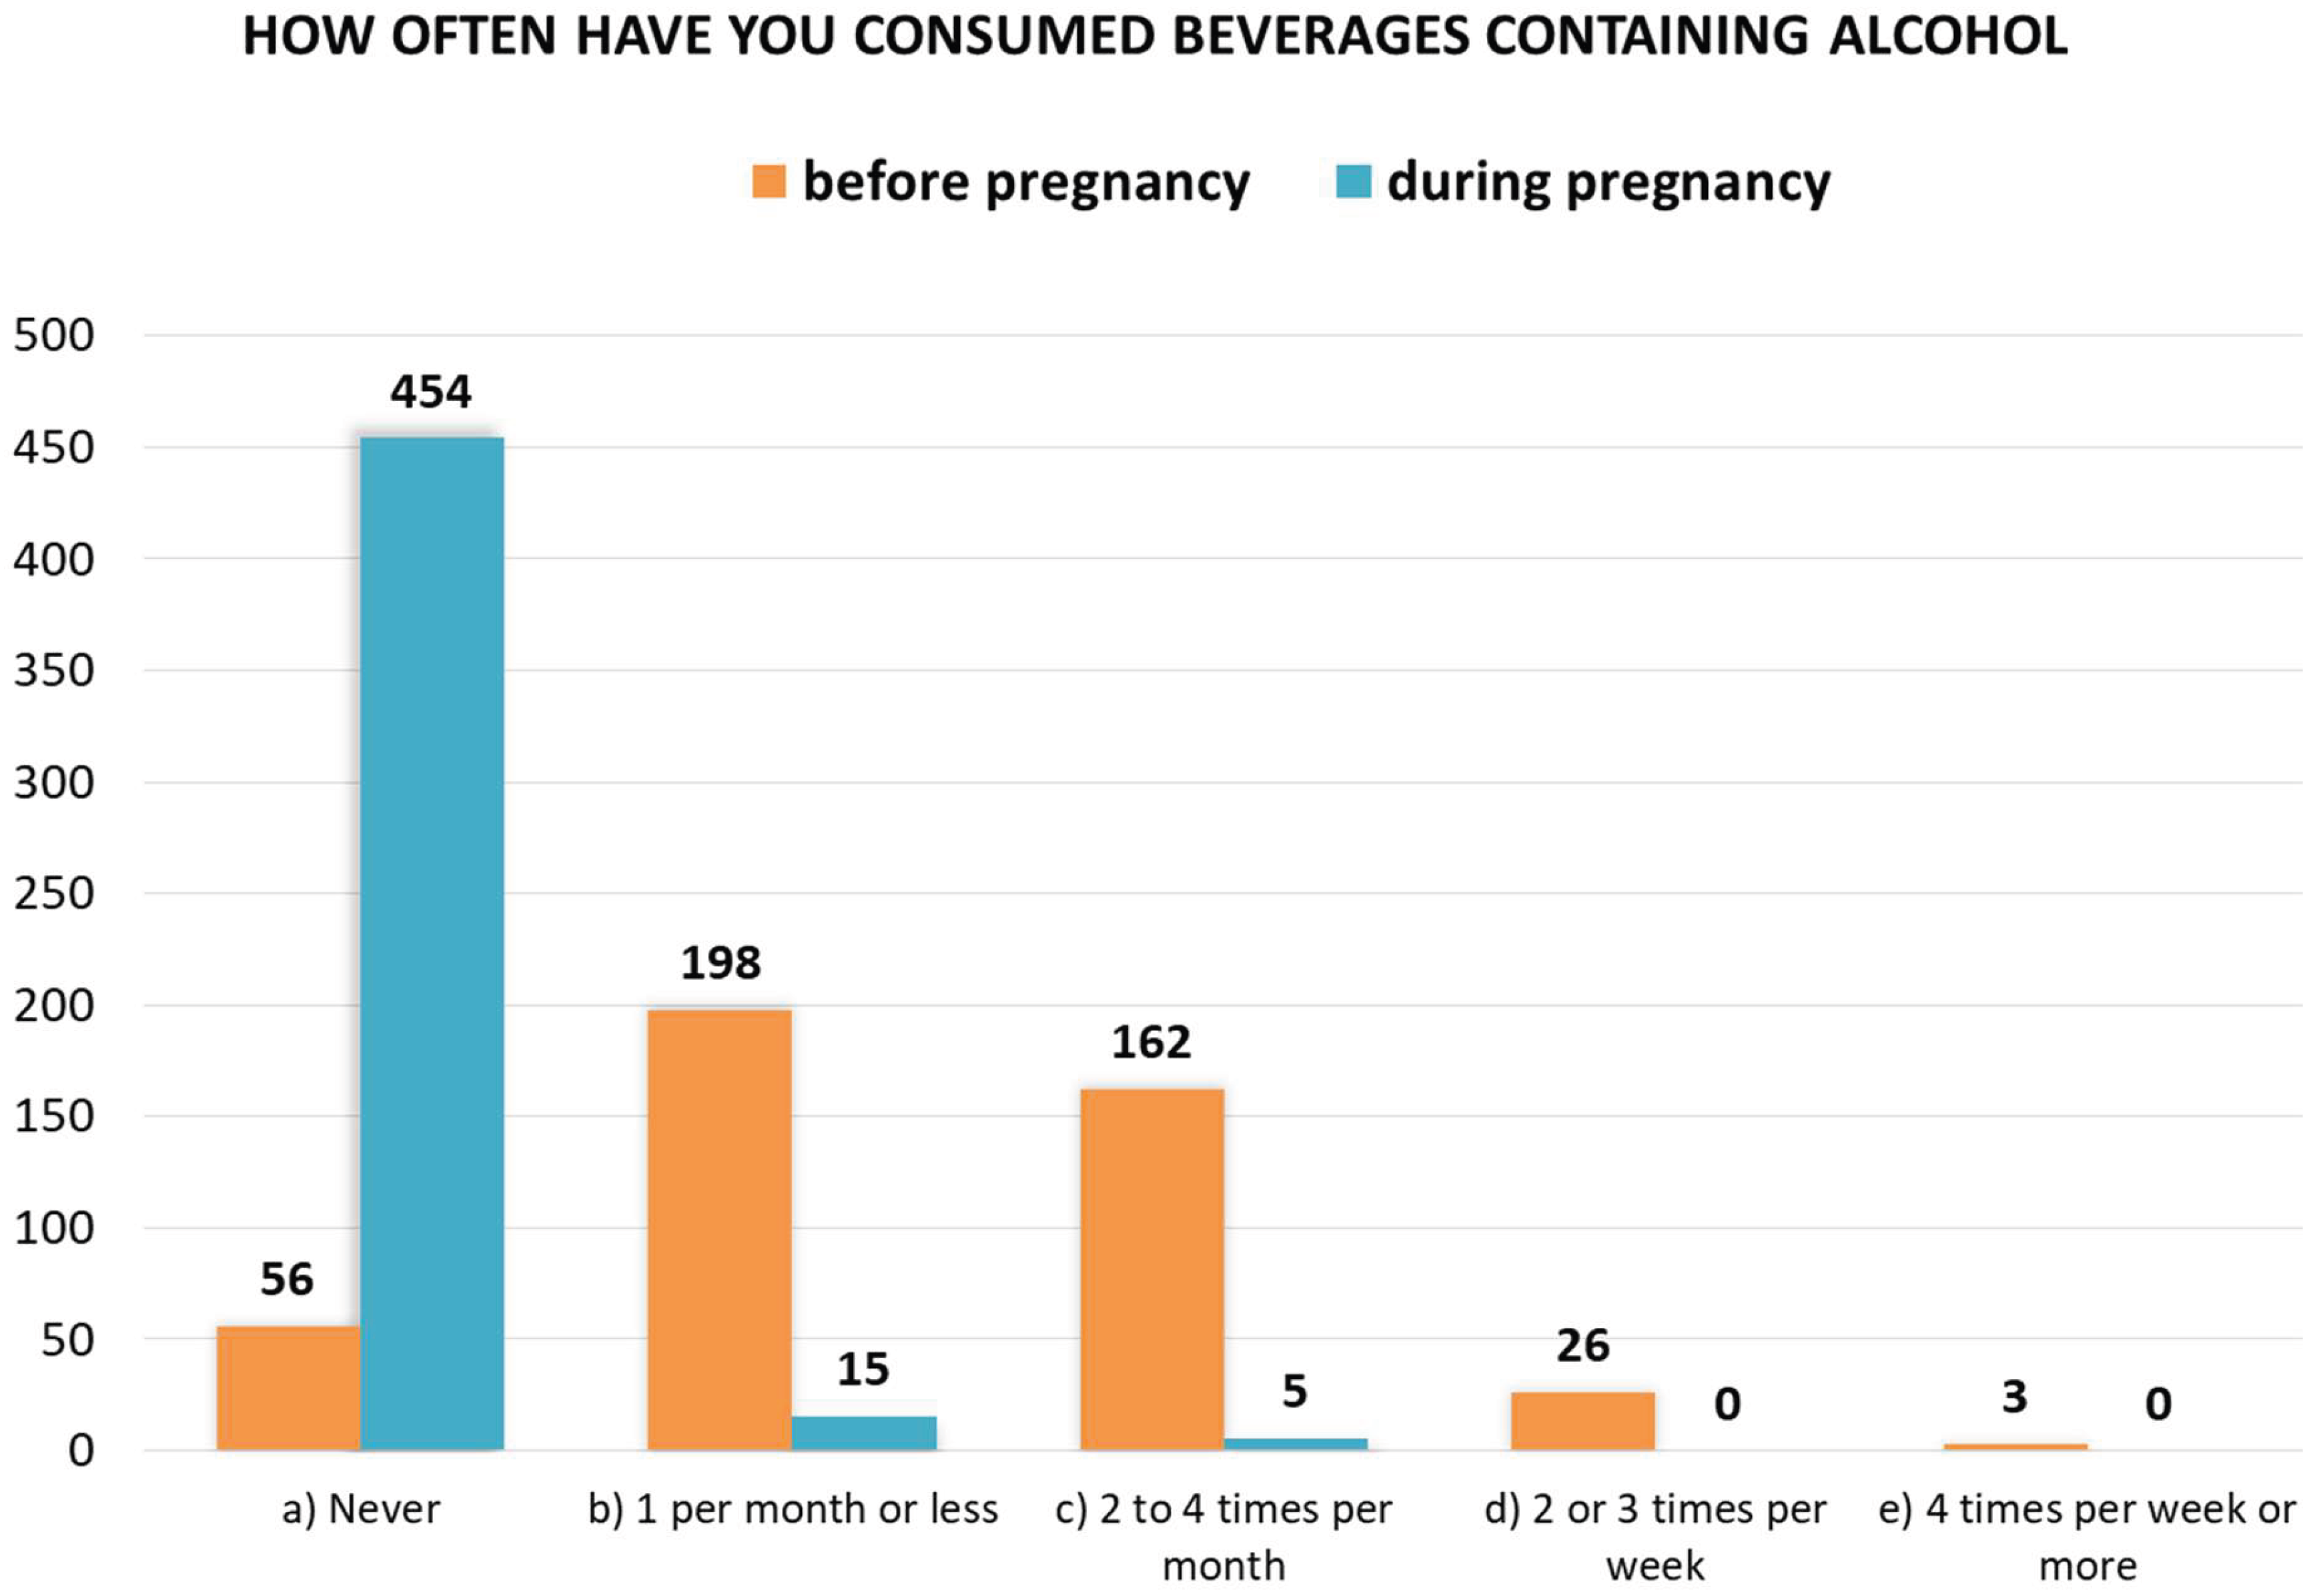
Figure 4.
Responses of women (n=19) to question 22 about the type of alcoholic beverage consumed during pregnancy, with woman no. 54 declaring that she consumed all three alcoholic beverages (answers a, b, c) and women no. 186 and 237 declaring that they consumed beer and wine (answers a, b).
Figure 4.
Responses of women (n=19) to question 22 about the type of alcoholic beverage consumed during pregnancy, with woman no. 54 declaring that she consumed all three alcoholic beverages (answers a, b, c) and women no. 186 and 237 declaring that they consumed beer and wine (answers a, b).
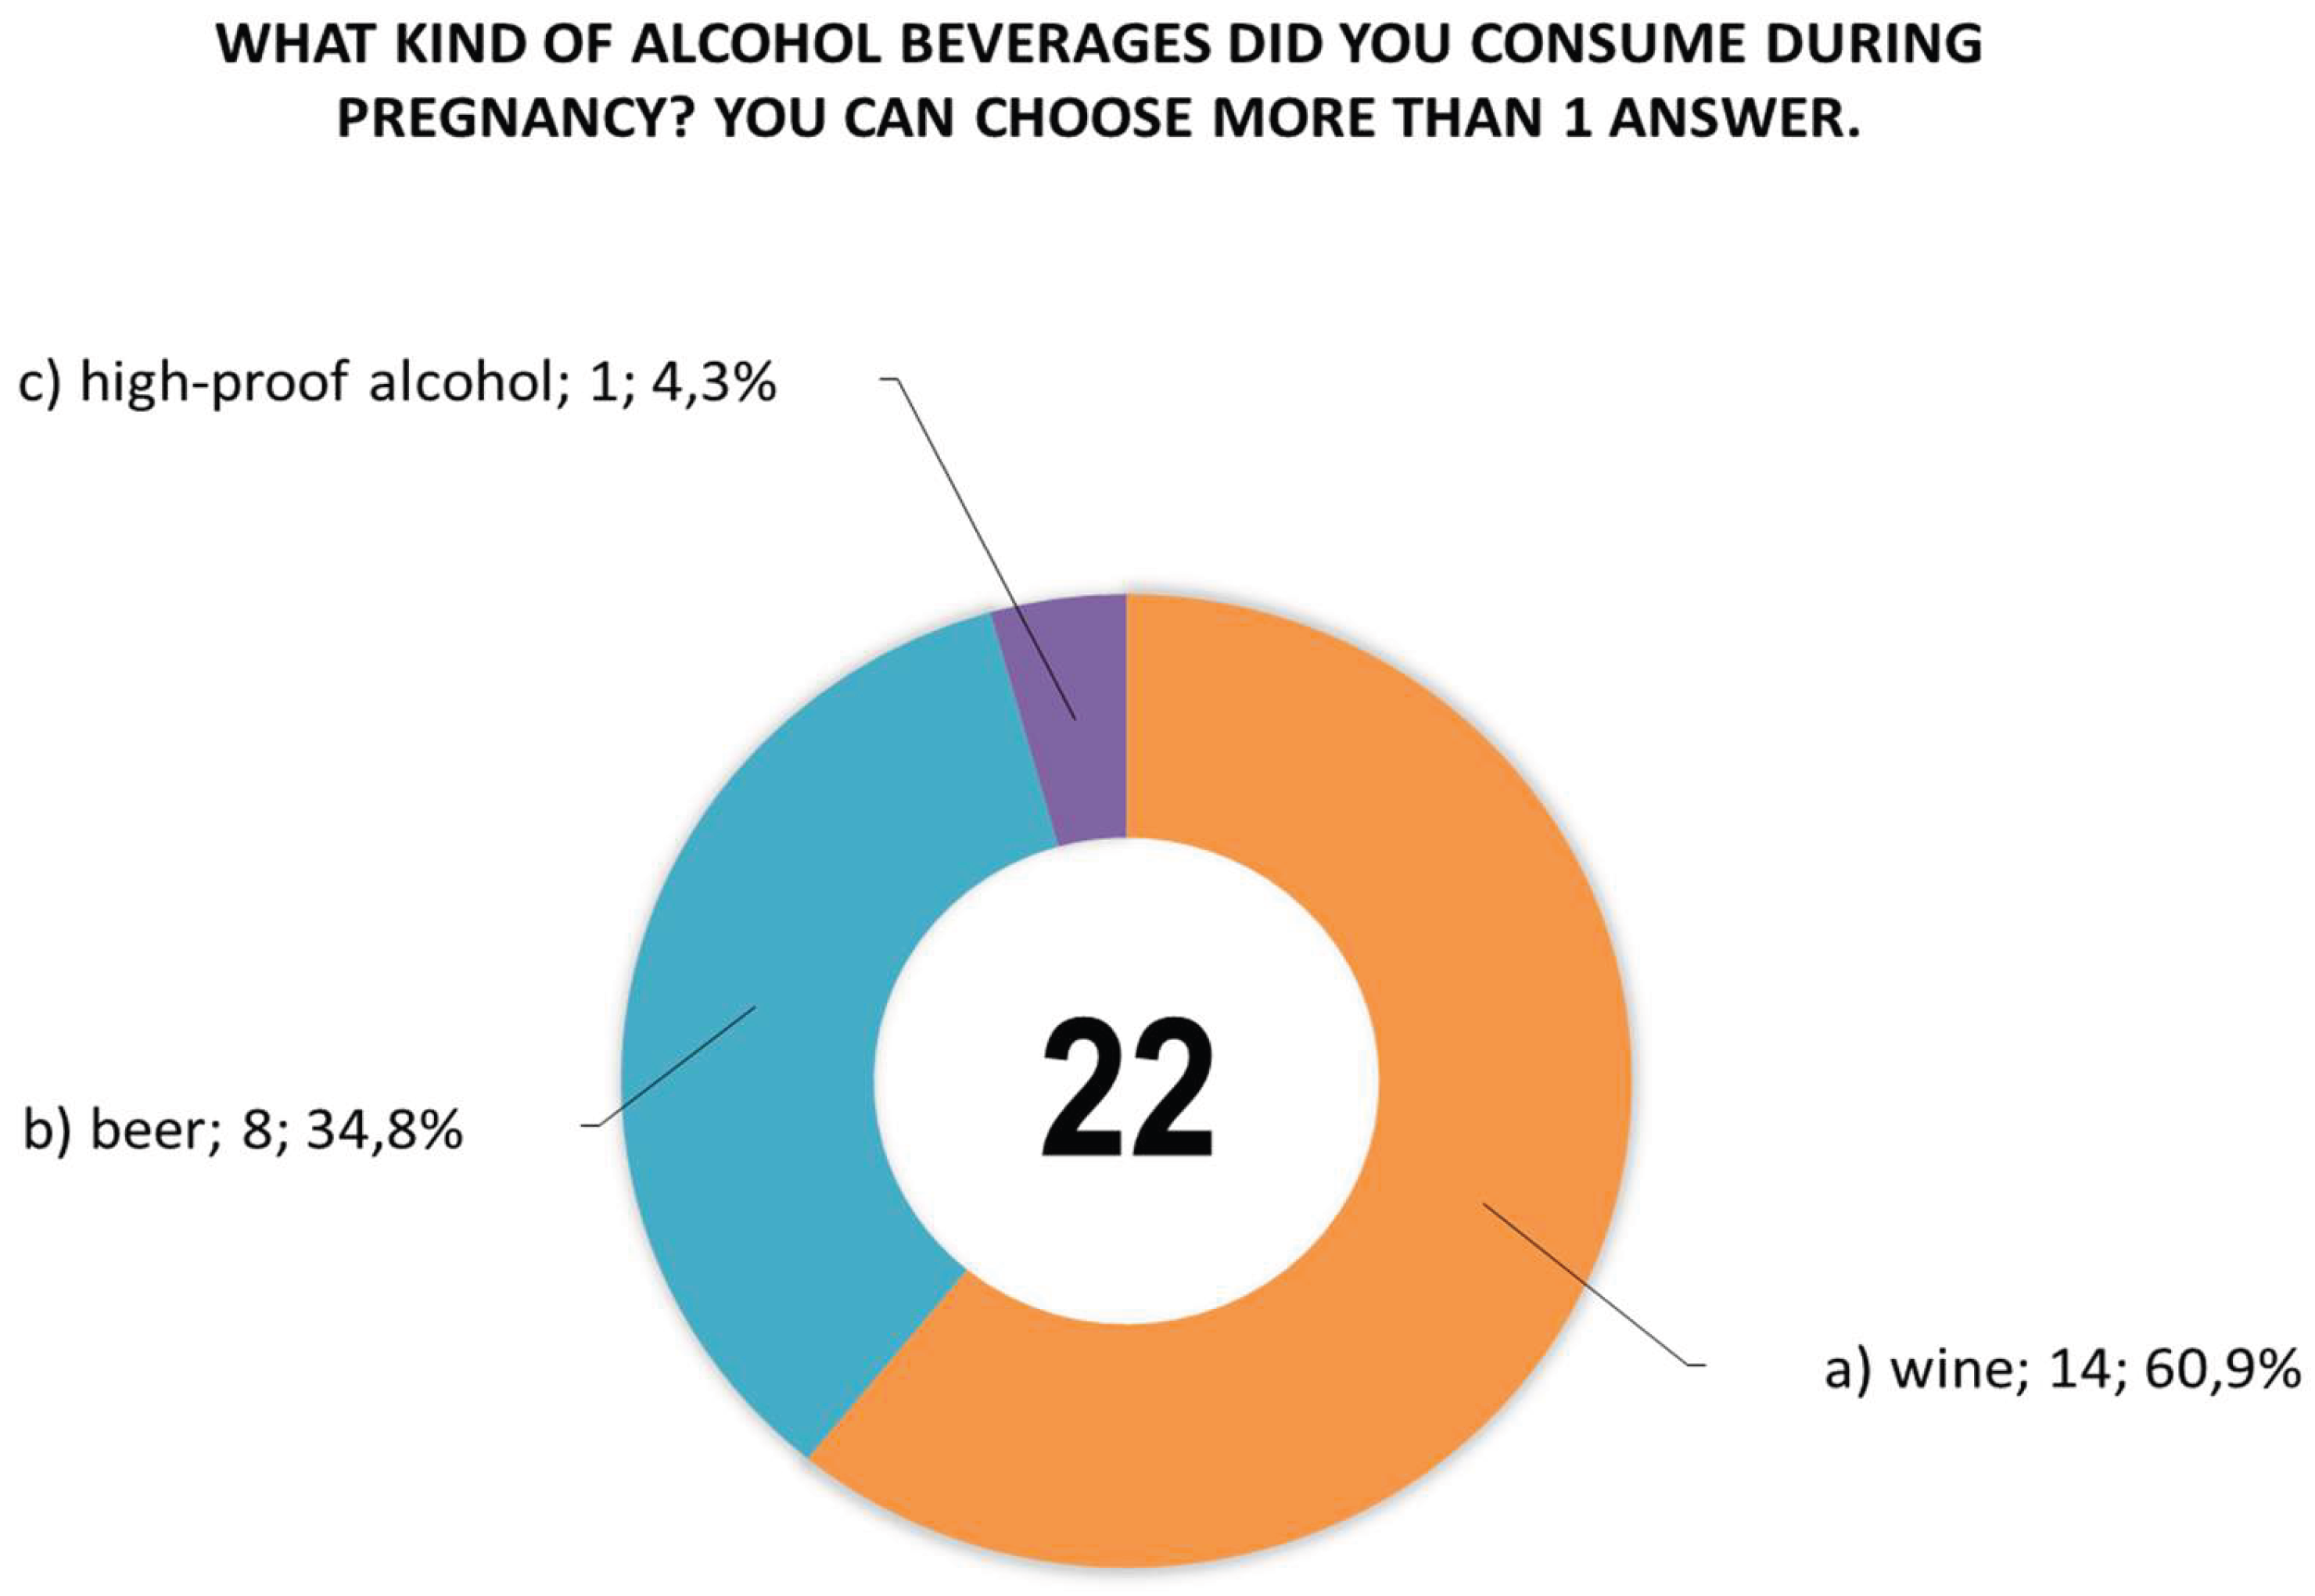
Figure 5.
Responses of women (n=19) to question 23 about the time (trimester) of alcohol consumption during pregnancy, with women no. 42 and 363 declaring that they consumed alcohol in all trimesters (answers a, b, c), and women no. 4 and 244 declared that they consumed alcohol in the 2nd and 3rd trimesters (answers b, c).
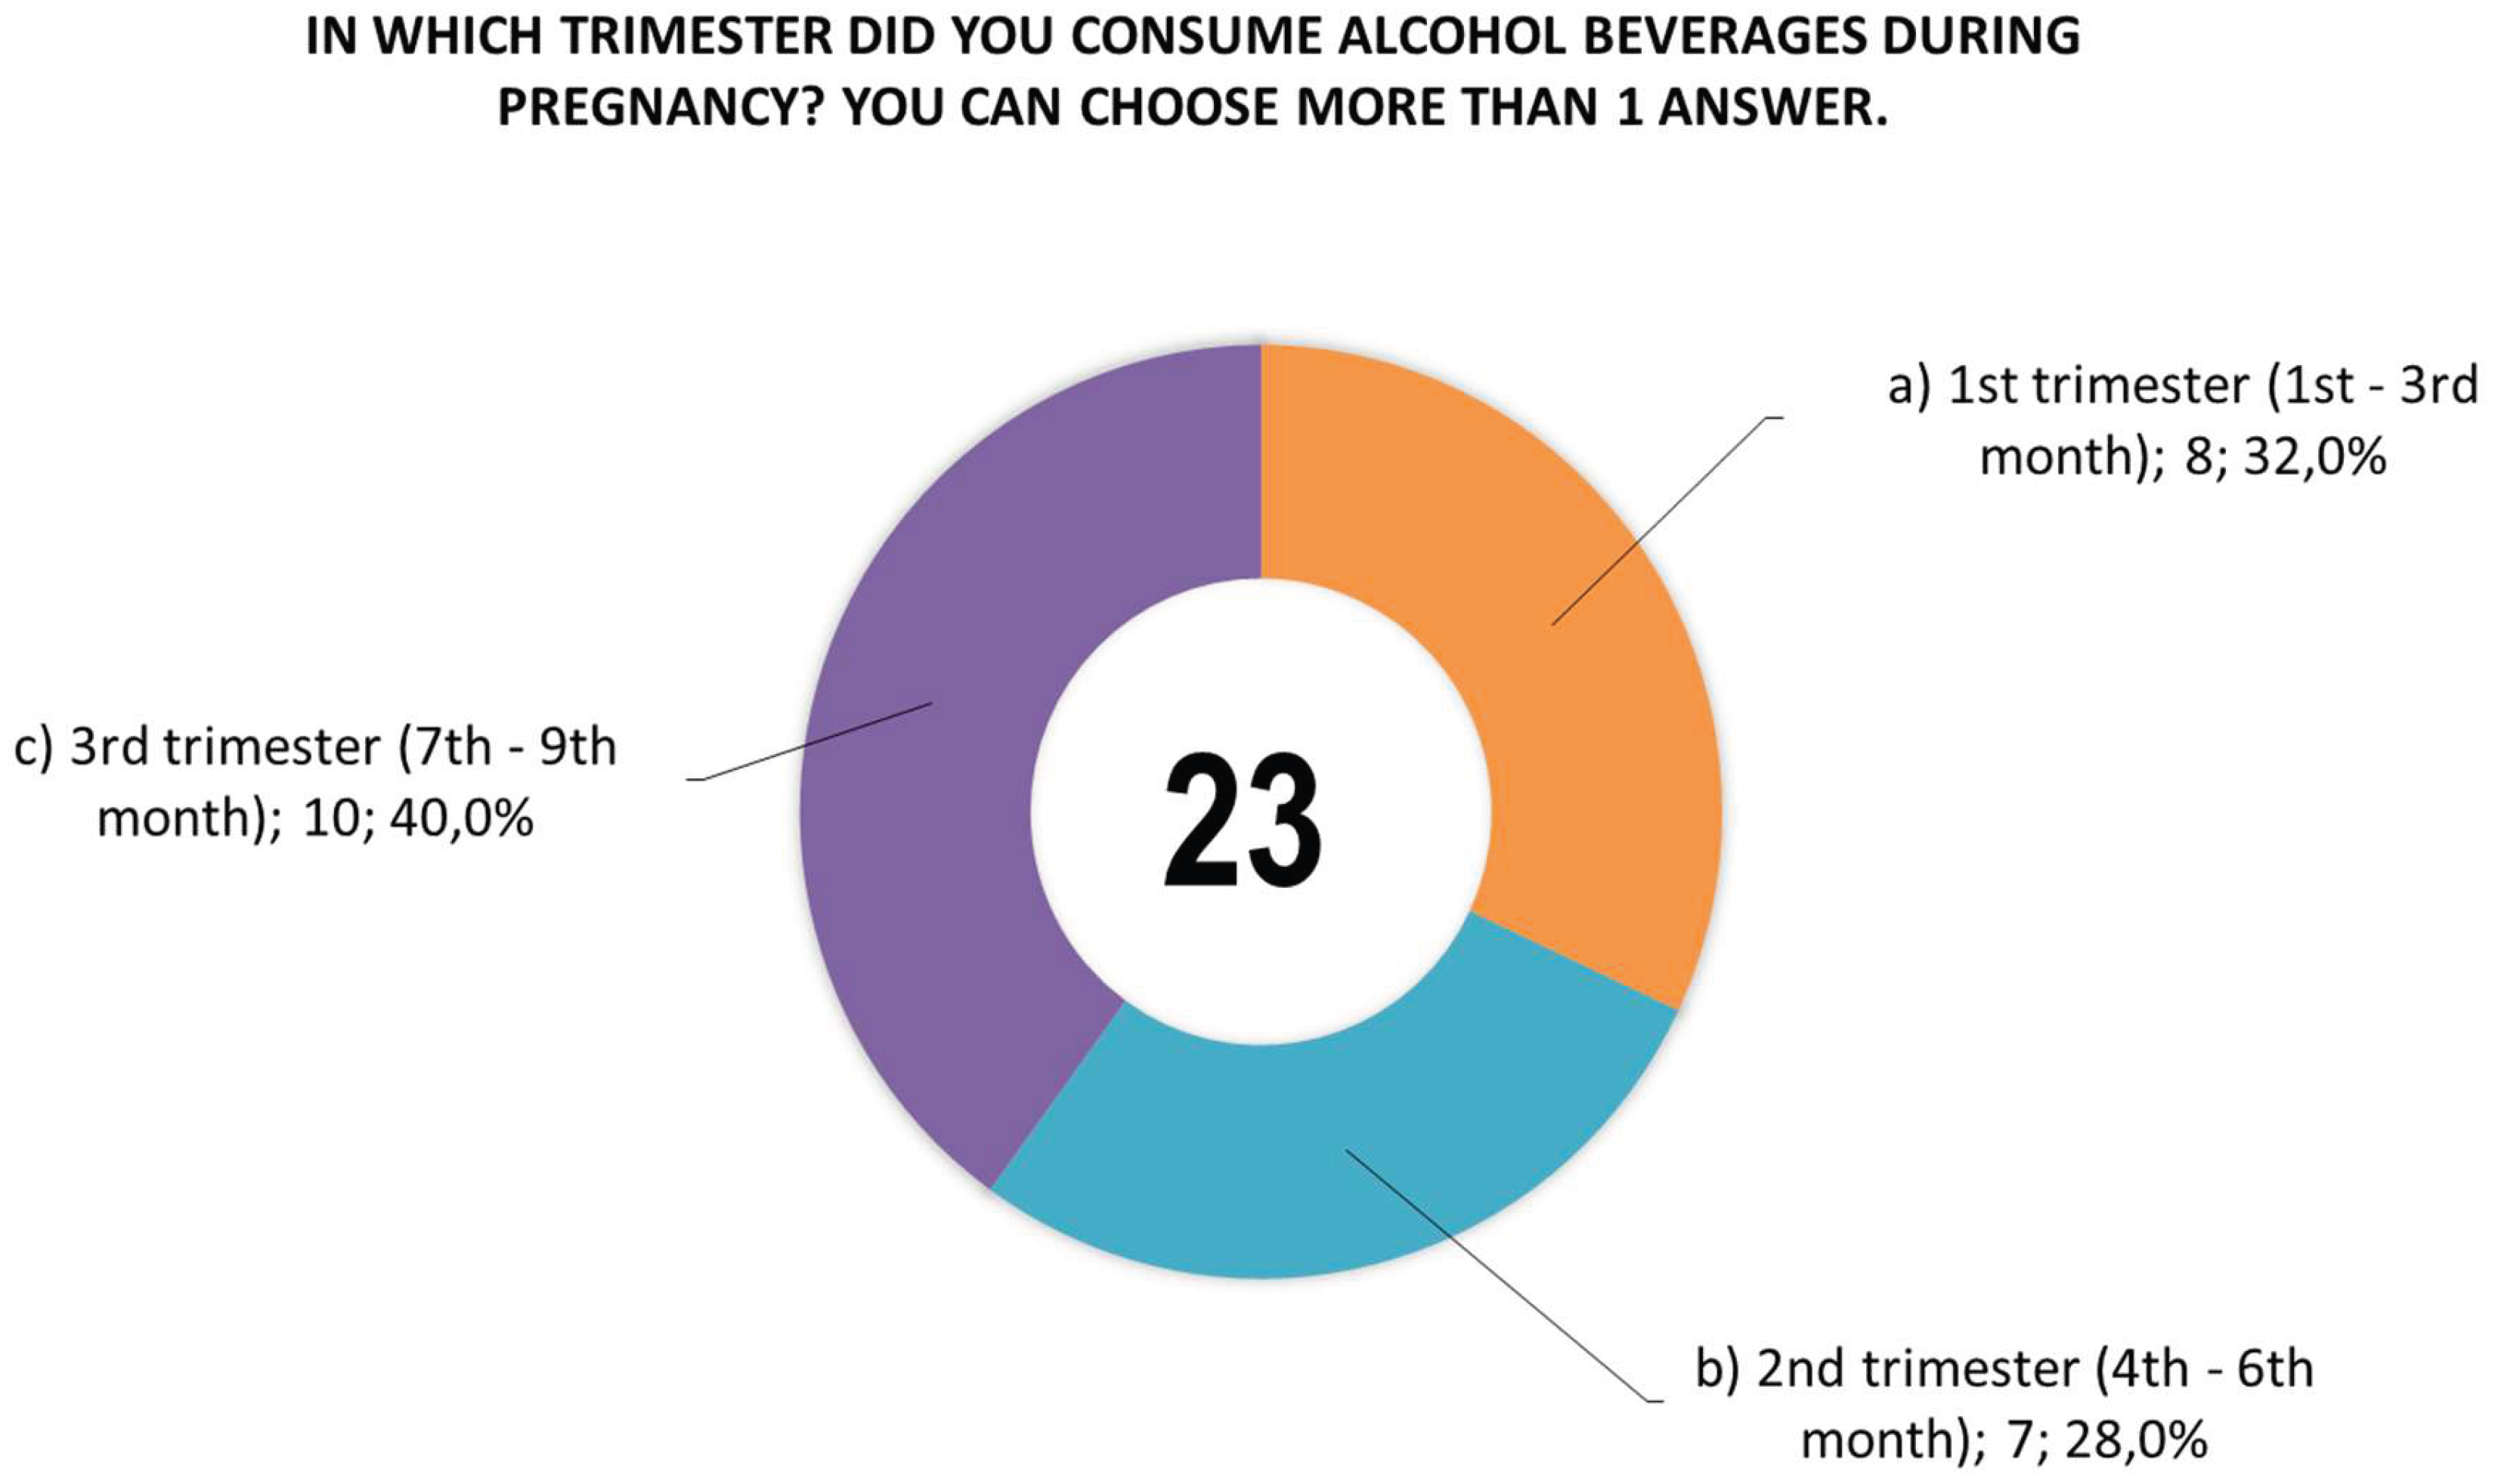
Figure 6.
Positive responses from women to question 24 about the largest amount of alcohol they drank at one time during pregnancy (response ‘b’) 2 small beers, or 2 glasses of wine, or 2 glasses of vodka, or 2 cocktails’ did not receive any positive responses).
Figure 6.
Positive responses from women to question 24 about the largest amount of alcohol they drank at one time during pregnancy (response ‘b’) 2 small beers, or 2 glasses of wine, or 2 glasses of vodka, or 2 cocktails’ did not receive any positive responses).
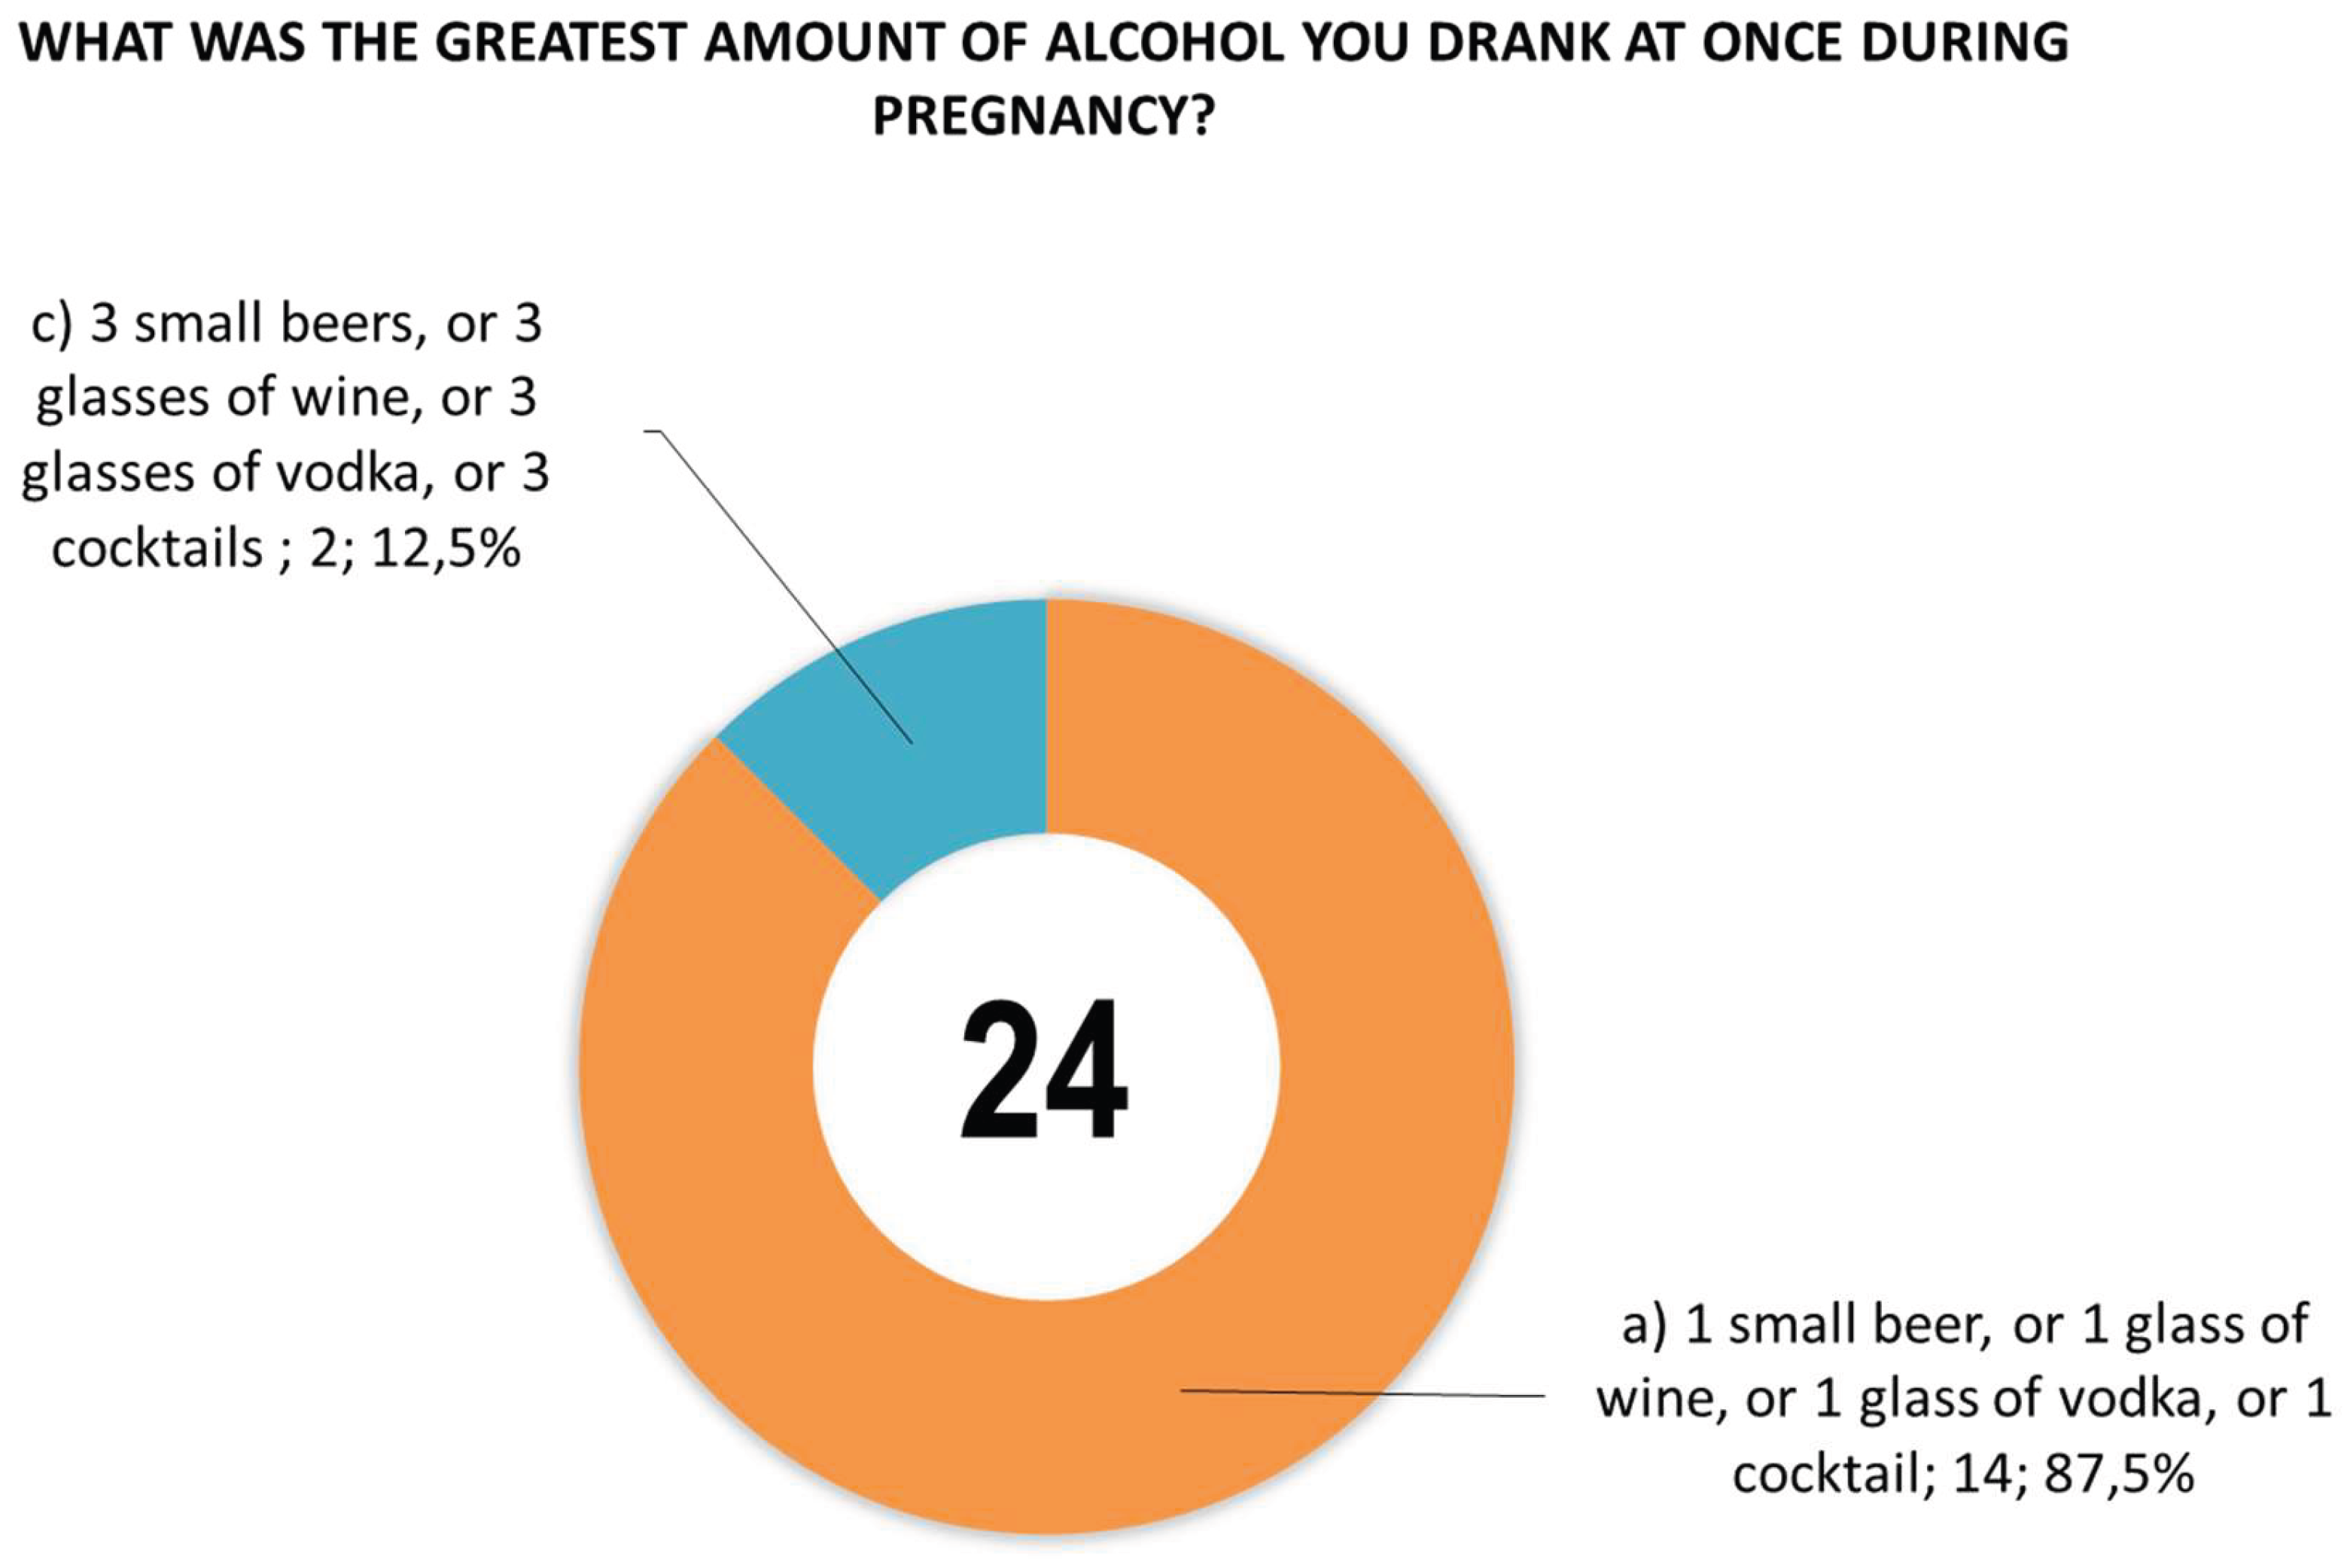
Figure 7.
Summary of positive responses from mothers (represented by personal identification numbers) confirming PAE in four different questionnaire questions numbered 21 (n=20), 22 (n=19), 23 (n=19), and 24 (n=16). The figure does not include responses from mothers with identification numbers 1 and 360, for whom the questionnaire was not completed and PAE resulted from the circumstances of childbirth.
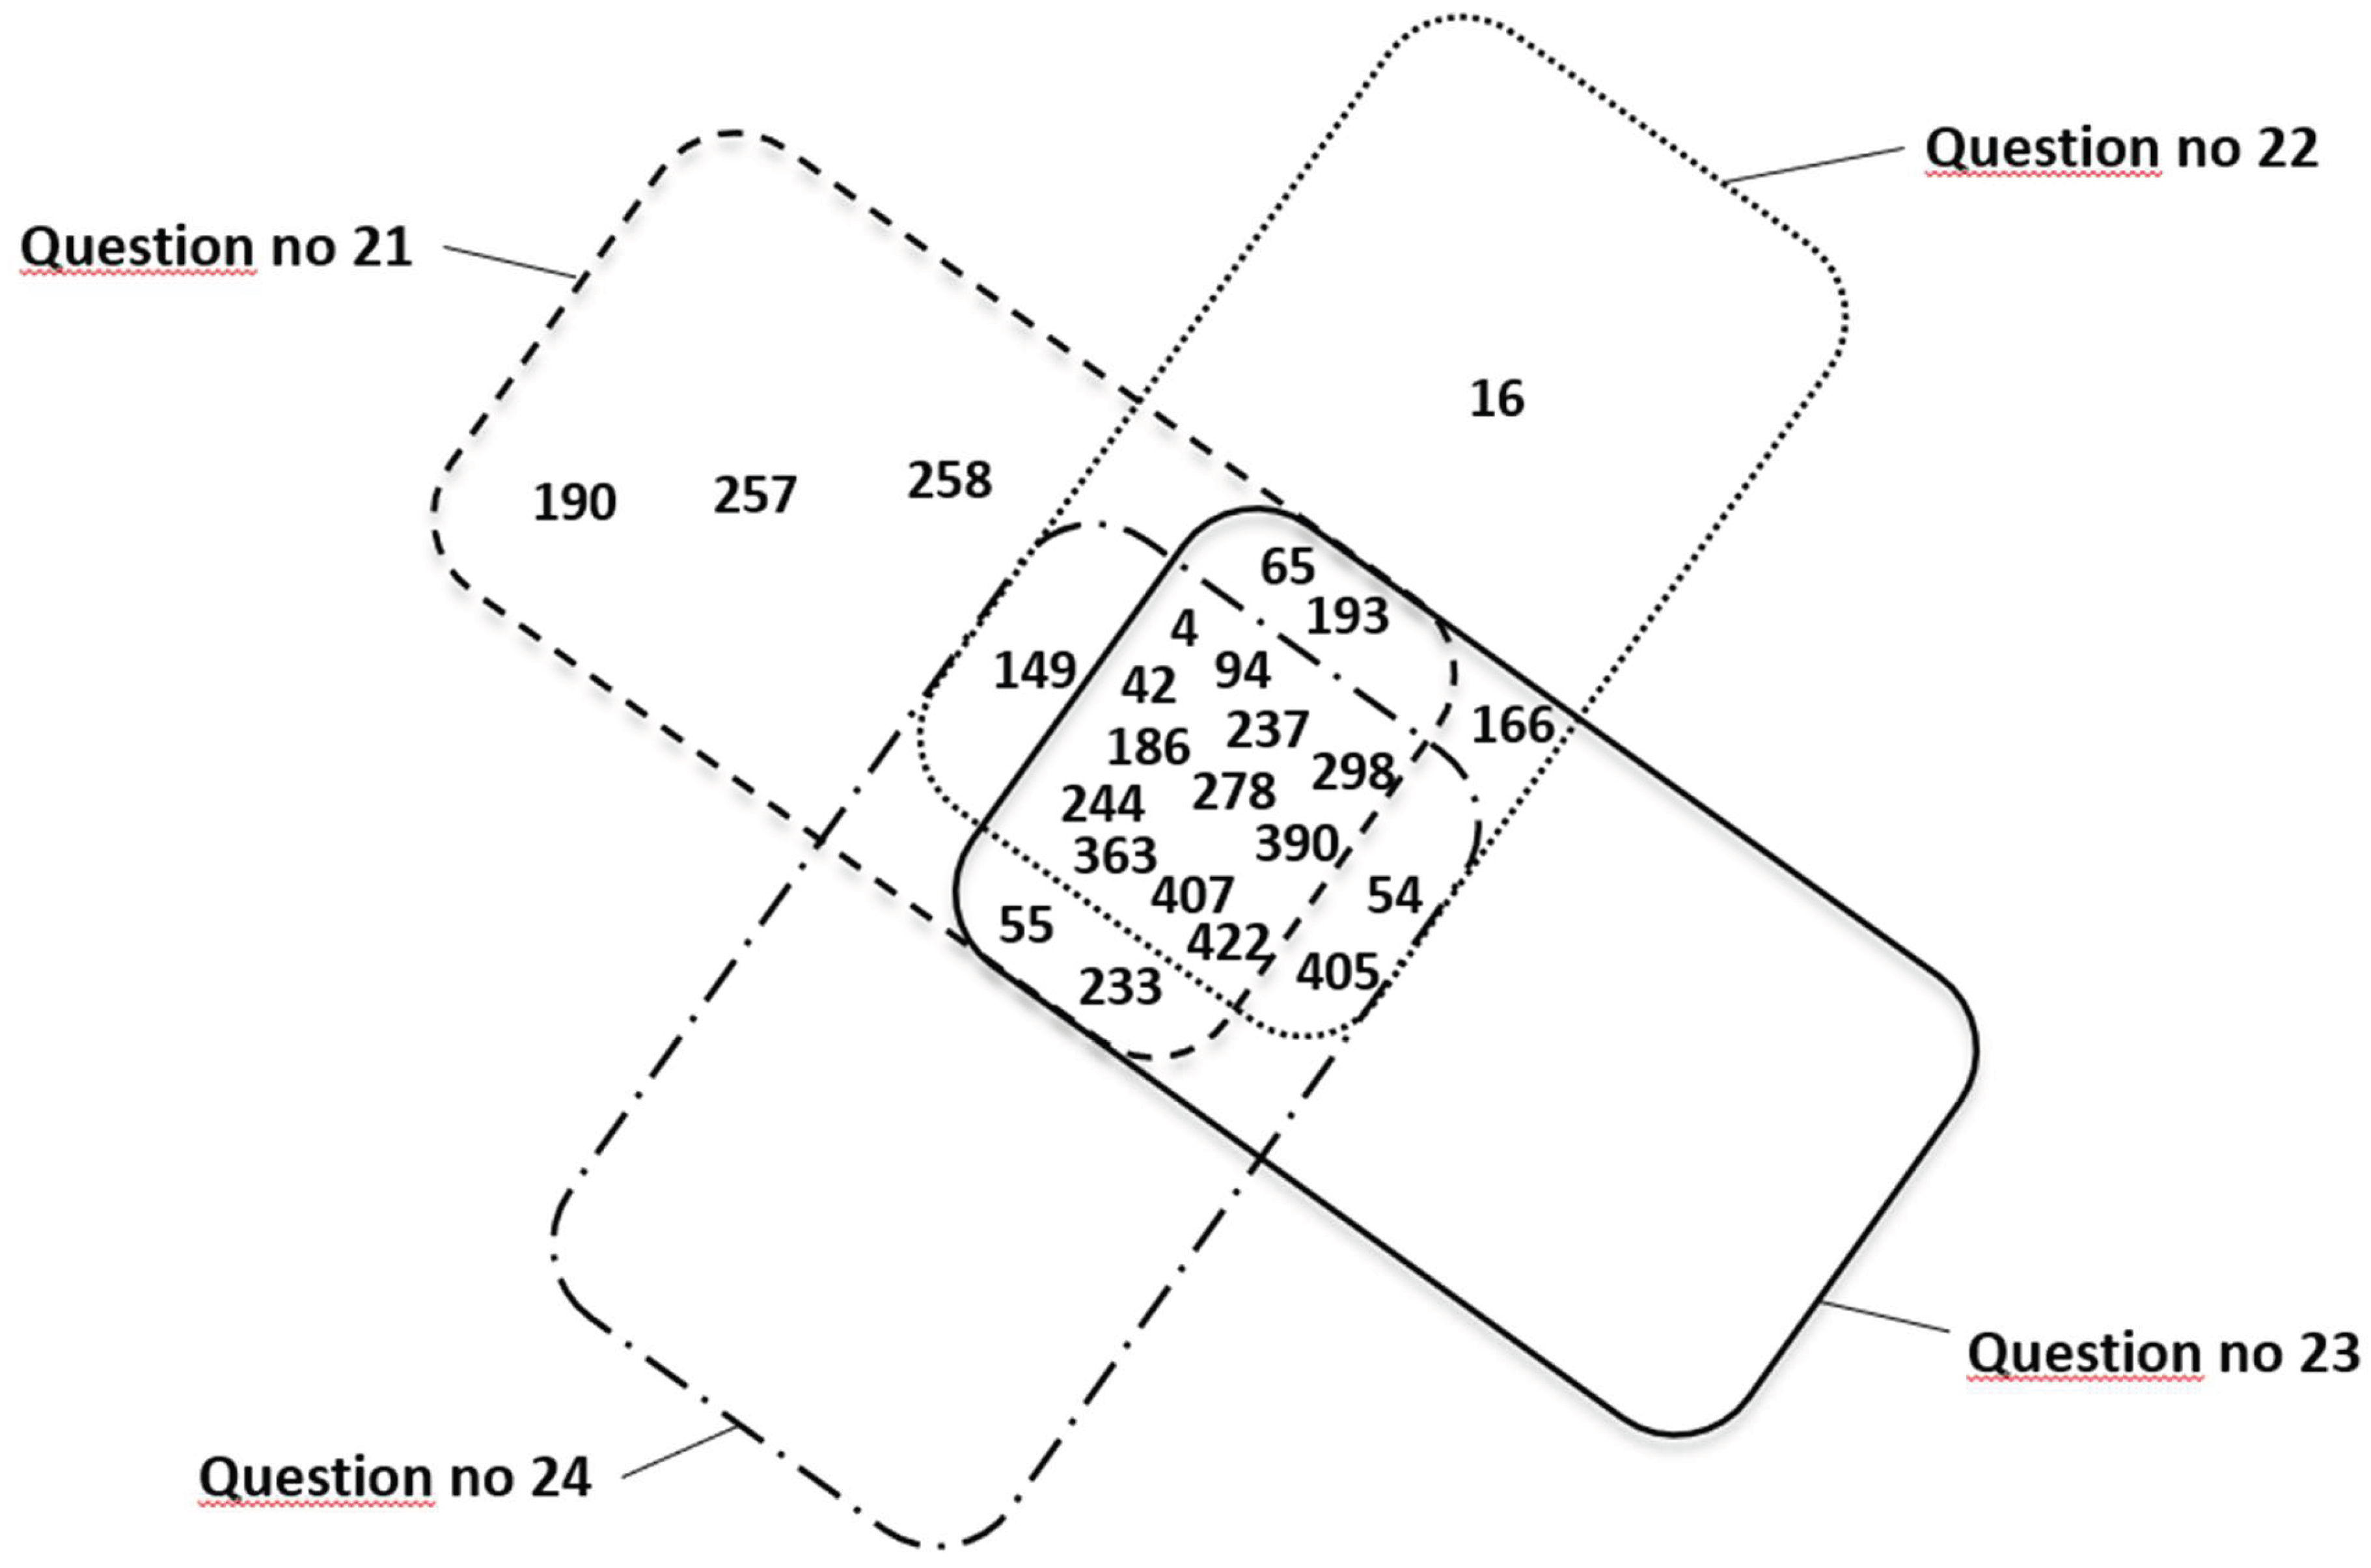
Figure 11.
Box plot showing total FAEEs concentrations in relation to the frequency of alcohol consumption in question 21 and women who gave birth while intoxicated.
Figure 11.
Box plot showing total FAEEs concentrations in relation to the frequency of alcohol consumption in question 21 and women who gave birth while intoxicated.
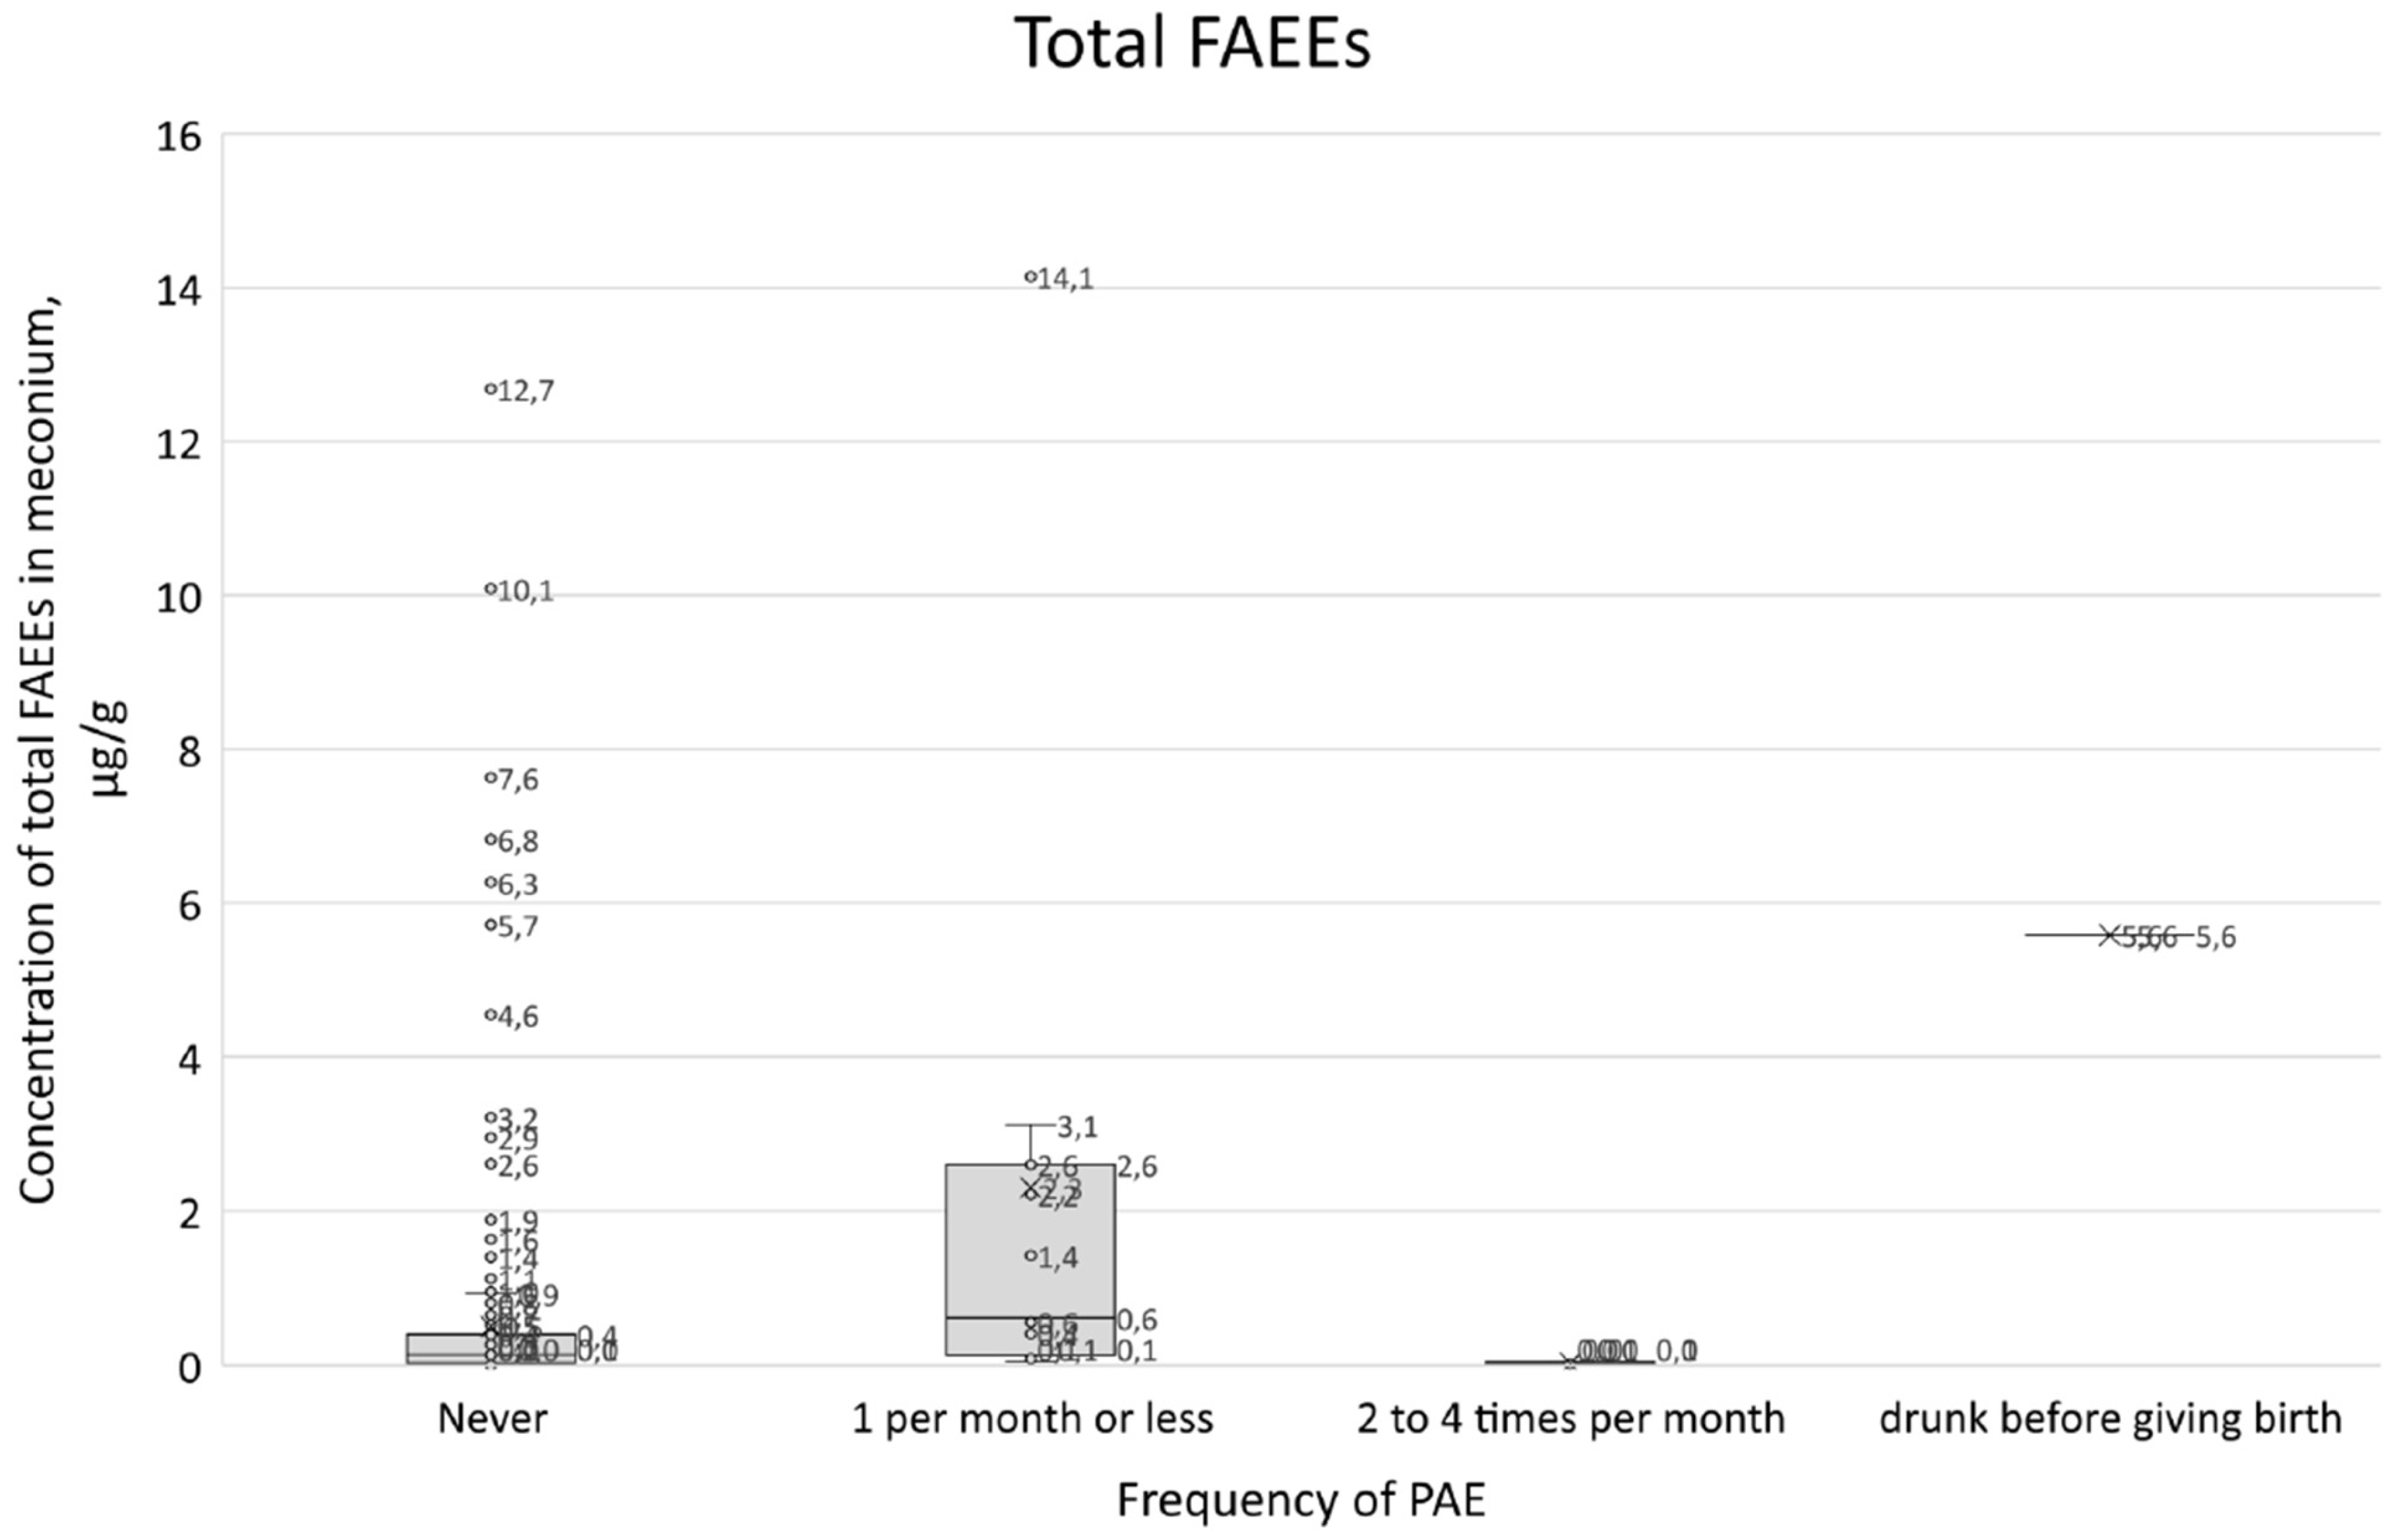
Figure 12.
Box plot showing EtS concentrations in relation to the frequency of alcohol consumption in question 21 and women who gave birth while intoxicated.
Figure 12.
Box plot showing EtS concentrations in relation to the frequency of alcohol consumption in question 21 and women who gave birth while intoxicated.
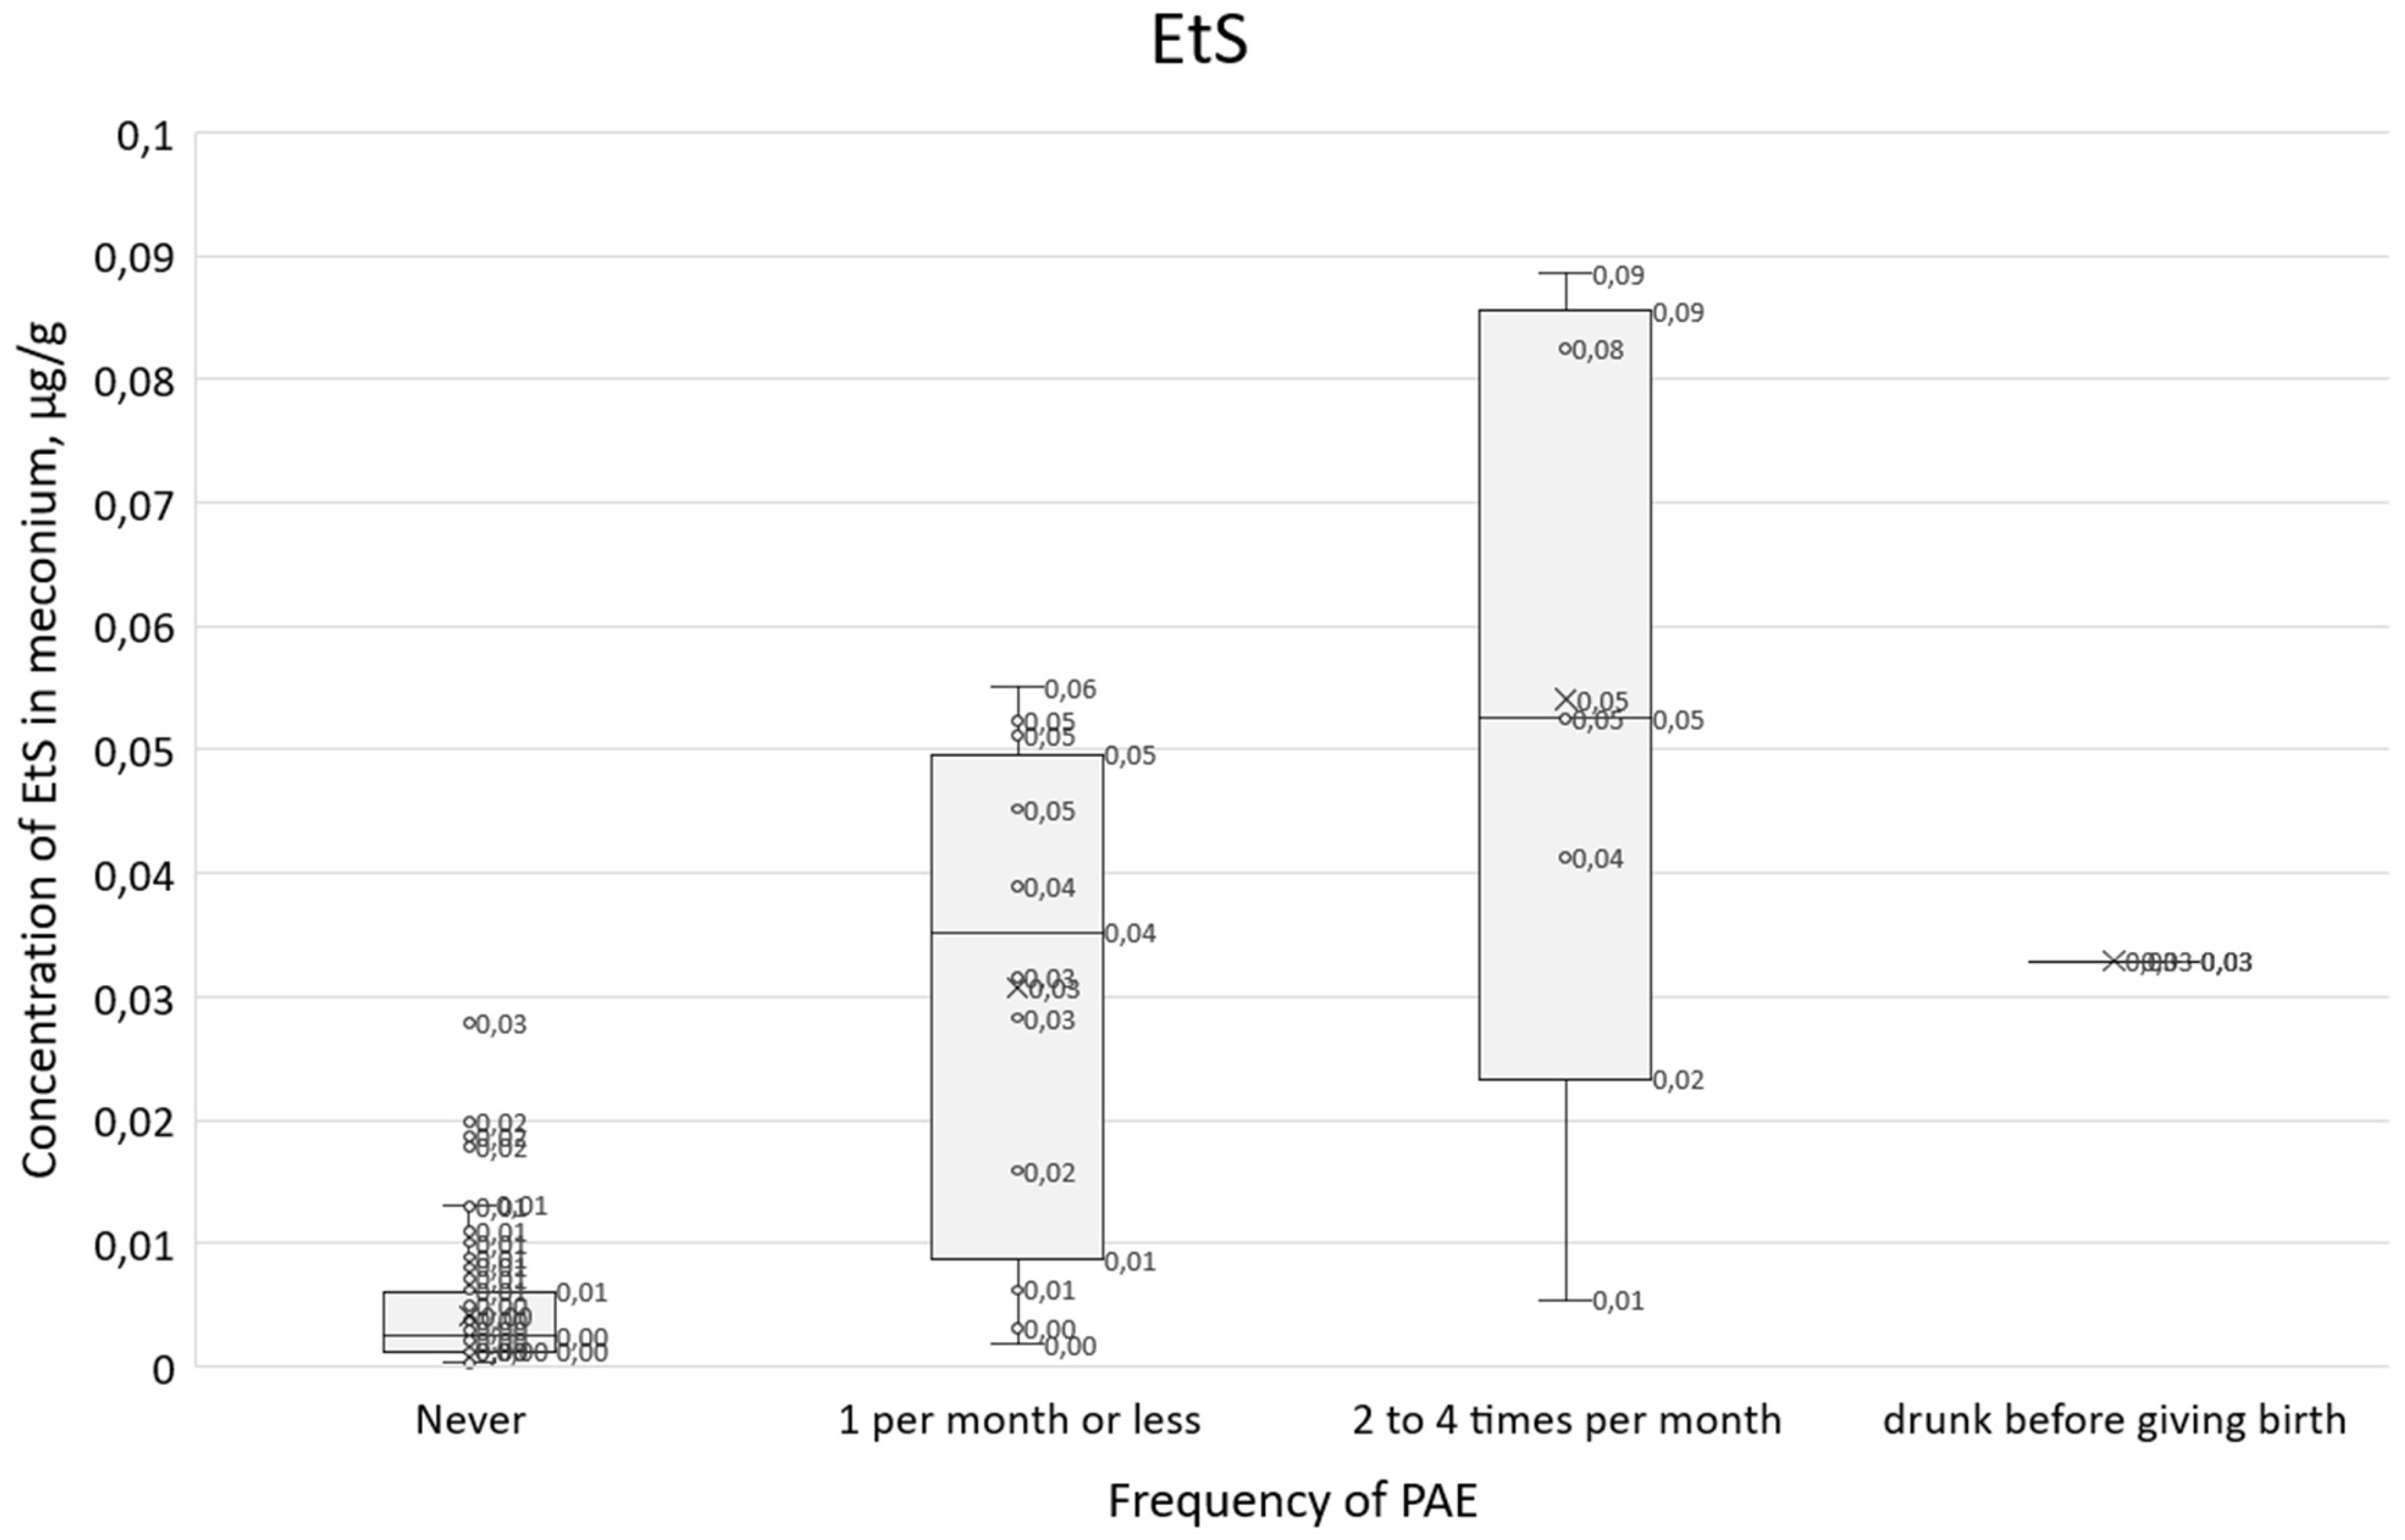
Figure 13.
Box plot showing EtG concentrations in relation to the frequency of alcohol consumption in question 21 and women who gave birth while intoxicated.
Figure 13.
Box plot showing EtG concentrations in relation to the frequency of alcohol consumption in question 21 and women who gave birth while intoxicated.
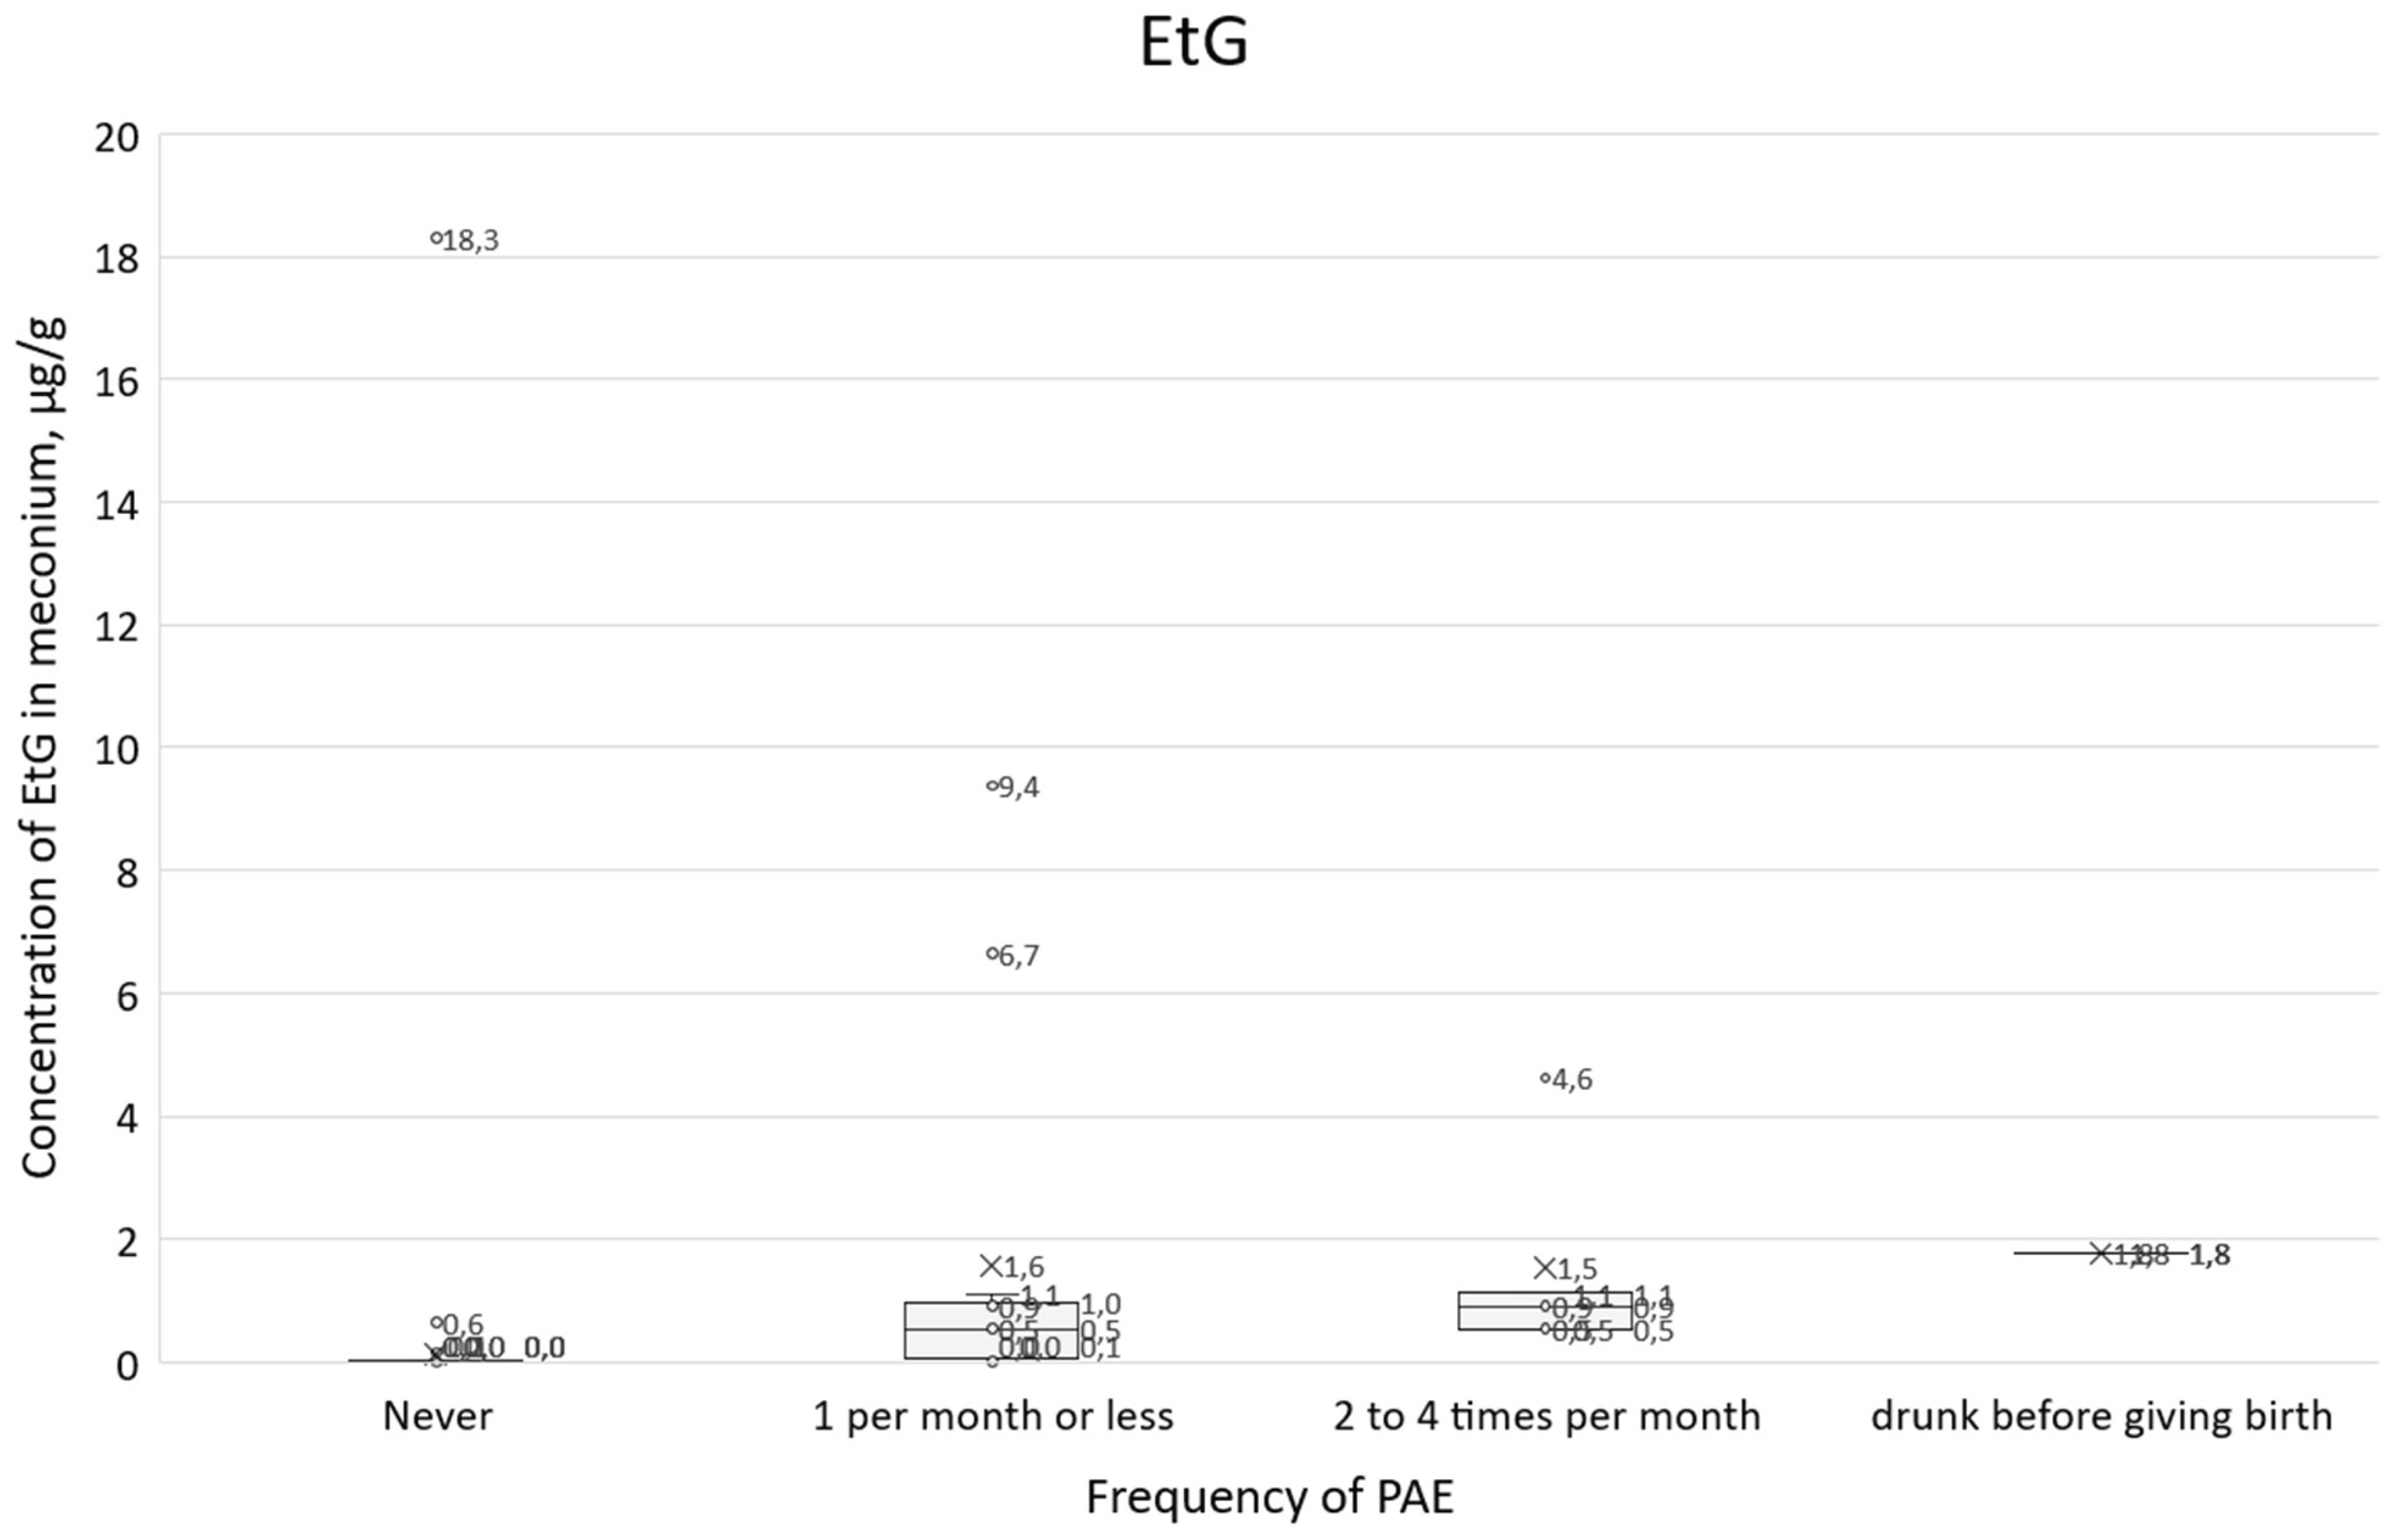

Table 1.
Prevalence of PAE based on meconium biomarkers.
| Population (author, year) |
Meconium biomarkers | Self-reported alcohol consumption | Results: cut-off, range, median of concentrations |
|---|---|---|---|
| 108 meconium samples, US Northern Plains, Cape Town, South Africa; 33 with no PAE [7] |
|
TLFB interviews |
|
| 99 meconium samples: 49 from Italy, 50 from Spain [8] |
|
Medical records |
PAE by EtS (>LOD): 19.2% in both cohorts
|
| 185 meconium samples: 80 from Italy, 105 from Spain [9] |
|
Questionnaire administered at each trimester |
|
| 177 meconium samples: 96 from Italy, 81 from Spain [10] |
|
Questionnaire |
|
| A review of studies of PAE until 31st December 2015 based on an English language database PubMed, (n=44) [11] |
Combinations of FAEEs in meconium more frequently found were: four compounds EE 16:1, EE 18:0, EE 18:1, EE 18:2 or seven compounds EE 16:0, E16:1, EE 18:0, EE 18:1, EE 18:2, EE18:3, EE 20:4. |
Mothers and their newborns whose meconium was analyzed for FAEEs. |
|
* Only samples with measurable concentration (> LLOQ) of EtG and EtS were considered for this calculation. ** To compare values with the results obtained in this study, units in nmol were recalculated for µg; 1 nmol of EtG and EtS correspond to 0.22 and 0.13 µg, respectively. Due to various mass of individual FAEEs, it is assumed that 1 nmol of FAEEs is calculated as 0.3 µg. ***Different FAEEs compounds were determined by different authors as total FAEEs.
Table 2.
Summary of chemical analysis results for FAEEs, EtS, and EtG in meconium (n=478).
| Parameter | EE 12:0 | EE 14:0 | EE 16:0 | EE 18:2 | EE 18:1 | EE 18:3 | EE 18:0 | EE 20:4 | EE 20:0 | Total FAEEs | EtS | EtG |
|---|---|---|---|---|---|---|---|---|---|---|---|---|
|
n ≥LOQ (%) |
19 (4.0) |
27 (5.6) |
92 (19.2) | 171 (35.8) | 123 (25.7) | 78 (16.3) | 38 (7.9) |
105 (22.0) | 12 (2.5) |
n/a | 150 (31.4) | 154 (32.2) |
| n LOD-LOQ (%) | 8 (1.7) |
18 (3.8) |
77 (16.1) | 27 (5.6) |
26 (5.4) |
16 (3.3) |
47 (9.8) |
17 (3.6) |
15 (3.1) |
n/a | 31 (6.5) |
22 (4.6) |
|
n <LOD (%) |
451 (94.4) | 433 (90.6) | 309 (64.6) | 280 (58.6) | 329 (68.8) | 384 (80.3) | 393 (82.2) | 356 (74.5) | 451 (94.4) | n/a | 297 (62.1) | 302 (63.2) |
| Cmin (µg/g) | 0.0051 | 0.0050 | 0.0050 | 0.0255 | 0.0075 | 0.0074 | 0.0052 | 0.0253 | 0.0078 | 0.0018 | 0.0010 | 0.0026 |
| Cmax (µg/g) | 0.6804 | 1.1210 | 2.0050 | 4.8360 | 8.7170 | 4.3600 | 0.7560 | 6.5000 | 0.0878 | 14.1468 | 14.49 | 22.90 |
| Caverage (µg/g) | 0.1577 | 0.1323 | 0.1244 | 0.3086 | 0.3542 | 0.1620 | 0.0882 | 0.3892 | 0.0302 | 0.6297 | 0.1054 | 0.4842 |
| SD (µg/g) | 0.2355 | 0.2652 | 0.3074 | 0.5151 | 1.1194 | 0.5680 | 0.1597 | 0.8046 | 0.0260 | 1.7374 | 1.1825 | 2.5403 |
| Cmedian (µg/g) | 0.0210 | 0.0227 | 0.0222 | 0.1802 | 0.0321 | 0.0228 | 0.0175 | 0.1520 | 0.0192 | 0.1382 | 0.0037 | 0.0123 |
| LOD (µg/g) | 0.0010 | 0.0008 | 0.0012 | 0.0075 | 0.0025 | 0.0021 | 0.0013 | 0.0074 | 0.0020 | n/a | 0.0002 | 0.0008 |
| LOQ (µg/g) | 0.0030 | 0.0024 | 0.0036 | 0.0225 | 0.0075 | 0.0063 | 0.0039 | 0.0222 | 0.0060 | n/a | 0.0006 | 0.0024 |
Table 3.
Summary of cases of alcohol consumption during pregnancy declared in the questionnaires (answers to questions 21-24) and measured concentrations of PAE biomarkers in meconium.
Table 3.
Summary of cases of alcohol consumption during pregnancy declared in the questionnaires (answers to questions 21-24) and measured concentrations of PAE biomarkers in meconium.
| No. | Frequency of alcohol consumption or circumstances of childbirth (no. 21) | Type of alcohol during pregnancy (no. 22) |
Trimester with alcohol drinking (no. 23) | How much alcohol at one time (no. 24) | Total FAEEs, µg/g | EtS, µg/g | EtG, µg/g | ||||
|---|---|---|---|---|---|---|---|---|---|---|---|
| Wine (n=14) |
Beer (n=8) |
Vodka (n=1) |
1st (n=8) |
2nd (n=7) | 3rd (n=10) | (n=16) | |||||
| 16 | Never (n=4) |
- | + | - | - | - | - | - | n.d. | n.d. | n.d. |
| 54 | + | + | + | + | - | - | c)** | 0.06244 | n.d. | 0.02102 | |
| 166 | - | + | - | - | - | + | - | 0.5274 | 0.0181 | 0.0647 | |
| 405 | - | + | - | + | - | - | a)*** | n.d. | 0.0031 | n.d. | |
| 4 | 1 per month or less (n=15) | + | - | - | - | + | + | a) | 0.5601 | 0.0389 | 0.6870 |
| 42 | + | - | - | + | + | + | a) | 3.1193 | 0.0452 | 0.9653 | |
| 55 | - | - | - | - | - | + | - | 14.1468 | 0.0062 | 0.0649 | |
| 65 | - | + | - | - | - | + | - | 0.1298 | 0.0315 | 0.1372 | |
| 186 | + | + | - | + | - | - | a) | n.d. | n.d. | n.d. | |
| 190 | - | - | - | - | - | - | - | n.d. | 0.0018 | 0.0041 | |
| 193 | - | + | - | + | - | - | - | n.d. | n.d. | n.d. | |
| 233 | - | - | - | - | - | + | a) | 0.4082 | n.d. | 0.0116 | |
| 244 | + | - | - | - | + | + | a) | 0.0829 | 0.0394 | 0.9175 | |
| 257 | - | - | - | - | - | - | - | 0.0522 | n.d. | 0.0048 | |
| 258 | - | - | - | - | - | - | - | 2.2148 | 0.0159 | 9.3790 | |
| 278 | + | - | - | - | - | + | a) | 2.6033 | 0.0283 | 1.1105 | |
| 298 | + | - | - | - | + | - | c) | 1.4218 | 0.0511 | 6.6510 | |
| 390 | + | - | - | + | - | - | a) | n.d. | 0.0523 | 0.5441 | |
| 422 | + | - | - | - | + | - | a) | 0.6155 | 0.0551 | 0.0968 | |
| 94 | 2 to 4 times per month (n = 5) | + | - | - | + | - | - | a) | 0.0513 | 0.0886 | 4.6210 |
| 149 | + | - | - | - | - | - | a) | 0.0211 | 0.0054 | 0.5427 | |
| 237 | + | + | - | - | + | - | a) | 0.0018 | 0.0525 | 0.9102 | |
| 363 | + | - | - | + | + | + | a) | n.d. | 0.0825 | 1.1244 | |
| 407 | + | - | - | - | - | + | a) | n.d. | 0.0413 | 0.5315 | |
| 350 | drunk before giving birth* | n/a | n/a | n/a | n/a | n/a | n/a | n/a | 5.5832 | 0.0329 | 1.7700 |
| 1 | alcohol until the 20th week of pregnancy* | n/a | n/a | n/a | n/a | n/a | n/a | n/a | 11.5971 | 14.4900 | 22.8950 |
* the questionnaire was not completed, and the PAE was due to the circumstances of the birth. ** c) - 3 small beers, or 3 glasses of wine, or 3 glasses of vodka, or 3 cocktails. *** a) - 1 small beer, or 1 glass of wine, or 1 glass of vodka, or 1 cocktail.
Table 4.
Contingency table with the variables ‘Exposure’ (EtS) and declared ‘alcohol consumption’ in the questionnaires (question no. 21).
Table 4.
Contingency table with the variables ‘Exposure’ (EtS) and declared ‘alcohol consumption’ in the questionnaires (question no. 21).
| no consumption | alcohol consumption | |
|---|---|---|
| no exposure | 336 | 4 |
| exposure | 118 | 16 |
Table 5.
Comparison of the calculated CBI2 score with survey responses on alcohol consumption in questions 21, 23, and 24.
Table 5.
Comparison of the calculated CBI2 score with survey responses on alcohol consumption in questions 21, 23, and 24.
| No of sample | Answer to question 21 (n=20) | CBI2 |
|---|---|---|
| 4 | once a month or less frequently | 47 |
| 42 | once a month or less frequently | 62 |
| 55 | once a month or less frequently | 5 |
| 65 | once a month or less frequently | 17 |
| 94 | 2-4/month | 259 |
| 149 | 2-4/month | 29 |
| 186 | once a month or less frequently | 0 |
| 190 | once a month or less frequently | 1 |
| 193 | once a month or less frequently | 0 |
| 233 | once a month or less frequently | 1 |
| 237 | 2-4/month | 62 |
| 244 | once a month or less frequently | 58 |
| 257 | once a month or less frequently | 0 |
| 258 | once a month or less frequently | 474 |
| 278 | once a month or less frequently | 64 |
| 298 | once a month or less frequently | 349 |
| 363 | 2-4/month | 82 |
| 390 | once a month or less frequently | 44 |
| 407 | 2-4/month | 39 |
| 422 | once a month or less frequently | 22 |
| No | Answer to question 23 (n=8) | CBI2 |
| 42 | Alcohol consumption in the 1st trimester | 62 |
| 54 | 1 | |
| 94 | 259 | |
| 186 | 0 | |
| 193 | 0 | |
| 363 | 82 | |
| 390 | 44 | |
| 405 | 1 | |
| No | Answer to question 23 (n=7) | CBI2 |
| 4 | Alcohol consumption in the 2nd trimester | 47 |
| 42 | 62 | |
| 237 | 62 | |
| 244 | 58 | |
| 298 | 349 | |
| 363 | 82 | |
| 422 | 22 | |
| No | Answer to question 23 (n=8) | CBI2 |
| 4 | Alcohol consumption in the 3rd trimester | 47 |
| 42 | 62 | |
| 55 | 5 | |
| 65 | 17 | |
| 166 | 9 | |
| 233 | 1 | |
| 244 | 58 | |
| 407 | 39 | |
| No | Answer to question 24 (n=16) | CBI2 |
| 4 | 1 small beer or 1 glass of wine, or 1 shot of vodka, or 1 cocktail | 47 |
| 42 | 1 small beer or 1 glass of wine, or 1 shot of vodka, or 1 cocktail | 62 |
| 54 | 3 małe piwa lub 3 lampki wina, lub 3 kieliszki wódki, lub 3 drink | 1 |
| 94 | 1 small beer or 1 glass of wine, or 1 shot of vodka, or 1 cocktail | 259 |
| 149 | 1 small beer or 1 glass of wine, or 1 shot of vodka, or 1 cocktail | 29 |
| 186 | 1 small beer or 1 glass of wine, or 1 shot of vodka, or 1 cocktail | 0 |
| 233 | 1 small beer or 1 glass of wine, or 1 shot of vodka, or 1 cocktail | 1 |
| 237 | 1 small beer or 1 glass of wine, or 1 shot of vodka, or 1 cocktail | 62 |
| 244 | 1 small beer or 1 glass of wine, or 1 shot of vodka, or 1 cocktail | 58 |
| 278 | 1 small beer or 1 glass of wine, or 1 shot of vodka, or 1 cocktail | 64 |
| 298 | 3 małe piwa lub 3 lampki wina, lub 3 kieliszki wódki, lub 3 drink | 349 |
| 363 | 1 small beer or 1 glass of wine, or 1 shot of vodka, or 1 cocktail | 82 |
| 390 | 1 small beer or 1 glass of wine, or 1 shot of vodka, or 1 cocktail | 44 |
| 405 | 1 small beer or 1 glass of wine, or 1 shot of vodka, or 1 cocktail | 1 |
| 407 | 1 small beer or 1 glass of wine, or 1 shot of vodka, or 1 cocktail | 39 |
| 422 | ‘a’ or ‘c’ answer to no. 24 | 22 |
Table 6.
Summary of chemical analysis results CBI2 ≥ 5 and CBI2 < 5 and answers to survey questions 21, 23, and 24 (based on Table 5).
Table 6.
Summary of chemical analysis results CBI2 ≥ 5 and CBI2 < 5 and answers to survey questions 21, 23, and 24 (based on Table 5).
| Question no | CBI2 ≥ 5 (positive) | CBI2 < 5 (negative) | ||
|---|---|---|---|---|
| range | n | range | n | |
| 21 | - 1/month or less frequently: 5-474 - 2-4/month: 29-259 |
10 5 |
- 1 month or less: 0-1 - 2-4/month: none |
5 0 |
| 23 | - PAE in the 1st trimester: 44-259 - PAE in the 2nd trimester: 22-349 - PAE in the 3rd trimester: 5-62 |
4 7 7 |
- PAE in the 1st trimester: 0-1 - PAE in the 2nd trimester: none - PAE in the 3rd trimester: 1 |
4 0 1 |
| 24 | - 1 small beer or 1 glass of wine, or 1 shot of vodka, or 1 cocktail: 29-259 - 3 small beers or 3 glasses of wine, or 3 shots of vodka, or 3 cocktails: 22-349 |
10 2 |
- 1 small beer or 1 glass of wine, or 1 shot of vodka, or 1 cocktail: 0-1 - 3 small beers or 3 glasses of wine, or 3 shots of vodka, or 3 cocktails: 1 |
3 1 |
Disclaimer/Publisher’s Note: The statements, opinions and data contained in all publications are solely those of the individual author(s) and contributor(s) and not of MDPI and/or the editor(s). MDPI and/or the editor(s) disclaim responsibility for any injury to people or property resulting from any ideas, methods, instructions or products referred to in the content. |
© 2025 by the authors. Licensee MDPI, Basel, Switzerland. This article is an open access article distributed under the terms and conditions of the Creative Commons Attribution (CC BY) license (http://creativecommons.org/licenses/by/4.0/).
Copyright: This open access article is published under a Creative Commons CC BY 4.0 license, which permit the free download, distribution, and reuse, provided that the author and preprint are cited in any reuse.


