Submitted:
11 December 2025
Posted:
12 December 2025
Read the latest preprint version here
Abstract
Calcium signaling dysfunction is a central contributor to neuronal hyperexcitability and seizure propagation in epilepsy, yet the intracellular mechanisms underlying the actions of valproic acid (VPA) remain incompletely understood. In this study, we investigated whether VPA modulates calcium homeostasis at the level of the endoplasmic reticulum (ER) and how this action influences cytosolic calcium dynamics associated with epileptiform activity. ER calcium levels were directly measured using ER-targeted aequorin in HeLa and PC12 cells, while cytosolic Ca²⁺ signals were monitored by fura-2 fluorescence imaging in bovine chromaffin cells exposed to veratridine, a model of sustained sodium channel activation and calcium oscillations. VPA induced a concentration-dependent release of Ca²⁺ from the ER, with an IC₅₀ of approximately 17 µM. This effect was preserved in permeabilized cells and exhibited activation kinetics comparable to those elicited by inositol 1,4,5-trisphosphate (InsP₃). Pharmacological inhibition of InsP₃ receptors (InsP₃Rs), but not ryanodine receptors or SERCA, abolished VPA-induced ER Ca²⁺ release, supporting a selective InsP₃R-mediated mechanism. Functionally, VPA suppressed the repetitive cytosolic Ca²⁺ oscillations induced by veratridine, while simultaneously producing a sustained elevation of cytosolic Ca²⁺ originating from ER stores and facilitating depolarization-evoked catecholamine secretion. Together, these results support the conclusion that VPA acts as a novel functional agonist of InsP₃Rs and identify ER Ca²⁺ mobilization as a previously unrecognized intracellular mechanism contributing to its modulatory effects on calcium signaling and excitability in epilepsy.
Keywords:
valproic acid
; InsP3 receptor activation
; endoplasmic reticulum Ca²⁺ release
; intracellular calcium signaling
; cytosolic Ca²⁺ dynamics
; ER calcium homeostasis
; aequorin
; fura-2
1. Introduction
Epilepsy is a chronic neurological disorder characterized by recurrent seizures arising from abnormal, synchronized neuronal discharges. The pathophysiology of epilepsy involves a complex interplay of excitatory and inhibitory mechanisms in the brain, where calcium ions (Ca²⁺) play a fundamental regulatory role. Intracellular calcium fluctuations are essential for neuronal excitability, neurotransmitter release, gene expression, and synaptic plasticity processes such as long-term potentiation [1,2]. However, prolonged or excessive increases in intracellular calcium concentration ([Ca²⁺]ᶜ) can trigger excitotoxicity, mitochondrial dysfunction, and neuronal death—processes implicated in the onset and progression of epilepsy [3,4,5].
In neurons, Ca²⁺ homeostasis is tightly regulated through fluxes between the cytosol and internal stores, primarily the endoplasmic reticulum (ER). Two families of calcium-release channels coordinate these movements: the inositol 1,4,5-trisphosphate receptor (InsP₃R) and the ryanodine receptor (RyR) [6,7]. InsP₃R-mediated Ca²⁺ release plays a central role in the generation of intracellular Ca²⁺ waves, which influence synaptic activity, dendritic integration, and gene transcription [8]. Perturbations in InsP₃R and RyR function have been linked to epileptogenesis and neuronal hyperexcitability [9]. Despite this, the potential modulation of intracellular Ca²⁺ stores by antiepileptic drugs remains insufficiently explored.
Valproic acid (VPA) is one of the most widely prescribed broad-spectrum antiepileptic drugs, effective against generalized and focal seizures, as well as in bipolar disorder and migraine prophylaxis. Its primary mechanisms of action have traditionally been associated with the potentiation of γ-aminobutyric acid (GABA) neurotransmission [10,11], the modulation of glutamate uptake [12], and the inhibition of voltage-dependent sodium and T-type calcium channels [13,14,15,16,17]. Additional studies have also suggested neuroprotective roles for VPA in reducing ER stress and lipid accumulation [18,21]. Yet, despite over six decades of clinical use, the precise molecular targets that mediate its anticonvulsant and neuroregulatory properties remain incompletely defined.
The ER is increasingly recognized as a key modulator of neuronal Ca²⁺ signaling and excitability [22]. Among the intracellular signaling systems regulating Ca²⁺ dynamics, the inositol 1,4,5-trisphosphate receptor (IP₃R), located on the membrane of the endoplasmic reticulum (ER), plays a pivotal role in mobilizing Ca²⁺ from internal stores to the cytosol and nucleus [22,23,24]. The ER constitutes the major intracellular Ca²⁺ reservoir, maintaining distinct subcompartments of high and low Ca²⁺ concentrations that are tightly regulated to ensure proper signaling and neuronal viability [25,26,27].
The activation of IP₃Rs by phospholipase C-derived IP₃ results in finely tuned Ca²⁺ release events, which contribute to the generation of local and global Ca²⁺ waves that control neurotransmitter exocytosis and synaptic efficiency [28,29,30]. Moreover, the existence of different IP₃R isoforms with tissue-specific distribution and functional diversity further refines this regulation, allowing neurons to adapt their Ca²⁺ signaling patterns to physiological and pathological stimuli [31,32].
Dysregulation of IP₃-mediated Ca²⁺ release has been implicated in several neuropathological conditions, including excitotoxicity, ER stress, and epileptogenesis. Alterations in ER Ca²⁺ homeostasis can modify synaptic strength and neuronal excitability, thereby contributing to seizure propagation. Understanding how pharmacological agents, particularly antiepileptic drugs, interact with IP₃R-dependent Ca²⁺ release pathways is therefore crucial for elucidating their cellular mechanisms of action and for developing novel therapeutic strategies targeting Ca²⁺ signaling in the nervous system.
Research using genetically encoded aequorin targeted to the ER has demonstrated that VPA induces Ca²⁺ release from InsP₃-sensitive stores in a concentration-dependent manner, with an IC₅₀ of approximately 17 µM, and kinetics strikingly similar to the second messenger InsP₃ [23,24,25,26]. Pharmacological blockade of InsP₃R with heparin or 2-aminoethyl diphenylborinate (2-APB) abolishes this effect, supporting the hypothesis that VPA acts as a novel InsP₃R agonist. Moreover, studies in PC12 neuronal-like cells and bovine chromaffin cells revealed that VPA enhances catecholamine release and modulates ER Ca²⁺ signaling without affecting RyR-mediated pathways [25,26,27,28,29,30]. These intracellular actions suggest that VPA can directly influence synaptic release machinery through modulation of ER Ca²⁺ dynamics.
Nevertheless, the relationship between VPA’s intracellular effects and its clinical efficacy remains controversial. While therapeutic concentrations of VPA suppress epileptiform activity in some models [14], paradoxical pro-epileptic effects have been reported in others [31,32,33], potentially reflecting patient-dependent variations in InsP₃R sensitivity or downstream Ca²⁺ signaling. This duality may contribute to phenomena such as pharmacoresistance or idiosyncratic adverse responses in certain epileptic individuals.
Taken together, these findings highlight the need to further elucidate the intracellular mechanisms underlying VPA’s actions. The present study was designed to investigate how VPA modulates Ca²⁺ homeostasis at the level of the ER, focusing on its interaction with InsP₃R and subsequent effects on neurotransmitter release. Understanding these mechanisms could provide a unifying framework linking VPA’s antiepileptic efficacy, its side-effect profile, and the cellular basis of variable patient responses. As far as we know, VPA has not been found yet to be implicated directly in the regulation of Ca2+ homeostasis at the ER level. We have therefore approached such a study here. Our findings suggest that VPA caused the release of Ca2+ from intracellular stores through a mechanism reminding of InsP3.
2. Materials and Methods
HeLa Cell Culture and Transfection
HeLa cells were cultured in Dulbecco’s Modified Eagle’s Medium (DMEM) supplemented with 10% fetal calf serum (FCS). For transfection, cells were seeded onto 13 mm glass coverslips and grown to 60–70% confluence. Transfection was performed using 4 µg of plasmid DNA encoding the genetically engineered photoprotein aequorin. The mutated aequorin with low Ca²⁺ affinity targeted to the endoplasmic reticulum (erAEQ) was employed, as described previously [34]. Transfection was achieved using the calcium phosphate method [35] Experiments aimed at measuring changes in endoplasmic reticulum calcium concentration ([Ca²⁺]ER) were carried out 36 h post-transfection.
PC12 Cell Culture and Transfection
PC12 cells were maintained in DMEM supplemented with 7.5% fetal calf serum, 7.5% horse serum, 2 mM glutamine, 25 U/mL penicillin, and 25 µg/mL streptomycin. Cells were seeded on 13 mm poly-L-lysine-coated glass coverslips in 24-well plates and allowed to reach 60–70% confluence after 24 h at 37 °C in a humidified 5% CO₂ atmosphere. Transfection with the erAEQ plasmid was achieved using Metafectene (Biontex Laboratories) [36]. Measurements of [Ca²⁺]ER were performed 36–48 h after transfection.
Bovine Adrenal Chromaffin Cell Culture
Bovine chromaffin cells (BCCs) were isolated according to standard procedures with minor [37]. Cells were suspended in DMEM containing 5% FCS, 50 IU/mL penicillin, and 50 µg/mL streptomycin. For secretion experiments, 5 × 10⁶ cells were plated in 5 cm Petri dishes and maintained at 37 °C in a 5% CO₂/95% air atmosphere. Cells were used between 1 and 5 days after plating.
Measurement of [Ca²⁺]ER Changes with Aequorin
Two experimental conditions were used:
(a) Intact cells: The monolayer was superfused with Krebs–Hepes buffer for HeLa (KHBH) containing (in mM): 125 NaCl, 5 KCl, 1 Na₃PO₄, 1 MgSO₄, 5.5 glucose, and 20 HEPES, pH 7.4, at room temperature (24 ± 2 °C), supplemented with 1 mM CaCl₂.
(b) Permeabilized cells: An intracellular-like buffer (IB) was used containing (in mM): 140 KCl, 10 NaCl, 1 K₃PO₄, 10 HEPES, 1 MgCl₂, 1 ATP, 5 succinate, and 20 µM ADP, pH 7.0, supplemented with 0.5 µM CaCl₂.
Reconstitution of ER-targeted aequorin was achieved by incubating cells for 1–2 h in KHBH or KHBPC12 supplemented with 5 µM coelenterazine n, 5 µM ionomycin, and 600 µM EGTA. After loading, cells were washed with buffer containing 2% bovine serum albumin (BSA) and 1 mM EGTA. During experiments, 1 mM CaCl₂, histamine, VPA, CPA, DTN, caffeine, and 2-APB were added as indicated in figure legends. Permeabilization was performed using 100 µM digitonin for 30 s. IB buffer containing 0 Ca²⁺/100 µM EGTA was applied until stabilization, followed by IB containing 0.5 µM Ca²⁺. Luminescence was measured using a purpose-built luminometer. Calibration to [Ca²⁺] was achieved by adding excess Ca²⁺ (10 mM) in KHBH or KHBPC12 supplemented with 100 µM digitonin to expose the aequorin to maximal Ca²⁺.
On-Line Measurement of Catecholamine Release
Cells were gently detached using a rubber policeman and centrifuged at 800 rpm for 10 min. The pellet was resuspended in Krebs–Hepes buffer containing (in mM): 144 NaCl, 5.9 KCl, 1.2 MgCl₂, 11 glucose, 10 HEPES, and 1 Ca²⁺ (pH 7.4). The suspension was placed in a jacketed microchamber superfused at 2 mL/min at room temperature. Catecholamine secretion was continuously monitored “on-line” by an electrochemical detector (Metrohm AG CH-9100, Herisau, Switzerland) operating in amperometric mode[38] . Secretion was evoked by 5 s pulses of high K⁺ (75 mM) every 2 min.
Single-Cell [Ca²⁺]c Measurements
Single-cell [Ca²⁺]c was determined at room temperature in fura-2–loaded cells as described previously [39]. Excitation wavelengths were alternated between 340 and 380 nm, and emitted light at 520 nm was collected and analyzed using CellR® software (Olympus). Data were expressed as the fluorescence ratio F340/F380.
Chemicals
Coelenterazine n was obtained from Labnet Biotecnica (Madrid, Spain). CPA, histamine, InsP₃, VPA, veratridine (VTD), dantrolene (DTN), 2-APB, caffeine, and heparin were purchased from Sigma-Aldrich (Madrid, Spain). Fura-2 was from Molecular Probes. The cDNA encoding ER-targeted aequorin was a generous gift from Prof. Javier Alvarez.
Statistics
Values are expressed as mean ± SE. Statistical significance was determined using one-way ANOVA. Differences were considered significant at p < 0.05.
Results
Valproic Acid Induces Ca²⁺ Release from the Endoplasmic Reticulum
After aequorin reconstitution with coelenterazine in ER-depleted conditions, the experiments were initiated by perfusing HeLa cells with a medium containing 1 mM Ca²⁺ to allow ER refilling (Figure 1a). Complete ER refilling required 30–60 s, reaching a steady-state [Ca²⁺]ER of 570.53 ± 17.52 µM. When histamine (100 µM) was applied for 2 min, the expected Ca²⁺ release from the ER occurred, decreasing [Ca²⁺]ER from approximately 600 µM to 400 µM (Figure 1a). Application of VPA (3 µM) produced a similar effect, reducing [Ca²⁺]ER from 600 to 470 µM (Figure 1b), corresponding to a 37.36 ± 0.01% decrease. This effect was reversible. The concentration–response curve (Figure 1d) revealed a threshold at 3 µM and a maximal effect between 30–100 µM (approximately 55% ER release). The calculated IC₅₀ value was approximately 17 µM.
ER Ca²⁺ Release Elicited by VPA in Permeabilized HeLa Cells
To determine whether VPA acted via plasma membrane receptors or directly on intracellular targets, experiments were performed on digitonin-permeabilized HeLa cells expressing erAEQ. Following permeabilization with 100 µM digitonin, cells were superfused with intracellular buffer (IB) to obtain a stable baseline, after which ER refilling was achieved using 0.5 µM Ca²⁺. Application of InsP₃ (5 µM) triggered a decrease in [Ca²⁺]ER from 600 µM to 300 µM (Figure 2a). VPA (10 µM) also induced a reversible ER Ca²⁺ release (data not shown). Averaged results (Figure 2b) showed that InsP₃ and VPA released 49.26 ± 0.01% and ~25% of ER Ca²⁺, respectively. The activation time constants (τact) for VPA- and InsP₃-elicited Ca²⁺ release were comparable (Figure 2c), indicating similar kinetics.
Comparison of the Kinetics of ER Ca²⁺ Release Induced by CPA and VPA
To further understand the mechanism of VPA-induced ER Ca²⁺ release, its effect was compared with that of cyclopiazonic acid (CPA), a well-known inhibitor of the sarco/endoplasmic reticulum Ca²⁺-ATPase (SERCA). CPA (30 µM) decreased [Ca²⁺]ER from 530 µM to 330 µM, corresponding to a 32.94 ± 0.10% release (Figure 3c). Lower concentrations of CPA (3 and 10 µM) elicited 11.74 ± 0.13% and 20.11 ± 0.15% Ca²⁺ release, respectively. In parallel experiments, VPA (3, 10, and 30 µM) produced 21.43 ± 0.10%, 37.36 ± 0.10%, and 51.10 ± 0.67% ER Ca²⁺ depletion, respectively (Figure 3b, c). Notably, VPA caused significantly faster ER Ca²⁺ release compared to CPA. The activation time constants (τact) for CPA were 94.41 ± 28.63 s (3 µM), 64.97 ± 2.89 s (10 µM), and 49.15 ± 1.08 s (30 µM), whereas for VPA they were 23.18 ± 2.12 s (3 µM), 25.66 ± 1.83 s (10 µM), and 32.06 ± 1.06 s (30 µM) (Figure 3d).
[Ca²⁺]ER Is Unaffected by 2-APB and Heparin
To directly assess the involvement of the InsP₃ receptor (InsP₃R) in VPA-induced ER Ca²⁺ release, the InsP₃R inhibitors 2-aminoethyl diphenylborinate (2-APB) and heparin were used. Pre-incubation with 10 µM 2-APB for 2 min abolished the VPA (10 µM)-induced ER Ca²⁺ release (Figure 4a). Similarly, in permeabilized HeLa cells, superfusion with 200 µg/mL heparin for 2 min before VPA application prevented any detectable change in [Ca²⁺]ER (Figure 4b). The inhibitory effects of both agents are summarized in Figure 4c, confirming that VPA acts through InsP₃-sensitive Ca²⁺ stores.
VPA Releases Ca²⁺ via InsP₃R in PC12 Cells
To examine the specificity of VPA action on InsP₃R, experiments were performed in PC12 cells, which express both InsP₃R and RyR, as well as voltage-dependent calcium channels (VDCCs) of the L- and N-type. Activation of VDCCs by depolarization with high K⁺ induces Ca²⁺ release through RyR. In ER-depleted PC12 cells expressing erAEQ, reintroduction of 1 mM Ca²⁺ restored [Ca²⁺]ER (Figure 5a). Subsequent perfusion with high K⁺ or VPA (10 µM) elicited ER Ca²⁺ release via RyR or InsP₃R, respectively. Co-application of caffeine (CAF) and VPA further enhanced ER Ca²⁺ release (Figure 5b). Dantrolene (DTN) (100 µM), an RyR inhibitor, abolished Ca²⁺ release triggered by K⁺ depolarization (Figure 5c) but not that induced by VPA (Figure 5d), confirming that VPA acts selectively on InsP₃R-mediated pathways.
VPA Mitigates Intracellular Ca²⁺ Oscillations Induced by Veratridine
Given VPA’s clinical use in epilepsy, we investigated whether its ER Ca²-releasing effect modulates veratridine (VTD)-induced cytosolic Ca²⁺ oscillations, a cellular model of epileptiform activity. Application of VTD (50 µM) evoked rhythmic Ca²⁺ oscillations in fura-2–loaded bovine chromaffin cells (BCCs) (Figure 6a, b). Superfusion with VPA (30 µM) abolished these oscillations (Figure 6c) while simultaneously increasing basal [Ca²⁺]c. Thus, VPA suppresses VTD-induced Ca²⁺ oscillations, likely by releasing Ca²⁺ from ER stores.
Panel a shows a row of images with the region of interest (roi) of [Ca2+]c peak caused upon high K+ (75 mM) depolarization, followed by Ca2+ oscillations produced by VTD (as shown in horizontal bar) in the control solution. The pseudocolor scale indicates the increase in [Ca2+]c. Original traces in the absence (b) and in the presence of VPA (c) using the protocol described in panel a. Horizontal bars at the bottom of the figure represent the application of the compounds. Experiments are representative of 3 to 6 of each type.
VPA Facilitates Catecholamine Release in Bovine Chromaffin Cells
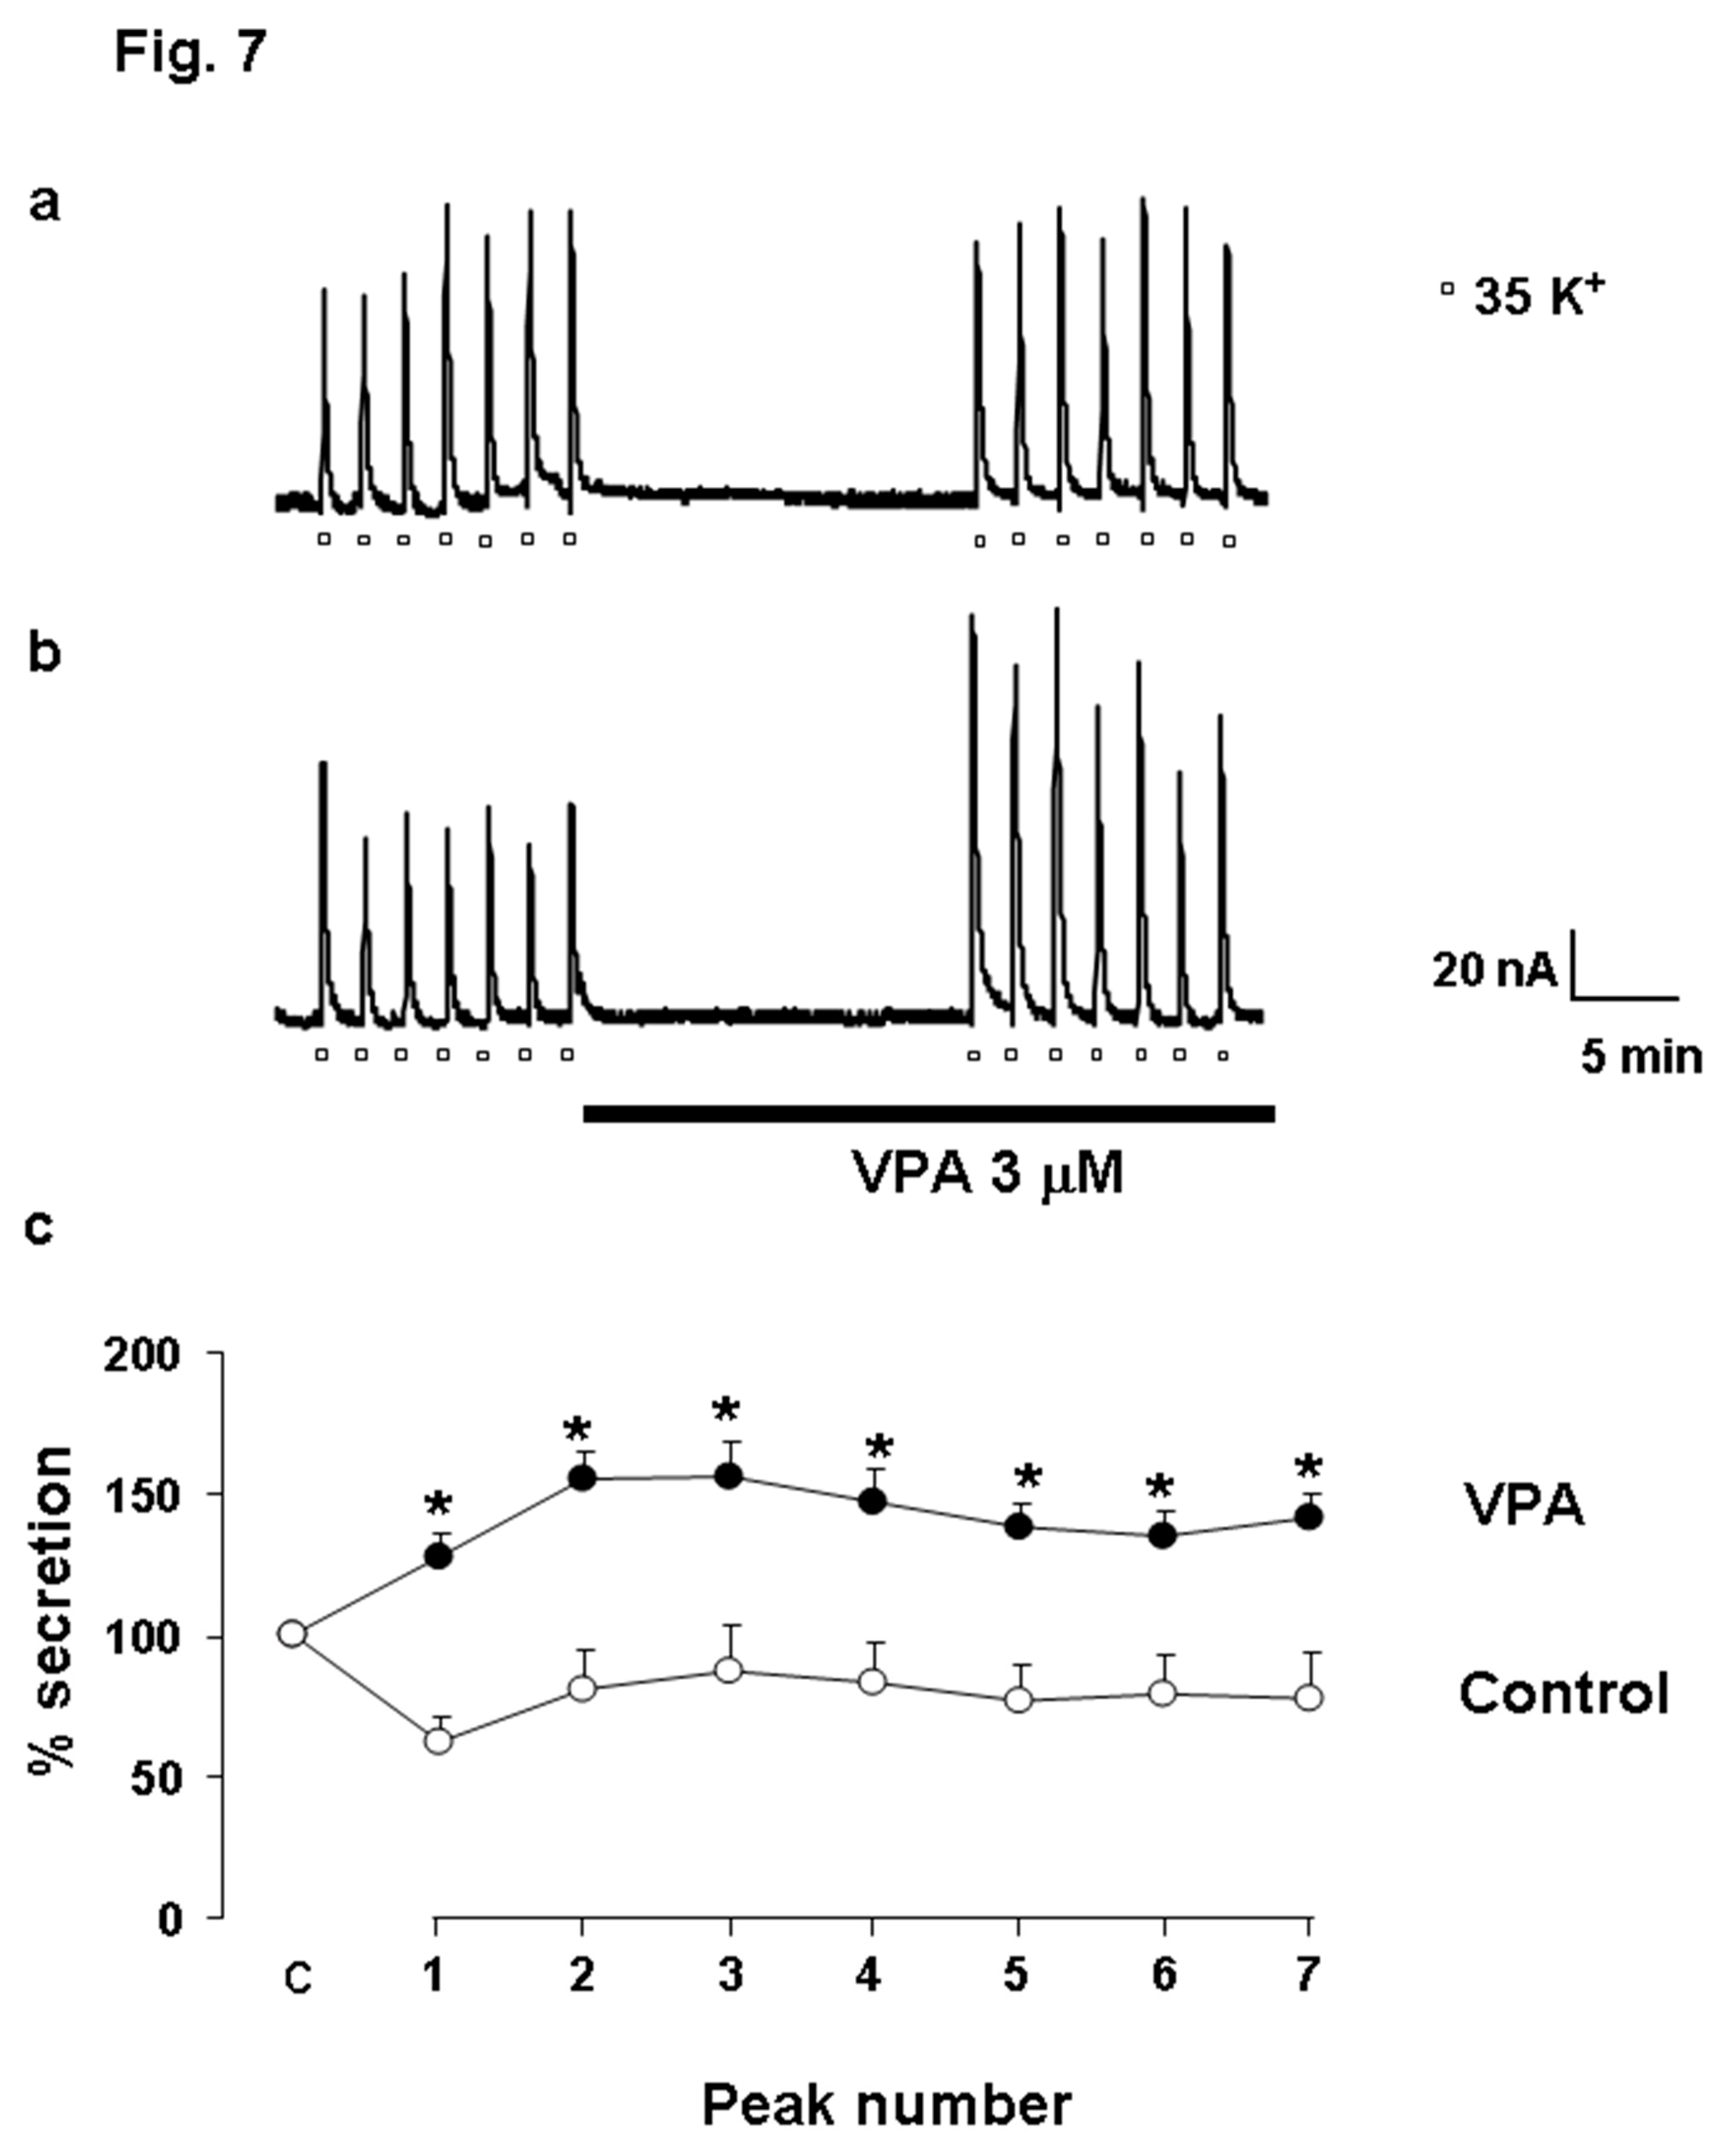
To evaluate the functional consequences of VPA-induced ER Ca²⁺ release on neurotransmitter exocytosis, catecholamine secretion was measured in fast-superfused BCCs. Depolarization with 35 mM K⁺ for 5 s every 2 min evoked reproducible catecholamine release peaks averaging 80–90 nA (Figure 7a). Following 15 min of Krebs–Hepes superfusion, the mean peak value was 122.19 ± 4.31 nA. In the presence of VPA (3 µM), the average peak amplitude increased significantly to 198.20 ± 4.81 nA (Figure 7b). Data from eight independent experiments confirmed that VPA potentiated K⁺-evoked catecholamine release (Figure 7c), suggesting that ER Ca²⁺ mobilization by VPA enhances vesicular exocytosis.
Panel a shows original traces of catecholamine secretory peaks induced by K+ (35 mM, during 5 s every 2 min) pulse in control cells. Panel b displays the enhanced response in the presence of VPA, as shown in the horizontal bar at the bottom of the figure. Panel c illustrates the averaged results expressed as % of catecholamine secretion. Pooled data are means±s.e. mean of 8 experiments from 3 different cell cultures. * Indicates significant differences of VPA with respect to control. An ANOVA test was performed.
4. Discussion
The major finding of the present study is that the antiepileptic drug valproic acid (VPA) acts as an agonist for the inositol 1,4,5-trisphosphate receptor (InsP₃R). This conclusion is supported by the observation that, in HeLa cells, VPA induced a concentration-dependent Ca²⁺ release from the endoplasmic reticulum (ER) (Figure 1d). Importantly, the effect was not mediated by plasma membrane receptors, as it persisted in digitonin-permeabilized cells (Figure 2). In the absence of second messengers such as InsP₃, VPA evoked Ca²⁺ release with kinetics remarkably similar to those triggered by InsP₃ itself. The activation time constant (τₐcₜ) was almost identical for both compounds (Figure 2c), indicating that VPA mimics the physiological agonist of the InsP₃R. In contrast, the kinetics of ER Ca²⁺ release elicited by VPA and by cyclopiazonic acid (CPA)—a specific inhibitor of the sarco/endoplasmic reticulum Ca²⁺-ATPase (SERCA)—were clearly different. These data suggest that VPA does not act through SERCA inhibition, but rather directly targets the InsP₃R. This interpretation is further reinforced by the observation that the specific blockade of InsP₃R using either 2-APB [28] or heparin [29] completely abolished VPA-induced ER Ca²⁺ release.
VPA specifically targets InsP₃R but not RyR. The InsP₃R appears to be the principal intracellular target of VPA. Although HeLa cells express ryanodine receptors (RyR), they do not contribute significantly to Ca²⁺ signaling [7]. To confirm the specificity of VPA for InsP₃R, experiments were extended to PC12 cells, which express both InsP₃R and RyR [21,23]. In these cells, K⁺ stimulation and VPA each triggered ER Ca²⁺ release in a two-step sequence. However, the caffeine-induced Ca²⁺ release via RyR was not affected by VPA, indicating that VPA selectively targets InsP₃R-dependent Ca²⁺ stores.
VPA suppresses veratridine-induced Ca²⁺ oscillations. A particularly intriguing finding was that VPA abolished the cytosolic Ca²⁺ oscillations induced by veratridine (VTD) in chromaffin cells (Figure 6c). Because VTD is used as a cellular model of epileptiform activity [40,41,42,43], the ability of VPA to suppress these oscillations may have direct pathophysiological relevance. Interestingly, VPA itself increased cytosolic [Ca²⁺] (Figure 6c, right), likely reflecting InsP₃R-mediated ER Ca²⁺ release. Such modulation could influence vesicular trafficking and neurotransmitter release, contributing to the drug’s antiepileptic effects. Previous studies have demonstrated that VPA can inhibit epileptiform discharges induced by VTD [41], yet paradoxically, VPA has also been reported to exert pro-epileptic effects under certain conditions [40]. Clinical reports describe cases of valproate-induced status epilepticus [10]. These divergent effects may depend on individual sensitivity of InsP₃R subtypes to VPA, offering a potential explanation for both pharmacoresistance and proconvulsive reactions in some patients.
To our knowledge, this is the first comprehensive study demonstrating that VPA directly triggers Ca²⁺ release from the ER through InsP₃R activation and enhances exocytosis. Although other authors have shown that VPA modulates insulin secretion [17], the mechanism underlying this effect was not linked to ER Ca²⁺ dynamics. Similarly, Yamamoto et al. (1997) reported that chronic VPA exposure upregulated sodium channels and increased catecholamine secretion in adrenal chromaffin cells, but without considering ER Ca²⁺ homeostasis.
Furthermore, several studies have explored the role of VPA in bipolar disorder by analyzing its effects on Ca²⁺ signaling pathways [2,15,19]. Akimoto and colleagues found that VPA inhibited serotonin-induced Ca²⁺ responses in human platelets in a concentration-dependent manner, possibly involving protein kinase C (PKC) modulation. However, none of these investigations examined whether VPA acts directly on ER Ca²⁺ stores, as revealed in our present study.
We propose that VPA-induced Ca²⁺ release from the ER via InsP₃R may represent an effective mechanism to regulate secretion and synaptic transmission. If similar phenomena occur in neurons, VPA-triggered ER Ca²⁺ mobilization could contribute to synaptic plasticity and neurotransmitter modulation. Under pathological conditions such as epilepsy, this mechanism might help attenuate the propagation of epileptic discharges by enhancing GABA release, thereby counteracting neuronal hyperexcitability [16,17,18,19,20,21,22,23,24,25,26,27,28,29,30,31,32,33,34,35,36,37,38,39,40,41,42,43].
In conclusion, our results reveal a novel intracellular mechanism of action for the classical antiepileptic drug VPA. The drug behaves as an InsP₃R agonist, causing Ca²⁺ release from ER stores. Considering the central role of InsP₃-dependent Ca²⁺ signaling in neuronal excitability and epileptogenesis, this mechanism offers promising insights into the pharmacological action of VPA. Future studies should focus on identifying the molecular determinants of VPA–InsP₃R interaction and their implications for antiepileptic resistance and neuronal calcium homeostasis in chronic epilepsy.
Author Contributions
For research articles with several authors, a short paragraph specifying their individual contributions must be provided. The following statements should be used “Conceptualization, MFCA and ARN; methodology, MFCA and ARN; software, MFCA and ARN.; validation, MFCA and ARN; formal analysis, ARN; investigation, MFCA; resources, MFCA and ARN; data curation, ARN; writing—original draft preparation, MFCA and ARN; writing—review and editing, MFCA and ARN; visualization, MFCA; supervision, MFCA; project administration, MFCA and ARN; funding acquisition, MFCA and ARN. All authors have read and agreed to the published version of the manuscript.”
Funding
This work was supported the by following grants: (1) Ministerio de Sanidad y Consumo FIS (nº: 041665); (2) from Fundación La Caixa (nº: BN05-32-0); (3) Ministerio de Educación: Acciones integradas and (4) Ramon y Cajal Programme, to MFCA; ARN was supported by FIS (nº: PI052124; CP04/00132).
Acknowledgments
The generous gift of er-AEQ by Prof. Javier Alvarez is gratefully acknowledged.
Conflicts of Interest
Declare conflicts of interest or state “The authors declare no conflicts of interest.”
References
- Malenka, R.C.; Nicoll, R.A. Long-term potentiation a decade of progress? Science 1999, 285, 1870–1874. [Google Scholar] [CrossRef] [PubMed]
- Akimoto, T.; Kusumi, I.; Suzuki, K.; Masui, T.; Koyama, T. Effects of valproate on serotonin-induced intracellular calcium mobilization in human platelets. J Psychiatry Neurosci. 2007, 32, 17–22. [Google Scholar] [CrossRef] [PubMed]
- Pal, S.; Limbrick, D.D., Jr.; Rafiq, A.; DeLorenzo, R.J. Induction of spontaneous recurrent epileptiform discharges causes long term changes in intracellular calcium homeostatic mechanisms. Cell Calcium 2000, 28, 181–193. [Google Scholar] [CrossRef]
- Pal, S.; Sun, D.; Limbrick, D.; Rafiq, A.; DeLorenzo, R.J. Epileptogenesis induces long-term alterations in intracellular calcium release and sequestration mechanisms in the hippocampal neuronal culture model of epilepsy. Cell Calcium 2000, 30, 285–296. [Google Scholar] [CrossRef]
- DeLorenzo, R.J.; Sun, D.A.; Deshpande, L.S. Cellular mechanisms underlying acquired epilepsy: The calcium hypothesis of the induction and maintainance of epilepsy. Pharmacol. Therap 2005, 105, 229–266. [Google Scholar] [CrossRef]
- Ehrlich, B.E.; Kaftan, E.; Bezprozvannaya, S.; Bezprozvanny, I. The pharmacology of intracellular Ca2+ release channels. Trends Pharmacol. 1994, 15, 145–149. [Google Scholar] [CrossRef]
- Bennett, D.L.; Cheek, T.R.; Berridge, M.J.; De Smedti, H.; Parysi, J.B.; Missiaeni, L.; Bootman, M.D. Expression and function of ryanodine receptors in nonexcitable cells. J Biol. Chem. 1996, 271, 6356–6362. [Google Scholar] [CrossRef]
- Berridge, M.J. Neuronal calcium signaling. Neuron 1998, 21, 13–26. [Google Scholar] [CrossRef]
- Royero, PX; Higa, GSV; Kostecki, DS; Dos Santos, BA; Almeida, C; Andrade, KA; Kinjo, ER; Kihara, AH. Ryanodine receptors drive neuronal loss and regulate synaptic proteins during epileptogenesis. Exp Neurol. 2020, 327, 113213. [Google Scholar] [CrossRef] [PubMed]
- Capocchi, G.; Balducci, A.; Cecconi, M.; Pelli, MA.; Picchiarelli, A.; Silvestrelli, G.; Zampolini, M. Valproate-induced epileptic tonic status. Seizure 1998, 7, 237–241. [Google Scholar] [CrossRef] [PubMed]
- Ekwuru, MO.; Cunningham, JR. Phaclofen increases GABA release from valproate treated rats. Br. J. Pharmacol. 1990, 99, 251. [Google Scholar]
- Gram, L.; Larsson, O.M.; Johnsen, A.H.; Schousboe, A. Effects of valproate, vigabatrin and aminooxyacetic acid on release of endogenous and exogenous GABA from cultured neurons. Epilepsy Res. 1988, 2, 87–95. [Google Scholar] [CrossRef]
- Kelly, K.M.; Gross, R.A.; Macdonald, R.L. Valproic acid selectively reduces the low-threshold (T) calcium current in rat nodose neurons. Neurosci. Lett. 1990, 116, 233–238. [Google Scholar] [CrossRef] [PubMed]
- Kim, A.J.; Shi, Y.; Austin, R.C.; Werstuck, G.H. Valproate protects cells from ER stress-induced lipid accumulation and apoptosis by inhibiting glycogen synthase kinase-3. J. Cell Sci. 2005, 118, 89–99. [Google Scholar] [CrossRef] [PubMed]
- Kurita, M.; Nishino, S.; Ohtomo, K.; Rai, M.; Shirakawa, H.; Mashiko, H.; Niwa, S.; Nakahata, N. Sodium valproate at therapeutic concentrations changes Ca2+ response accompanied with its weak inhibition of protein kinase C in human astrocytoma cells. Prog Neuropsychopharmacol. Biol. Psychiatry. 2007, 31, 600–604. [Google Scholar] [CrossRef]
- Löscher, W. Basic pharmacology of valproate: A review after 35 years of clinical use for the treatment of epilepsy. CNS drugs 2002, 16, 669–694. [Google Scholar] [CrossRef]
- Luef, G.J.; Lechleitner, M.; Bauer, G.; Trinka, E.; Hengster, P. Valproic acid modulates islet cell insulin secretion: A possible mechanism of weight gain in epilepsy patients. Epilepsy Res. 2003, 55, 53–57. [Google Scholar] [CrossRef] [PubMed]
- Vreugdenhil, M.; van Veelen, C.W.; van Rijen, P.C.; Lopes da Silva, F.H.; Wadman, W.J. Effect of valproic acid on sodium currents in cortical neurons from patients with pharmaco-resistant temporal lobe epilepsy. Epilepsy Res. 1998, 32, 309–320. [Google Scholar] [CrossRef]
- Suzuki, K.; Kusumi, I.; Akimoto, T.; Sasaki, Y.; Koyama, T. Effects of lithium and valproate on agonist-induced platelet intracellular calcium movilization: Relevance to myosin light chain kinase. Prog Neuropsychopharmacol Biol Psychiatry 2004, 28, 67–72. [Google Scholar] [CrossRef]
- Pizzo, P.; Fasolato, C.; Pozzan, T. Dynamic properties of an inositol 1,4,5-trisphosphate- and thapsigargine-insensitive calcium pool in mammalian cell lines. J Cell Biol. 1997, 136, 355–366. [Google Scholar] [CrossRef]
- Clementi, E.; Scheer, H.; Zacchetti, D.; Fasolato, C.; Pozzan, T.; Meldolesi, J. Receptor-activated Ca2+ influx. Two independently regulated mechanisms of influx stimulation coexist in neurosecretory PC12 cells. J Biol Chem. 1992, 267, 2164–2172. [Google Scholar] [CrossRef]
- Ehrlich, B.E.; Kaftan, E.; Bezprozvannaya, S.; Bezprozvanny, I. The pharmacology of intracellular Ca2+ release channels. Trends Pharmacol. 1994, 15, 145–149. [Google Scholar] [CrossRef]
- Fasolato, C.; Zottini, M.; Clementi, E.; Zacchetti, D.; Meldolesi, J.; Pozzan, T. Intracellular Ca2+ pools in PC12 cells. J. Biol. Chem. 1991, 266, 20159–20167. [Google Scholar] [CrossRef]
- García-Sancho, J.; Montero, M.; Alvarez, J. Ca2+-induced Ca2+ release in chromaffin cells seen from inside the ER with targeted aequorin. J Cell Biol. 1999, 144, 241–254. [Google Scholar]
- Montero, M.; Alvarez, J.; Scheenen, W.J.J.; Rizzuto, R.; Meldolesi, J.; Pozzan, T. Ca2+ Homeostasis in the endoplasmic reticulum: Coexistence of high and low [Ca2+] subcompartments in intact HeLa cells. J. Cell. Biol. 1997, 139, 601–611. [Google Scholar] [CrossRef] [PubMed]
- Moreno ALobatón, C.D.; SantoDomingo, J.; Vay, L.; Hernandez-SanMiguel, E.; Rizzuto, R.; Montero, M.; Alvarez, J. Calcium dynamics in catecholamine containing secretory vesicles. Cell Calcium 2005, 37, 555–564. [Google Scholar] [CrossRef]
- Mori, F.; Okada, M.; Tomiyama, M.; Kaneko, S.; Wakabayashi, K. Effects of ryanodine receptor activation on neurotransmitter release and neuronal cell death following kainic acid-induced status epilepticus. Epilepsy Res. 2005, 65, 59–70. [Google Scholar] [CrossRef]
- Zima, A.V.; Bare, D.J.; Mignery, G.A.; Blatter, L.A. IP3-dependent nuclear Ca2+ signalling in the mammalian heart. J Physiol. 2007, 584, 601–611. [Google Scholar] [CrossRef] [PubMed]
- Ramos-Franco, J.; Fill, M.; Mignery, G.A. Isoform-specific function of single inositol 1,4,5-trisphosphate receptor channels. Biophysic. J. 1998, 75, 834–839. [Google Scholar] [CrossRef]
- Rizzuto, R. Intracellular Ca2+ pools in neuronal signalling. Curr Opin Neurobiol. 2001, 11, 306–311. [Google Scholar] [CrossRef]
- Yamamoto, R.; Yanagita, T.; Kobayashi, H.; Yokoo, H.; Wada, A. Up-regulation of sodium channel subunit mRNAs and their cell surface expression by antiepileptic valproic acid: Activation of calcium channel and catecholamine secretion in adrenal chromaffin cells. J. Neurochem. 1997, 68, 1655–1662. [Google Scholar] [CrossRef]
- Zona, C.; Avoli, M. Effects induced by the antiepileptic drug valproic acid upon the ionic currents recorded in rat neocortical neurons in cell culture. Exp. Brain. Res. 1990, 81, 313–317. [Google Scholar] [CrossRef]
- Otoom, S.A.; Alkadhi, K.A. Valproic acid intensifies epileptiform activity in the hippocampal pyramidal neurons. Neurosci Res. 1999, 35, 299–307. [Google Scholar] [CrossRef] [PubMed]
- Alvarez, J.; Montero, M. Measuring Ca2+ in the endoplasmic reticulum with aequorin. Cell Calcium 1999, 32, 251–260. [Google Scholar] [CrossRef]
- Chen, C.A.; Okayama, H. Calcium phosphate-mediated gene transfer: A highly efficient transfection system for stably transforming cells with plasmid DNA. Biotechniques 1988, 6, 632–638. [Google Scholar] [PubMed]
- Díaz-Prieto, N.; Herrera-Peco, I.; de Diego, A.M.; Ruiz-Nuño, A.; Gallego-Sandín, S.; López, M.G.; García, A.G.; Cano-Abad, M.F. Bcl2 mitigates Ca2+ entry and mitochondrial Ca2+ overload through downregulation of L-type Ca2+ channels in PC12 cells. Cell Calcium 2008, 44, 339–352. [Google Scholar] [CrossRef]
- Moro, M.A.; Lopez, M.G.; Gandia, L.; Michelena, P.; Garcia, A.G. Separation and culture of living adrenal- and noradrenalina-containing cells from bovine adrenal medullae. Anal. Biochem. 1990, 185, 243–248. [Google Scholar] [CrossRef]
- Borges, R.; Sala, F.; Garcia, A.G. Continuous monitoring of catecholamine release from perfused cat adrenals. J. Neurosci. Methods 1986, 16, 289–300. [Google Scholar] [CrossRef]
- Cano-Abad, M.F.; Lopez, M.G.; Hernandez-Guijo, J.M.; Zapater, P.; Gandia, L.; Sanchez-Garcia, P.; Garcia, A.G. Effects of the neuroprotectant lubeluzole on the cytotoxic actions of veratridine, barium, ouabain and 6-hydroxydopamine in chromaffin cells. Br. J. Pharmacol. 1998, 124, 1187–1196. [Google Scholar] [CrossRef] [PubMed]
- Otoom, S.; Tian, L.M.; Alkadhi, K.A. Veratridine-treated brain slices: A cellular model for epileptiform activity. Brain Res. 1998, 789, 150–156. [Google Scholar] [CrossRef]
- Otoom, S.A.; Alkadhi, K.A. Epileptiform activity of veratridine model in rat brain slices: Effects of antiepileptic drugs. Epilepsy Res. 2000, 38, 161–170. [Google Scholar] [CrossRef] [PubMed]
- Conceiçao, I.M.; Lebrun, I.; Cano-Abad, M.F.; Gandía, L.; Hernández-Guijo, J.M.; López, M.G.; Villarroya, M.; Jurkiewicz, A.; García, A.G. Synergism between toxin gamma from the brazilian scorpion Tityus serrulatus and veratridine in chromaffin cells. Am. J. Physiol. 1998, 274, 1745–1754. [Google Scholar] [CrossRef] [PubMed]
- Cano-Abad, M.F.; Villarroya, M.; Garcia, A.G.; Gabilan, N.H.; Lopez, M.G. Calcium entry through L-type calcium channels causes mitochondrial disruption and chromaffin cell death. J. Biol. Chem. 2001, 276, 39695–39704. [Google Scholar] [CrossRef] [PubMed]
Figure 1.
Panel a, shows the effects of histamine (100 μM) on [Ca2+]ER. This original trace was obtained in 23 experiments from 5 different batches of cells. Panels b and c illustrate VPA action at 3 and 10 μM, respectively, on [Ca2+]ER in intact HeLa cells. Once the ER was refilled with 1 mM of Ca2+ (as shown by dots), drugs were applied as shown in the horizontal bars at the top of the figure. VPA experiments are representative of 25, 20, and 28 experiments of each type from 6, 5, and 7 different cell batches, respectively. Panel d shows a concentration-response curve for VPA. The average percentage of Ca2+ released from the ER induced by increased concentrations of VPA 3, 5, 10, 15, 30 and 100 μM. Data are means+s.e SE. Mean from 25, 12, 20, 12, 28, and 25 different experiments from 6, 3, 5, 3, 7, and 6 cell batches, respectively.
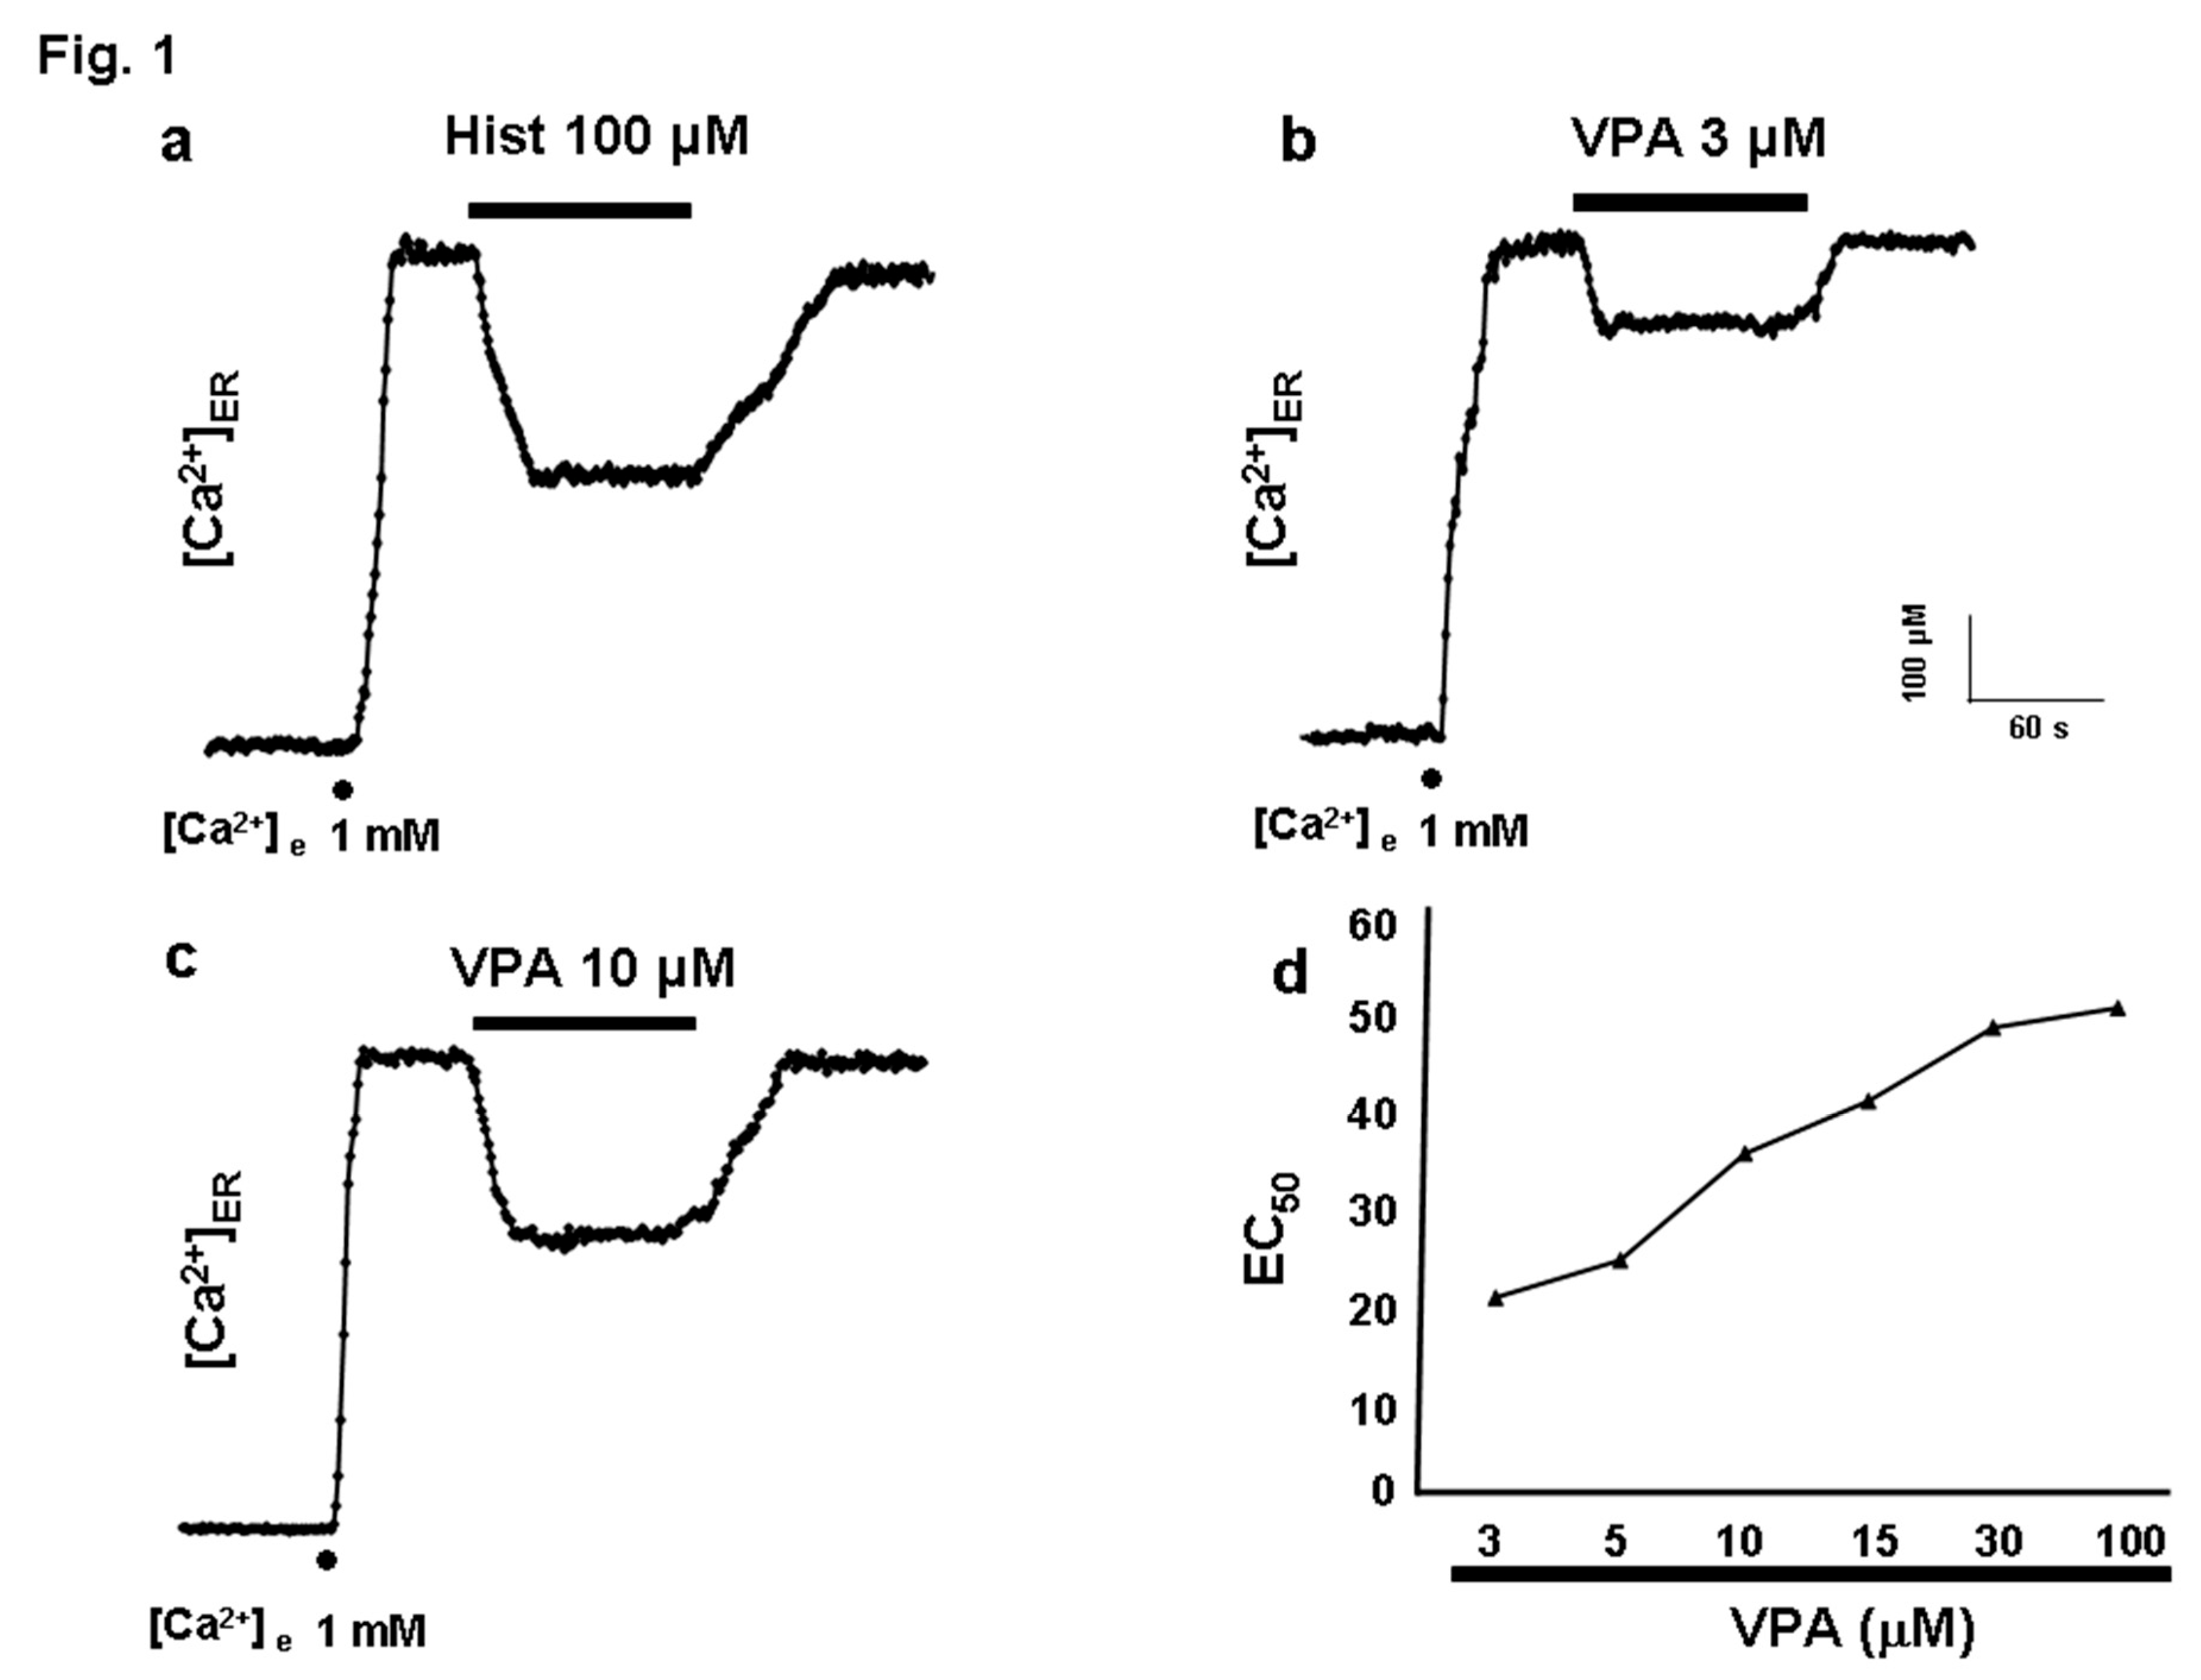
Figure 2.
[Ca2+]ER in permeabilized HeLa cells. Panel a, shows original traces of InsP3 5 μM. After permeabilization, ER was refilled with 0.5 μM of Ca2+ as shown by dots. Drugs were applied as indicated in the horizontal bars at the top of the figure. Panel b represents average data expressed as % of Ca2+ release from ER due to VPA (3 and 10 μM) and InsP3 (5 μM) application. Panel c shows average results expressed as τact for InsP3 and increasing concentrations of VPA application. Thus, 3 and 10 μM of VPA demonstrated similar kinetics to InsP3. Pooled data are means±s.e. mean of 12 and 15 experiments from 3 and 4 different cell batches (VPA 3 and 10 μM, respectively). Means+s.e. mean of InsP3 came from 20 experiments from 5 different cell batches. # indicates significant differences between InsP3 and VPA 3 μM. * indicates significant differences between InsP3 and VPA 10 μM. n/s indicate not significant differences. An ANOVA test was performed.
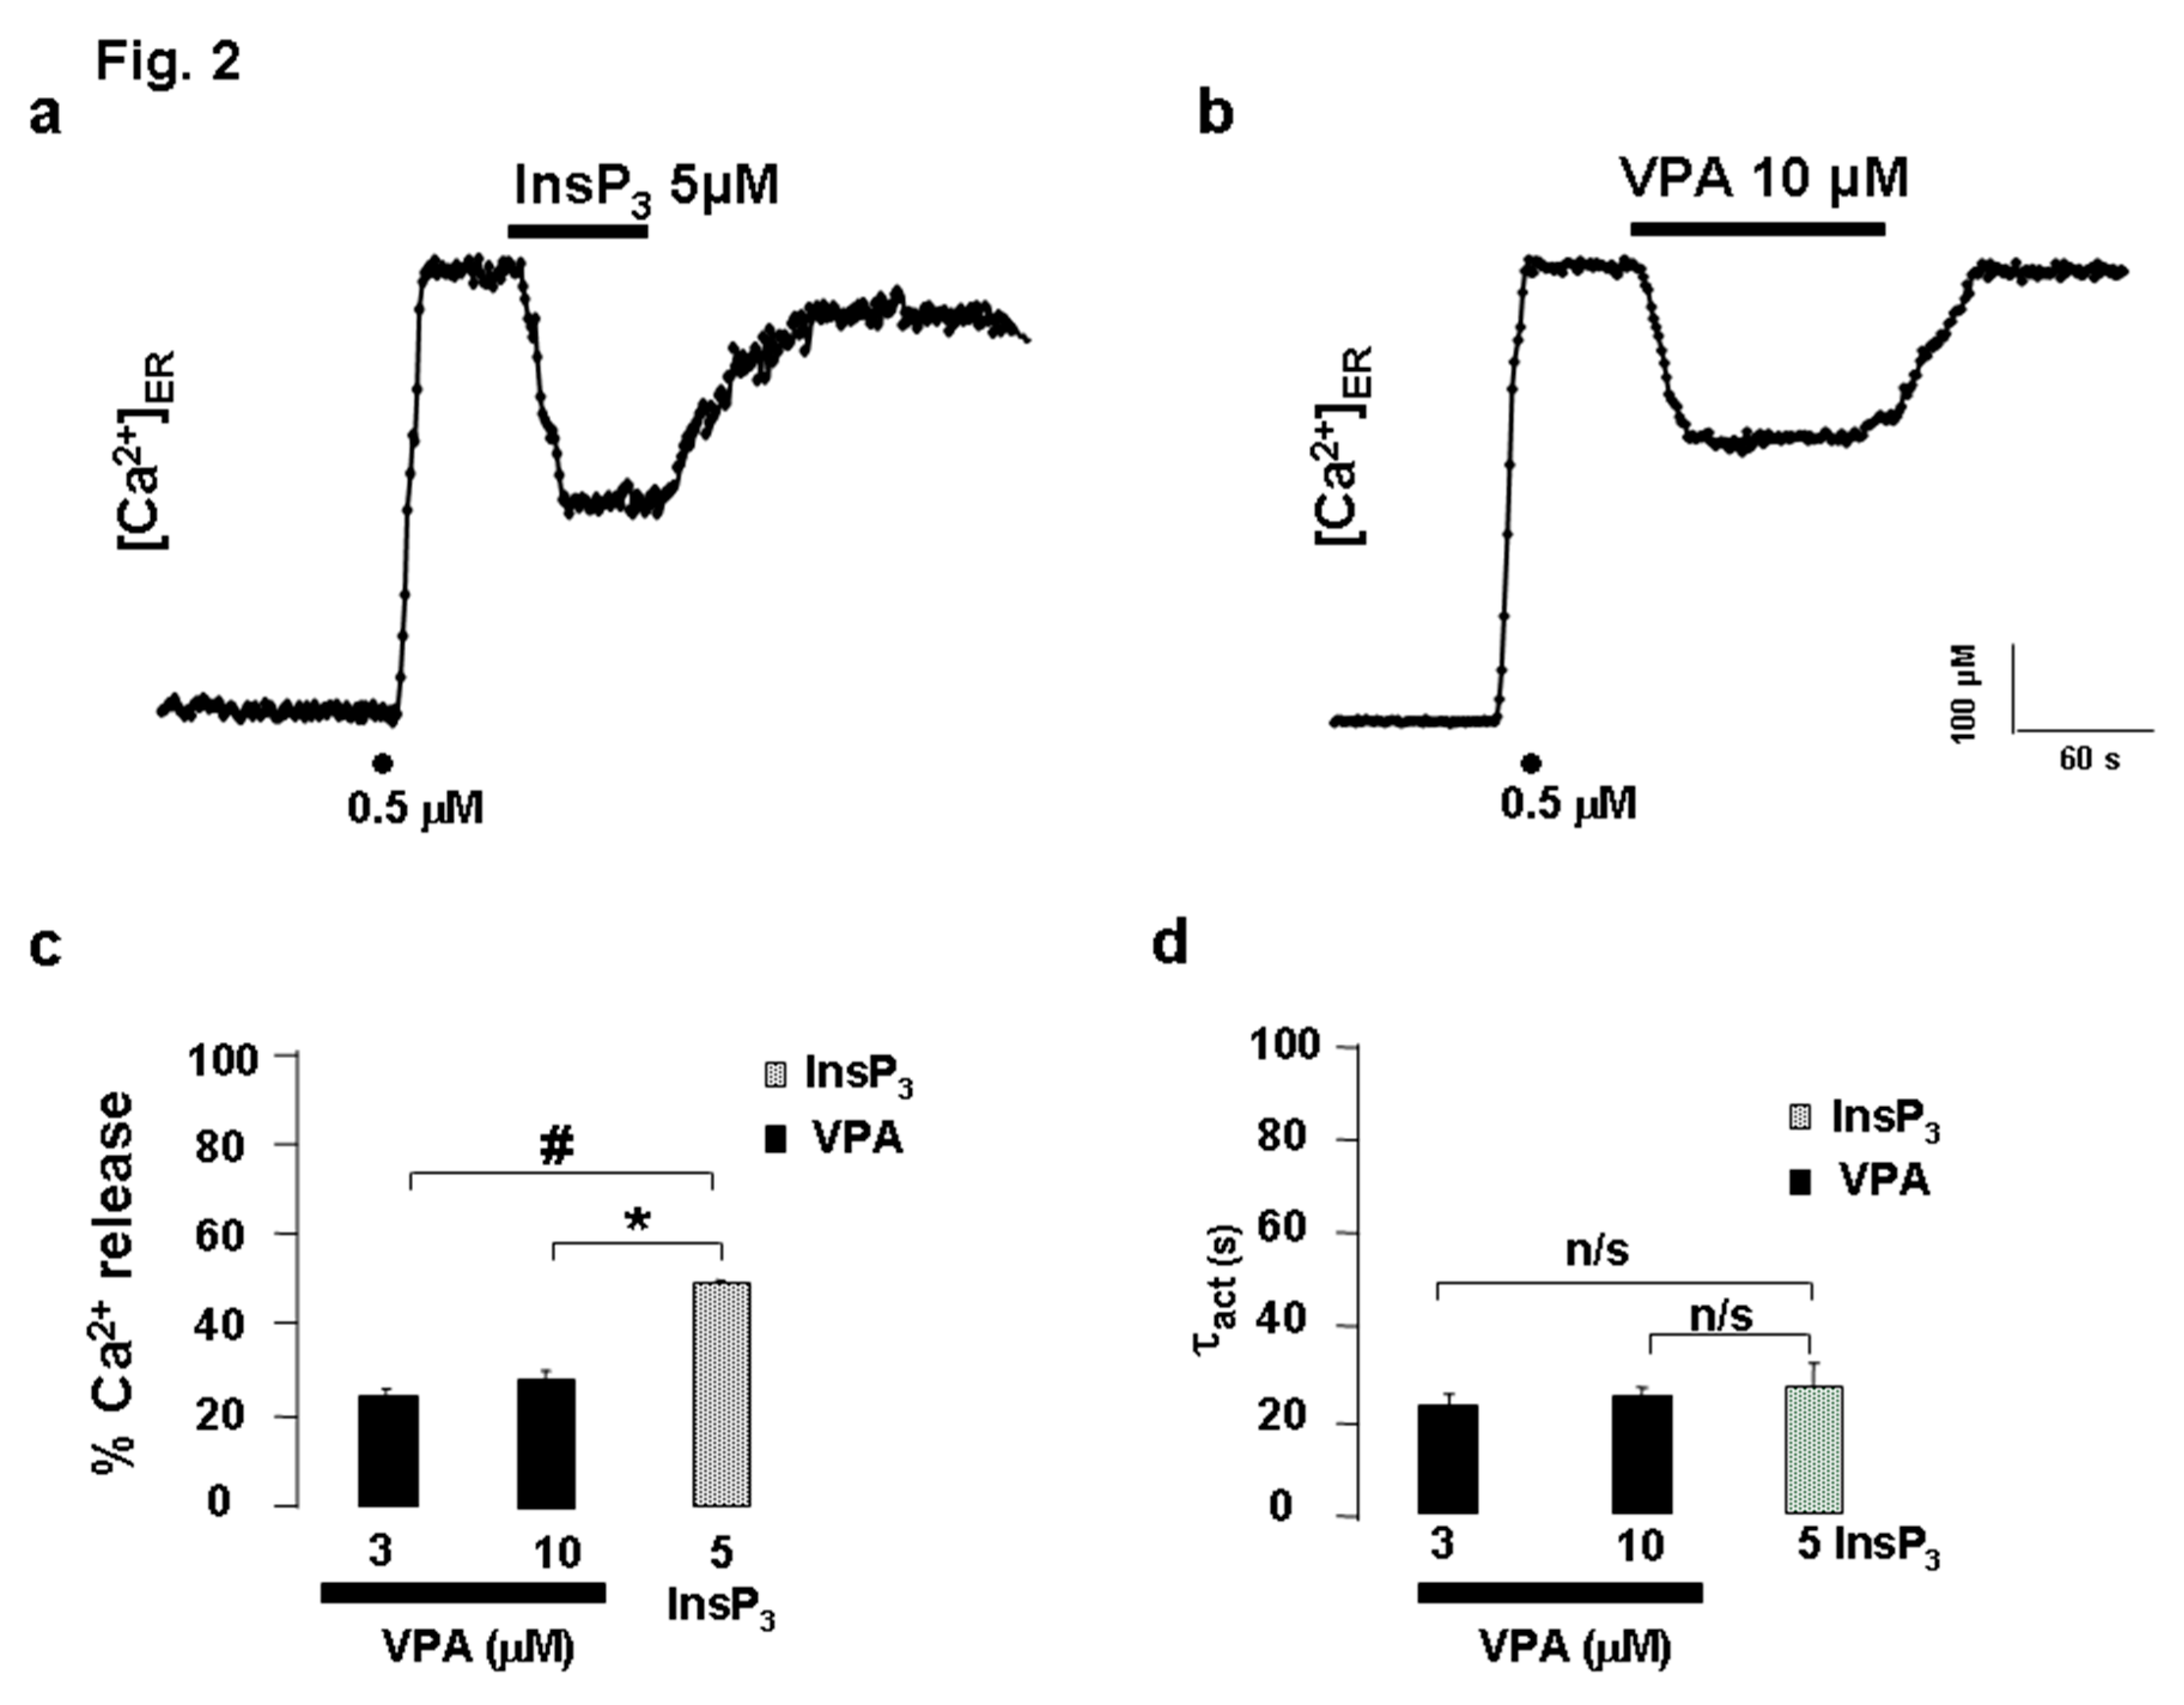
Figure 3.
VPA follows a different mechanism from CPA. Original traces of CPA (30 μM, panel a), a SERCA blocker, show different kinetics to VPA (30 μM, panel b) in intact HeLa cells. Once the ER was refilled with 1 mM Ca2+ (as shown by dots), drugs were applied as shown in the horizontal bars at the top of the figure. Panel c represents average data expressed as % of Ca2+ release from ER, CPA, and VPA application. Panel d shows average results expressed as τact at increasing concentrations of VPA and CPA applications. For CPA 3, 10, and 30 μM pooled data are means±s.e. mean of 10, 10, and 30 experiments from 3, 3, and 7 different cell batches; for VPA 3, 10, and 30 μM pooled data are means±s.e. mean of 25, 20, and 28 experiments from 6, 5, and 7 different cell batches. # indicates significant differences between VPA and CPA in terms of Ca2+ release. * indicates significant differences between VPA and CPA when the τact is analyzed. An ANOVA test was performed.
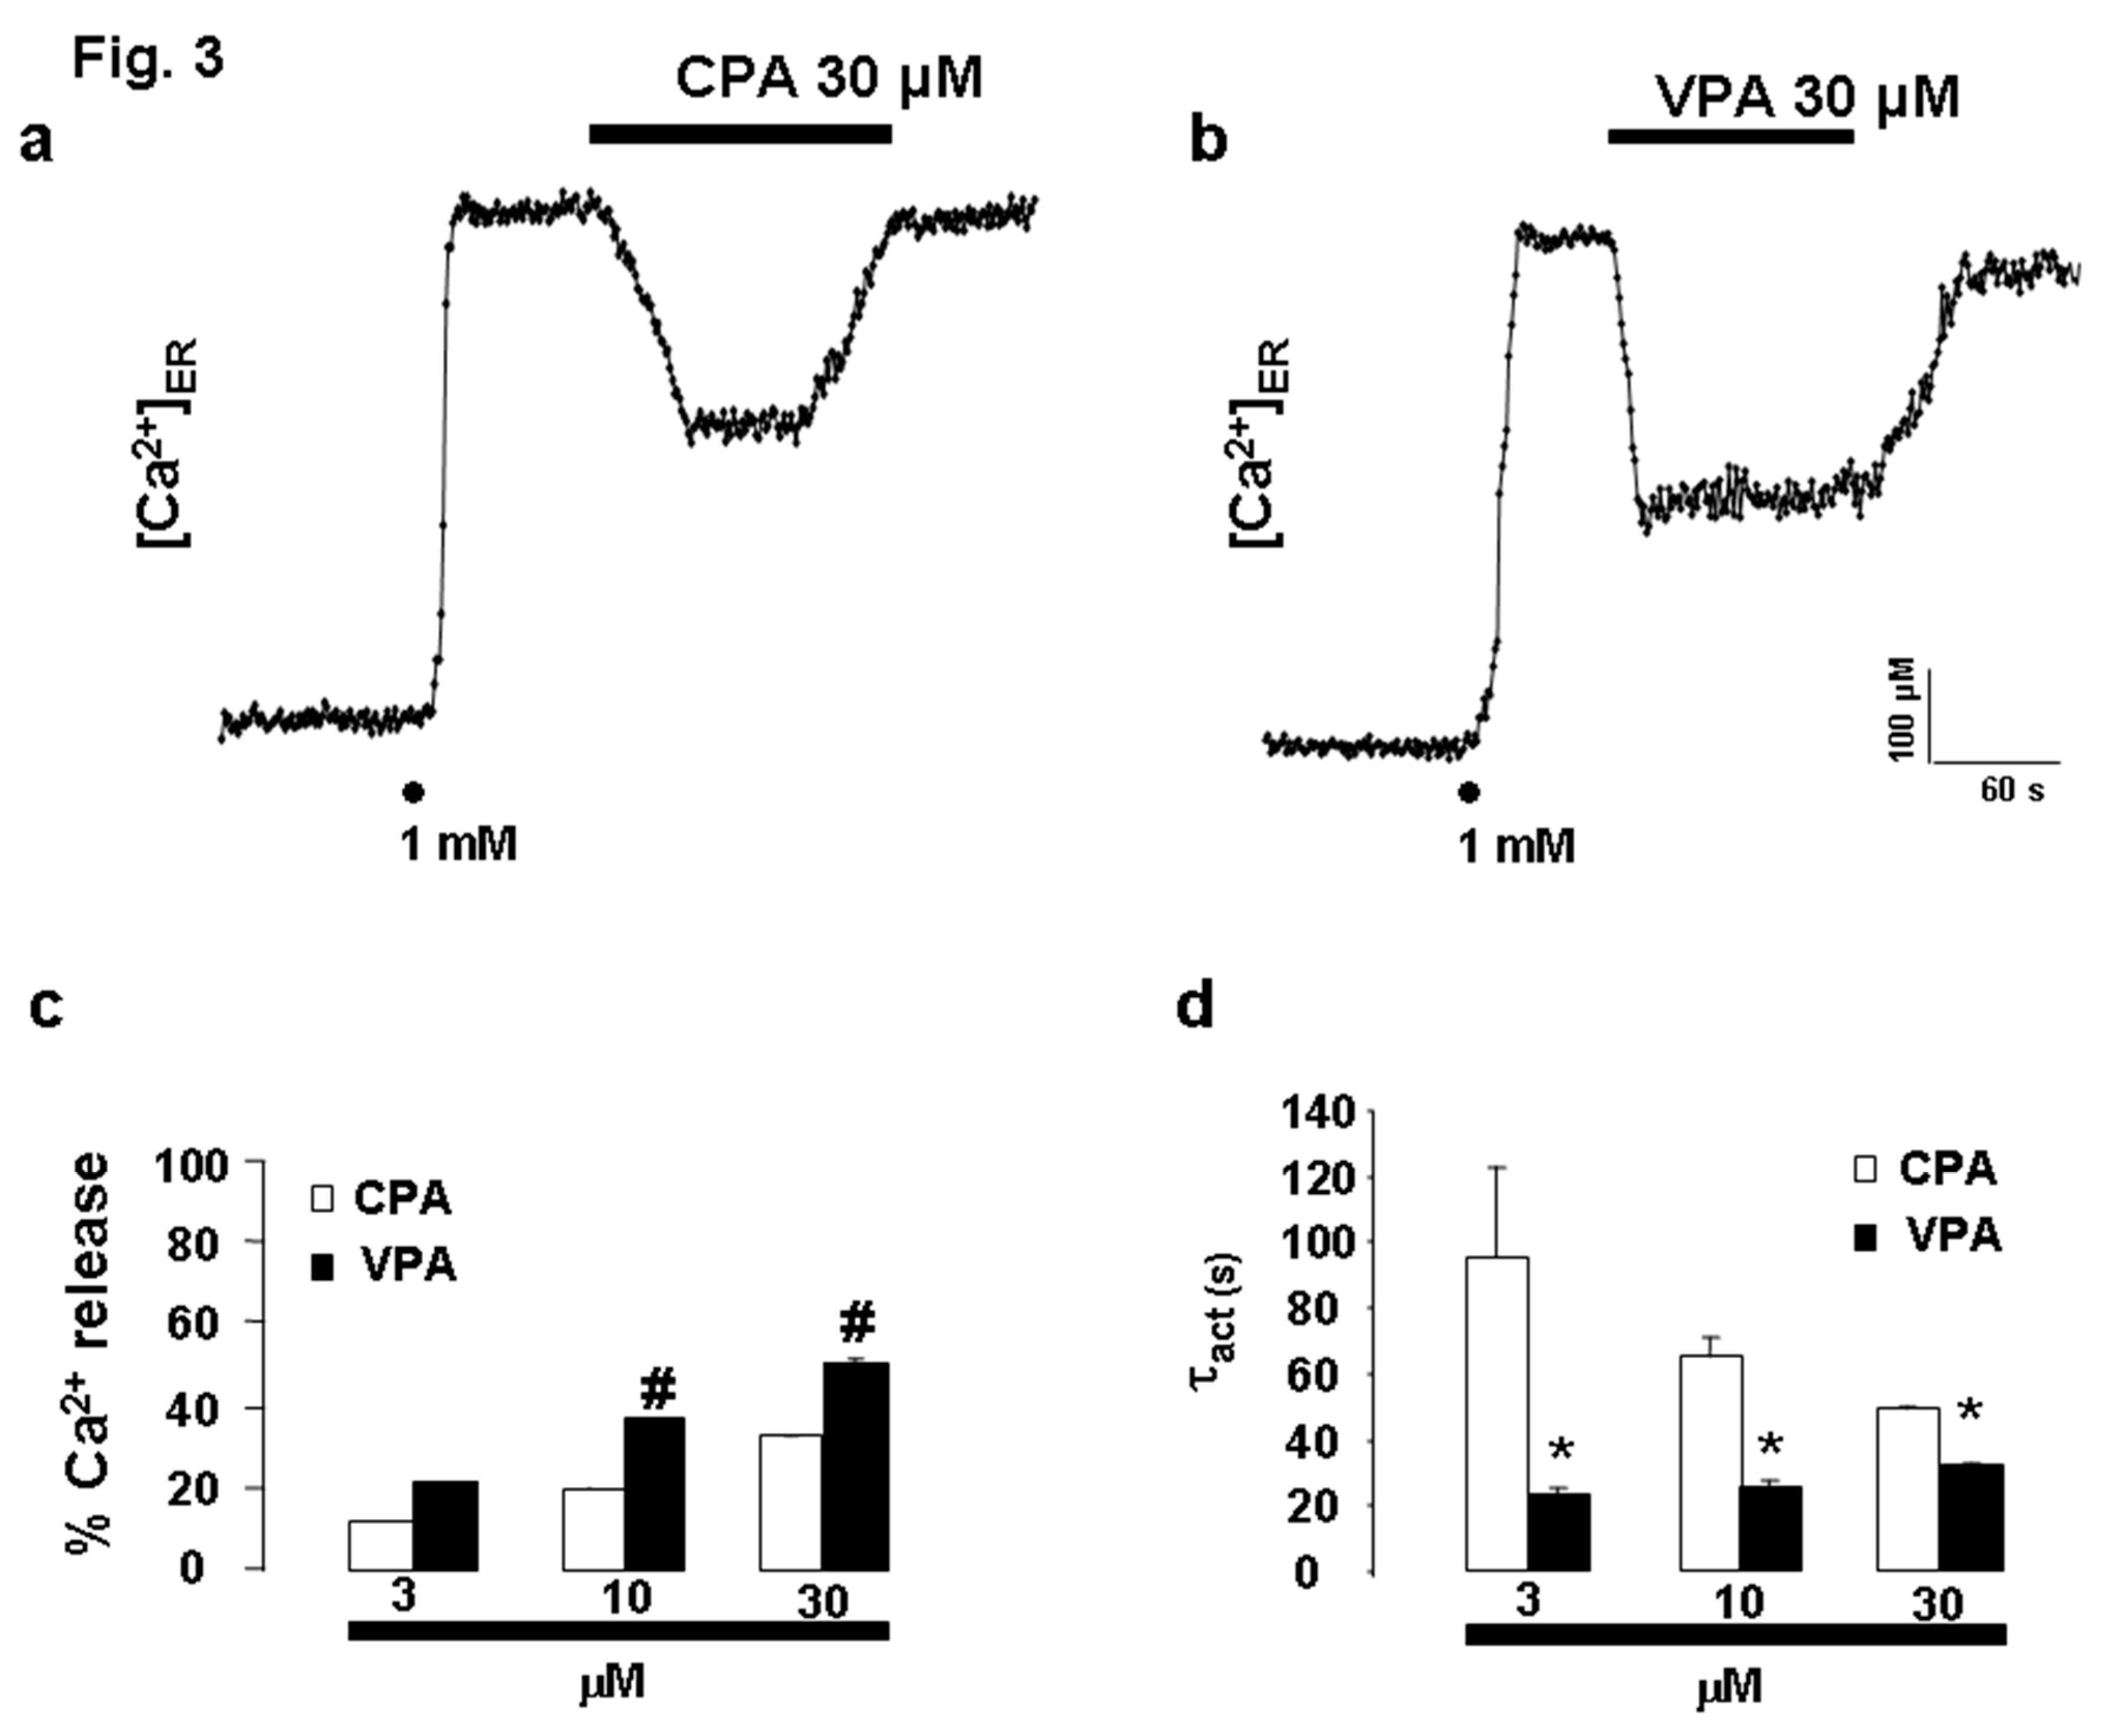
Figure 4.
Panel a shows HeLa cells perfused with 2-APB at 10 μM before the addition of VPA 10 μM. Panel b shows HeLa cells treated with VPA (10 μM) and heparin (200 μg/ml). Drugs were applied as indicated in the horizontal bars at the top of the figure. Panel d are pooled data from 12 and 15 experiments from 3 and 4 different cell batches. * Indicates significant differences between 2-APB and heparin with respect to VPA. An ANOVA test was performed.
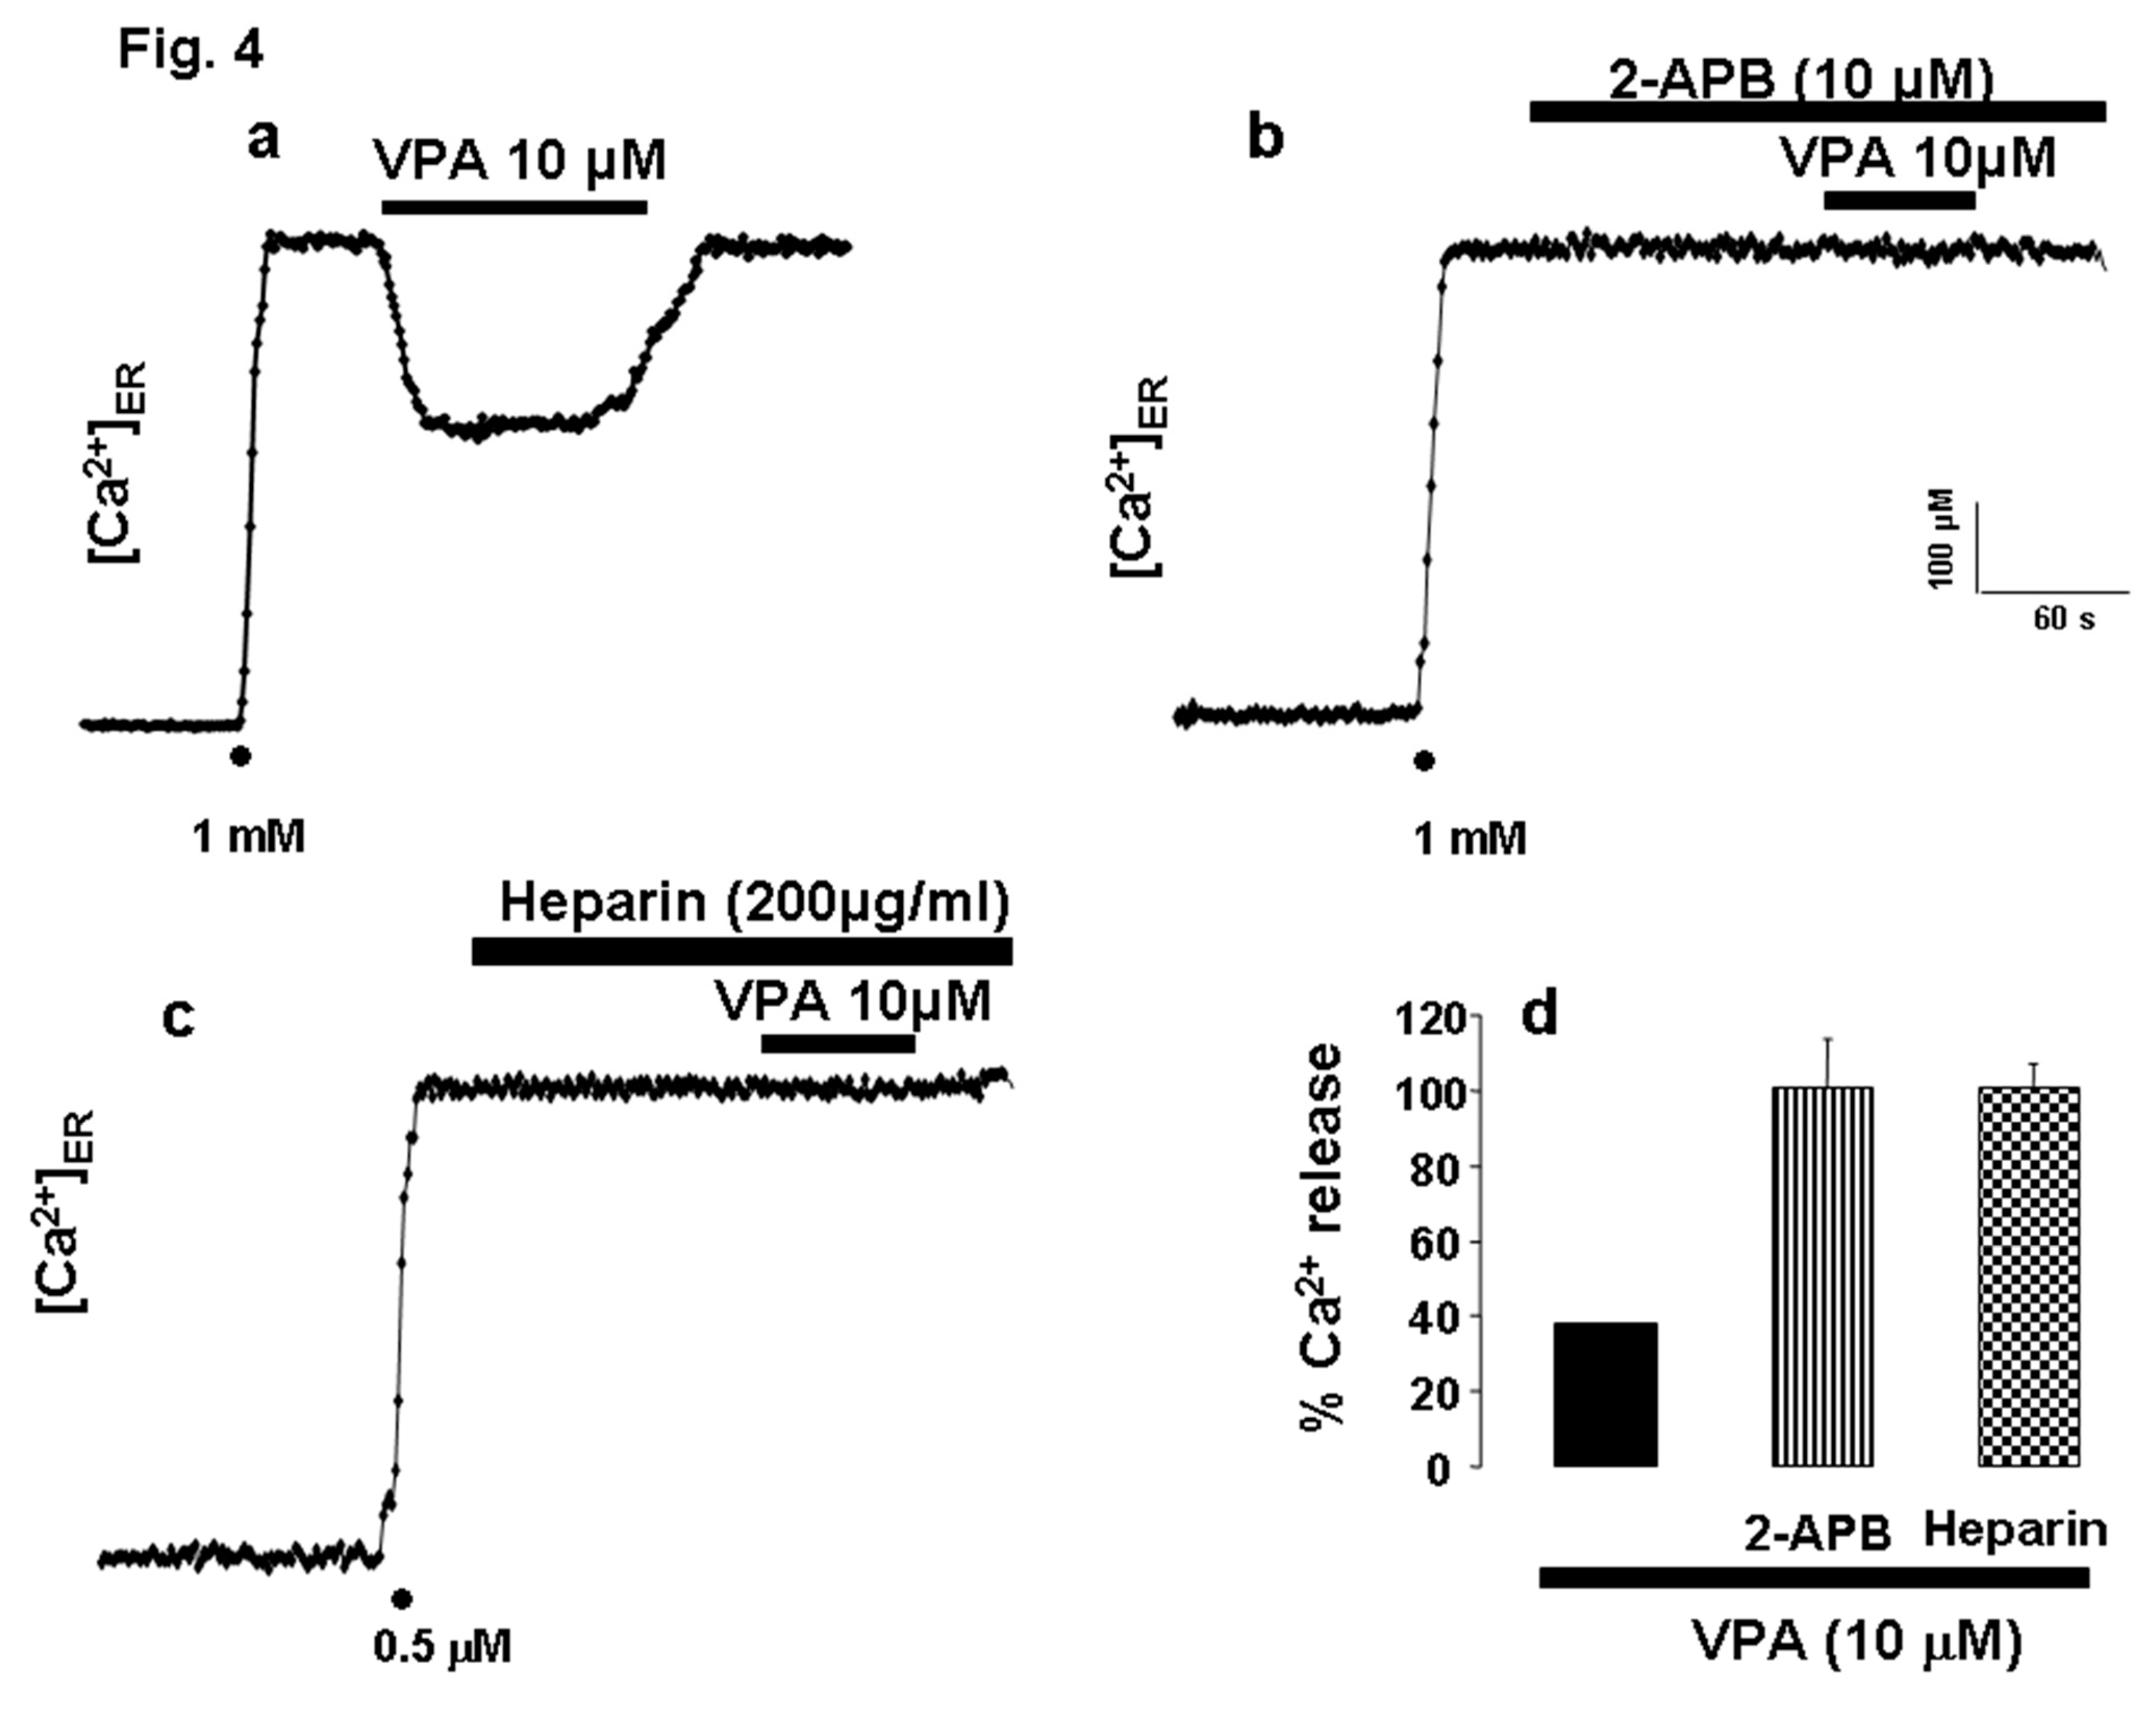
Figure 5.
VPA releases Ca2+ from the ER in PC12 cells. Original traces of high K+ (75 mM) and VPA (10 μM, panel a), the coapplication of CAF (1 mM) and VPA (10 μM) showed different Ca2+ release from the ER to panel b) in intact PC12 cells. Once the ER was refilled with 1 mM Ca2+ (as shown by dots), drugs were applied as shown in the horizontal bars at the top of the figure. The perfusion of DTN (100 μM) abolished Ca2+ release from the ER induced by high K+ (75 mM) (panel c) but not VPA Ca2+ release (panel d). Pooled data are means±s.e. mean of 10, from different cell batches (panel a); pooled data are means±s.e. mean of 3 experiments from 2 different cell batches (panel b); pooled data are means±s.e. mean of 9 experiments from 3 different cell batches (panel c, d).
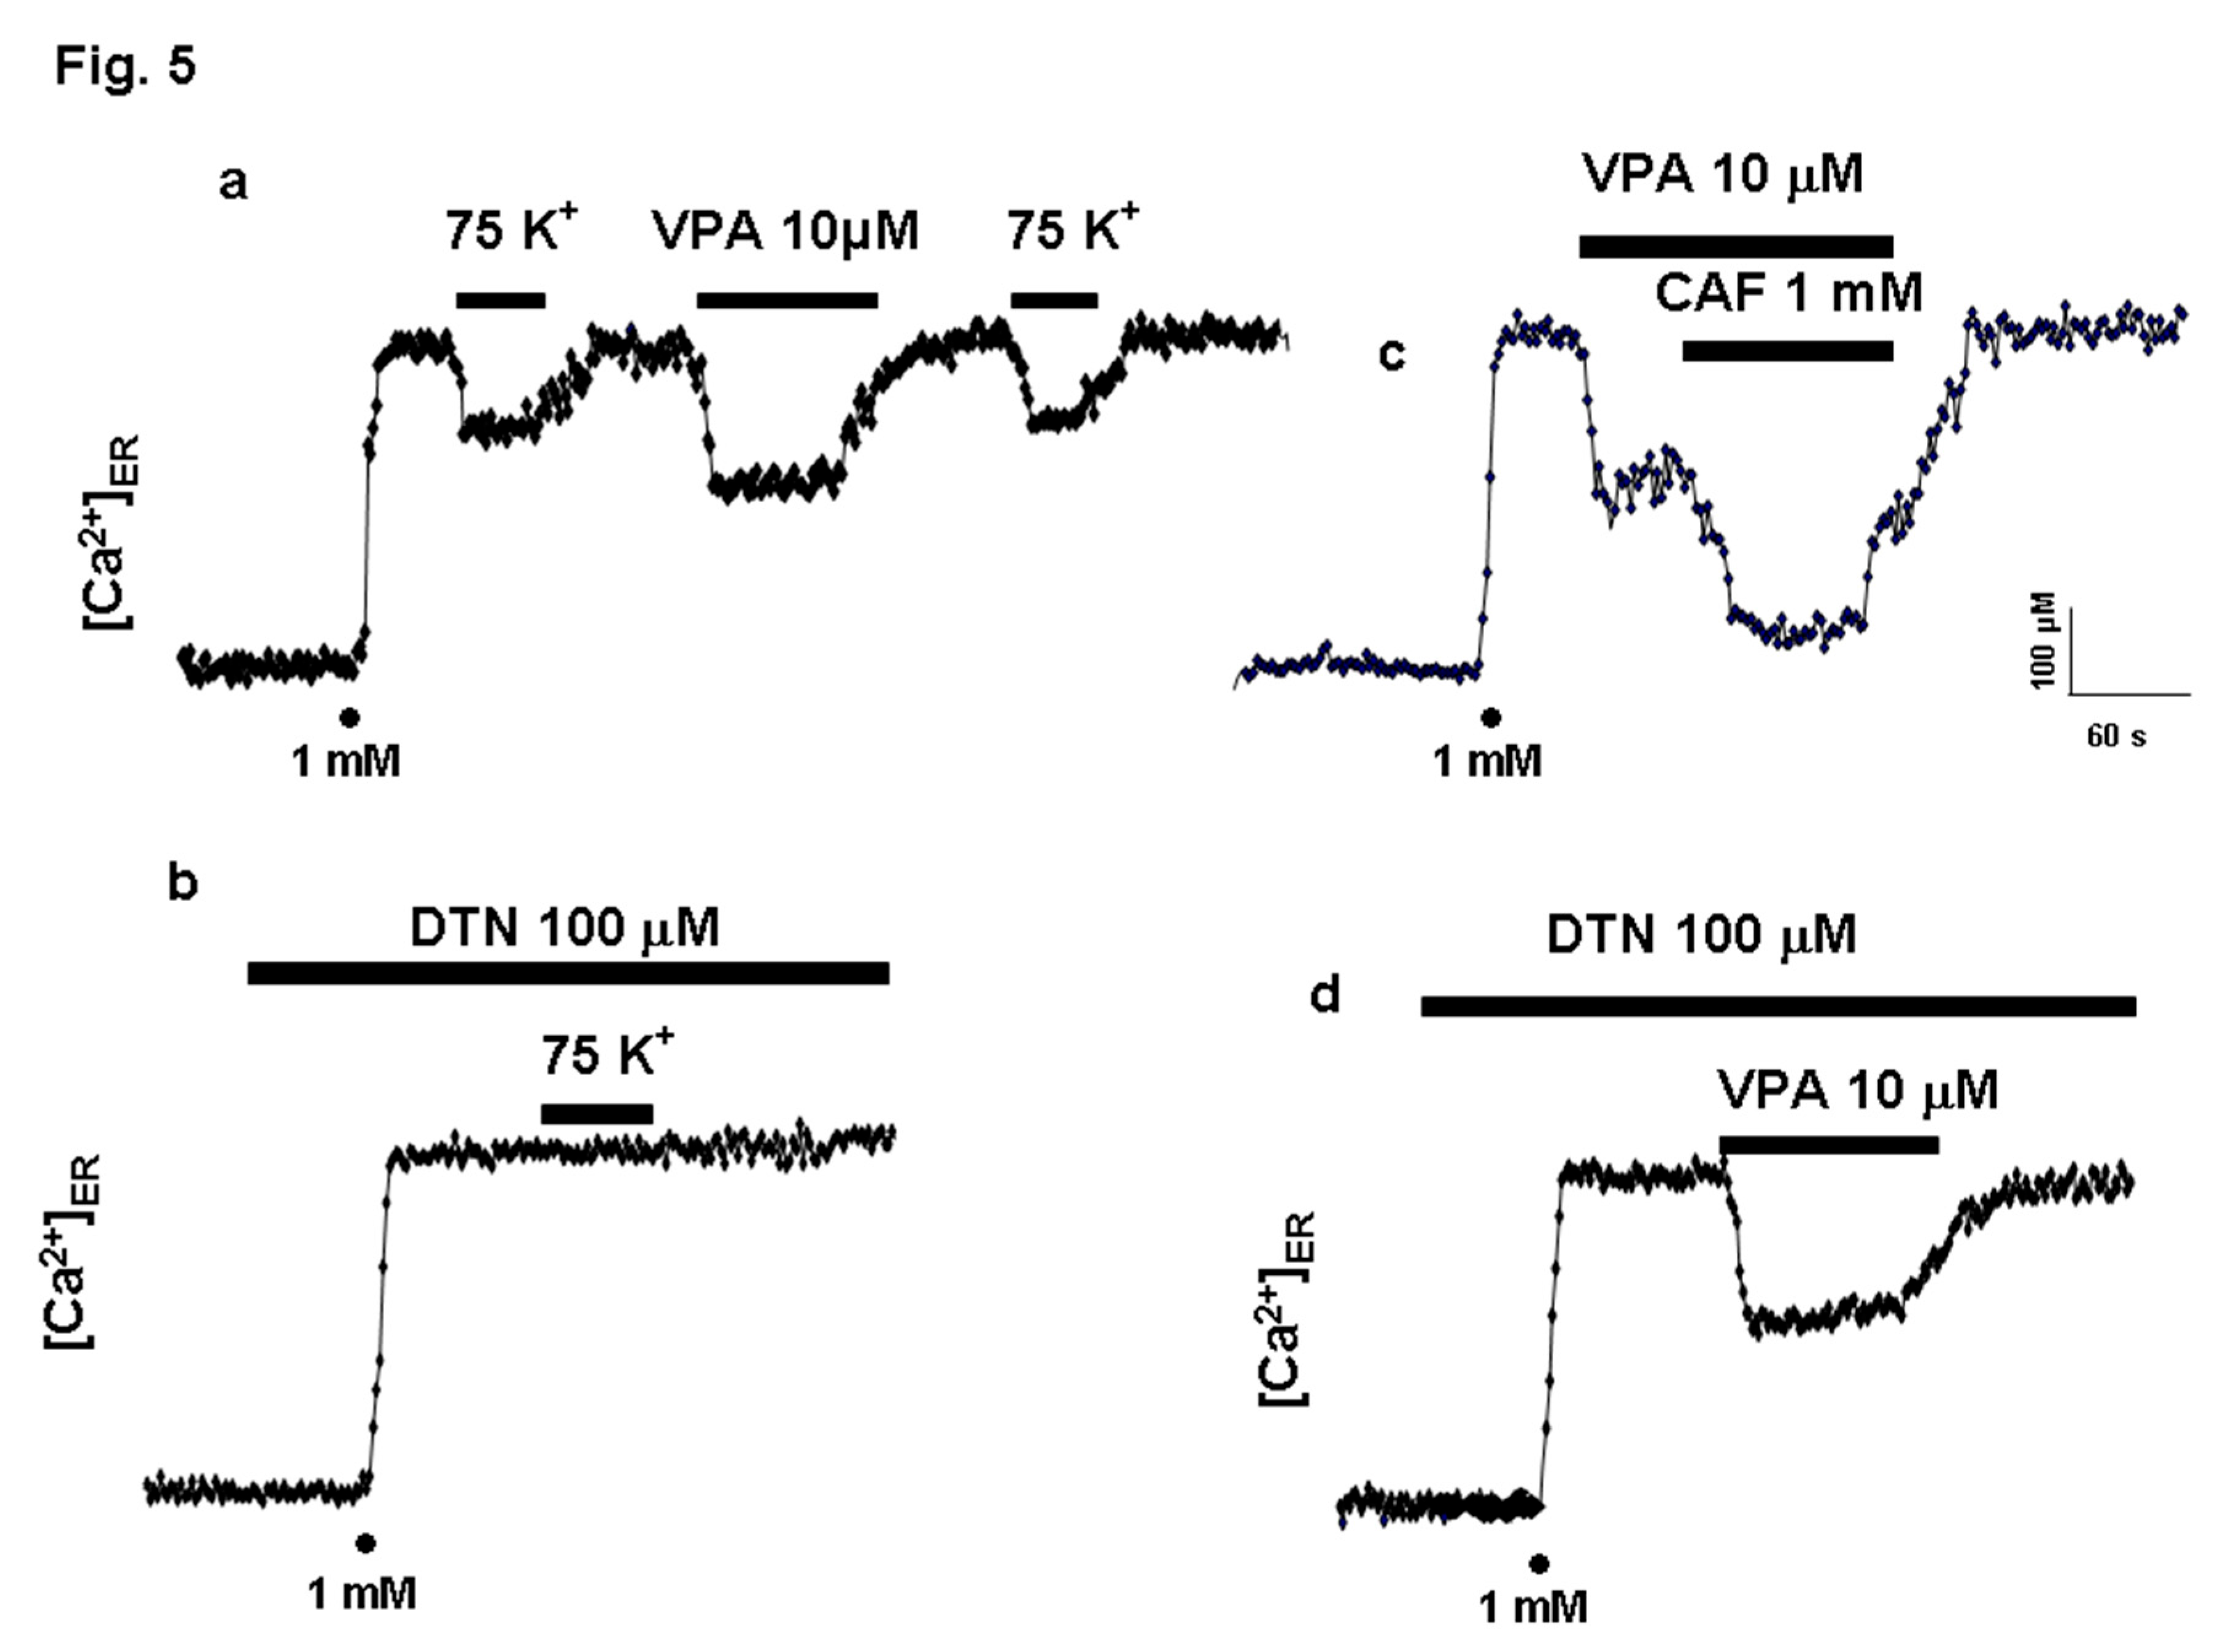
Figure 6.
The effect of VPA on VTD epilepsy model in fura-2 loaded BCC.
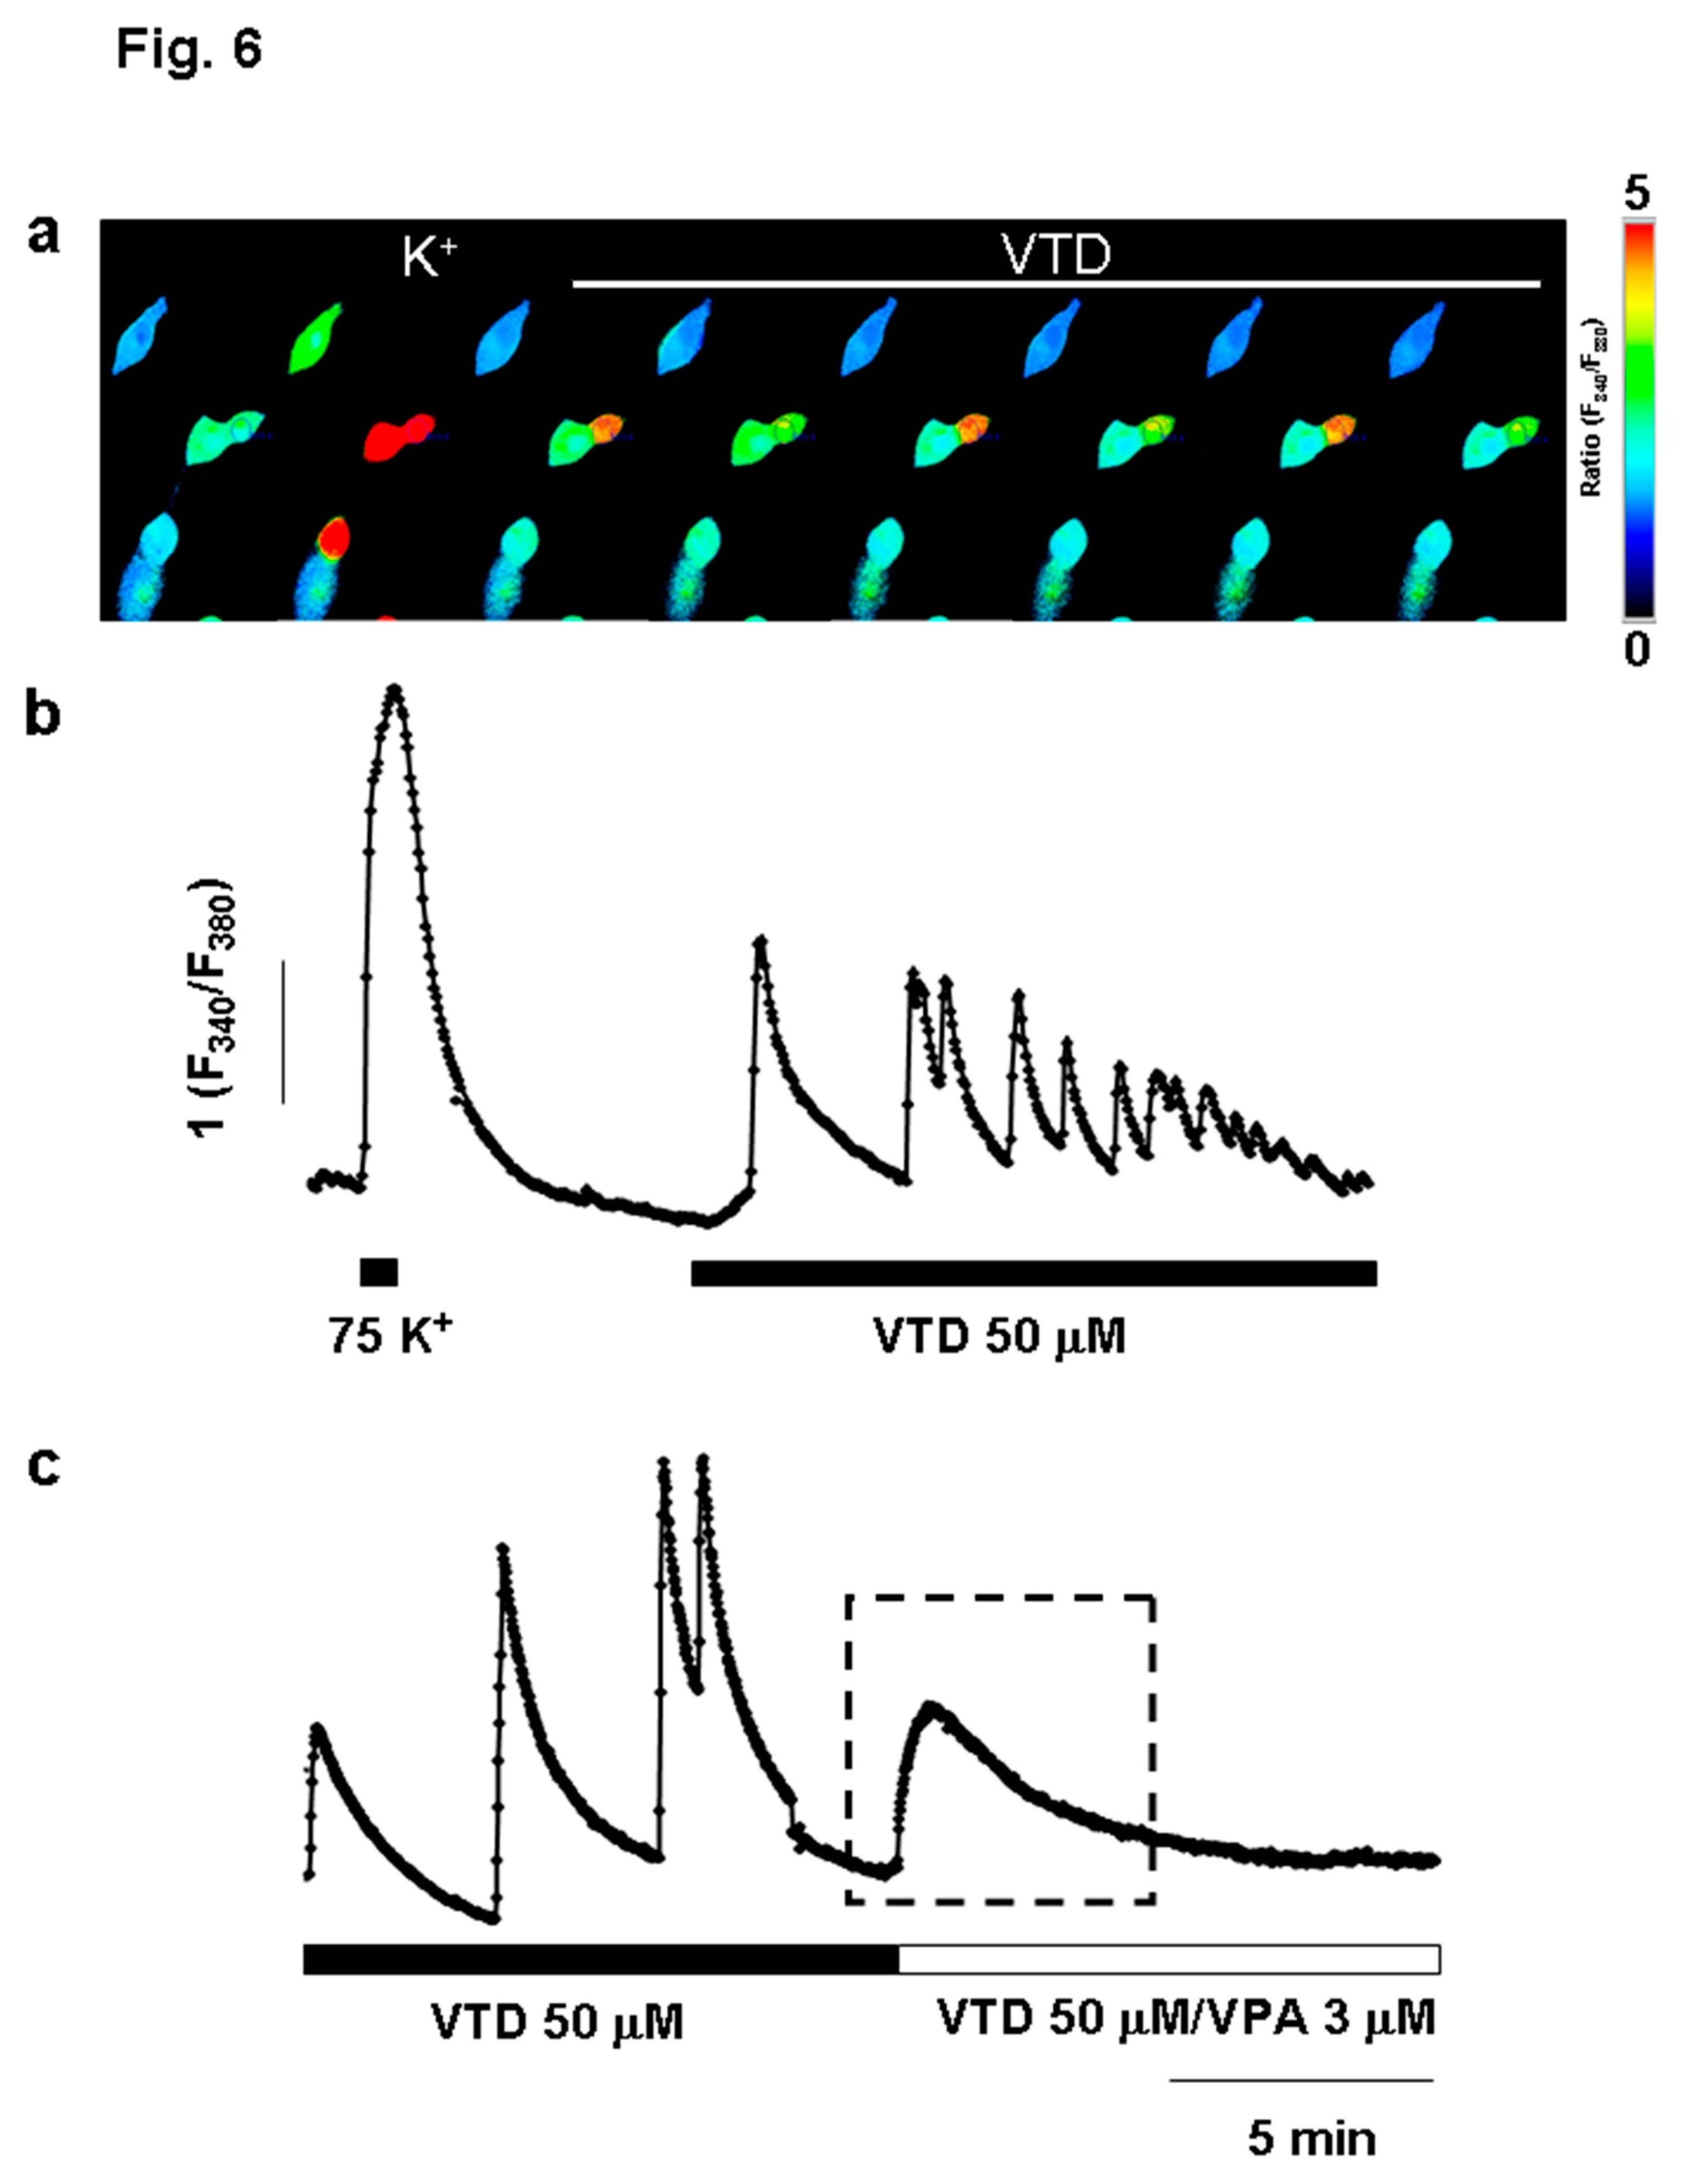
Figure 7.
VPA potentiates the release of catecholamines in BCC.
Disclaimer/Publisher’s Note: The statements, opinions and data contained in all publications are solely those of the individual author(s) and contributor(s) and not of MDPI and/or the editor(s). MDPI and/or the editor(s) disclaim responsibility for any injury to people or property resulting from any ideas, methods, instructions or products referred to in the content. |
© 2025 by the authors. Licensee MDPI, Basel, Switzerland. This article is an open access article distributed under the terms and conditions of the Creative Commons Attribution (CC BY) license (http://creativecommons.org/licenses/by/4.0/).
Copyright: This open access article is published under a Creative Commons CC BY 4.0 license, which permit the free download, distribution, and reuse, provided that the author and preprint are cited in any reuse.


