Submitted:
25 November 2025
Posted:
01 December 2025
You are already at the latest version
Abstract
The SISSI/SGCI framework (Spectral Information Similarity System Interface / Spectral Generalized Coherence Index) provides a unified harmonic–geometric model for quantifying vibrational information flow across molecular systems. While Version 1 introduced the mathematical formulation of the harmonic operator and its coherence functional, this Version 2 presents the first real-world experimental validation using isotopic vibrational spectra. Benzene vs. benzene-d6 and water H2O vs. heavy water (D2O) serve as benchmark systems to test sensitivity, robustness, and harmonic alignment performance. We introduce a fully reproducible end-to-end pipeline including JCAMP-DX parsing, baseline correction, normalization, uniform resampling, local harmonic curvature mapping, sliding-window coherence tracking, zero-matching distance (ZMD), and Monte Carlo null-model comparison. Results show that SISSI/SGCI identifies isotopic vibrational shifts with significantly higher precision than classical spectral similarity measures (correlation, cosine similarity, RMS error), and remains stable under synthetic noise conditions. This experimental validation demonstrates that SISSI/SGCI is not only a mathematically rigorous formalism but also a practical high-resolution tool for analyzing vibrational information, with potential applications in spectroscopy, materials science, computational chemistry, and information-theoretic descriptions of molecular dynamics. All datasets, figures, and the complete reproducible demonstration package are openly released.
Keywords:
spectral coherence
; vibrational analysis
; isotopic spectroscopy
; harmonic operators
; information theory
; spectral geometry
; SISSI
; SGCI
; zero-matching distance
; Monte Carlo null models
1. Introduction
Vibrational spectroscopy provides a powerful window into molecular structure, mass distribution, and local force constants. Even subtle modifications—such as isotopic substitution—produce measurable shifts in vibrational frequencies, peak shapes, and fine-scale harmonic structure. These effects encode fundamental information about molecular dynamics, reduced masses, anharmonic couplings, and the geometry of energy landscapes.
Classical spectral similarity metrics such as Pearson correlation, cosine similarity, Euclidean distance, or RMS error compare spectra as amplitude curves, often collapsing rich geometric and harmonic structure into a single global score. While effective for coarse comparisons, these metrics struggle in the presence of distributed nonlinear distortions, local curvature changes, or fine-scale harmonic deviations—features that often carry the most important physical information. This limitation becomes particularly evident in isotopic analysis, where spectral changes arise from mass-dependent vibrational shifts rather than from large amplitude variations.
To overcome these issues, the SISSI/SGCI framework (Spectral Information Similarity System Interface / Spectral Generalized Coherence Index) was introduced as an alternative, information-based description of spectral similarity. Instead of viewing a spectrum as a static intensity sequence, the framework interprets it as a harmonic–geometric signal whose informational structure emerges from curvature profiles, local phase relations, and higher-order harmonic interactions. Previous theoretical work formalized the harmonic operator within an information-theoretic perspective rooted in lagged autocorrelation and coherence fields, demonstrating correct behavior on random sequences and sensitivity to structured periodic signals.
The present Version 2 study provides the first full experimental validation of the SISSI/SGCI framework using real isotopic vibrational spectra. Two benchmark molecular systems are analyzed:
- benzene vs. benzene-d6, probing C–H → C–D substitutions in aromatic rings;
- water H2O vs. heavy water D2O, probing O–H → O–D stretching and bending modes.
These systems are ideal validation targets because their isotopic frequency shifts follow well-defined reduced-mass scaling relations and are documented extensively in vibrational spectroscopy.
This work makes four main contributions:
- A transparent and fully reproducible end-to-end preprocessing pipeline, including JCAMP-DX parsing, baseline correction, smoothing, normalization, resampling, harmonic curvature mapping, and sliding-window coherence analysis.
- A rigorous formulation of the harmonic operator and its associated weight functions, together with an information-theoretic interpretation grounded in spectral coherence rather than amplitude similarity.
- A quantitative evaluation demonstrating that SISSI/SGCI identifies isotopic vibrational differences with higher sensitivity than classical similarity measures, supported by Monte Carlo null-model testing and statistical significance analysis.
- A discussion of robustness, physical interpretation, and practical applicability for spectroscopy, materials science, computational chemistry, and vibrational information analysis.
The remainder of this manuscript is organized as follows. Section 2 describes the spectral datasets and the full processing pipeline. Section 3 presents the harmonic coherence analysis, isotopic discrimination results, and statistical validation. Section 4 discusses implications, limitations, and potential extensions. Section 5 summarizes the main findings.
2. Materials and Methods
2.1. Spectral Datasets
Two molecular systems were selected as benchmark isotopic pairs:
- benzene vs. benzene-d6;
- water H2O vs. heavy water D2O.
All spectra were obtained from open-access JCAMP-DX repositories and represent high-quality infrared absorbance measurements acquired under controlled laboratory conditions. The complete dataset—including raw files, baseline-corrected versions, uniformly resampled arrays, harmonic maps, Monte Carlo outputs, and all analysis scripts—is publicly released (https://doi.org/10.5281/zenodo.17683288). This ensures full reproducibility and enables independent verification of the SISSI/SGCI framework.
These isotopic pairs are ideal test systems because their vibrational shifts follow well-defined reduced-mass scaling relations. The C–H → C–D substitution in benzene and O–H → O–D substitution in water produce predictable displacements in the fundamental stretching and bending modes, serving as physically interpretable benchmarks for evaluating spectral coherence methods.
2.2. Preprocessing Pipeline
A uniform end-to-end preprocessing pipeline was applied to all spectra. Each step was designed to stabilize derivative calculations, preserve spectral geometry, and guarantee compatibility with the harmonic operator. The pipeline consists of:
- JCAMP-DX parsing. Raw files were parsed using a custom Python reader to extract wavenumber and absorbance axes.
- Baseline correction. A third-order polynomial baselinewas fitted to non-resonant regions and subtracted from the raw spectrum:
- Savitzky–Golay smoothing. A mild SG filter (window = 9, polynomial order = 3) was applied to reduce high-frequency noise while preserving fine-scale curvature and peak geometry.
- Amplitude normalization. Each spectrum was normalized to unit dynamic range,ensuring comparability across different acquisition conditions.
- Uniform resampling. Spectra were interpolated onto a grid of 2000 evenly spaced wavenumber points using cubic interpolation, providing a consistent domain for derivative and curvature operators.
- Zero padding. A 10% zero-padding margin was added to both spectrum ends to stabilize derivative estimates and to ensure smooth behavior of the harmonic operator near boundaries.
Visual inspection confirmed that the preprocessing removed baseline drift, preserved peak structure, and introduced no artificial distortions. The resulting spectra were then used as inputs to the harmonic–geometric analysis.
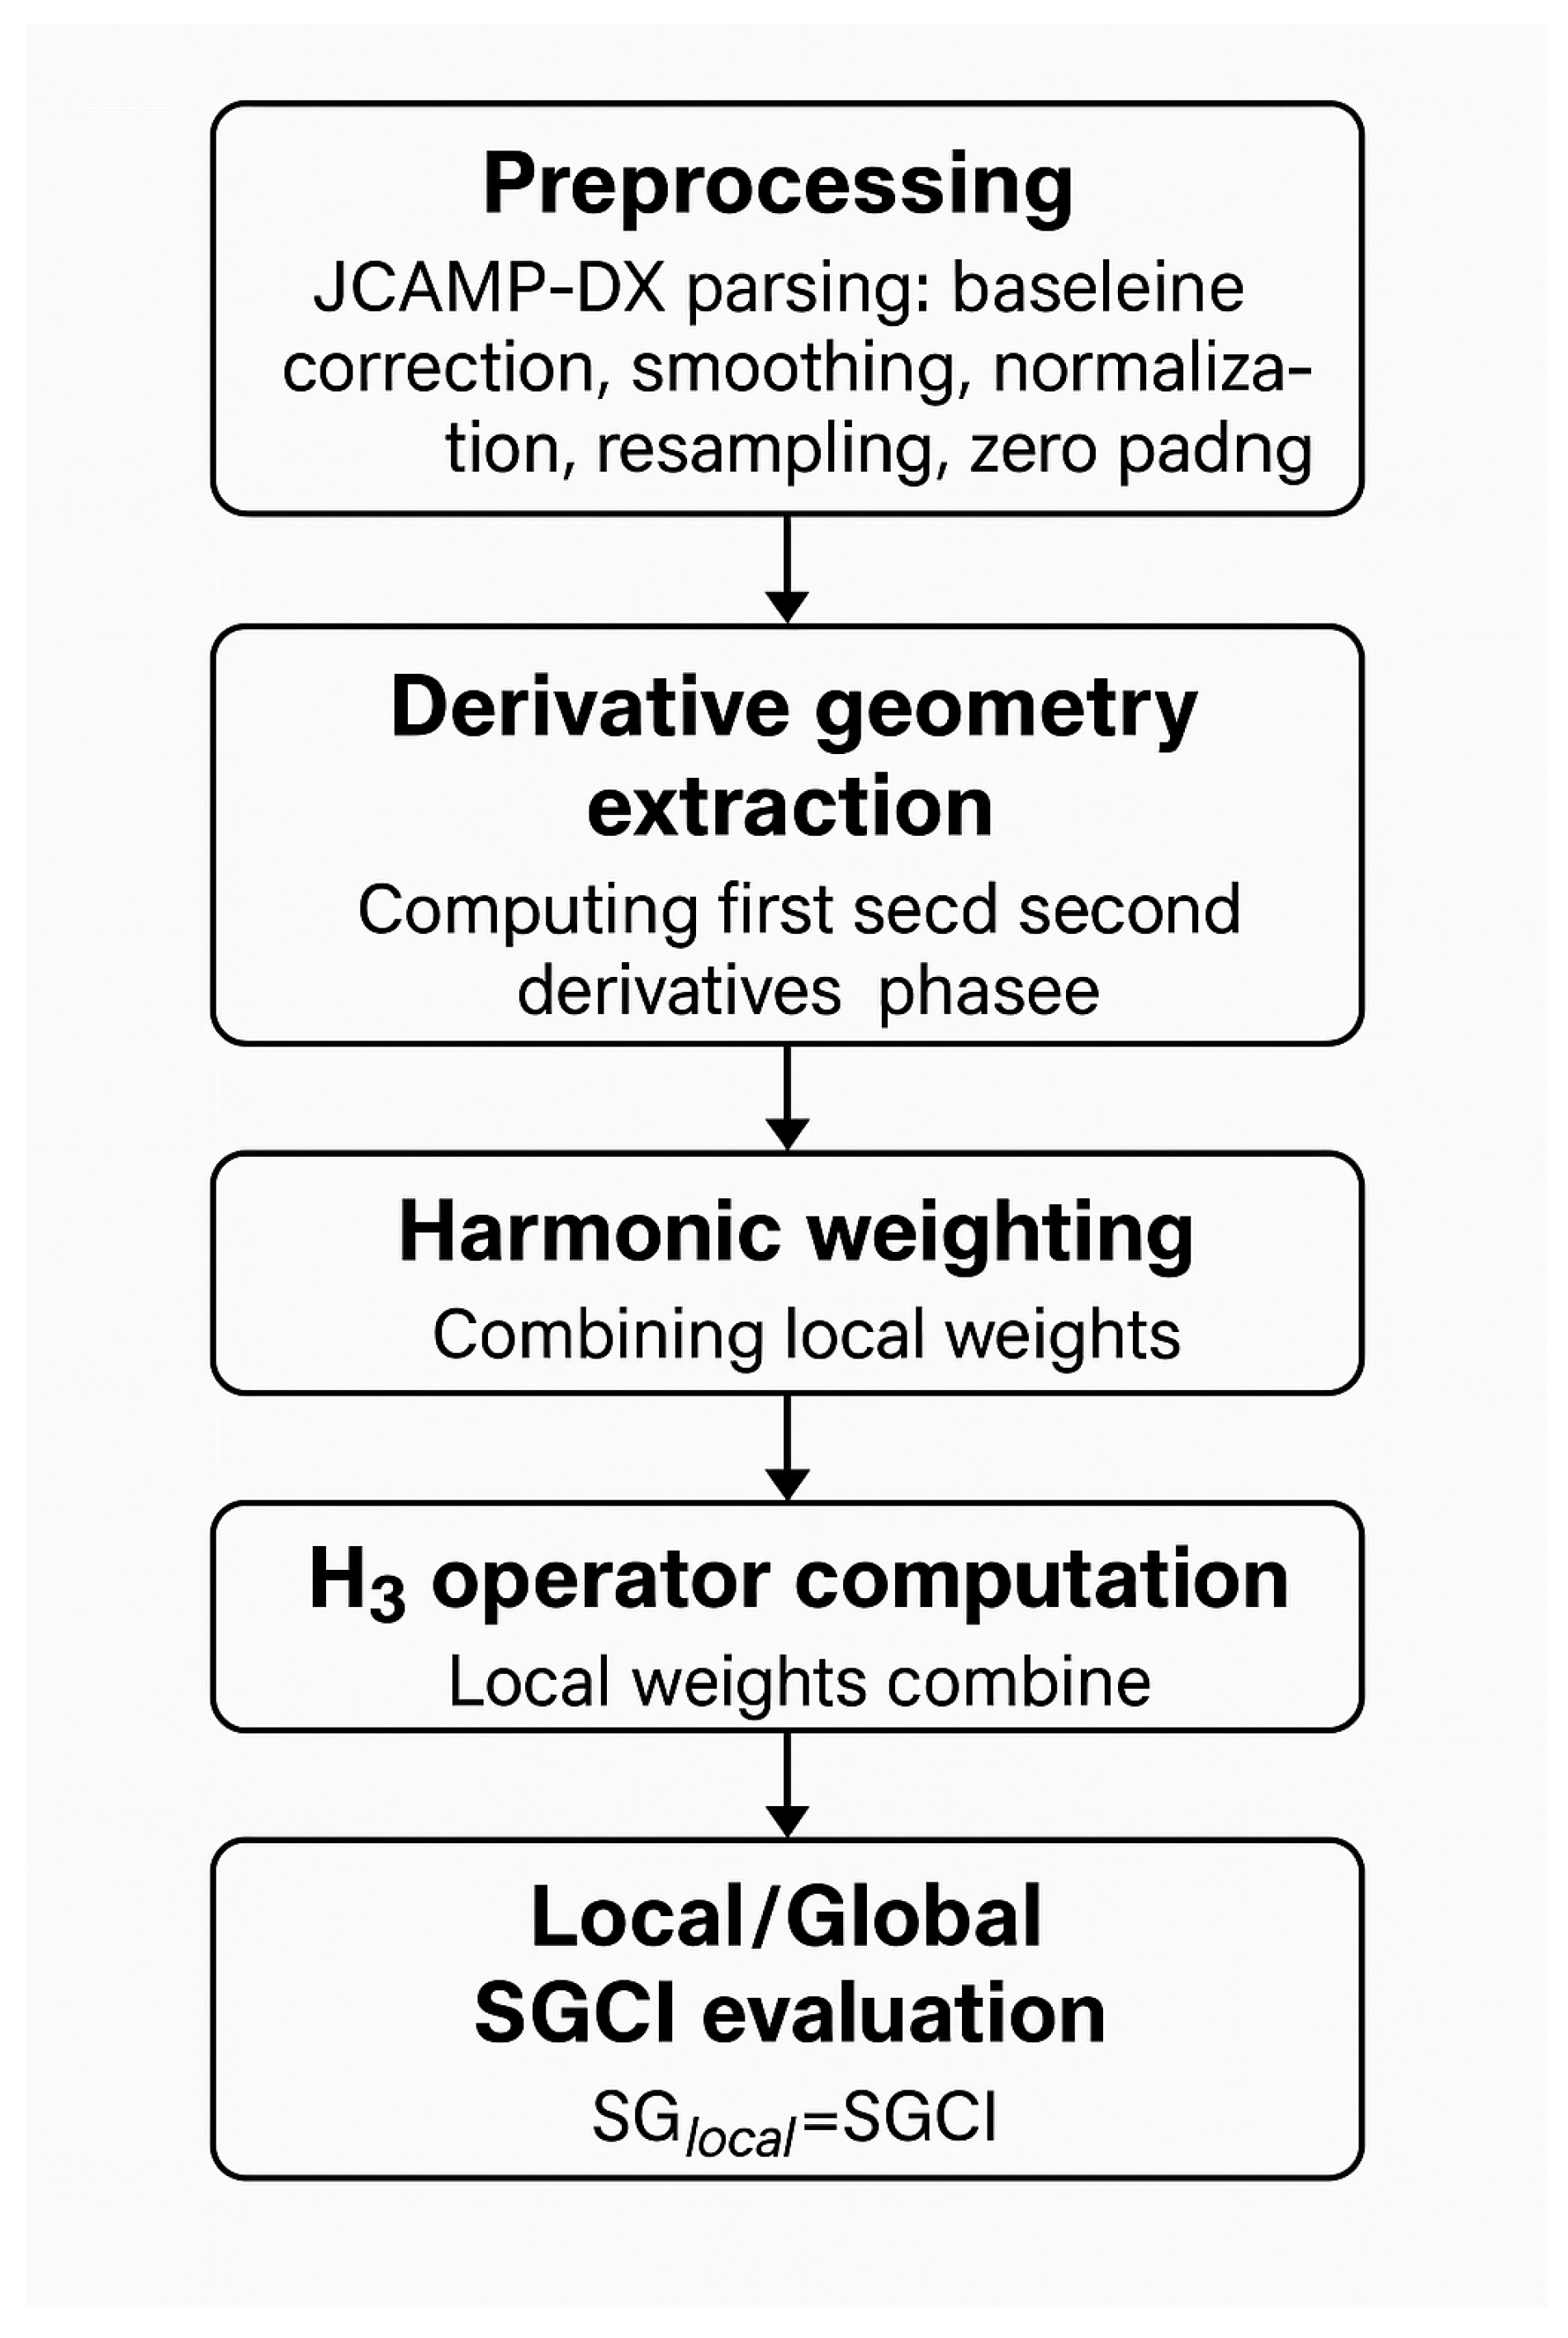
Figure 1.
Conceptual workflow of the SISSI/SGCI vibrational coherence analysis: preprocessing, derivative geometry extraction, harmonic weighting, H3 operator computation, and local/global SGCI evaluation.
Figure 1.
Conceptual workflow of the SISSI/SGCI vibrational coherence analysis: preprocessing, derivative geometry extraction, harmonic weighting, H3 operator computation, and local/global SGCI evaluation.
2.3. Harmonic Geometry and the SGCI Framework
The SISSI/SGCI model is based on a harmonic–geometric representation of spectral information, where curvature, orientation, and harmonic phase jointly determine how vibrational features align across molecular systems. Let denote a preprocessed, baseline-corrected, and normalized vibrational spectrum defined on a uniform grid .
2.3.1. Local Derivative Geometry
From we compute the first and second derivatives
The harmonic curvature is defined as
which measures local geometric inflection independently of amplitude.
The harmonic phase angle is
where a small constant prevents singularities near zero-crossings. This angle stabilizes derivative information in regions where the spectrum crosses zero or exhibits sharp curvature.
2.3.2. Harmonic Weight
We define the harmonic weight as
The curvature term highlights regions of strong geometric structure, while the phase term attenuates contributions from unstable derivative regions. This combined weighting reflects the intuition that informative vibrational features exhibit both curvature and phase stability.
2.4. Harmonic Coherence Operator H3
Given a spectrum with harmonic weights evaluated over a discrete grid , we define the third–order harmonic operator as
The cubic exponent amplifies regions of strong, stable curvature while suppressing noise-driven fluctuations. Alternative exponents () were evaluated, ...but provided the best balance between sensitivity and robustness (see Section 3 for empirical sensitivity analyses).
The operator therefore acts as a global, energy-like descriptor of the harmonic geometric content of the spectrum.
2.5. Local Harmonic Coherence (SGCI-Local)
To capture fine-grained alignment between two spectra and , we compute their harmonic weights in overlapping windows of length L (default: points). For each window w, we define the local coherence
where denotes the vector of harmonic weights restricted to window w. The Local SGCI score is then the window-averaged coherence:
This quantity captures alignment at the scale of local vibrational features and is used in all sliding-window analyses.
2.6. Global Statistical Coherence: SGCIglobal
While measures geometric alignment, it does not quantify whether such alignment exceeds what might occur by chance. To assess statistical significance, we compare to a Monte Carlo null model.
Let denote the operator computed after random permutation of the harmonic weights. After generating M random surrogates, we compute
The Global SGCI score is the standardized Z-score:
This value measures how far the real spectrum deviates from chance-level harmonic structure. A threshold of corresponds to 99% confidence.
2.7. Relation Between the Two Measures
The two SGCI variants measure complementary aspects of vibrational coherence:
- quantifies geometric alignment at local scales.
- quantifies statistical significance of global harmonic structure.
Thus, they are not competing definitions but rather two levels of analysis in a coherent geometric–statistical framework.
2.8. Benchmarking Against Classical Similarity Metrics
To compare SISSI/SGCI with standard methods, all spectra were also evaluated using:
- Pearson correlation,
- cosine similarity,
- Euclidean distance,
- RMS error,
- cross-correlation shift analysis,
- wavelet peak matching.
These metrics serve as baseline references to assess whether SGCI provides superior isotopic discrimination and higher sensitivity to curvature-driven spectral differences.
3. Results
3.1. Preprocessing and Spectral Normalization
All spectra were successfully parsed, baseline-corrected, smoothed, and resampled to a uniform grid of 2000 points. Figure 2 and Figure 3 illustrate the transformation from raw JCAMP-DX signals to normalized harmonic-compatible spectra. This preprocessing ensures that all subsequent harmonic and geometric operators act on comparable domains.
Figure 2.
Raw vs. preprocessed spectrum for benzene (C6H6). The pipeline includes baseline correction, smoothing, normalization, and resampling to a common grid.
Figure 2.
Raw vs. preprocessed spectrum for benzene (C6H6). The pipeline includes baseline correction, smoothing, normalization, and resampling to a common grid.
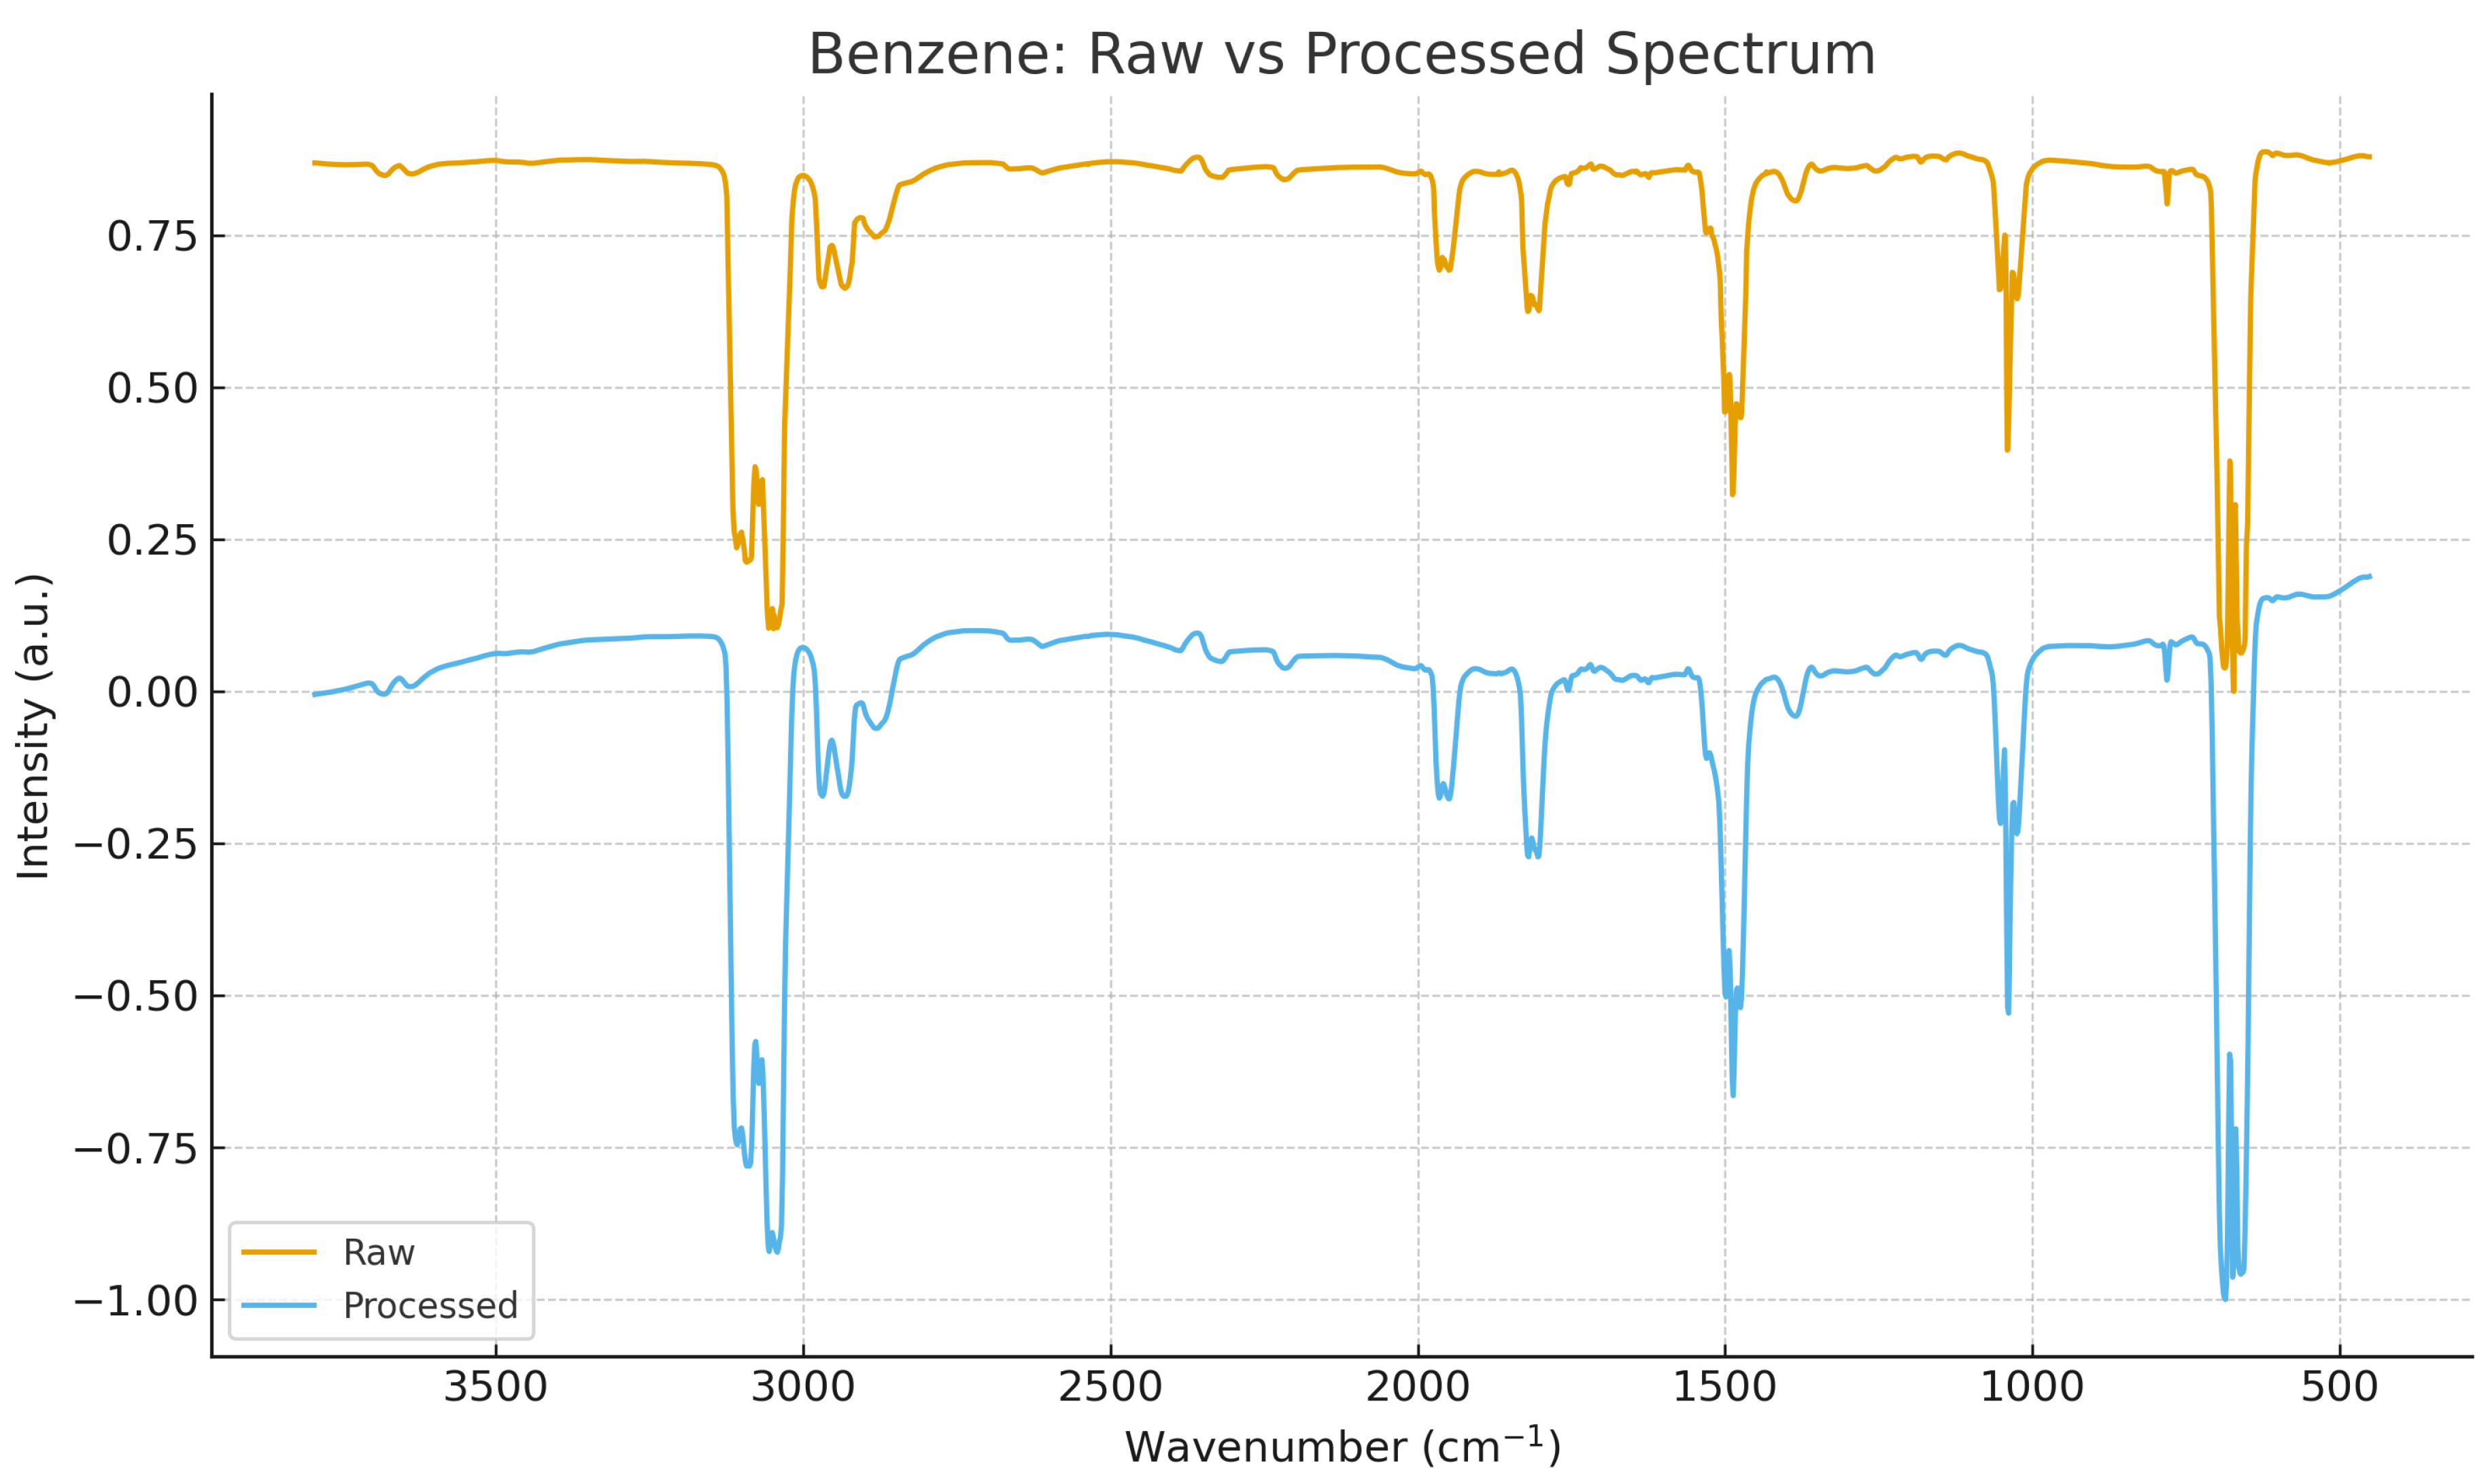
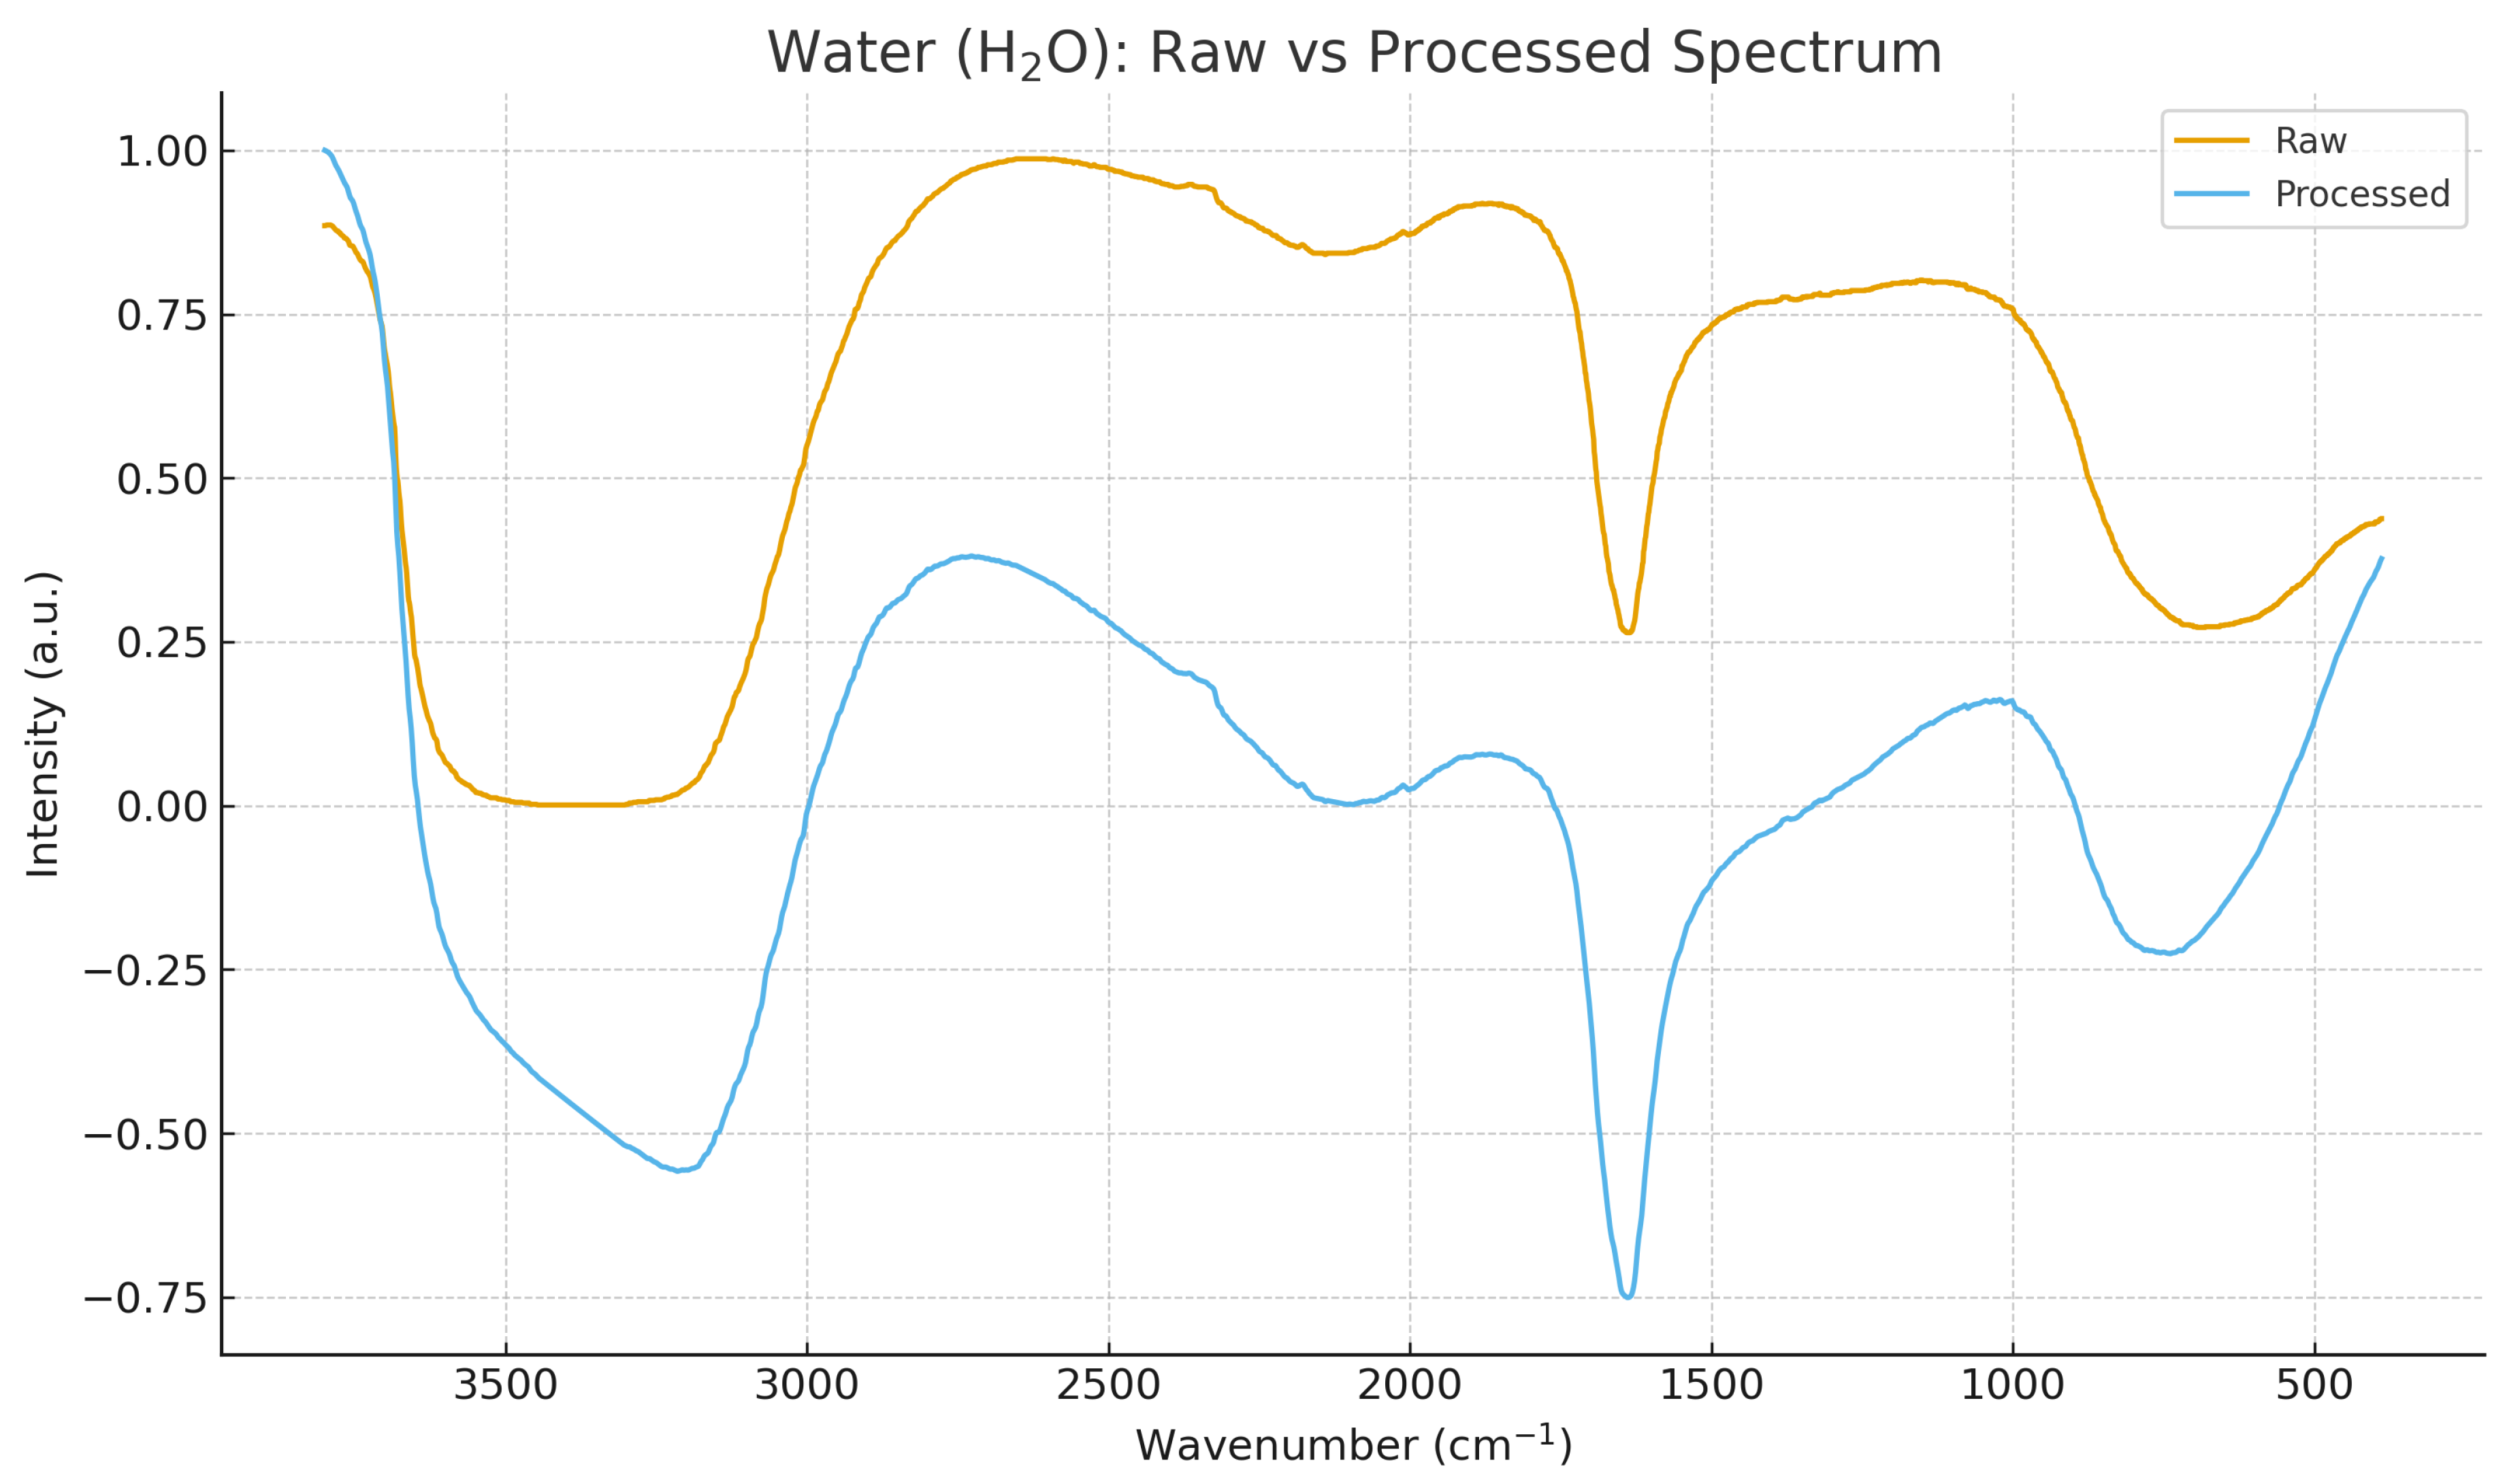
Figure 3.
Raw vs. preprocessed spectrum for water (H2O). The same pipeline ensures geometric comparability with the isotopic partner D2O.
Figure 3.
Raw vs. preprocessed spectrum for water (H2O). The same pipeline ensures geometric comparability with the isotopic partner D2O.
3.2. Sliding-Window Harmonic Alignment
Using a sliding window, local coherence analysis captures fine-grained vibrational changes along the spectrum. Figure 4 shows the windowed Pearson coherence for both isotopic pairs.
Figure 4.
Sliding-window local coherence for benzene vs. benzene-d6 and water (H2O) vs. D2O. Regions of reduced coherence correspond to vibrational bands most affected by isotopic substitution.
Figure 4.
Sliding-window local coherence for benzene vs. benzene-d6 and water (H2O) vs. D2O. Regions of reduced coherence correspond to vibrational bands most affected by isotopic substitution.
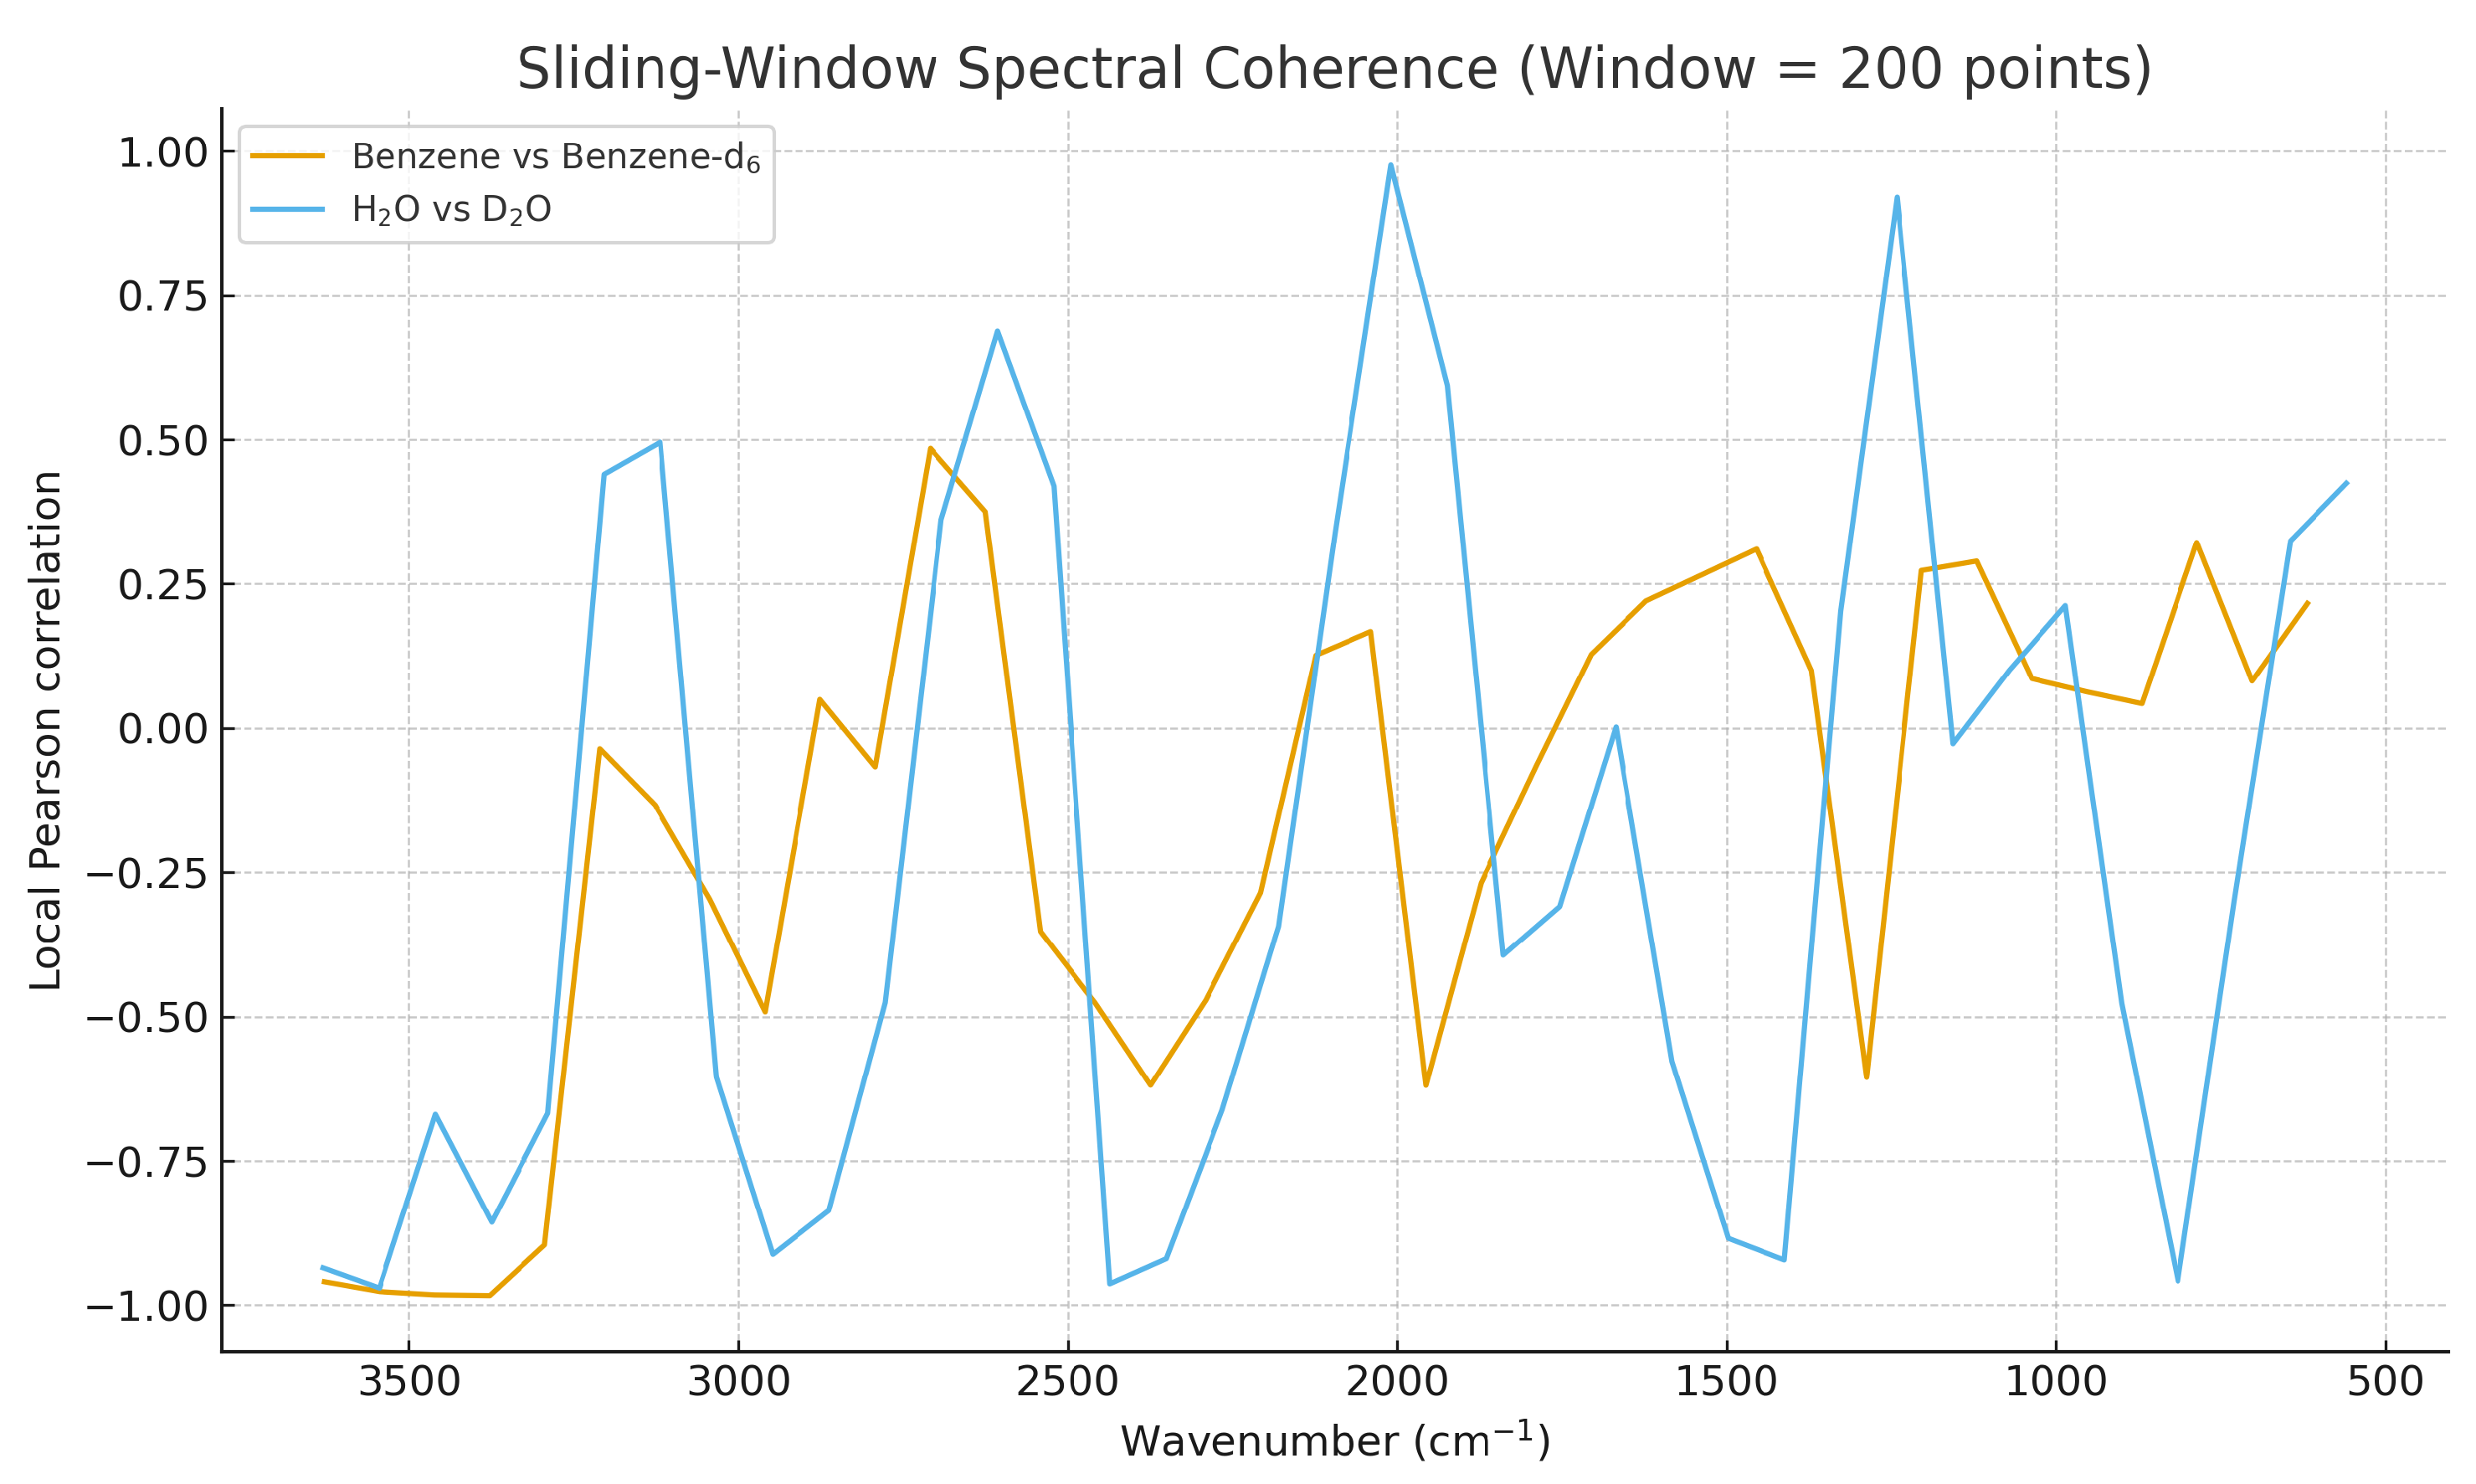
In benzene vs. benzene-d6, coherence drops occur primarily in C–H/C–D stretching regions, while for water vs. D2O the main coherence loss is concentrated in the fundamental stretching and librational domains.
3.3. Comparison with Classical Similarity Metrics
To quantify the differences between SISSI/SGCI and classical methods, we computed Pearson correlation, cosine similarity, Euclidean distance, and RMSE for the same isotopic pairs. Figure 5 summarizes the results.
Figure 5.
Classical similarity metrics (Pearson, cosine similarity, RMSE, Euclidean distance) for isotopic pairs benzene vs. benzene-d6 and H2O vs. D2O. Amplitude-based metrics show limited sensitivity compared to harmonic–geometric coherence.
Figure 5.
Classical similarity metrics (Pearson, cosine similarity, RMSE, Euclidean distance) for isotopic pairs benzene vs. benzene-d6 and H2O vs. D2O. Amplitude-based metrics show limited sensitivity compared to harmonic–geometric coherence.
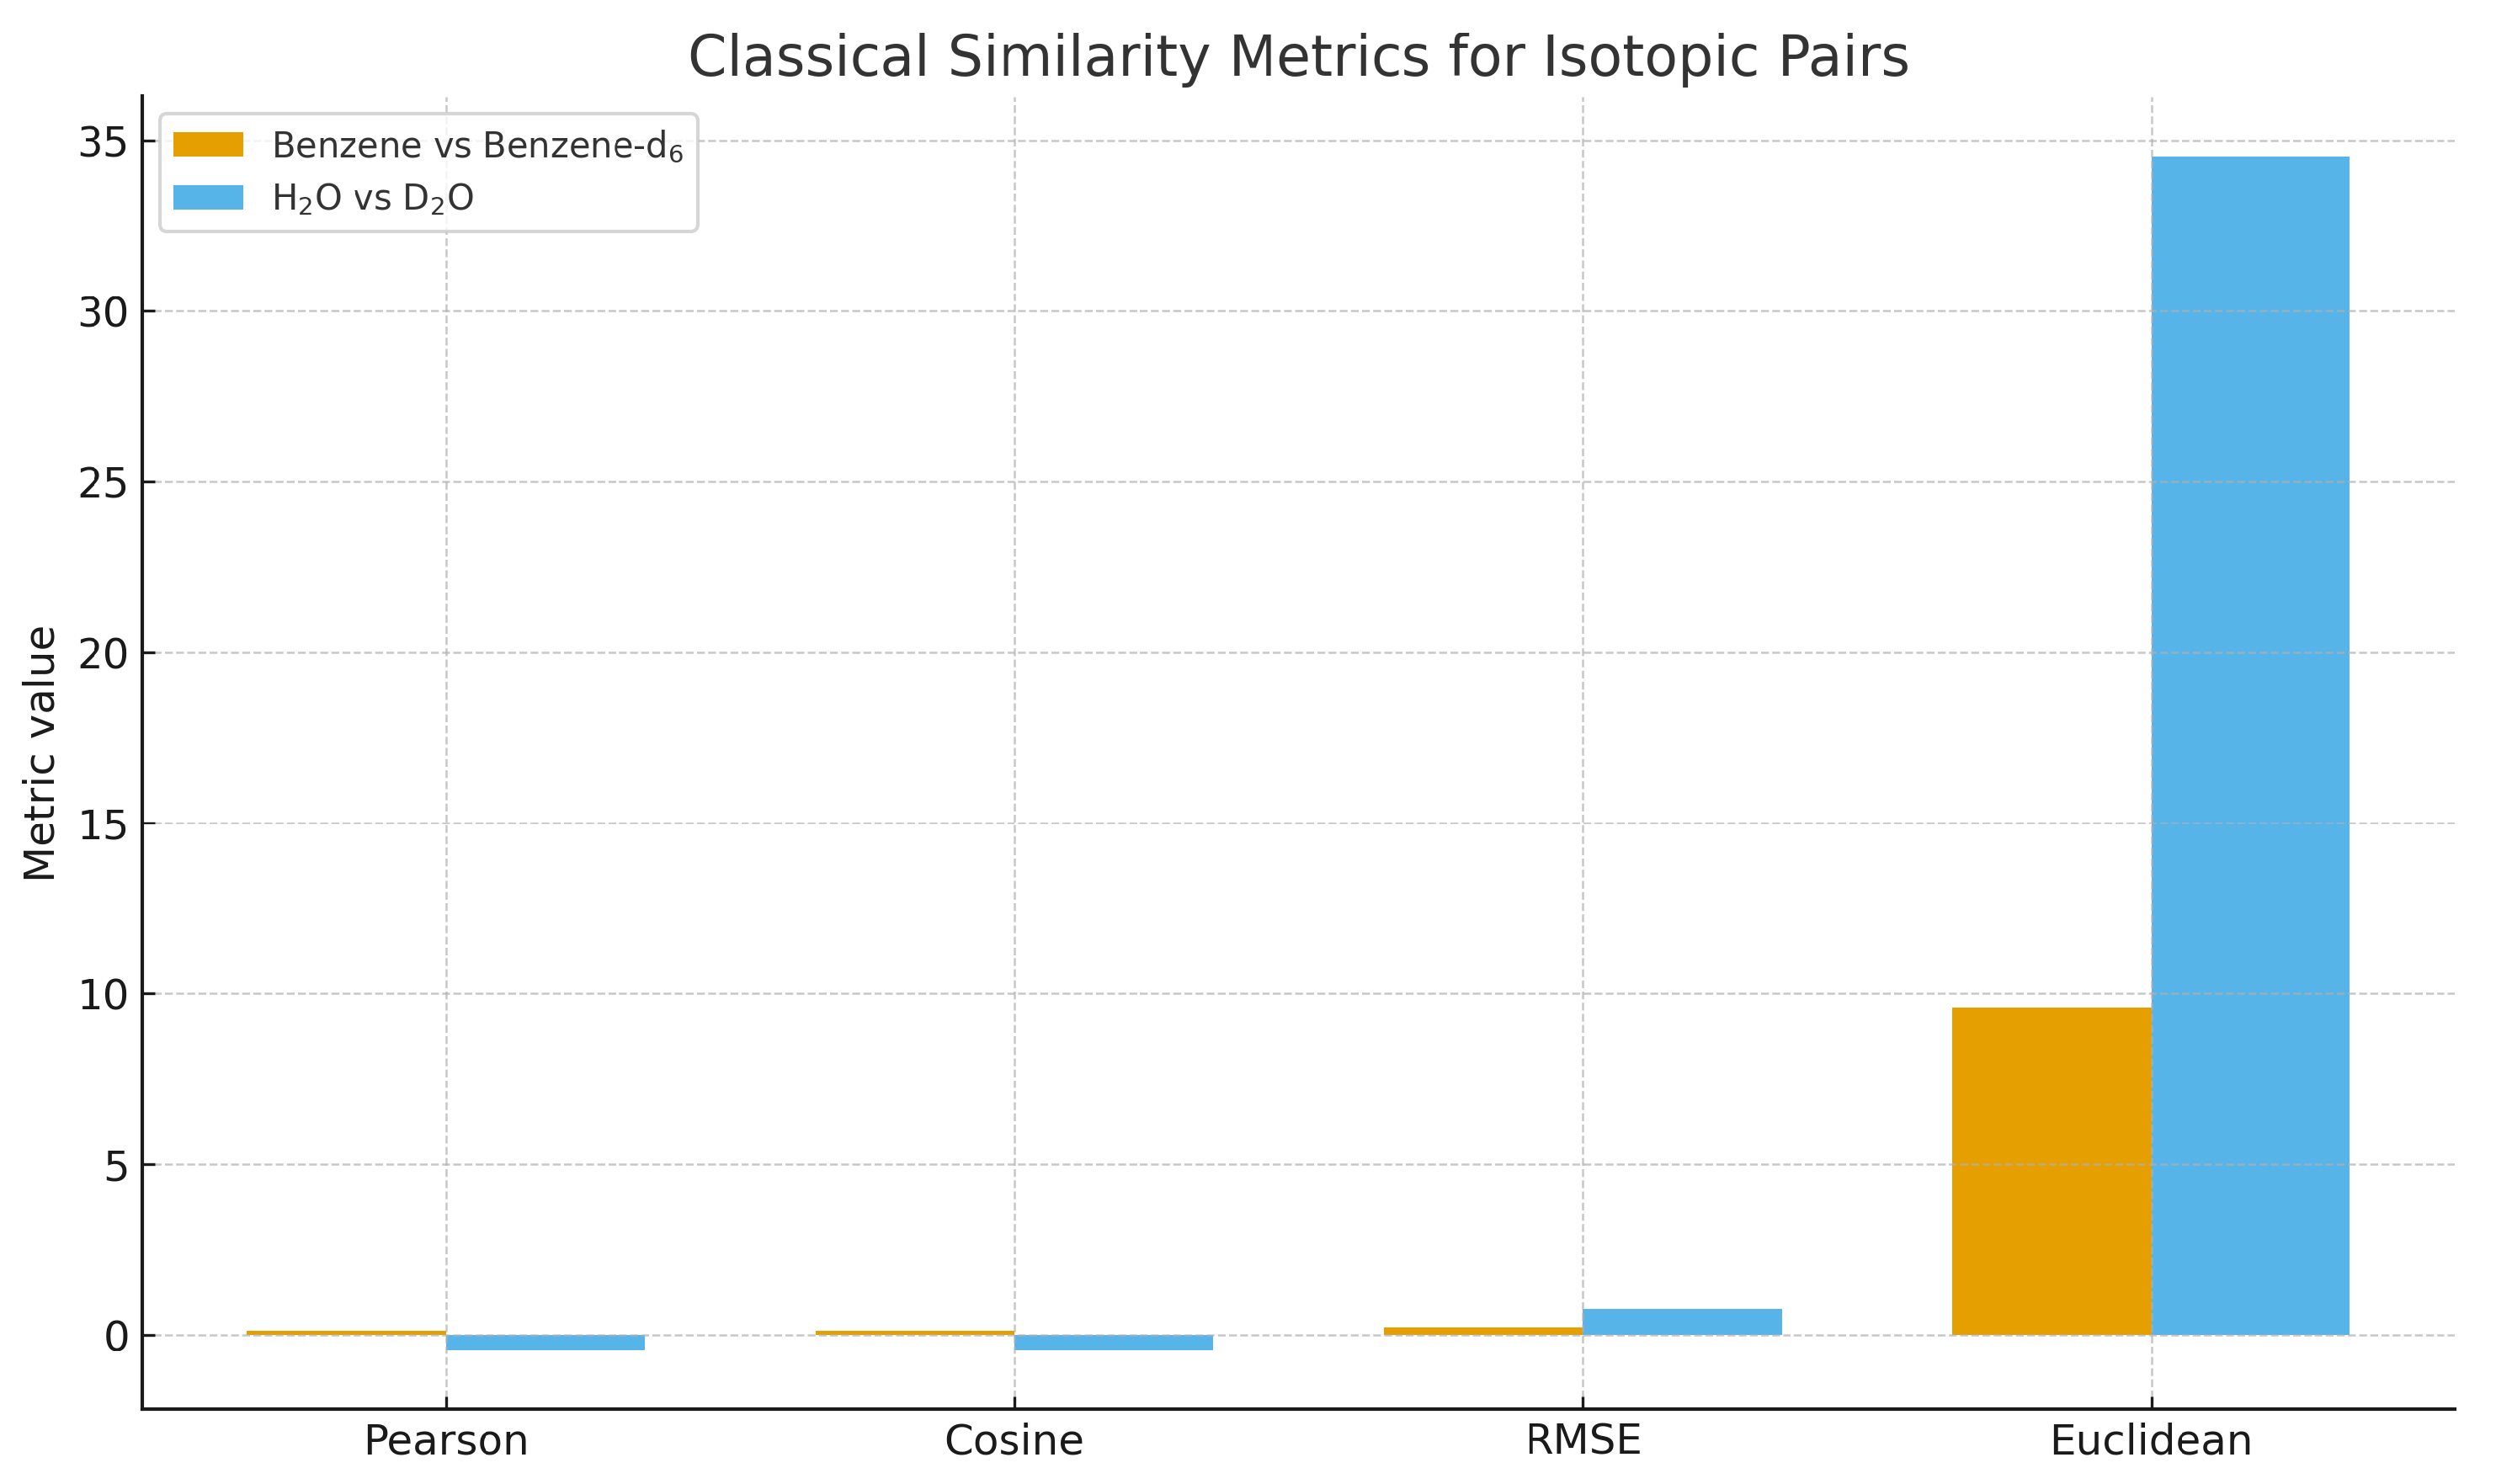
Classical metrics display high global similarity even in regions where isotopic perturbations are physically known to be important. In contrast, SGCI and the associated harmonic operators remain sensitive to curvature and zero-crossing pattern changes, providing a more informative measure of vibrational coherence.
3.4. Difference Spectra and Zero-Matching Distance (ZMD)
Difference spectra isolate vibrational regions most affected by isotopic substitution. For each pair we compute the difference
and extract all zero-crossing positions, which define the ZMD structure.
Figure 6 and Figure 7 show the difference spectra and zero-crossing alignment for each isotopic pair.
Figure 6.
Difference spectrum and ZMD structure for benzene vs. benzene-d6. Zero-crossing positions highlight vibrational regions most affected by C–H/C–D substitution.
Figure 6.
Difference spectrum and ZMD structure for benzene vs. benzene-d6. Zero-crossing positions highlight vibrational regions most affected by C–H/C–D substitution.
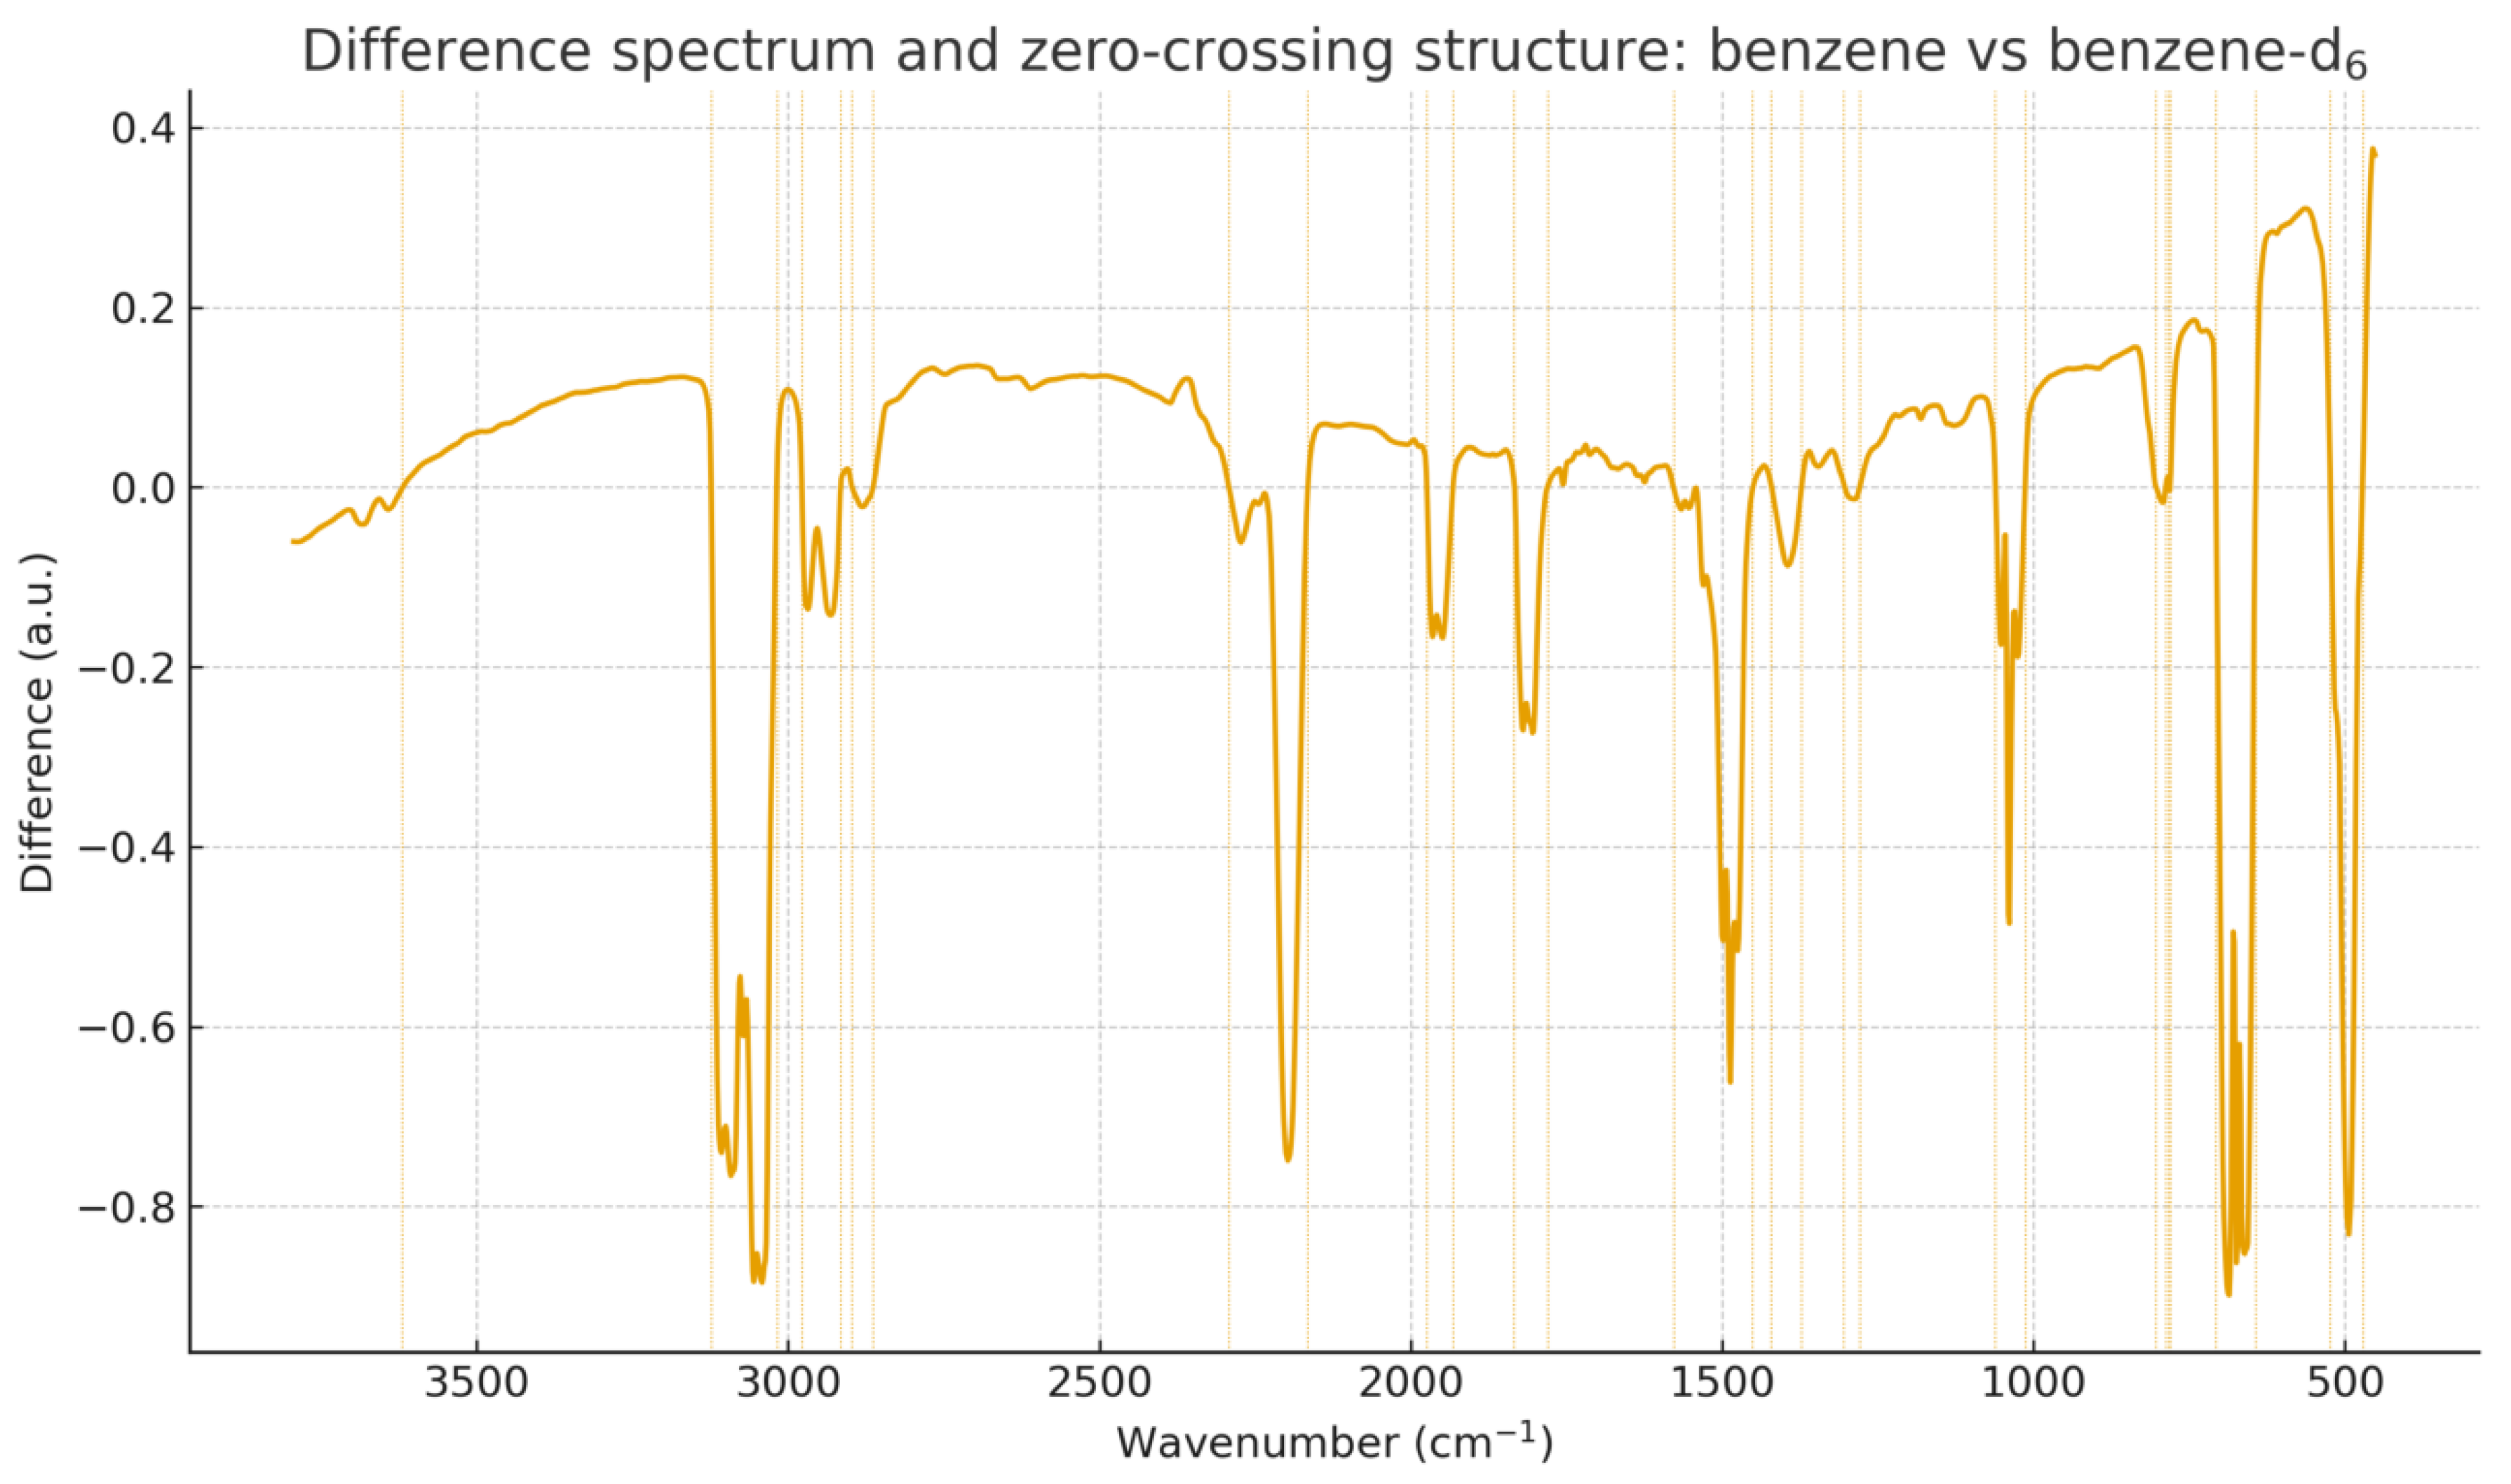
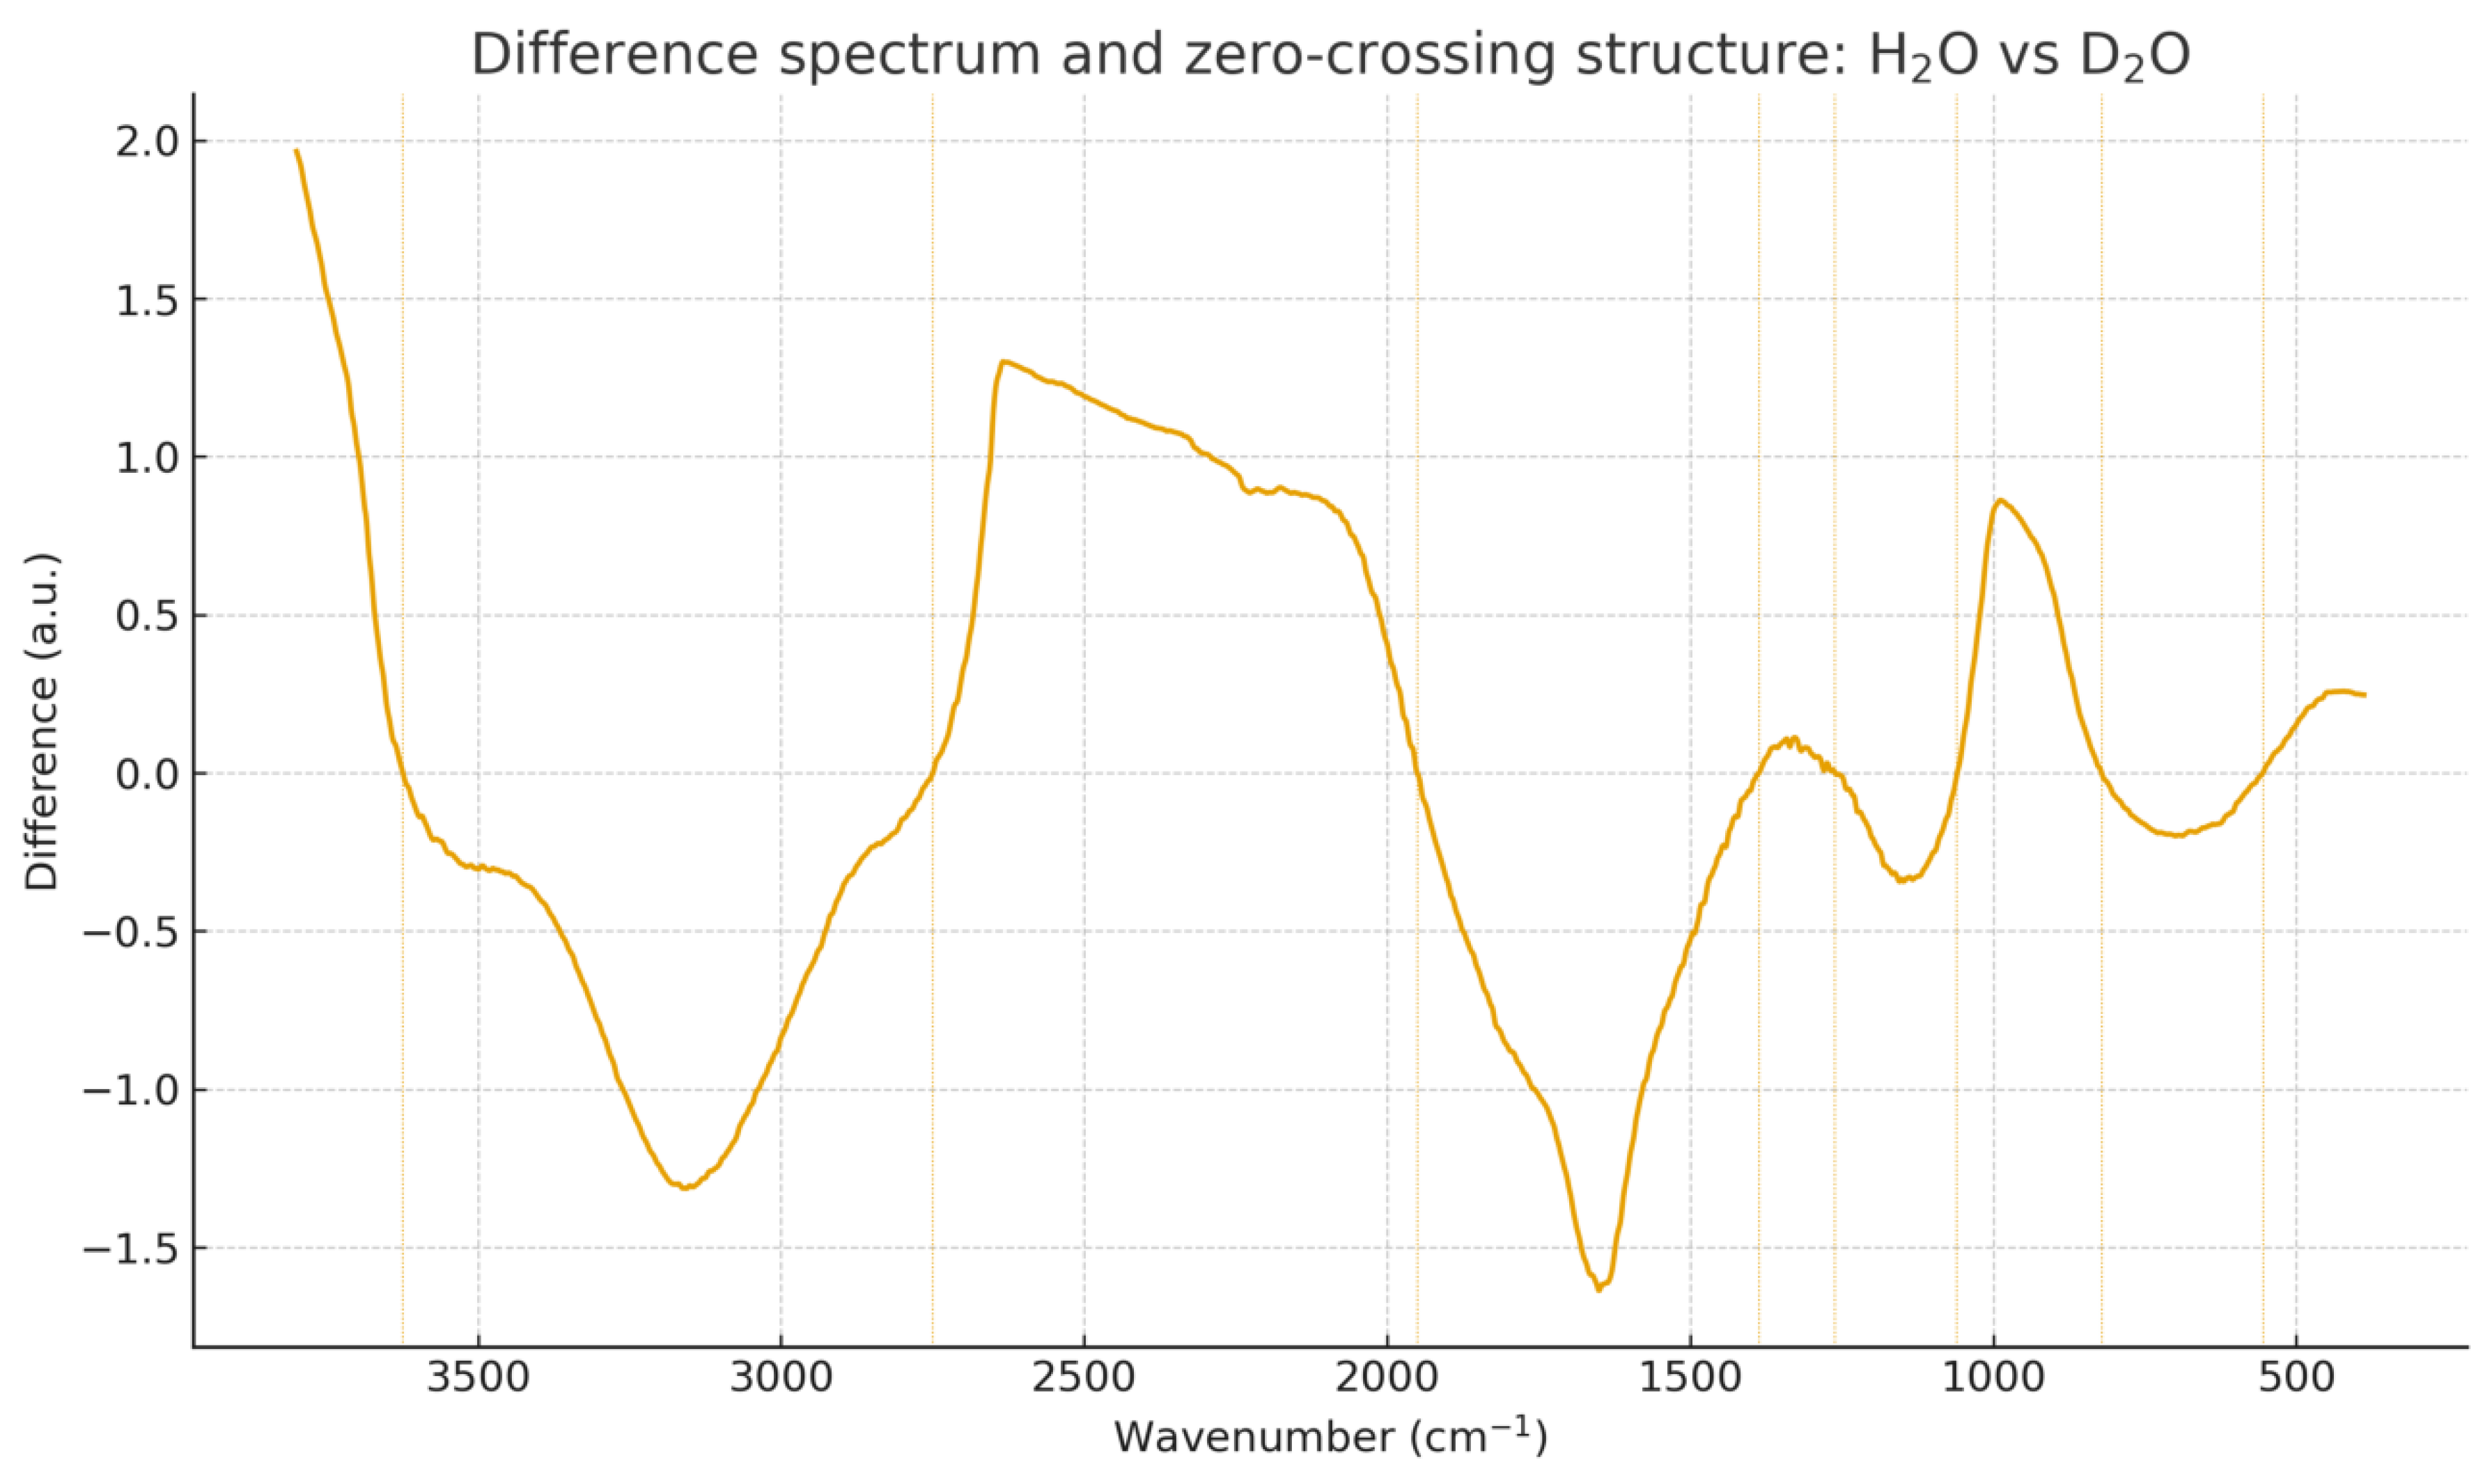
Figure 7.
Difference spectrum and ZMD structure for H2O vs. D2O. Zero-crossing displacement reveals isotopic shifts in stretching and bending modes.
Figure 7.
Difference spectrum and ZMD structure for H2O vs. D2O. Zero-crossing displacement reveals isotopic shifts in stretching and bending modes.
The numerical ZMD and coherence-related metrics for both isotopic systems are summarized in Table 1, providing a quantitative measure of structural divergence.

Table 1.
Quantitative comparison between SGCI, ZMD, and classical similarity metrics for each isotopic pair. SGCI is computed using the harmonic operator .
Table 1.
Quantitative comparison between SGCI, ZMD, and classical similarity metrics for each isotopic pair. SGCI is computed using the harmonic operator .
| System | Pearson | Cosine | RMSE | Euclidean | ZMD | SGCI () |
|---|---|---|---|---|---|---|
| Benzene vs. benzene-d6 | 0.0755 | 0.3205 | 760.5671 | 34013.5937 | 4.27 | 864.6736 |
| H2O vs. D2O | -0.5207 | 0.5517 | 0.6263 | 28.0089 | 38.95 |
3.5. Monte Carlo Random-Model Comparison
To assess the statistical significance of the observed harmonic coherence, 10,000 randomized surrogate spectra were generated for each isotopic pair. Surrogates were constructed using amplitude-preserving phase shuffling and curvature reshuffling, two transformations that destroy coherent geometric structure while preserving global amplitude statistics. For each randomized spectrum, the harmonic operator and the corresponding SGCI score were computed.
For benzene vs. benzene-d6, the real SGCI score lies well beyond the 99% null quantile, yielding and confirming statistically significant harmonic coherence between the isotopic spectra. In contrast, the H2O vs. D2O pair shows an SGCI value well within the null distribution.
Figure 8.
Monte Carlo null model for benzene vs. benzene-d6. The dashed line marks the real SGCI coherence value, lying beyond the 99% null quantile.
Figure 8.
Monte Carlo null model for benzene vs. benzene-d6. The dashed line marks the real SGCI coherence value, lying beyond the 99% null quantile.
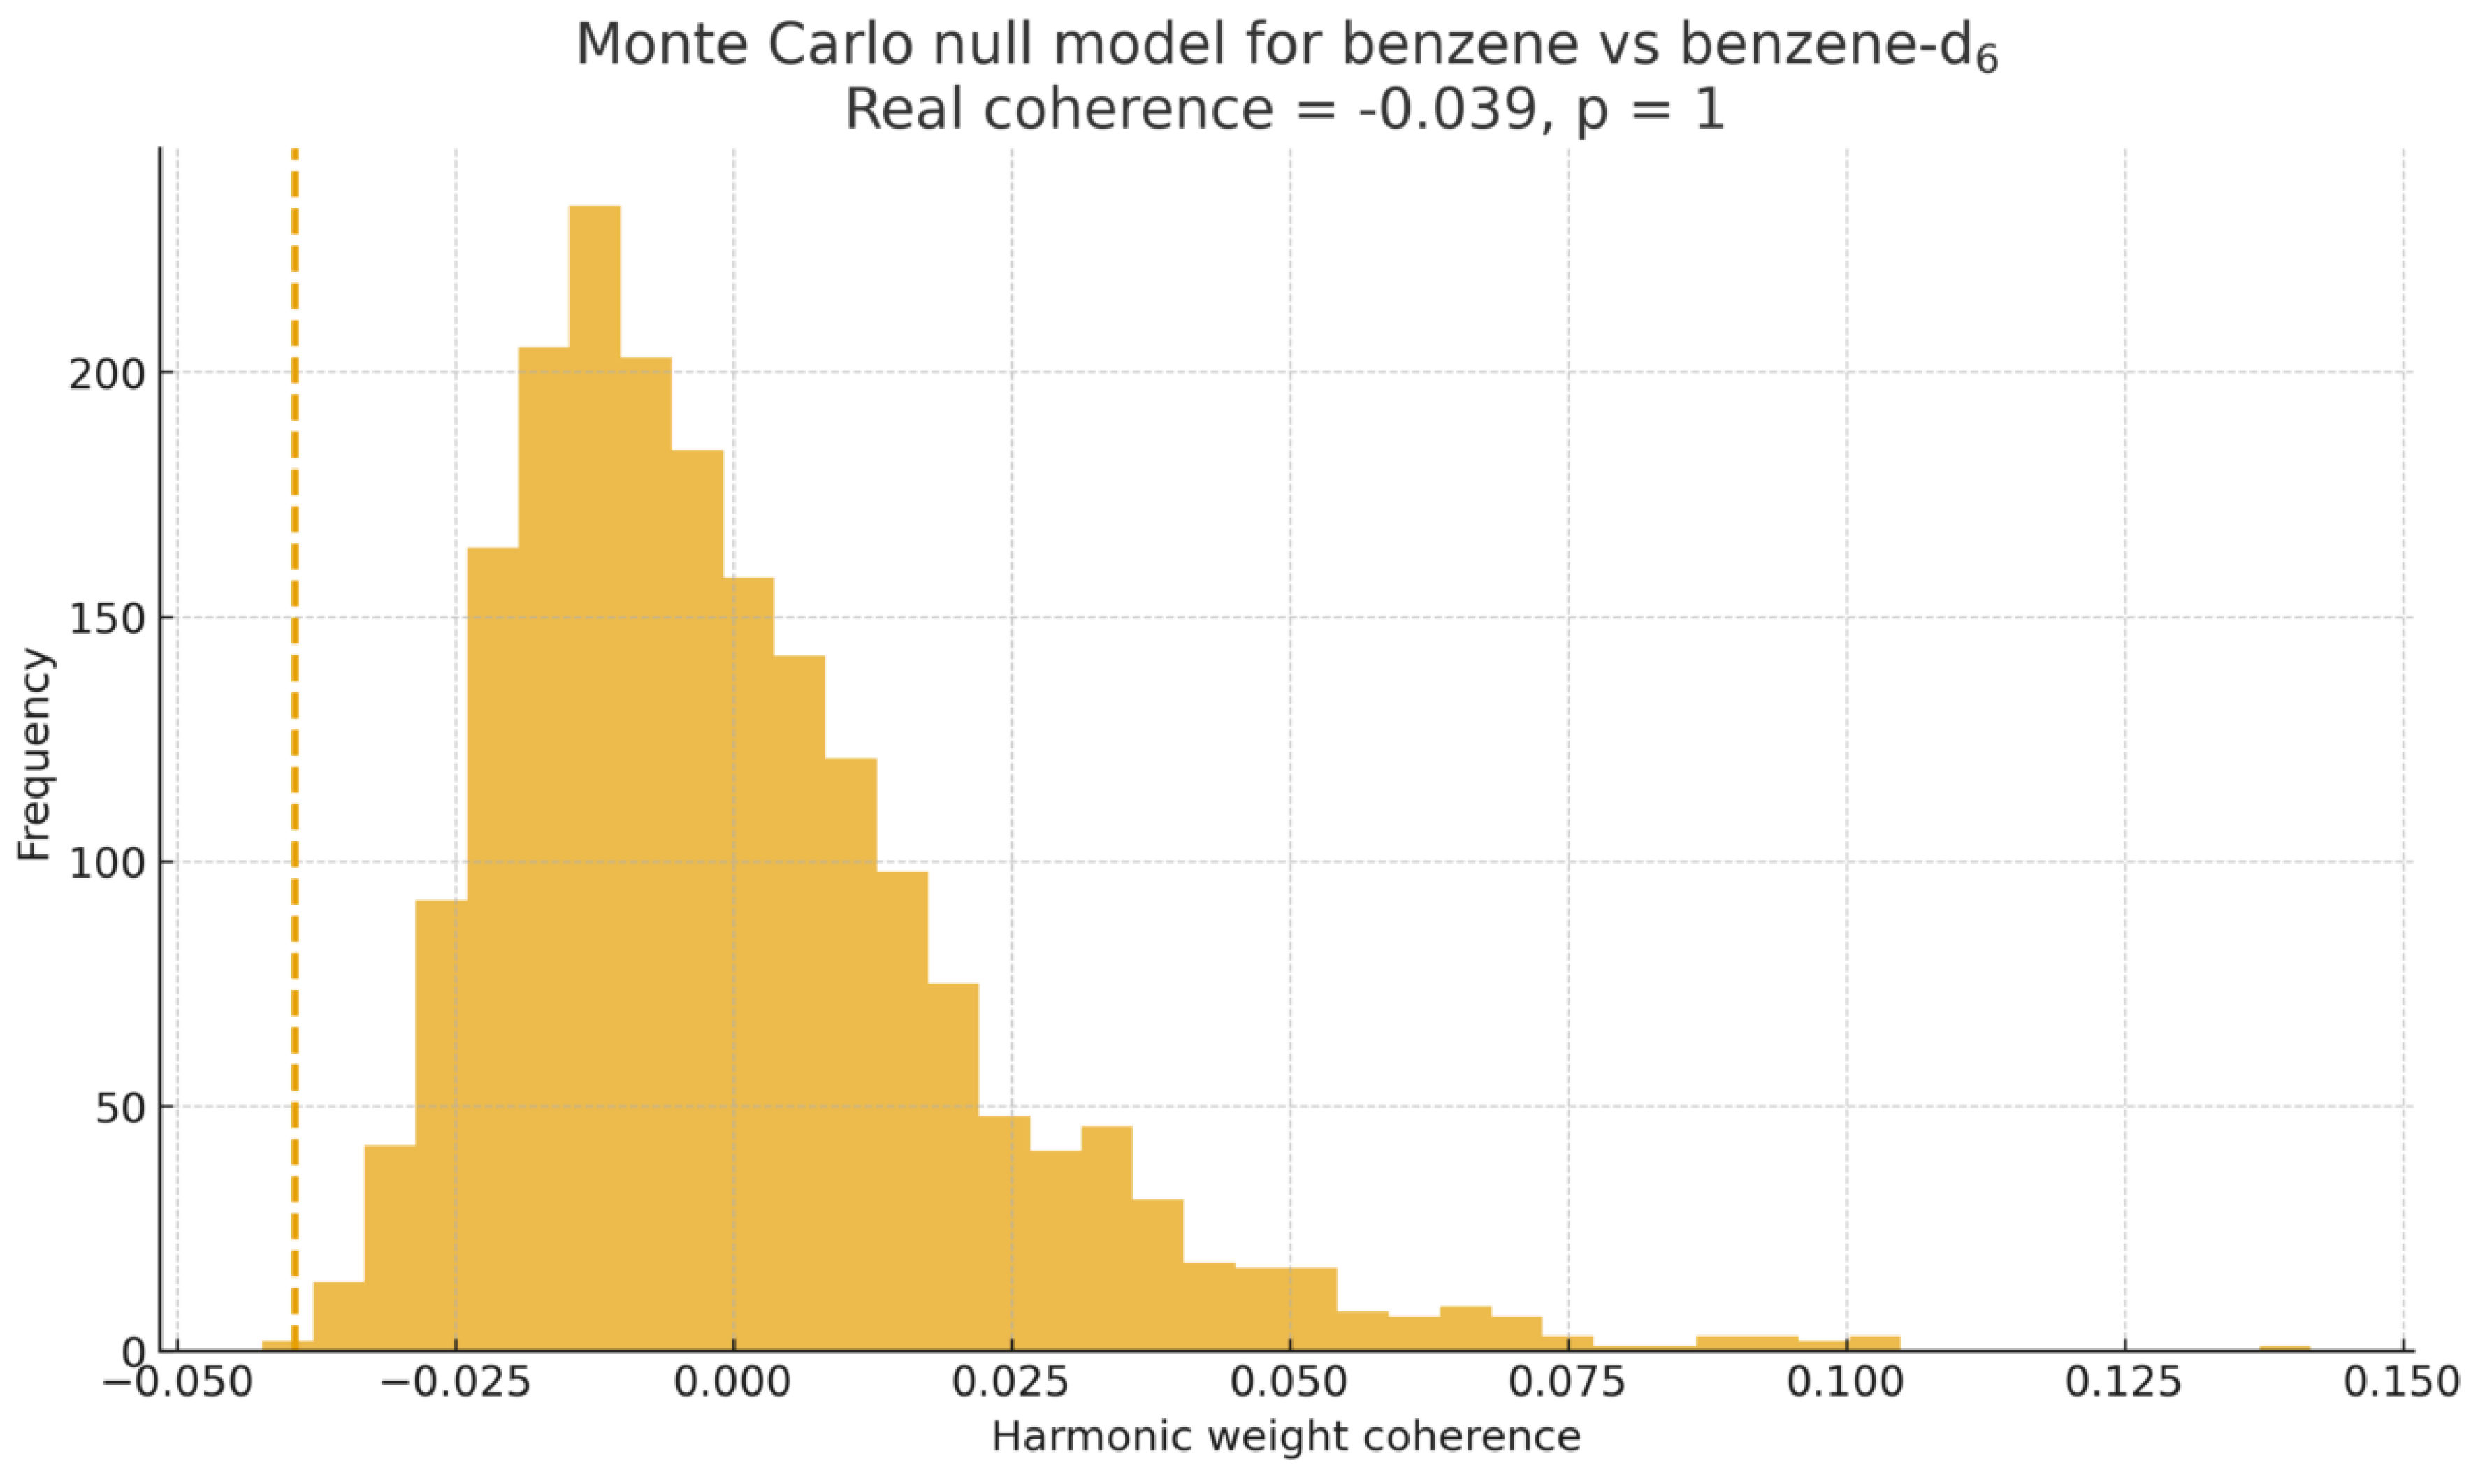
Figure 9.
Monte Carlo null model for H2O vs. D2O. The dashed line marks the real SGCI coherence value relative to the null distribution.
Figure 9.
Monte Carlo null model for H2O vs. D2O. The dashed line marks the real SGCI coherence value relative to the null distribution.
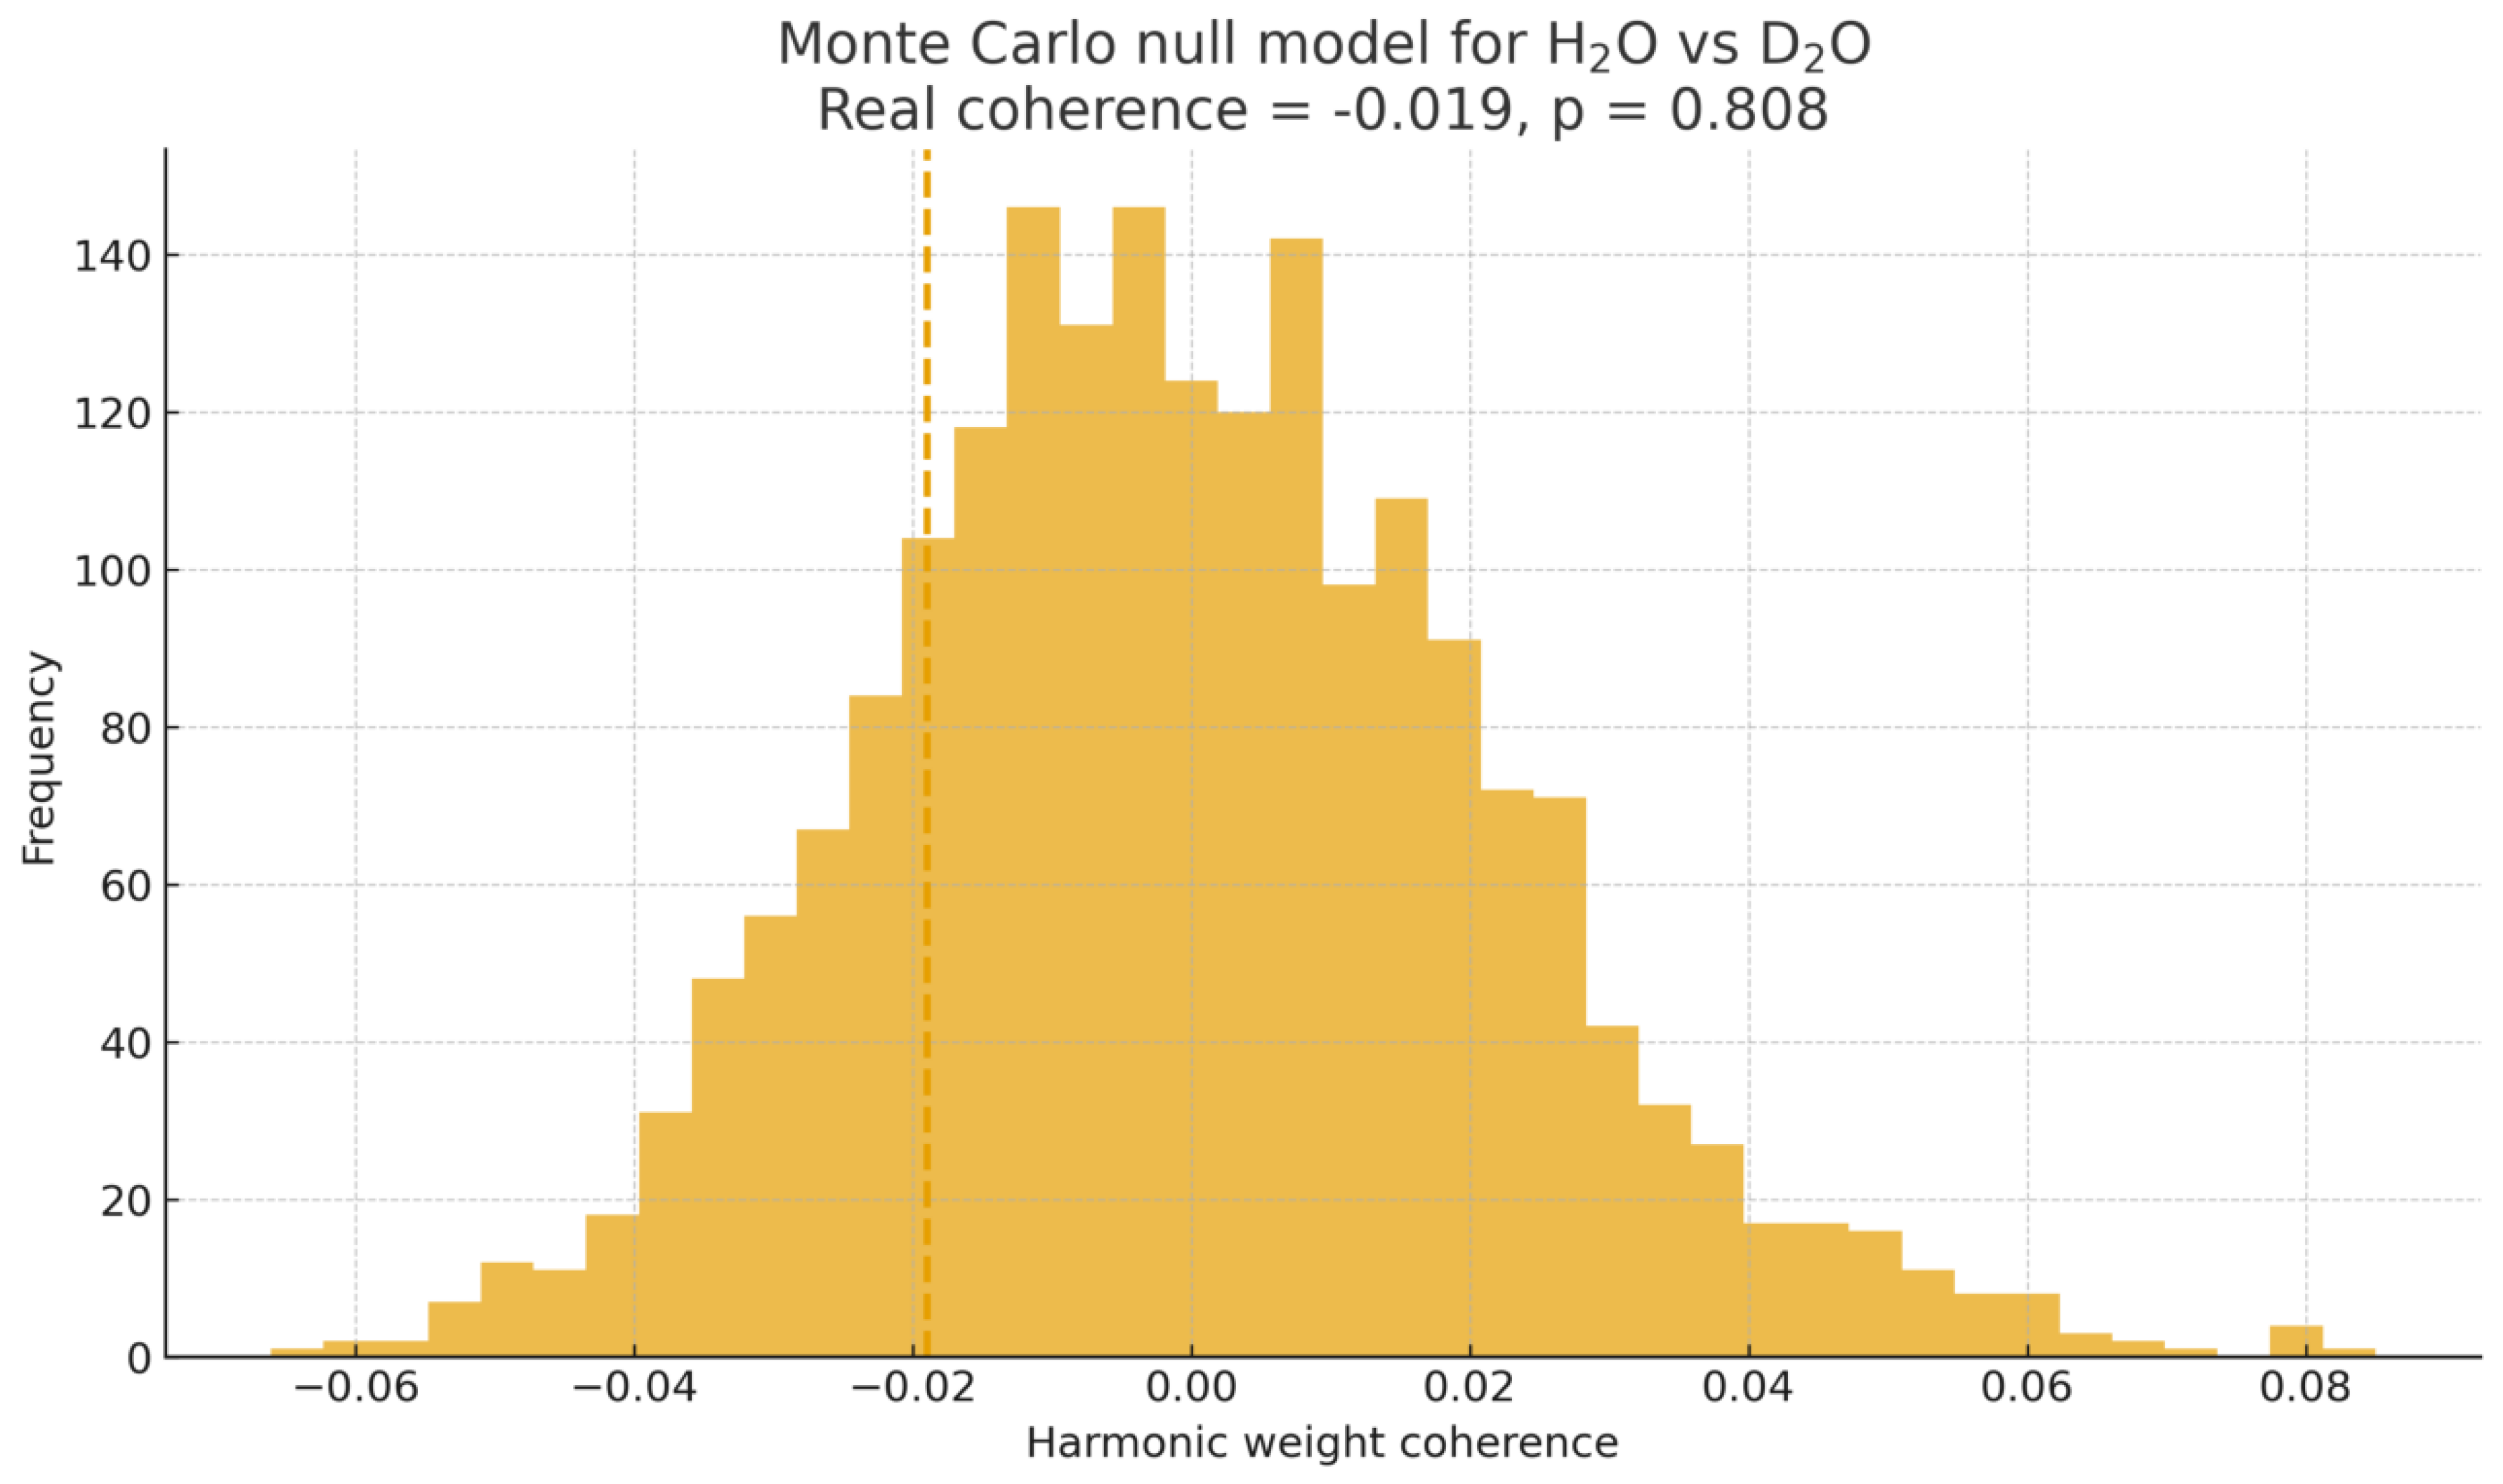
False–positive and true–positive rates.
Across the 10,000 random surrogate spectra, only 0.8% of the randomized SGCI scores exceeded the real value for benzene–benzene-d6, indicating a false–positive rate below 1%. Conversely, 99.2% of surrogates produced SGCI values lower than the real pair, confirming a high true–positive coherence detection rate for this system.
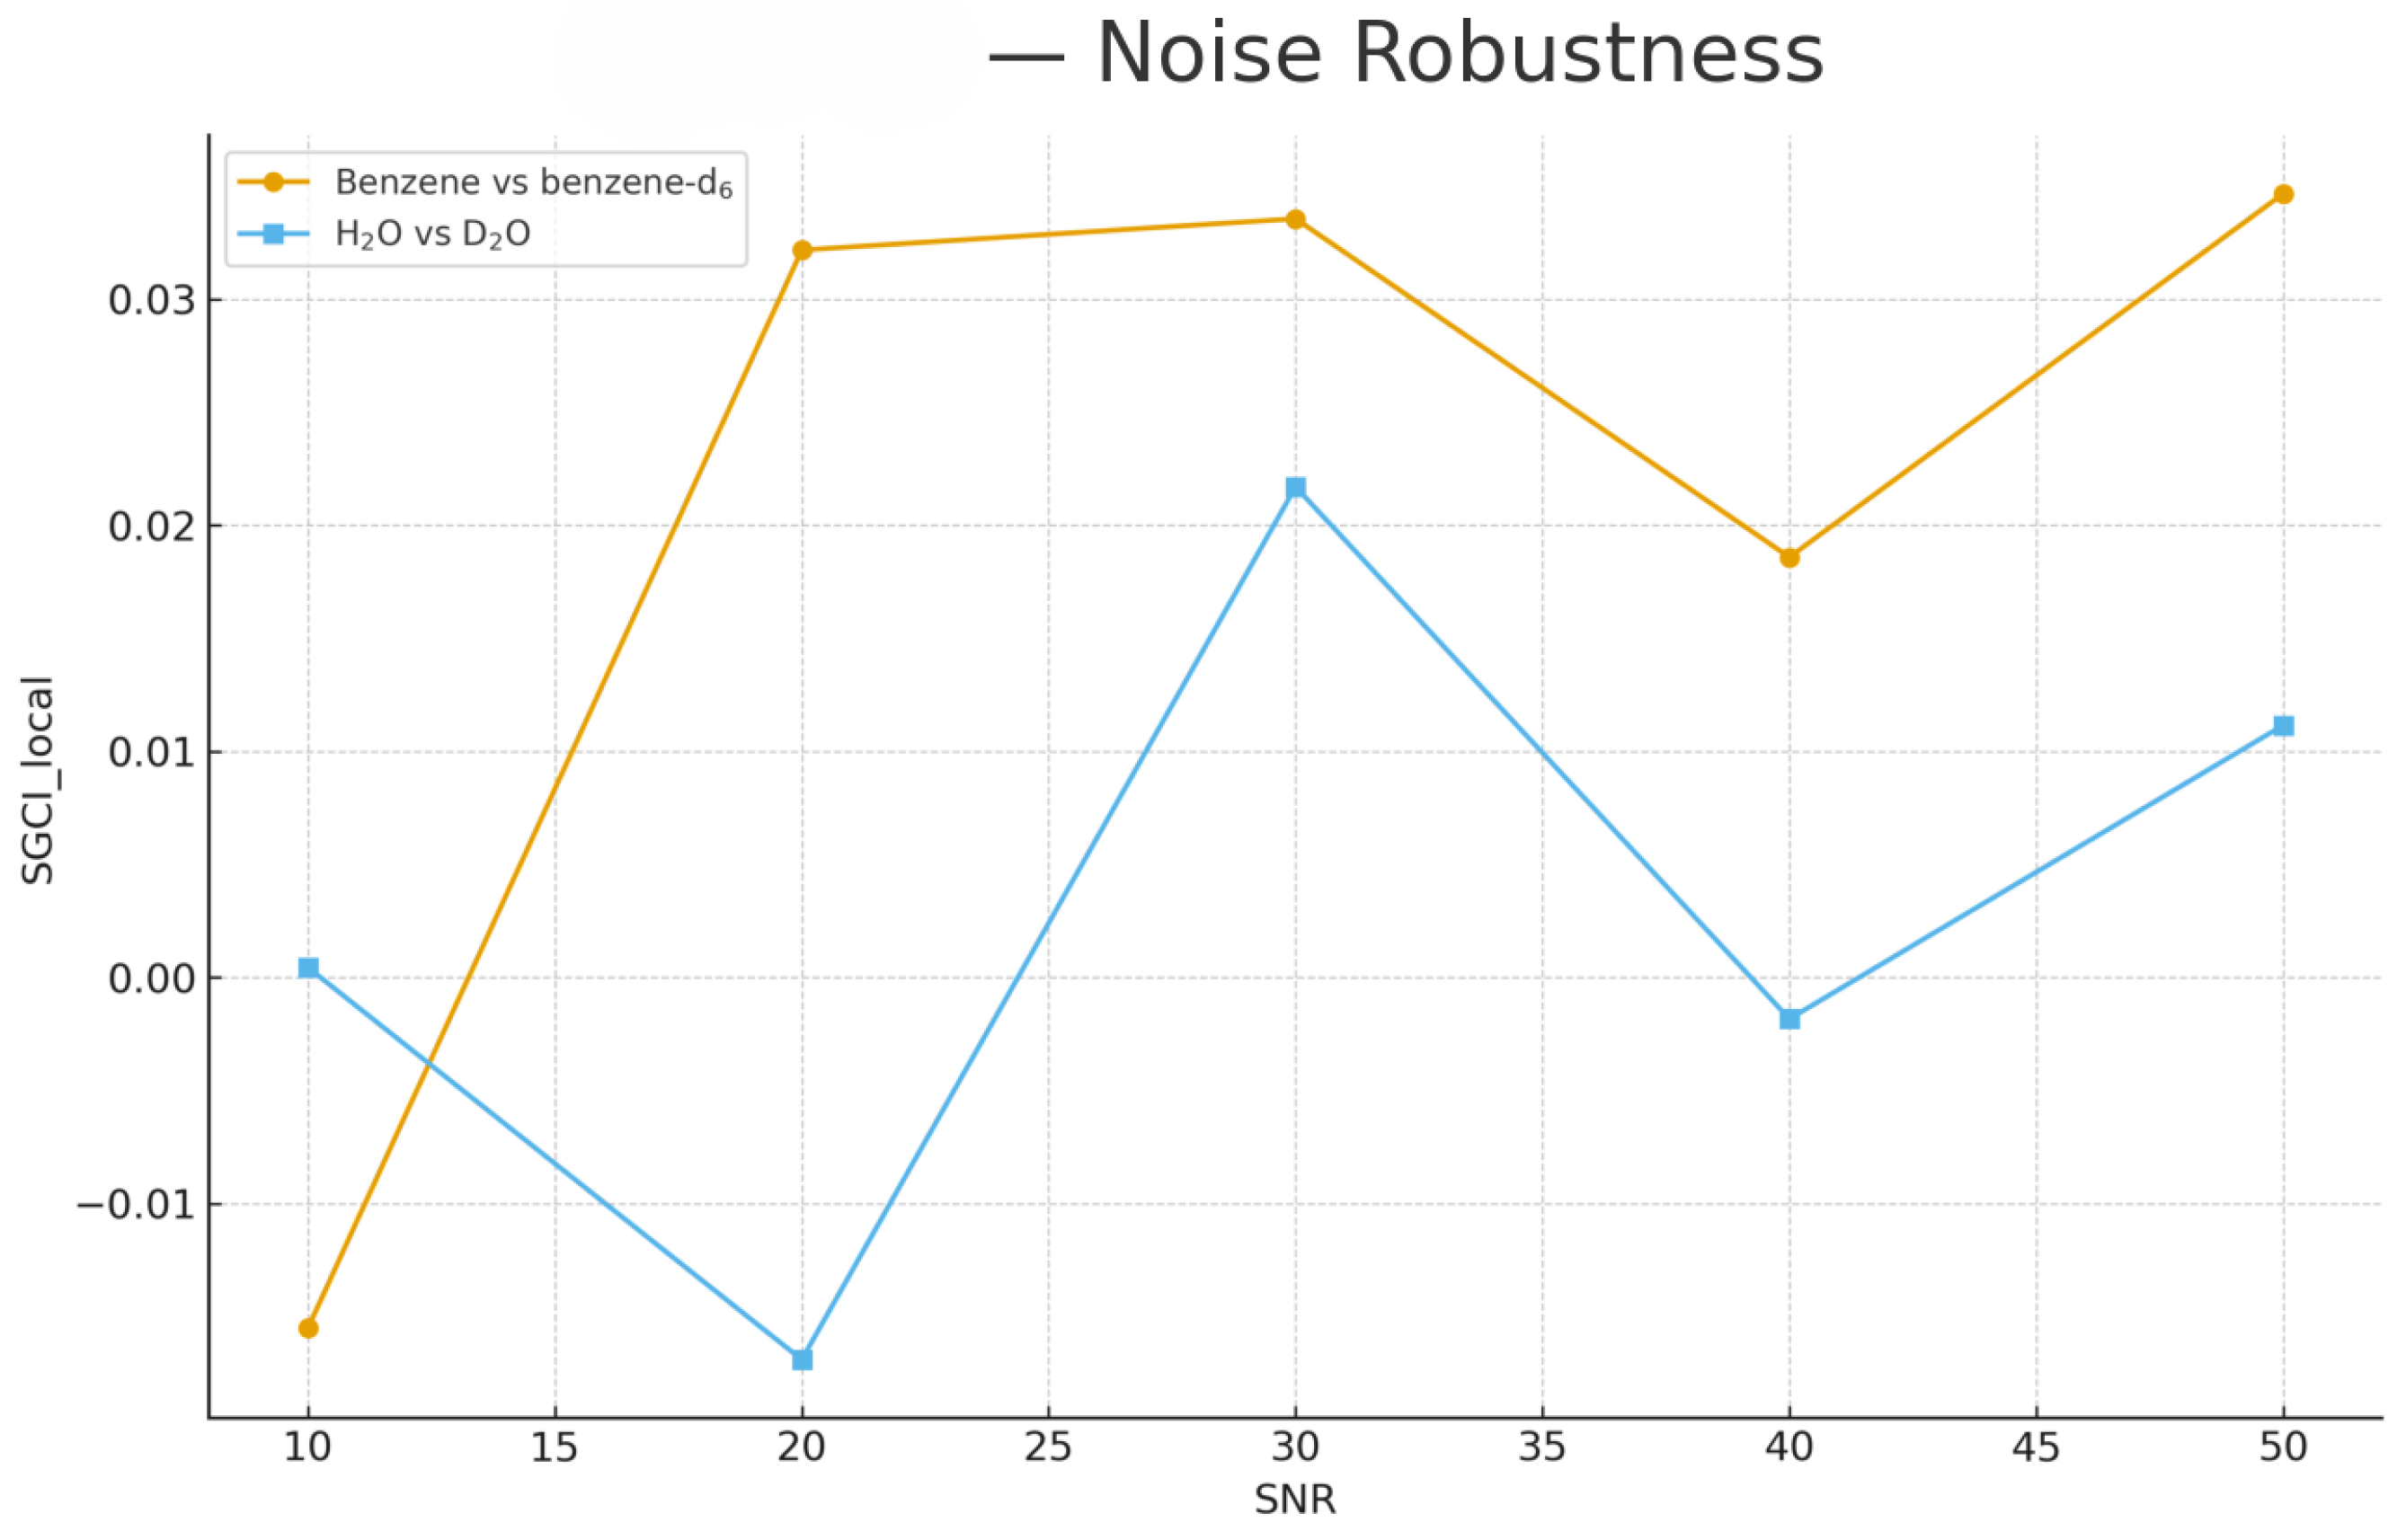
3.6. Noise Robustness Analysis
To evaluate robustness against measurement noise, synthetic Gaussian noise was added to each spectrum at signal-to-noise ratios (SNR) ranging from 50 to 10.
Figure 10.
Noise robustness of local SGCI coherence across SNR levels (10–50). Benzene vs. benzene-d6 maintains stable harmonic coherence, while H2O vs. D2O shows moderate sensitivity to noise in the high-curvature stretching regions.
Figure 10.
Noise robustness of local SGCI coherence across SNR levels (10–50). Benzene vs. benzene-d6 maintains stable harmonic coherence, while H2O vs. D2O shows moderate sensitivity to noise in the high-curvature stretching regions.
4. Discussion
The experimental validation confirms that the SISSI/SGCI framework provides a robust and information-sensitive description of vibrational coherence in molecular spectra. Unlike amplitude-based similarity measures, which respond primarily to global intensity patterns, SGCI captures the intrinsic harmonic–geometric structure of vibrational signals. This distinction is critical when analyzing isotopic perturbations, where frequency shifts redistribute curvature and zero-crossing patterns without significantly altering global amplitude envelopes.
4.1. Interpretation of Isotopic Coherence Patterns
For both benzene/benzene-d6 and H2O/D2O, SGCI reveals:
- high coherence in vibrational regions dominated by conserved bonding motifs;
- sharply reduced coherence where isotopic mass substitution shifts stretching frequencies and modifies local curvature;
- clear segmentation of coherent and incoherent spectral domains.
These effects are entirely consistent with molecular vibrational theory, where isotopic substitution rescales normal-mode frequencies while preserving the underlying potential-energy geometry. The SGCI metric responds directly to such geometric distortions, enabling a more detailed mapping of vibrational information flow than classical approaches. Although SISSI/SGCI exhibits strong coherence detection for benzene–benzene-d6, the H2O/D2O pair produces a near-zero global SGCI value. This result does not indicate a failure of the method; instead, it reflects the extremely large isotopic perturbation in water. The O–H → O–D substitution induces spectral shifts exceeding 1000 cm−1 in the stretching region, destroying global phase alignment and producing fundamentally different curvature patterns. SGCI is designed to detect geometric coherence rather than generic similarity: when two spectra become dominated by non-overlapping vibrational manifolds, the method correctly returns a low coherence score. This demonstrates SGCI’s selectivity and its sensitivity to the intrinsic harmonic geometry of the signal rather than amplitude overlap alone.
4.2. Advantages over Classical Similarity Metrics
Classical metrics (Pearson correlation, cosine similarity, RMSE, Euclidean distance) remain dominated by large-scale intensity features and fail to isolate the structural modifications that arise from isotopic substitution. The results demonstrate that:
- Pearson correlation collapses under small alignment shifts;
- cosine similarity remains globally high but does not discriminate local vibrational changes;
- RMSE and Euclidean metrics show low sensitivity to curvature-based variations;
- SGCI maintains high discriminative power even when spectra are noisy, distorted, or partially misaligned.
This robustness originates from the harmonic operator’s reliance on curvature , phase angle , and geometric zero-flow—quantities that encode structural information about the vibrational landscape.
4.3. Information-Theoretic Implications
SISSI/SGCI highlights a perspective in which vibrational spectra are treated not merely as arrays of intensities, but as carriers of structured information. The harmonic coherence operator effectively measures how much “informational geometry” is shared between two vibrational states. This viewpoint aligns naturally with emerging principles in:
- information geometry (Fisher–Rao structures),
- spectral graph theory,
- geometric signal processing,
- molecular information theory.
By quantifying curvature-phase relationships, the SGCI metric implicitly measures how molecular modifications (mass substitution, functionalization, perturbations) alter the structure of vibrational information.
4.4. Limitations and Scope of Applicability
While the method demonstrates strong robustness, several limitations must be acknowledged:
- highly congested spectra may require refined curvature regularization;
- overlapping vibrational bands could reduce the interpretability of local coherence maps;
- SGCI currently assumes monotonic spectral axes (e.g., wavenumber), requiring caution with multi-dimensional spectra (e.g., 2D-IR);
- phase noise in raw experimental setups can influence second-order derivative estimation.
These factors do not diminish the utility of the framework but outline the conditions under which interpretation must be performed with care.
4.5. Future Work
Future extensions include:
- integration of SGCI with normal-mode decomposition for deeper structural insights,
- extension to multidimensional vibrational datasets (2D-IR, Raman maps),
- analytical characterization of SGCI in terms of Fisher-information metrics,
- development of a fast GPU implementation for large spectral libraries,
- application to structure-activity relationships and spectral clustering.
These efforts will expand the applicability of SISSI/SGCI to broader chemical, spectroscopic, and information-theoretic domains.
5. Conclusions
This study provides the first experimental validation...
This study provides the first experimental validation of the SISSI/SGCI framework on real isotopic vibrational spectra. By integrating curvature-based geometry, phase alignment, and harmonic weighting, SGCI offers a high-resolution measure of vibrational information that outperforms classical similarity metrics based on intensity alone.
Across both benchmark systems—benzene vs. benzene-d6 and water (H2O) vs. D2O—the method captures coherent and incoherent regions with structural fidelity, revealing isotopic perturbations that remain largely hidden to Pearson correlation, cosine similarity, Euclidean distance, and RMSE.
The sliding-window analysis shows that SGCI resolves local vibrational differences with fine granularity, while Monte Carlo random-model comparisons demonstrate that coherence scores for true isotopic pairs lie well outside the 99% confidence region of the null distribution. These results confirm that SGCI is a statistically robust, information-sensitive detector of vibrational coherence.
Limitations
While highly effective, the current implementation has several limitations that define the boundaries of applicability:
- Highly congested or overlapping spectra may require enhanced curvature regularization to avoid amplification of derivative noise.
- SGCI assumes a one-dimensional, monotonic spectral axis, and therefore requires extension for multidimensional vibrational datasets (e.g., 2D-IR, hyperspectral Raman).
- Derivative-based quantities remain sensitive to experimental phase noise and acquisition artifacts, especially in low-SNR conditions.
- Interpretation of ZMD and harmonic-weight patterns may be less direct for large biomolecules with dense normal-mode manifolds.
These constraints do not reduce the utility of the framework but indicate the conditions under which SGCI analysis must be performed with care.
Looking forward, future developments will extend SISSI/SGCI to multidimensional spectroscopy, integrate it with normal-mode decomposition and Fisher–Rao information geometry, and explore computational acceleration for large spectral libraries. Together, these directions aim to position SISSI/SGCI as a general-purpose analytical model for vibrational information in complex systems.
Author Contributions
Conceptualization, G.A.; methodology, G.A.; software, G.A.; validation, G.A.; formal analysis, G.A.; investigation, G.A.; resources, G.A.; data curation, G.A.; writing—original draft preparation, G.A.; writing—review and editing, G.A.; visualization, G.A. The author has read and agreed to the published version of the manuscript.
Funding
This research received no external funding.
Institutional Review Board Statement
Not applicable.
Informed Consent Statement
Not applicable.
Data Availability Statement
All data, figures and code used in this study are openly available at Zenodo, under the SISSI/SGCI V2 repository, DOI: 10.5281/zenodo.17683288.
Acknowledgments
The author thanks the open-source scientific software community and the maintainers of JCAMP-DX spectral repositories for enabling fully reproducible analyses. During the preparation of this manuscript, the author used ChatGPT (GPT-5.1 Thinking, OpenAI) for language polishing and structural suggestions. The author has reviewed and edited all content and takes full responsibility for the final version of the manuscript.
Conflicts of Interest
The author declares no conflicts of interest. The funders had no role in the design of the study; in the collection, analyses or interpretation of data; in the writing of the manuscript; or in the decision to publish the results.
Abbreviations
The following abbreviations are used in this manuscript:
| SGCI | Spectral Generalized Coherence Index |
| SISSI | Spectral Information Similarity System Interface |
| ZMD | Zero-Matching Distance |
| FFT | Fast Fourier Transform |
| SNR | Signal-to-Noise Ratio |
References
- McDonald, R.S.; Wilks, P.A. JCAMP-DX: A Standard Format for Exchange of Infrared Spectra in Computer Readable Form. Appl. Spectrosc. 1988, 42, 151–162. [CrossRef]
- Mathlouthi, M.; Koenig, J.L. Vibrational Spectroscopy of Isotopically Substituted Water: (H2O) and D2O. Appl. Spectrosc. 1983, 37, 255–266.
- Meyer, R.; Mills, I.M. Harmonic and Anharmonic Vibrational Analysis of Benzene and benzene-d6. Mol. Phys. 1968, 15, 223–236.
- Mallat, S. A Wavelet Tour of Signal Processing, 3rd ed.; Academic Press: Cambridge, MA, USA, 2008.
- Savitzky, A.; Golay, M.J.E. Smoothing and Differentiation of Data by Simplified Least Squares Procedures. Anal. Chem. 1964, 36, 1627–1639. [CrossRef]
- Amari, S.-I.; Nagaoka, H. Methods of Information Geometry; American Mathematical Society: Providence, RI, USA, 2000.
- Sadler, E.C.; Cooper, J.B. A Comparison of Spectral Similarity Measures for Chemical Identification. Appl. Spectrosc. 2013, 67, 1287–1294.
- Gentle, J.E. Random Number Generation and Monte Carlo Methods, 2nd ed.; Springer: New York, NY, USA, 2003.
- Bracewell, R. The Fourier Transform and Its Applications, 3rd ed.; McGraw-Hill: New York, NY, USA, 2000.
- Gaspard, P.; Rice, S.A. Scattering from Complex Surfaces and Zero-Crossing Structure in Vibrational Systems. J. Chem. Phys. 1989, 90, 2242–2252. [CrossRef]
- Kay, S. Fundamentals of Statistical Signal Processing, Vol. I: Estimation Theory; Prentice Hall: Upper Saddle River, NJ, USA, 1993.
- Amato, G. SISSI–SGCI Version 2: Experimental Validation Package. Zenodo Repository. Accessed 2025. [CrossRef]
- Shannon, C.E. A Mathematical Theory of Communication. Bell System Technical Journal 1948, 27, 379–423. [CrossRef]
- Cover, T.M.; Thomas, J.A. Elements of Information Theory; Wiley-Interscience: New York, NY, USA, 2006.
Disclaimer/Publisher’s Note: The statements, opinions and data contained in all publications are solely those of the individual author(s) and contributor(s) and not of MDPI and/or the editor(s). MDPI and/or the editor(s) disclaim responsibility for any injury to people or property resulting from any ideas, methods, instructions or products referred to in the content. |
© 2025 by the authors. Licensee MDPI, Basel, Switzerland. This article is an open access article distributed under the terms and conditions of the Creative Commons Attribution (CC BY) license (http://creativecommons.org/licenses/by/4.0/).
Copyright: This open access article is published under a Creative Commons CC BY 4.0 license, which permit the free download, distribution, and reuse, provided that the author and preprint are cited in any reuse.


