
Submitted:
25 November 2025
Posted:
27 November 2025
You are already at the latest version
Abstract
Hydrocephalus remains a complex neurosurgical pathology requiring permanent cerebrospinal fluid (CSF) shunting. This work explores the characteristics of polymer resins, intended to isolate and stabilize the micromagnets of the pressure and flow adjustment mechanism. The polymeric disc containing the micromagnets play a critical role in the functional stability and safety of programmable valves with magnetic mechanism: any failure of the coating can lead to corrosion phenomena and ion diffusion in the LCS. It has a diameter of 5.5 mm and on it are positioned 10 magnets with a diameter of 2 mm. However, corrosion phenomena and electrochemical interactions between the magnets and LCS represent a potential risk of ion release (Co, Sm, Nd, B, Pt and Fe) and toxicity in LCS. The study focuses on the nature of coating resins, by several techniques. Electrochemical measurements using rotating electrode technology, and by impedance (EIE), through Nielsen-Tuccillo tests and release kinetic tests on encapsulated magnets. Three resins were evaluated: Stycast 1266, Stycast 1267 and Loctite Medical Device Adhesives. The encapsulated magnets are of CoSmCo and CoNd Fe B nature. All tests reveal an ion exchange permeability between electrolyte NaCl 9 g/l is the coated magnets after three days of immersion. All three resins shift the sweeping polarisation curves into the domain of 10-7 – 10-12 A/cm2 Degradations by corrosion phenomena on the surfaces of magnets were found in the case of Stycast 1266 by the Nielsen-Tuccillo test after 30 days of immersion. The extraction kinetic tests were carried out for 30, 60 and 90 days. The series Stycast 1267 releases cobalt mainly in the first 60 days, then we note un niveau qui est établi à environ 0,8 µg /l. The Loctite series a level of about 0.15 µg/l is observed for 60 days, then cobalt release increases to 1.2 µg/l after 90 days. The Stycast 1267 series releases Nyodymium up to a concentration that could reach 0.6 µg.l-1. The release of Nyodymium from the Loctite series is at the detection limit < 0.2 6 g/l after 90 days.
Future generations of valves, integrating electronic sensors and wireless telemetry, will have to take these constraints into account to ensure long-term reliability and biocompatibility in their functional environment.
Keywords:
hydrocephalus
; programmable shunt valve
; electromagnetic valves
; magnetic alloys corrosion
; electrochemical evaluation
; polarization curves
; EIS technic Nielson-Tuccillo test
; cations release
; toxicities Co
; Sm
; Nd magnets
1. Introduction
Hydrocephalus is a pathology characterized by an excessive accumulation of cerebrospinal fluid (CSF) in the ventricular system, leading to increased intracranial pressure and potentially severe neurological alterations. Since ancient times, this condition has been known, but the first therapeutic attempts, limited to ventricular punctures, remained transient and associated with significant morbidity [1,2].
During the 20th century, the advent of valvular bypass systems revolutionized care, particularly with the introduction of ventriculo-atrial shunts in the 1950s, then ventriculo-peritoneal shunts, which became the reference method [3]. However, these devices had significant limitations, including risks of infection, obstruction and over- or under-drainage of the LCS [4,5].
The appearance, in the 1990s, of programmable valves marked a major advance. These devices allow a non-invasive adjustment of the opening pressure through a magnetic mechanism, thus offering personalized adaptation to the clinical profile of the patient [6,7,8]. More recent generations, designed to be resistant to magnetic fields from magnetic resonance imaging (MRI) examinations, further incorporate anti-deregulation locking systems and anti-siphon devices, enhancing their safety and reliability [9,10].
Despite these advances, complications related to shunts remain frequent and constitute a major clinical challenge, justifying the continuous evaluation of technological innovations and the optimization of follow-up strategies. owever, conventional fixed valve systems have significant limitations, including a risk of over-drainage or under-drainage, often responsible for headaches, subdural hematomas, or symptomatic persistence.
The introduction of programmable valves marked a decisive step forward in the management of shunt-bearing patients. These devices rely on an internal magnetic mechanism allowing the adjustment of the valve opening pressure in a non-invasive way, thanks to an external programmer applied on the skin. This innovation allows a fine and personalized adaptation of the drainage according to the clinical and radiological evolution of the patient, while avoiding surgical reinterventions.
First-generation magnetic mechanism models, however, exhibited vulnerability to external magnetic fields, particularly during magnetic resonance imaging (MRI) examinations, which could lead to accidental valve dysregulation. Newer generations incorporate locking mechanisms and anti-siphon systems, making these devices more reliable, compatible with high-field MRI (up to 3 Tesla), and reducing the risk of adjustment complications.
Despite these technological advances, complications related to shunts — infection, obstruction, mechanical dysfunction—persist and justify close monitoring and the continuous development of new solutions. Programmable valves nevertheless represent a significant advance, offering clinicians unprecedented therapeutic flexibility in the treatment of hydrocephalus.
Unlike the first models of the 1990s, the current versions integrate:
- locking systems to prevent accidental dysregulation when exposed to a magnetic field (MRI scan, household appliances, magnetised toys, etc.),
- anti-siphon devices to limit over-drainage in standing position,
MRI compatibility up to 3 Tesla, which corresponds to the standards [11. 12 ].
1.1. Current Situation:
- Programmable valves with magnetic mechanism (e.g. Codman Hakim®, Codman Certas®, Sophysa Polaris®, Miethke proGAV®) represent an important part of the devices currently implemented [13].
- They remain the reference because they allow a non-invasive external adjustment of the opening pressure with a simple magnetic programmer.
The valves of the new generation integrate:
- locking systems to prevent accidental dysregulation when exposed to a magnetic field (MRI scan, household appliances, magnetised toys, etc.),
- anti-siphon devices to limit over-drainage in standing position,
1.2. Emerging Perspectives and Alternatives:
X Research to develop electronic or sensor-integrated valves for:
- measure the intracranial pressure in real time,
- transmit data by wireless telemetry,
automatically adjust the flow rate.
X However, these systems are still experimental or very limited in clinical practice.
We present attached a comparative table (fixed valves vs current magnetic programmable vs electronic prototypes) to properly situate their current and future place.

Table 1.
Comparative table fixed valves vs current magnetic progammable vs electronic prototypes.
| Characteristics | Fixed valves (preset pressure | Magnetic programmable valves (current) | Electronic / smart valves (in development |
|---|---|---|---|
| MRI compatibility | No problem (no magnetic components) | Yes, up to 3 Tesla (with anti-deregulation locking mechanisms) | Potentially sensitive, depends on shielding and electronic components (under evaluation) |
| Risk of over/under drainage | High (no adaptation possible) | Reduced thanks to adaptability and anti-siphon devices | Theoretically minimal, because automatic adjustment possible |
| Invasiveness | Impossible adjustment surgery necessary | Non-invasive adjustment by external programmer | Non-invasive adjustment, possibility of real-time monitoring |
| Monitoring | Clinical and radiological monitoring only | Clinical, radiological and sometimes radiographic to confirm the setting | Wireless telemetry possible, continuous intracranial pressure measurements [17,18] |
| Reliability / robustness | Very robust, few internal mechanisms | High reliability, improved since 2000 with anti-deregulation systems | Less clinical hindsight, risk of electronic breakdowns |
| Clinical availability | Still in use but in decline | Current standard in neurosurgery | Limited to research or clinical trials |
Our study concerns an element that is part of the complexity of this insert shunt-catheters device. It is the polymer disc element (PES) with the ten magnets that the magnetic valve motor can change the flow of CerebrosSpinal Fluid (CSF). The magnets are coated on this disc and by its rotation on Spiral Cam and Stepper, the valve can modify the CSF flow rate. We are focused on the nature of the coating resins as well as their ability to transfer electrical charges from CSF fluid to the interfaces of the magnets. Consequently, there will be a corrosion process accompanied by a cation release process of the magnet alloy. (Co, Fe, Pd, Sm, Nd, B Pt,) in the CSF fluid.
It is a toxicity problem that can compromise the use of the device in the patient.
2. Materials and Methods
2.1. Integrated Device for Hydrocephaleus
Standard treatment for hydrocephalus is based on the implantation of a shunt system that diverts CSF to a reabsorption cavity (often the peritoneal cavity). It is carried out by a complex system materialized by an integrated device (Figure 1).
A description of the integrated device and an operation of the device can be summarized as follows:
a. CSF Inlet (Shunt Catheter Side)
- Cerebrospinal fluid from the brain flows through a silicone catheter and into the device.
b. Thermal flow sensor
- Located upstream, this sensor measures the flow rate of the LCR by a thermal principle: a small heating resistor and a temperature detector allow to estimate the flow velocity as a function of heat dissipation.
- This provides real-time information about the circulation of LCR in the shunt.
3 Fluidic joint and sealing elements (silicone sealing lips & polymer plate with fluidic joint)
-These parts ensure a hermetic junction between the internal components.
- They ensure that the LCR flow does not leak and flows properly through the sensor and valve.
c. Overmoulded fluidic joint
- Serves to securely connect the different parts of the device.
- Ensures stable mechanical and hydraulic continuity.
d. Tank / intermediate chamber.
Its role is not that of a storage tank, but rather:
- to ensure mechanical and fluid continuity between the sensor and the valve (thanks to the fluidic overmoulded joint),
- to stabilize the flow of CSF before it passes through the hydrocephalus valve,
- and possibly to serve as a buffer volume allowing more regular regulation of the flow. Integrated device for Hydrocephaleus
e. Hydrocephalus valve [19]
- Controls intracranial pressure by regulating the flow of CSF.
- The valve opens or closes depending on the pressure of the CSF in order to avoid hyperdrainage or underdrainage.
f. Exit (to the bypass cavity, e.g. peritoneal cavity)
- The CSF flows through the valve and continues its path through the distal silicone catheter to the bypass area (often the abdomen).
In the device presented in Figure 1 our research study concerns the disc with magnets, an element that is integrated into the assembly of the hydrocephaleus valve (Figure 2) [19]
Internal motor (adjustment mechanism) (Figure 2), it is not an electric motor, but rather a mechanical micro-mechanism actuated by the effect of an external magnetic field.
Systems with programmable valves contain embedded micro magnets (in the internal rotor/disk). When an external magnetic field is applied (via a sterile medical device placed on the patient’s skin), these magnets drive the controlled rotation of the disc. Each position corresponds to a predefined opening pressure (e.g. 30, 50, 70, 100 mmH2O...). Once the position is reached, the system remains mechanically stable until the next adjustment
This electromagnetic part of the internal motor, which is integral with the spiral cam through its rotation, modifies the pressure and flow rate of the CSF fluid.
The hydeocephaleus valve is designed for a maximum flow rate of 300 ml/h of CSF. The common value in extraction is 24 ml/h.
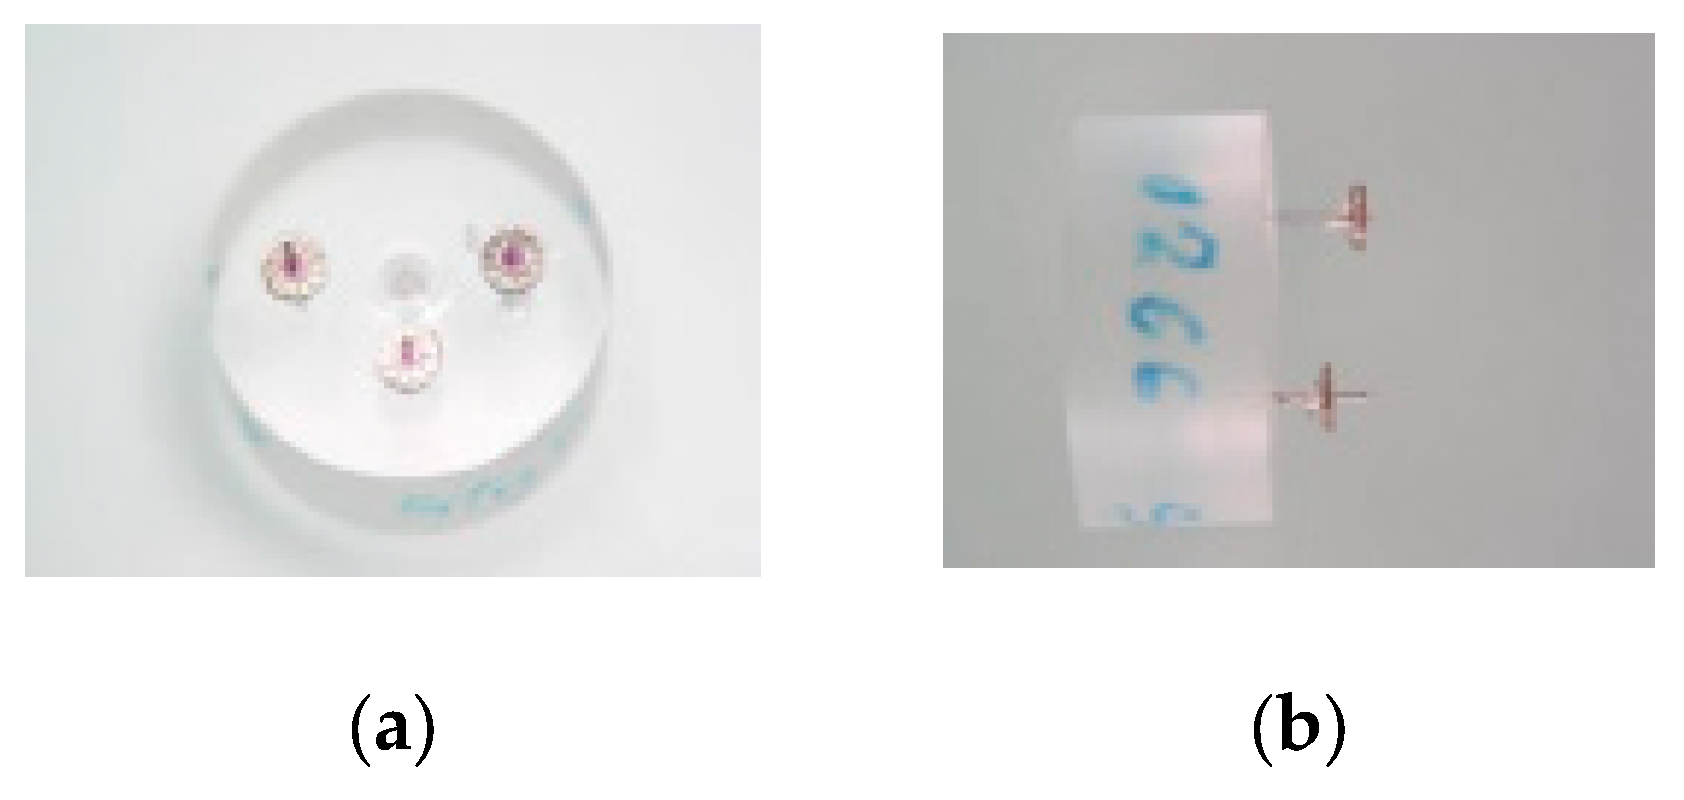
2.2. Samples
The tested part is presented in Figure 3. It consists of a PES cam disc on which 10 SmCo5 magnets are placed. A tantalum marker plate in contact with the magnets is also fixed and glued. The magnets are coated with an epoxy resin. In the photograph of Figure 3, the shot is taken on the face with the magnets coated in epoxy resin. The disc has a diameter of 5.5mm and the bar is shaped
Our research was conducted in order to answer two essential questions:
- Diffusion of the LCR through the epoxy resin:
Is there a diffusion of the cerebrospinal fluid (CSF) through the epoxy resin layer that can come into contact with the magnets? In this case, an electrical charge transfer could occur, inducing a corrosion process at the metal surface.
- Ionic migration of metal constituents:
Is a migration of cations (Co, Fe, Pd, Sm, Nd, B, Pt) through the epoxy resin layer to the fluid circulating in the hydrocephalic valve possible? If yes, in what quantity? The question of a possible toxicity of released cations (Co, Sm, Pt, Pd, B) must then be considered and taken into consideration.
Accordingly, we evaluated three epoxy resins—Stycast 1266 [20], Stycast 1267 [21] and Loctite Medical Device Adhesives (Loctite) [22] — applied on elements depicted in Figure 1.
Two types of magnets have been encapsulated : CoSmCo and CoNd Fe B. The description of their structures, phases and magnetic properties was reported by O. Gutgoat et al. [23].
2.3. Electrochemical Measurement Techniques:
- Preparation of the samples. The test samples, shown in Figure 1, were polished on the side where we find the reference plate. This way the reference plate and glue are eliminated so that we obtain a surface with all the magnets bare. The objective of this operation is to ensure electric contact for the electrochemical tests. The assembled test sample is then fixed into a specially designed electrode-holder. (Figure 4 and Figure 5)
- Rotating electrode Technic
The schematic representation of the rotating electrode technique is illustrated in Figure 6a
The use of the rotating electrode technique allows us to check the phenomenon of mass transfer according to the Levich theory (1942). We obtain an expression for the Nernst diffusion layer that is specific to the rotating electrode; in other words, every type that is dissolved and that reacts in the electrochemical system will have a layer of Nernst diffusion that is unique.
Another factor that greatly influences the corrosion process is the quantity of oxygen dissolved in the electrolyte. For our test we have used an environment that was de-oxygenated with argon. This way we were able to check the quantity of oxygen dissolved during the test, a quantity that is situated at 0.2 mg/L.
For the control of mass transfer phenomena (mainly the diffusion phenomenon), the rotating electrode is in the laminar regime (the criterion of Re = 3200 ) with a limit current iL = 56 mA, and a rotation speed at 300 rot/min
Diffusion phenomena also play a very important role with regard to the changes that occur at the metal/solution interface
The measuring technique used a PAR Model 273 A potentiostatic assembly. The corrosion cell is made of a kind of glass specifically designed for use in the rotating electrode technique. The counter-electrode is made of Platinum and the reference electrode is a saturated Calomel electrode (SCE). A Faraday cage protects the measurement system (Figure 6b).
The samples are subjected to the following measurement cycle:
- immersion in an electrolyte de-oxygenated with Argonne during 72 h. Recording of the open circuit potential after 72 hours.
- tracing of the polarization curve ( 20 mV) for the calculation of the polarization resistance (Rp).
- tracing of the polarization curve ( 150 mV) in Tafel domain for the calculation Ecorr and ant icorr
The test environment is a solution of NaCl 9 g/L at temperature of 37 °C, de-oxygenated with argon. The isotonic solution is filtered on a sterilized Falcon® 0.22 μm membrane; Medical Devices type flacons were used. The magnets of the evaluated elements are in CoSm5
- Evaluation of the corrosion by measurements of impedance (ASTM G 106-89) [24]
The choice of this technique is the result of the following chain of reasoning: if there is a transfer of the electrolyte in the layer interface (oxides, plastics..) / substrate metal, a surface corrosion process of the metal will be provoked and accompanied by a phenomenon of localized corrosion (pitting and fissure).
Principle: If we impose an alternating tension to the weak amplitude and frequency f to the continuous polarization of an electrode, we notice that there is a variation of the current that is consecutive to the variation of potential and out of phase in relationship to it. TheV / I I relationship is called impedance Z, a complex magnitude which, contrary to a purely electric circuit, may depend upon the reactional mechanism that is put into play between the electrolyte and the metal surface. The impedance method may in this way serve to measure and observe the durability or to check the quality of coatings. The assembly is comprised of a response analyzer in Schlumberger SI 1255 frequency with a Kemo filter with 2 tracks piloted by an electrochemical potentiostat interface EG&G PAR 273A. The whole thing is piloted by the Model 398 EG&G computer program. The impedance measurements are carried out from a potential in an open circuit (abandon potential) obtained after one hour with a sinusoidal perturbation of 10 mV amplitude, and by carrying out a decreasing sweep of 1 MHz to 5 mHz. The impedance method allows us to determine the resistance to the electrolyte (Re), the resistance to transfer (Rt), and the capacity to double the layer (Cdc), as shown in the simplified schema in Figure 7 (a and b).
The montage of the evaluated samples is similar to that used for the evaluation of generalized corrosion (Figure 4 and Figure 5), and the measurements were carried out after three days of immersion.
The test medium is identical: an isotonic solution of NaCl (9 g/L) at 37 °C, under argon atmosphere. The magnets of the evaluated samples are made of SmCo5.
2.4. Nielsen-Tuccillo Test.
The test is carried out on Nielsen-Tuccillo equipment, which is composed, of two rotating disks in a double walled tank with a capacity of approximately 1 liter (Figure 6). The electrolytic solution used in our test is also an isotonic solution of NaCl 9 g/l. The test samples are shown in Figure 7a and Figure 7b. They have not been subjected to any mechanical intervention. The samples are passed continually from a liquid environment to a gas environment at the rate of 1 rpm-1 at 30 °C during 15 and 30 days. Les aimants des écahntillons évalués sont en CoSm5
After 15 days the samples were examined visually under a low power microscope, paying particular attention to the traces of corrosion and degradation of the resin that covers the magnet. The samples with coated with the resin Stycast 1266 were pulled out of the test, as they showed traces of corrosion. The tests continued with the Stycast 1267 and Loctite Medical Device Adhesives samples during 30 days.
Figure 7.
Nielsen – Tuccillo equipment.
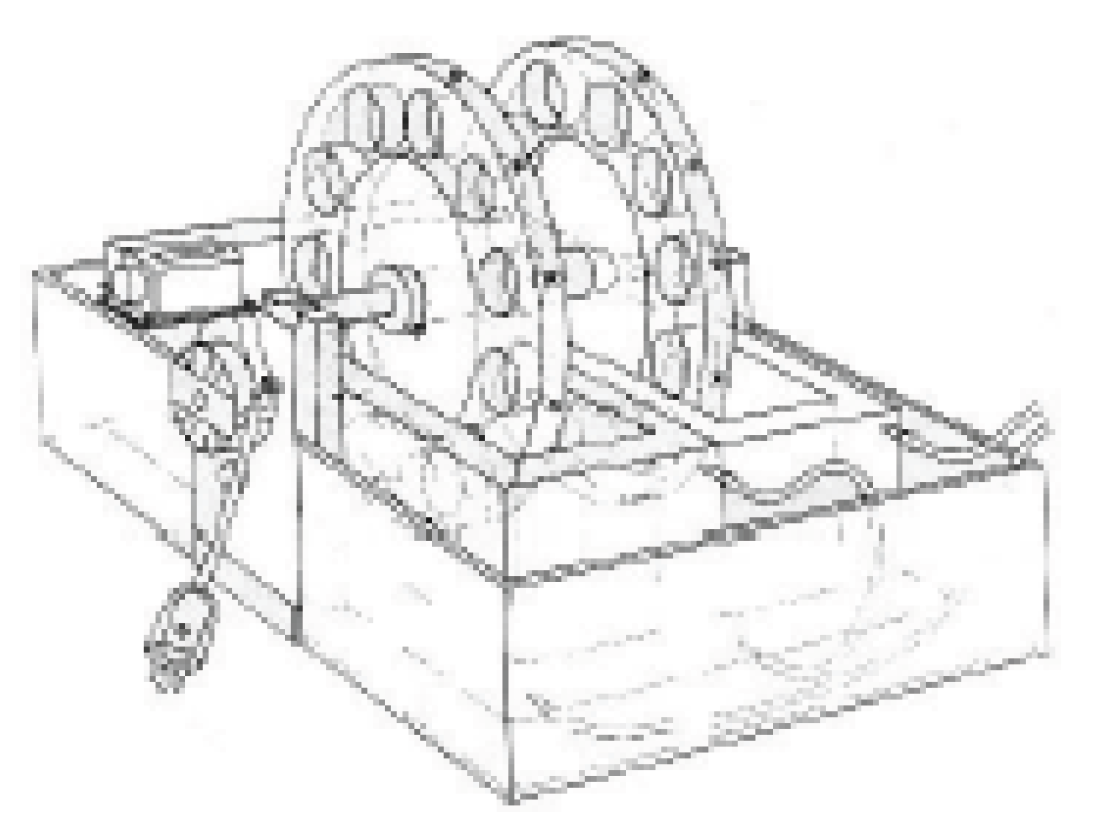
Figure 8.
a. Samples and the sample holder made of PMMA. b. The samples are not in contact with the sample holder.
Figure 8.
a. Samples and the sample holder made of PMMA. b. The samples are not in contact with the sample holder.
2.5. Kinetics of Release on Encapsulated Magnets.
The toxicity problems are high for Samarium with an elevated risk of neurotoxicity and systemic toxicity (progressive accumulation, especially in bone and liver tissues). a decision has been made to change this alloy SmCo5 [25] with Nd Fe B known as moderately toxic in vitro and in vivo [26].
Samarium (Sm) is a rare earth element, often alloyed with cobalt (SmCo , Sm Co ) in permanent magnets. In these alloys, it is in solid metallic form, so its bioavailability is a priori low if it remains confined by a coating (resin, polymer, etc.). Little human data, but animal studies show that certain salts (SmCl3 , Sm(NO3)3) can be toxic, with effects such as liver damage, accumulation in the liver, bone and spleen. Some salts are slightly irritating to the skin and mucous membranes [27,28,29,30].
The main risk comes from corrosion or leaching of the alloy if the coating is defective conc there is a possible migration of Sm3+ ions in the biological fluid (CSF). In the presence of NaCl (physiological medium), galvanic corrosion can promote the release of Sm3+ ions.
Uncoated SmCo5-magnets showed high cytotoxicity while uncoated Sm2Co17-magnets demonstrated moderate cytotoxicity. Uncoated neodymium-iron-boron magnets, as well as parylene coated Sm2Co17-magnets and parylene-coated neodymium-iron-boron magnets, showed negligible cytotoxicity. Short-term exposure to a static magnetic field did not cause any cytotoxic effect on the cells [31].
Neodymium (Nd) is another lanthanide, widely used as Nd Fe B alloys (NdFeB magnets). Neodymium salts (NdCl , Nd(NO3 )3 ) are moderately toxic in vitro and in vivo [32,33,34,35]. In the case of Neodymium, the observed effects are:
- Cytotoxicity by oxidative stress.
- Interference with calcium metabolism (because Nd3+ can substitute for Ca2+ in certain enzymes and membranes).
- Accumulation in bones, liver and spleen.
Thus a decision was made to change this alloy SmCo5 with Nd2 Fe14 B known as moderately toxic in vitro and in vivo.
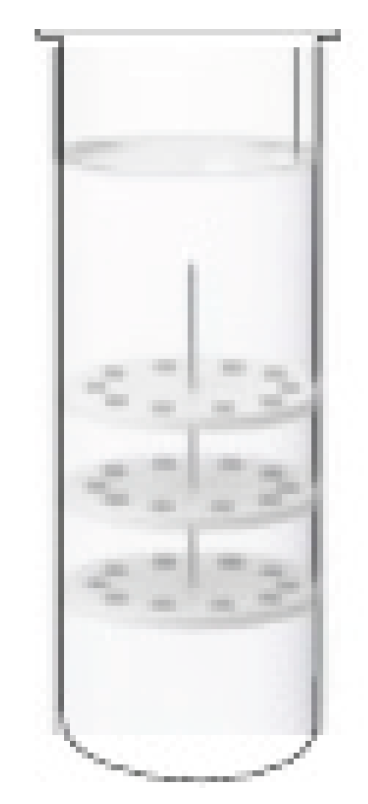
Thus we evaluated the release of boron, cobalt and neodymium elements from two series of encapsulated magnets. The time steps are 30, 60, and 90 days. So we prepared 9 Falcon tubes thus at each period were analyzed three samples (Figure 8). A trace analysis by ICP-MS was carried out to determine the quantities this Co, Nd, B through encapsulation resins for the , Stycast 1267 and Loctite
The Stycast 1266 has not been tested, it revealed in the electrochemical tests and Nielsen – Tuccillo a bad behavior with corroded traces of the magnets.
Figure 8.
Extraction of 3 stacked discs with 10 magnets each.
For a better understanding of the tests we used in the evaluations for this element which is part of the hydrocephalic valve, we have designed a schematic summary presented in Figure 9
3. Results and Discussion:
3.1. Electrochemical Techniques:
- The potential in an open circuit (Eoc):
Metals and alloys immersed in an electrolytic medium develop an electrical potential that stabilizes after a certain period of time, called the quiescent potential or corrosion potential. This surface phenomenon depends on the state of the electrode, influenced by oxidation, passivation or immunity. It is about the mixed potential theory of Traud and Wagner [36].
As it is primarily a surface phenomenon, this potential can vary over time because the nature of the electrode surface changes (oxidation, formation of a passive layer or immunity). The valuable alloys are located in positive potential values (+ 100 → + 275 m V) on the other hand, the steels reveal negative potential values (- 50 → - 400 mV).
In coclusion, the potential in an open circuit is a criterion in the analysis of the behavior of the corrosion but nevertheless remains insufficient. The approach taken of the results obtained is always qualitative but gives a classification of nuances tested and allows us to clear up relative tendencies, specific to the experimental conditions of the test.
Shown in Figure 10 are the potential curves in an open circuit in function with the time of immersion for the three types of epoxy resins studied. The first three days of immersion there is no electrical charge transfer in the resin/substrate metallic interface (CoSm5 magnet). Consequently, we cannot record a variation of the potential in an open circuit. In Figure 8 we se the open potential curves during 24 hours after three days of immersion.
The potentials in an open circuit that were measured for the Stycast 1266, Stycast 1267 and Loctite samples show positive values. There is therefore, on the one hand, the electric permeability of the polymer that we measure and on the other a certain “nobility” by the fact that the potential values are found in the cathodic domain. A Stycast 1267/1 sample tips over into the negative potential domain. The explanation of this result is that due to the obstruction of the center hole in the disk that was supporting the magnets, it was poorly executed. As a consequence, the diffusion of the electrolyte by capillarity towards the metallic part of the electrode holder created an electric circuit that allowed us to measure the potential in an open circuit of the element in steel (Figure 10). This proves that the measurements are highly sensitive. In this way we obtained capital information from these measurements, that being that the polymer is permeable to the passage of electric current towards the metallic surface CoSm5 after three days of immersion.
In the Tafel domain, a sweep of (* 20 mV vs Eop (Open circuit potential The curve obtained I=f(E) is called the Mansfeld polarization curve). From this polarization curve, which is linear, we calculate the polarization resistance (Rp) by determining the slope of the curve for I=0.
The Rp is representative of the degree of protection of the passivation layer on the alloy’s surface. The more the Rp value increases, the more the alloy will resist corrosion and the weaker the Icorr current. The precious alloys can reach Rp values of approximately 3500 - 4000 Kohm/cm2, in the case of steels the Rp value may vary greatly, from 5 to 500 Kohm /cm2.
Mansfeld developed his theory for the corrosion process of metallic alloys. It was extrapolated for the thin protective layers, oxide, paint.... Today bibliographical research reveals that there are hundreds of published studies concerning the extrapolation in Mansfeld’s domain for metallic materials covered with non-metallic protective layers, capable of transferring electric charges in the interfaces.
In our case we have traced the linear polarization curves for the three samples, Stycast 1266, Stycast 1267 and Loctite after 3 days and 5 days of immersion (Figure 11).
The polarization resistance values Rp calculated are shown in Table 2. Electrochemical magnitudes E(i=0) and the corrosion current (icorr) are also shown in Table 2.
Figure 10.
Polarization curves traced in the domain of Mansfeld for the resins studied after 3 days of immersion (R1) and after 5 days of immersion (R2).
Figure 10.
Polarization curves traced in the domain of Mansfeld for the resins studied after 3 days of immersion (R1) and after 5 days of immersion (R2).
The calculated polarization resistance values (Table 2) allow us to make several comments :
- the Rp values in the presence of resins are at unusual levels, they are of the order of Megaohms. Generally speaking, for precious alloys the Rp values are situated between 800 and 4000 Kohm/cm2.
- the differences in the Rp between the metallic surfaces and the surfaces covered with polymer are very important. Thus we cannot make the distinction by a simple arithmetic difference between the metallic surface Rp and the polymer Rp. In our opinion the Rp values measured in the polymer – metal system are specific to polymer. The difference between the metal Rp and the polymer Rp is due to physico-chemical factors inherent to polymer, such as micro porosity, thickness… Of course, the Rp resistance of the polymer layer is important, but it is an electric conductor, therefore measurable, and capable of transporting ions in the electrolyte – polymer interface.
- the corrosion currents also confirm our supposition of the electric permeability of polymer.
- the Rp values presented in table II distinctly show a diminution of the resistance to polarization in function with the time for all of the resins that were studied.
Moreover, the calculated values are relatively discriminative, it seems that best behavior is revealed by Loctite and worst behavior is revealed by StyCast 1266.
- in Figure 10 we also notice a displacement of the Mansfeld polarization curves in function with the time that elapses, this signifies an increase in the electric permeability of the resin, which means its capacity to transport electric charges to the interface.
- Tafel slopes (ba et bc)
The polarization curves that we obtained are shown in Figure 11.
Tafel’s law is only rigorously valid in a sufficiently high field of overvoltage. at the micro-nano limit where the logarithmic relationship between current density and potential is respected. Now, in our case (nano-, pico-or even femto-amperes domains, as for magnets encapsulated in insulating resins), we are:
- at extremely low currents, close to electrochemical noise,
- in a very low polarization zone where capacitive contribution, impurity adsorption, or even instrumental limitations (potentiostate background noise) may dominate,
- far from the pure kinetic control regime required to strictly apply Tafel’s equations.
So, in this context, the Tafel extrapolation loses its theoretical validity: the calculated slopes do not really make physical sense and may mislead on the actual corrosion rate at the resin-metal interface (like).
In practice, for such encapsulated or weakly conductive systems, it is preferred to use:
- electrochemical impedance spectroscopy (EIS), which allows the characterization of charge transfer resistances,
- or open circuit potential (OCP) measurements over long periods,
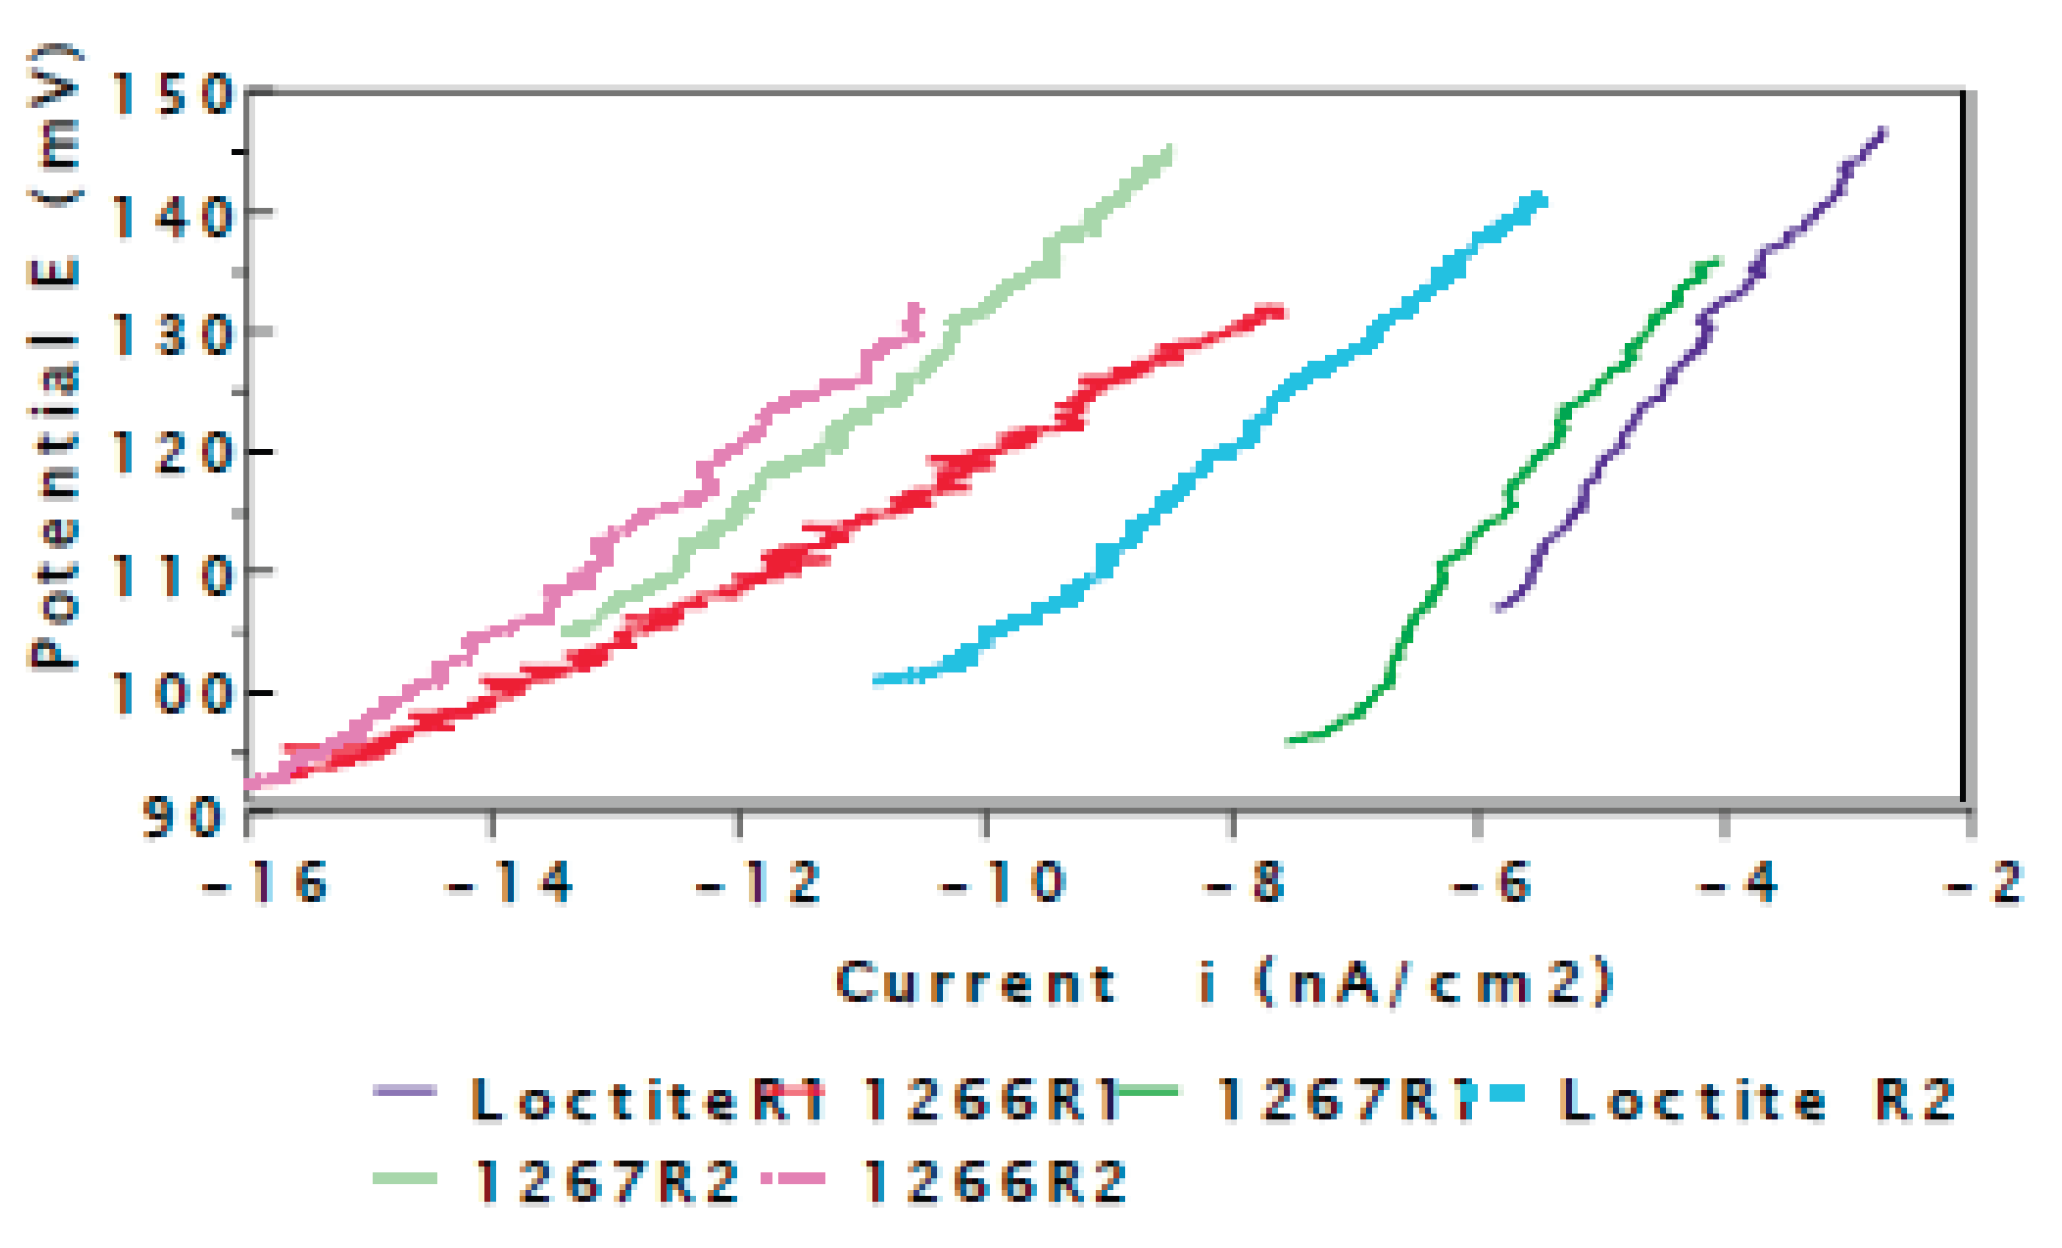
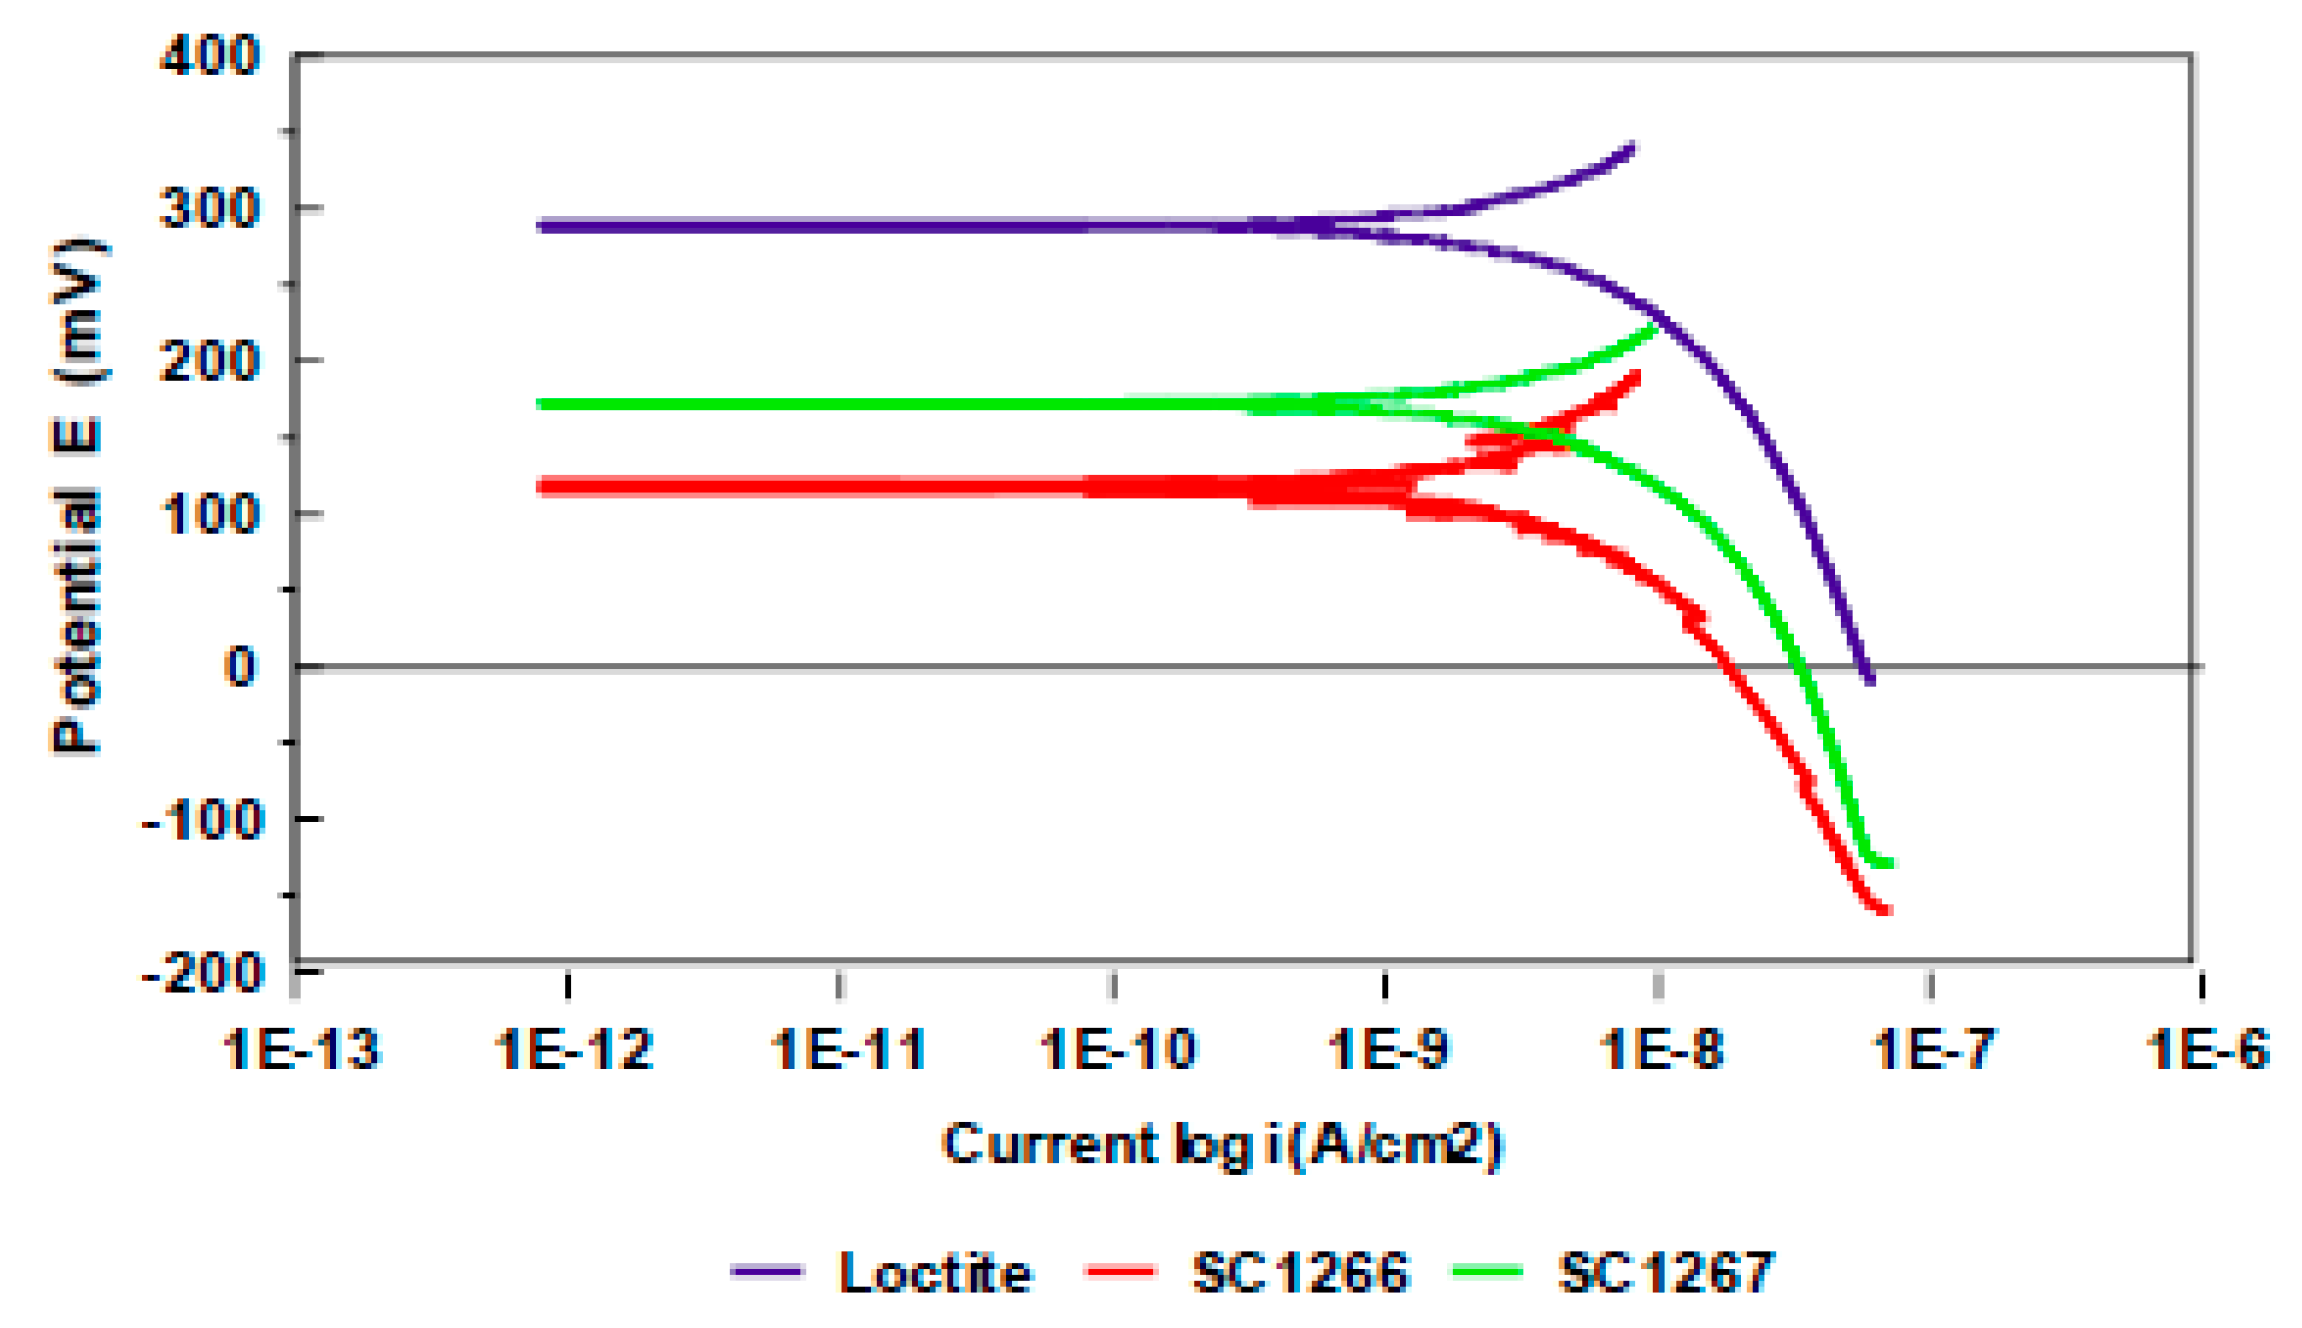
In our case, we have traced the polarization curves in the domain of Tafel with the objective of comparing the polarization curves. In this way we have an additional criteria for comparing the epoxy resins as to their capacity to transfer electric charges (Figure 11).
Nous pouvons faire les remarques suivantes :
- The sweep of the potentiodynamic curves measured in the domain of Tafel (Figure 11) also confirms the capacity of resins to transport electric charges in the resin - metal interface (CoSm5 magnets).
- All three resins shift the sweeping curves into the domain of 10-7 – 10-12 A/cm2, a domain that we do not find in the measurement of metallic surfaces that do not have a polymer coating.
- If we compare the curves, we notice that the Stycast 1266 has poor behavior. We must notice that the presence of the resin at the surface if the CoSm5 magnets allows us to make a distinction as to the resin that is used.
- Certainly, the most important observation is that the layers of resin transport the ions to the interface just as well as the “bare” metal surfaces.
Figure 11.
Polarization curves in the domain of Tafel in a semi-logarithmic presentation for the resins studied. The curves were traced after 5 days of immersion.
Figure 11.
Polarization curves in the domain of Tafel in a semi-logarithmic presentation for the resins studied. The curves were traced after 5 days of immersion.
After the electrochemical tests (potential in an open circuit, resistance t polarization,…), the samples are observed under an optical microscope (Figure 12, Figure 13, Figure 14, Figure 15, Figure 16 and Figure 17). In particular, we observe the surface of magnets composed of CoSm5 in order to make evident any potential corrosion on the surface.
On the microphotographs, we do not see any obvious, neither on the samples coated with the Loctite resin (Figure 12 and Figure 13) nor on the sample coated with the Stycast 1267 resin (Figure 14 and Figure 15); On the other hand, the surface of magnets coated with the Stycast 1266 show evident degradation that is revealed by deposits of corrosion products at the surface of the magnets (Figure 16 and Figure 17).
3.2. Evaluation of the Corrosion by Measuring the Impedance.
Electrochemical Impedance Spectroscopy (EIS) analysis is an essential tool for assessing the barrier properties and protective effectiveness of polymer coatings applied to metal substrates. This technique allows to model the electrochemical response of the system at different frequencies and to identify the mechanisms of charge transfer, ion diffusion and degradation of the protective film [40,41]. in the case of epoxy resins and encapsulating polymers, anti-corrosion performance depends on several factors, including cross-link density, polymer network polarity, and structural integrity of the deposited layer (42,44). Recent work has shown that the presence of porosities, microcracks or insufficient adhesion to the substrate promotes the penetration of electrolytic species, leading to a gradual decrease in polarization resistance and an increase in ion penetration capacity in the double layer. The use of resins such as Stycast or Loctite type epoxy formulations, commonly used for encapsulation and protection of sensitive metal components, has advantages in terms of adhesion, thermal stability and resistance to ion penetration (45). Their performance, however, depends on the prior surface preparation — in particular degreasing, micro-sandblasting or plasma treatment—which conditions wettability and interfacial cohesion [46].
The results of measuring the impedance for the different layers of polymer studied are represented in the complex plan in Nyquist’s diagram. We carried out approximately twenty measurements.
In Figure 18, we have shown the Loctite layer measured in function with time; after 3 days, 5 days and 9 days of immersion. The size of the half circle diminishes with time, thus indicating a decrease in the resistance of the layer, which translates to an increase in the permeability of the layer for the transport of electric charges in the interface. We can also suppose that it is a process that characterizes the degradation of the layer in the presence of an electrolyte. The same kind of measurement carried out on the Stycast 1266 and Stycast 1267 layers reveal similar degradation processes.
The results obtained for the three layers are shown in a comparative manner in Figure 19. After three days of immersion we notice that the transfer resistance values are very close. The three polymers therefore have similar behavior in their capacity to transfer electric charges in the polymer/metal (CoSm5) interface.
Stycast 1266 presents the lesser behavior even though the transfer resistances are very close in value.
In the same experimental conditions, we have carried out a new series of measurements after 5 days of immersion. The results are presented in Figure 20. We notice a decrease in the transfer resistance for the three polymers studied. On the other hand, the appearance of the curves for Stycast polymers changes. If the surface condition of the measurement electrode were to lead to other faults when the test surfaces are not homogenous or the half-circle representing the resistance to transferring (Zre) charges and the capacity of the double layer (Zim) in the diagram to change appearances. In the case of Stycast type polymers, according to the appearance of the impedance measurement diagrams, it is probable that a process of migration activated by an electric field carries out the process of ionic transport through the polymer layer. In this way we can explain the presence of corrosion products that are found in the polymer/metal interfaces.
After five days of immersion the results that we obtained also revealed that the Stycast 1266 presents behavior that is not as good as the others. The Loctite shows the best behavior. It is important to mention that the technique for measuring the impedance furnishes information just as much in the time as in space as to the processes that are carried out on the polymer/metal interface, but the measures call for either equivalent electric schemas or for numerical calculations. In our case the difficulty consisted of finding an equivalent circuit that allows one to take into consideration just as much the dependence in frequency of faradic processes as their spatial distribution. The purpose being to understand the different behavior of the Loctite. Adhesives resin in relationship to the Stycast resin.
A series of measurements taken systematically over a long term should be made in order to appreciate the durability of the polymer layers used for the protection of CoSm5 magnets.
The first evaluations clearly show that the Stycast 1266 coating has a lesser resistance to corrosion. The Loctite polymer shows the best behavior, but we must take into account that there is in fact degradation over time (Figure 18) and therefore an increase in the capacity to transfer ions in the interface.
The Nyquist diagrams obtained for coated samples reveal a capacitive behavior, characteristic of an effective insulating barrier. However, the gradual decrease in diameter of the capacitive loops over time or after prolonged immersion indicates a weakening of charge transfer resistance, attributable to electrolyte penetration within the polymer layer. According to M and all such an evolution reflects the formation of conductive micro-pathways related to the degradation of the epoxy network or subfilm corrosion of the metal substrate (47,48).
3.3. Evalutaion Corrosion According to the Nielsen-Tuccillo Method
After evaluation of the corrosion according to Nielsen-Tuccillo, the samples are studied under a low-power optical microscope (Figure 21, Figure 22, Figure 23, Figure 24, Figure 25 and Figure 26).
After 30 days of testing according to Nielsen Tuccillo, the magnets coated in the Loctite resin did not present any evident corrosion (Figure 21 and Figure 22).
Also after 30 days, the magnets coated in the Stycast 1267 resin did not present any corrosion aside from on one magnet (Figure 23 and Figure 24). On the other hand, the magnets coated in the Stycast 1266 resin present corrosion after 15 days of testing according to the Nielsen-Tuccillo method (Figure 25 and Figure 26).
3.4. Kinetics of Release on Encapsulated Magnets.
Each series of measurement is made up of a blank (9 g/l NaCl), a blank 1 (NaCl 9g/l + nylon thread), a sample #A and #B. The blank enables to verify if the electrolyte is pure or if flask releases during extraction. The blank 1 enables to verify if the thread used to attach the samples releases during extraction. The extractions are done for 30 days, 60 days and 90 days respectively.
Les resultats sont montrés dans le tableau III
Table 3.
Results of ICP-MS analysis.
| Duration | Samples | Borium | Cobalt | Nyodymium |
|---|---|---|---|---|
| [μg.l-1] | [μg.l-1] | [μg.l-1] | ||
| Blank | < 1 | < 0.02 | < 0.02 | |
| 30 days | Blank 1 | < 1 | < 0.02 | < 0.02 |
| Stycast 1267 | 1.30 | 0.30 | 0.06 | |
| Loctite | < 1 | 0.13 | < 0.02 | |
| Blank | < 2 | < 0.04 | < 0.04 | |
| 60 days | Blank 1 | < 2 | < 0.04 | < 0.04 |
| Stycast 1267 | < 2 | 0.87 | 0.63 | |
| Loctite | < 2 | 0.16 | < 0.04 | |
| Blank | 29 | < 0.2 | < 0.2 | |
| 90 days | Blank 1 | 8.02 | < 0.2 | < 0.2 |
| Stycast 1267 | 8.31 | 0.80 | 0.39 | |
| Loctite | 22 | 1.2 | < 0.2 |
The limits of detections vary according to the duration of extraction (tab. III). This is due to the matrix which gets charged into organic components that perturb the ICP-MS trace analyses.
After 90 days of extraction, the blank contains some borium; this probably means that the flasks release borium, after being latent for several tens of days.
According to the series of the samples in question, the release kinetics is different: The series Stycast 1267 releases cobalt mainly in the first 60 days, then we note a level that is established at about 0.8 μg/l (Figure 27). The release kinetics of cobalt of the series Loctite behaves differently: A level of about 0.15 μg/l is observed for 60 days, then the release of cobalt quickly increases and reaches 1.2 μg/l (Figure 27).
The release of Nyodymium is very different from one series to another. The series Stycast 1267 releases Nyodymium up to a concentration that could reach 0.6 μg/l (Figure 28). The release of Nyodymium of the series Loctite is at the detection limit (Figure 28).
The release of cobalt and Nyodymium is not linked Figure 27 and Figure 28 ; that is, there is no direct relation between the concentration of the two elements.
In Summary:
- The two sample series release cobalt ; however the kinetics is different between the two types of samples. For the series Stycast 1267 , cobalt gets released quickly then stabilises. For the series Loctite on the other hand, cobalt gets hardly released for the first 60 days then increases quickly. Unlike the series Stycast 1267 , the samples of the series Loctite do not release Neodymium.
- The matrix gets charged into organic components that perturb trace analysis. These organic components probably originate from the wear and tear of plastic materials present, like flask, the attaching thread of the samples and the samples themselves (encapsulant).
With time, the magnets show signs of corrosion.
3.5. Theoretical Considerations
The whole of the results proves the capacity of a polymer immerged in an electrolytic environment to transport electric charges. We suppose several hypotheses:
The microcracks and the porosity which is found in the polymer may be generated during fabrication, manipulation or use. Other factors may intervene such as the kinetics of the polymerization, the temperature, the pH, chemical degradation processes, the presence of monomers, dimmers, etc.
The examination of the polymer epoxy surfaces for the three types (Stycast 1266, 1267 and Loctite) after gold cathodic sputtering, does not reveal porosities or fissures under magnification of 8000 x.
We could also suppose that an electrokinetic phenomenon occured, more precisely an electro-osmosis phenomenon. The electrokinetic potential or potential corresponds to the difference of potential between the polymer surface and the electrolyte mass whereas the electrochemical potential E is the difference of potential between the metal’s mass and the electrolyte. The two potentials may be either of the same sign or opposite. The electrolyte may influence the value of the electrokinetic potentials. This influence is mainly due to the cations if the polymer wall is charged negatively, or due to the influence of anions if the polymer wall is charged positively. For the polymers the electrokinetic potentials are between 30 and 50 mV. Therefore on an imposed electric field we can transport in the polymer-metal interface of the electrolyte. This could explain the transportation of ions to the surface of the CoSm that generates the corrosion process that is visible when examinin the CoSm metallic surfaces after removal of the coating layer (Figure 29).
Table 3.
Semi-quantitative EDX analysis. % (m/m).
| Spectrum | C | O | Na | Si | Cl | Co | Sm |
|---|---|---|---|---|---|---|---|
| Spectrum 1 | 5.88 | 1.58 | 1.07 | 62.94 | 28.53 | ||
| Spectrum 1 | 17.56 | 0.90 | 49.91 | 31.63 | |||
| Spectrum 3 | 72.24 | 17.11 | 0.18 | 0.22 | 7.12 | 3.13 |
On the intact surface (spectrum 1, Figure 29), we observe the presence of sodium and on the corroded part (spectrum 3, Figure 29), we observe the presence of chlorine. We can invoke a phenomenon of selective migration of the anode and the cathode; migration of chloride anions to the anode in order to respect the electroneutrality of the interface as well as sodium cations to the cathode.
The resins used may also be considered to be like solid electrolytes with relatively high ionic conductivity at room temperature. The polymer electrolytes have the particularity, compared to classic solid electrolytes, of presenting a conduction that is at the same time cationic and anionic. This explains the possibility to trace potentiodynamic in both the cathodic and anodic domaines for these samples (Figure 30).
The intensity of the currents that circulate depends upon the intrinsic properties of the phases that are in contact (structure of the solid electrolyte) and on the electric potential imposed between the phases, in magnitude and sign. This also explains the results obtained by the electrochemical impedance spectroscopie techniques. The polymer that covers the metal is a mixed conductor and the exchanges at each interface can then be presented in the following manner (Figure 31) :
- The polymer - electrolyte interface exchange
- The transportation in the polymer layer
- The polymer - CoSm magnet interface exchange
4. Conclusions
- The analysis of the polymeric disc (PES) integrating the ten micromagnets of the valve regulation mechanism showed a measurable electrochemical interaction between the encapsulated magnets and the electrolyte, simulated NaCl solution 9g/l. This interaction is at the origin of a localized corrosion process and an ionic release (Co, Fe, Sm, Nd, B) likely to alter the stability of the device.
- The microscopic and electrochemical observations confirm that the quality of the polymer coating is decisive: the micro-defects, cracks or porosities of the PES promote leakage currents and the gradual oxidation of the magnets (Figure 10).
- The comparative tests between different types of coating resins indicate that conventional epoxy resins have a better initial barrier but limited stability over time in ionic medium. After three days of immersion, we notice an electrical transfer between the electrolyte and the metal surfaces of the magnets. All three resins shift the sweeping polarisation curves into the domain of 10-7 – 10-12 A/cm2
- On the electrochemical level, measurements of corrosion potentials, current density and spectroscopic impedance showed a direct dependence between fluid conductivity and coating degradation, suggesting that corrosion is dominated by ion transfer mechanisms through the resin layer between magnets and surrounding fluid.
- Experimental results confirm that, despite the mechanical reliability of current magnetic valves, the chemical stability of the magnet–resin system remains the critical point for their long-term durability. Surface engineering solutions are therefore necessary to ensure biocompatibility in a wet and electrolyte environment such as the LCS.
- Finally, the data obtained pave the way for the design of hybrid magnetic valves, integrating ceramic nanometric coatings combined with low dielectric constant polymer resins, in order to limit ionic conduction and ensure total electrochemical inertness over time.
Author Contributions
Conceptualisation, L.R. and B.G; methodology, L.R.; validation, B.G., L.R., I.D.and R.I.G, formal analysis, L.R. and B.G.; investigation, L.R. D.I and R.I.G; resources, L.R. and D.I; data curation, L.R., D.I.and R.I.G; writing—original draft preparation, L.R., B.G, D.I..and R.I.G; writing—review and editing, R.L, B.G., D.I., R.I.G; All authors have read and agreed to the published version of the manuscript.
Funding
This research received no external funding.
Institutional Review Board Statement
Not applicable.
Informed Consent Statement
Not applicable.
Data Availability Statement
The original contributions presented in this study are included in the article. Further inquiries can be directed to the corresponding authors.
References
- Rekate, H.L. A consensus on the classification of hydrocephalus: its utility in the assessment of abnormalities of cerebrospinal fluid dynamics. Childs Nerv Syst. 2011, 27(10):1535-41. [CrossRef]
- Kahle, K.T., Kulkarni, A.V., Limbrick, D.D., Warf, B.C. (2016). Hydrocephalus in children. The Lancet, 2016, 387(10020), 788–799. [CrossRef]
- Faheem Anwar, Kuo Zhang, Changcheng Sun, Meijun Pang, Wanqi Zhou, Haodong Li, Runnan He, Xiuyun Liu, Dong Ming. Hydrocephalus: An update on latest progress in pathophysiological and therapeutic research. Biomedicine & Pharmacotherapy. 2024, Vol 181, 117702. [CrossRef]
- Drake, J.M., Kestle, J.R.W., Tuli, S. (2000). CSF shunts 50 years on – past, present and future. Child’s Nervous System, 2000 , 16(10–11), 800–804. [CrossRef]
- Min Li , Han Wang, Yetong Ouyang , Min Yin , Xiaoping Yin. Efficacy and safety of programmable shunt valves for hydrocephalus: A meta-analysis. Int J Surg . 2017, 44:139-146. [CrossRef]
- Kuan-Hung Chen, Peng-Wei Hsu, Bo-Chang Wu, Po-Hsun Tu, Yu-Chi Wang, Cheng-Chi Lee1, Yin-Cheng Huang, Ching-Chang Chen, Chi-Cheng Chuang, Zhuo-Hao Liu1, Long-term follow-up and comparison of programmable and non-programmable ventricular cerebrospinal fluid shunts among adult patients with different hydrocephalus etiologies: a retrospective cohort study. Acta Neurochirurgica, (Wien). Vol 165, pages 2551–2560, (2023). [CrossRef]
- 7. H Xu, Z X Wang, F Liu, G W Tan, H W Zhu, D H Chen. Programmable shunt valves for the treatment of hydrocephalus: a systematic review Eur J Paediatr Neurol. 2013, 17(5):454-61. [CrossRef]
- Pudenz, R.H., & Foltz, E.L. Hydrocephalus: overdrainage by ventricular shunts. A review and recommendations. Surg Neurol. 1991, 35(3), 200-12. [CrossRef]
- F Eymen Ucisik , Alexander B Simonetta, Eliana M Bonfante-Mejia. Magnetic resonance imaging-related programmable ventriculoperitoneal shunt valve setting changes occur often, Acta Neurochir (Wien), 2022, 164(2):495-498. [CrossRef]
- Aswin Chari, B.M. B.Ch., Marek Czosnyka, M. , Richards, H.K., Pickard, J.D., Chir. M., Czosnyka, Z.H. Hydrocephalus shunt technology: 20 years of experience from the Cambridge Shunt Evaluation Laboratory. Neurosurgery ,2014, Vol, 120: Issue 3, 697–707. [CrossRef]
- Takashi Inoue , Yasutaka Kuzu, Kuniaki Ogasawara, Akira Ogawa. Effect of 3-tesla magnetic resonance imaging on various pressure programmable shunt valves. J Neurosurg. 2005, 103(2 Suppl):163-5. [CrossRef]
- Arnell K, Eriksson E, Olsen L (2006) The programmable adult Codman Hakim valve is useful even in very small children with hydrocephalus. A 7-year retrospective study with special focus on cost/benefit analysis. Eur J Pediatr Surg 2006 16(1):1–7. [CrossRef]
- Certas™ Programmable Valve System – Technical White Paper. Codman & Shurtleff Inc. https://products.integralife.com/file/general/1549983654.pdf.
- Chen, B. , Dammann, P., Jabbarli, R., Sure, U., Quick, H.H., Kraff ,O., Karsten H Wrede, K.H. Safety and function of programmable ventriculo-peritoneal shunt valves: An in vitro 7 Tesla magnetic resonance imaging study, PLoS One. 2023 11;18(10):e0292666. [CrossRef]
- M Akbar, A Aschoff, J C Georgi, E Nennig, S Heiland, R Abel, C Stippich. Adjustable cerebrospinal fluid shunt valves in 3.0-Tesla MRI: a phantom study using explanted devices. Rofo . 2010 Jul;182(7):594-602. [CrossRef]
- König,R.E., Stucht ,D., Baecke, S., Rashidi , A., Speck ,O., Sandalcioglu , I.E., Luchtmann, M. Pase-Contrast MRI Detection of Ventricular Shunt CSF Flow: Proof of Principle. J Neuroimaging. 2020, 30(6):746-753. [CrossRef]
- Flürenbrock F., Leonie Korn L., Dominik Schulte, D., Podgoršak ,A., Chomarat ,J., Hug ,J., Hungerland ,T., Holzer, C , Iselin ,D., Luca Krebs, L., Rosina Weiss,R., Oertel,M.F., Stieglitz,L., Weisskopf, M., Mirko Meboldt,M., Melanie N Zeilinger,M. Daners , M. VIEshunt: towards a ventricular intelligent and electromechanical shunt for hydrocephalus therapy. Fluids Barriers CNS . 2025, 14;22(1):28. [CrossRef]
- Rrinivas Dwarakanath, Gaurav Tyagi, Gyani J S Birua, Shunt Implants – Past, Present and Future. Neurology India 2021 69(8):449-456. [CrossRef]
- Richard, J.E. , Drak, J. Cerebrospinal Fluid Devices, CHAPTER 192, Programmable Valves. https://clinicalgate.com/cerebrospinal-fluid-devices.
- LOCTITE-STYCAST-1266-en_GL.pdf. https://www.mouser.com/datasheet/2/773/LOCTITE_STYCAST_1266_en_GL-3434542.pdf?srsltid=AfmBOorHdnAHeKy-KdReNhIW1czupOK-Qm5-K023_9i9Up-AHSH09Y_x.
- LOCTITE_STYCAST_1267_en_US_9445.pdf. https://shop.bm-chemie.com/media/akeneo_connector/media_files/L/O/LOCTITE_STYCAST_1267_en_US_9445.pdf.
- 1382876-LT-8251_IA Medical Brochure_v12.indd. Loctite Adhesives for Medical Devices https://eu.mouser.com/pdfDocs/medical-product-selector-guide-adhesives-for-medical-device-assembly.pdf.
- Gutfleisch,O. J., Müller,L. K-H., Schul, L. FePt Hard Magnets. Advanced Eng Mat 2005, 7, no 4.
- ASTM G106-89(1999) - Standard Practice for Verification of Algorithm and Equipment for Electrochemical Impedance Measurements.
- Wenyu Wang, Yanfang Yang, Donglei Wang, Lihua Huang, Toxic Effects of Rare Earth Elements on Human Health: A Review. Toxics 2024, 12(5), 317. [CrossRef]
- Nemi Malhotra, Hua-Shu Hsu, Sung-Tzu Liang, Marri Jmelou M Roldan, Jiann-Shing Lee , Tzong-Rong Ger, Chung-Der Hsiao. An Updated Review of Toxicity Effect of the Rare Earth Elements (REEs). Aquatic Organisms, Animals (Basel) 2020, 16;10(9):1663. [CrossRef]
- Yan Liu, Ruxia Pu, Bo Zou, Xiaojia Zhang, Xiaohui Wang, Haijing Yin, Jing Jin, Yabin Xie, Yuting Sun, Xiaoe Jia, Yannan Bi. Samarium Oxide Exposure Induces Toxicity and Cardiotoxicity in Zebrafish Embryos Through Apoptosis Pathway Appl Toxicol 2025,45(7).1258-1269. [CrossRef]
- Boyu Yang, Luning Sun, Zheng Peng , Qing Zhang , Mei Lin , Zhilin Peng, Jue Yang , Lan Zheng5 Toxicity of rare earth elements europium and samarium on zebrafish development and locomotor performance J Hazard Mater. 2025, 5:487:137213. [CrossRef]
- Hun Yee Tan1, Yin How Wong, Azahari Kasbollah, Mohammad Nazri Md Shah, Basri Johan Jeet Abdullah5, Alan Christopher Perkins, Chai Hong Yeong7 Biodistribution and long-term toxicity of neutron-activated Samarium-153 oxide-loaded polystyrene microspheres in healthy rats Nucl Med Biol. 2025, 146-147:109026. [CrossRef]
- Shinohara, A., Chiba, M., Kumasaka, T. Behavior of samarium inhaled by mice: Exposure length and time-dependent change Journal of Radioanalytical and Nuclear Chemistry Vol 281,2009 pages 119–122. [CrossRef]
- Bondemark ,L., ,Kurol, J., Wennberg, A. Orthodontic rare earth magnet--in vitro assessment of cytotoxicity Br J Orthod. 1994, 21(4):335-41. [CrossRef]
- Donohue, VE, McDonald F., Evans, R. In vitro cytotoxicity testing of neodymium-iron-boron magnets. J Appl Biomater. 1995 Spring;6(1):69-74. [CrossRef]
- Slaymaker,J. , Rossouw,E., Michelogiannakis, D. The influence of protective coatings on corrosion resistance in orthodontic magnets: A systematic review of in vitro studies. Int Orthod. 2025 8;24(1):101080. [CrossRef]
- Noar , J.H., Evans. R.D. Rare earth magnets in orthodontics: an overview. Br J Orthod 1999, 26(1):29-37. [CrossRef]
- Darendeliler , M.A., Darendeliler, A., Mandurino, M.. Clinical application of magnets in orthodontics and biological implications: a review. Eur J Orthod. 1997 , 19(4):431-42. [CrossRef]
- C. Wagner, C., Traud, W. “On the Interpretation of Corrosion Processes through the Superposition of Electrochemical Partial Processes and on the Potential of Mixed Electrodes,” with a Perspective by F. Mansfeld. CORROSION 2006, 62(10). [CrossRef]
- Thorsten Eichler Corrosion Books: Electrochemical Noise Measurement for Corrosion Applications. By: J.R. Kearns, J.R. Scully, P.R. Roberge, D.L. Reichert, J.L. Dawson Materials and Corrosion, 2007 58(5): 390-390. [CrossRef]
- Da-Hai Xia, Shizhe Song, Yashar Behnamian, Wenbin Hu,1 Y. Frank Cheng Jing-Li Luo, and François Huet. Review—Electrochemical Noise Applied in Corrosion Science: Theoretical and Mathematical Models towards Quantitative Analysis. Journal of The Electrochemical Society, 2020, 167 081507. [CrossRef]
- Florian Mansfeld. The Electrochemical Noise Technique - Applications in Corrosion Research. AIP Conference Proceedings, 2005 Volume 780, Issue 1. [CrossRef]
- Trentin A, Pakseresht A, Duran A, Castro Y, Dušan, G. Electrochemical Characterization of Polymeric Coatings for Corrosion Protection: A Review of Advances and Perspectives. Polymers 2022, 14(12), 2306; [CrossRef]
- Lazanas. A. Ch., Prodromidis.M. I., Electrochemical Impedance Spectroscopy─A Tutorial. CS Measurement Science Au 2023, Vol 3/Issue 3. [CrossRef]
- Saikia M, Dutta T, Jadhv N, Lalita D.J, Insights into the Development of Corrosion Protection Coatings Polymers 2025, 17(11), 1548; [CrossRef]
- Yosra K. Christopher M. Serfass A. Cagnard, K.R. Houston S. A. Khan, Lilian C. H, Orlin D. V, Molecular structure effects on the mechanisms of corrosion protection of model epoxy coatings on metals. Materials Chemistry Frontiers, 2023, 7, 274-286 . [CrossRef]
- Samardžija M , Alar V, Špada V, Stojanović I. Corrosion Behaviour of an Epoxy Resin Reinforced with Aluminium Nanoparticles. Coatings 2022, 12(10), 1500; [CrossRef]
- Henkel Corporation, Stycast and Loctite Epoxy Resins Technical Datasheets, 2023. https://datasheets.tdx.henkel.com/LOCTITE-STYCAST-1090-SI-CAT-23LV-en_GL.pdf.
- Mosas A. K. A, Chandrasekar, A.R, Dasan A, Pakseresht A, Galusek D. Recent Advancements in Materials and Coatings for Biomedical Implants. Gels 2022, 8(5), 323; [CrossRef]
- Muhammad A. N. S., Farooq A., Lodhi M. J. K., Deen K. — Performance Evaluation of Epoxy Coatings Containing Different Fillers in Natural and Simulated Environmental Conditions for Corrosion Resistance. Op Acc J Bio Eng & Bio Sci. 2019. [CrossRef]
- Muhammad A. N. S., Farooq A., Lodhi M. J. K., Deen K. Performance Evaluation of Epoxy Coatings Containing Different Fillers in Natural and Simulated Environmental Conditions for Corrosion Resistance. Op Acc J Bio Eng & Bio Sci. 2019. DOI : 10.32474/OAJBEB.2019.03.000168.
Figure 1.
Integrated device- Fluidic connections.
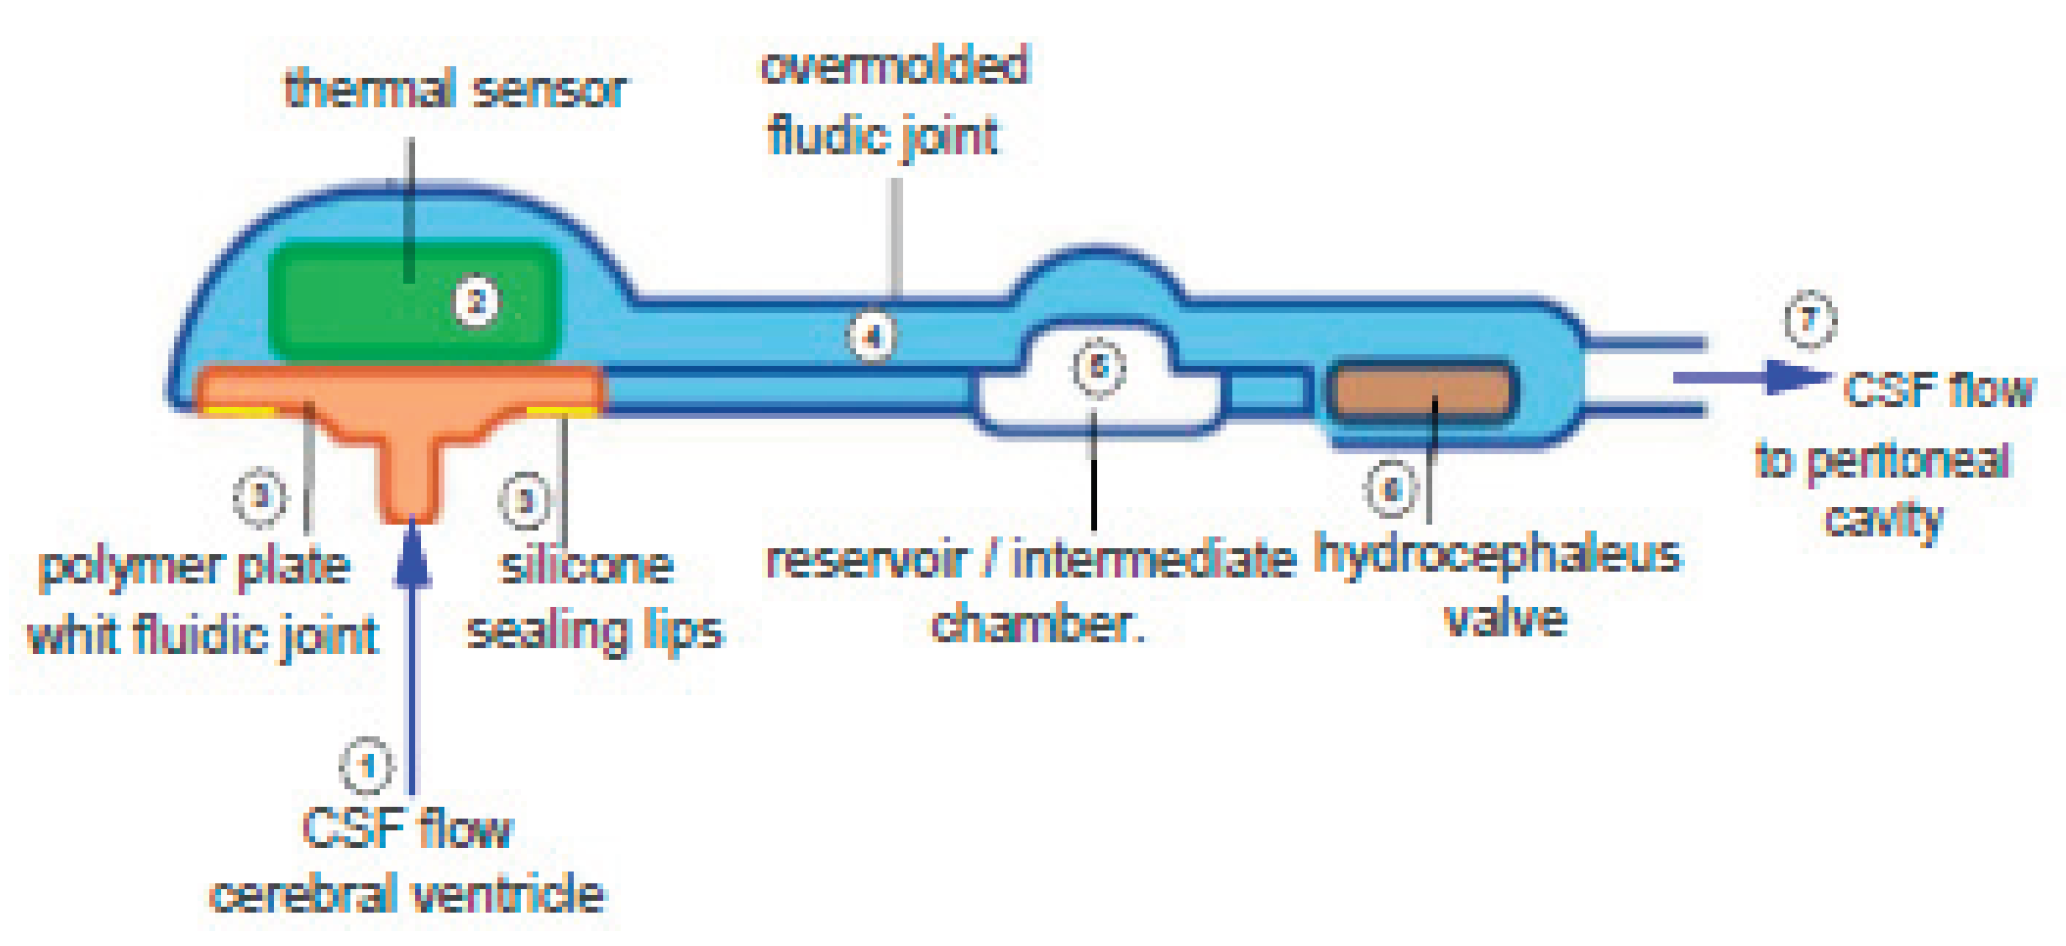
Figure 2.
Hydrocephaleus valve- Programable pressure.
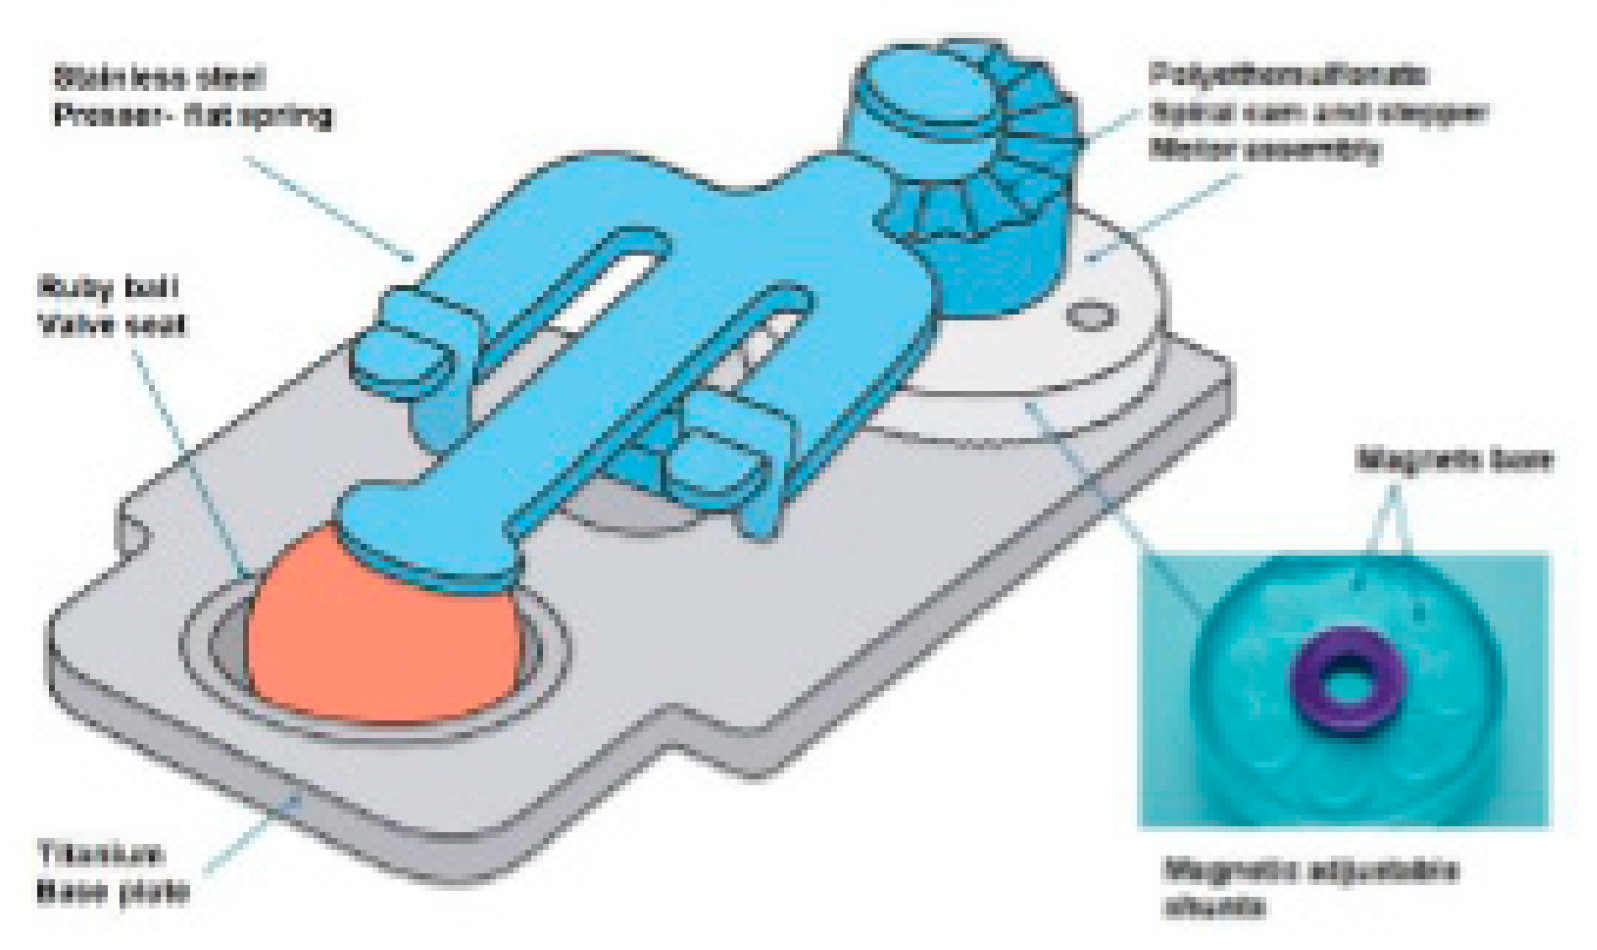
Figure 3.
Digital photo of the test samples.
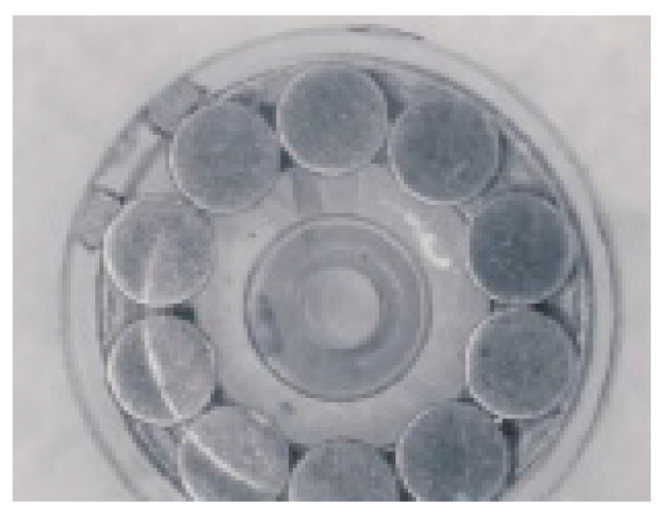
Figure 4.
Electrode-holder.
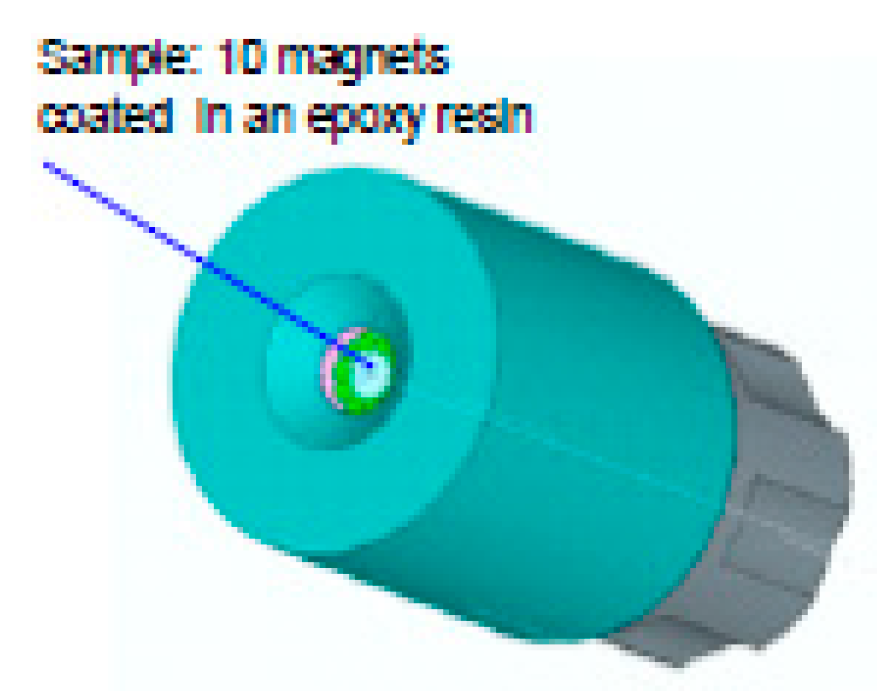
Figure 5.
Cross-section of the electrode-holder.
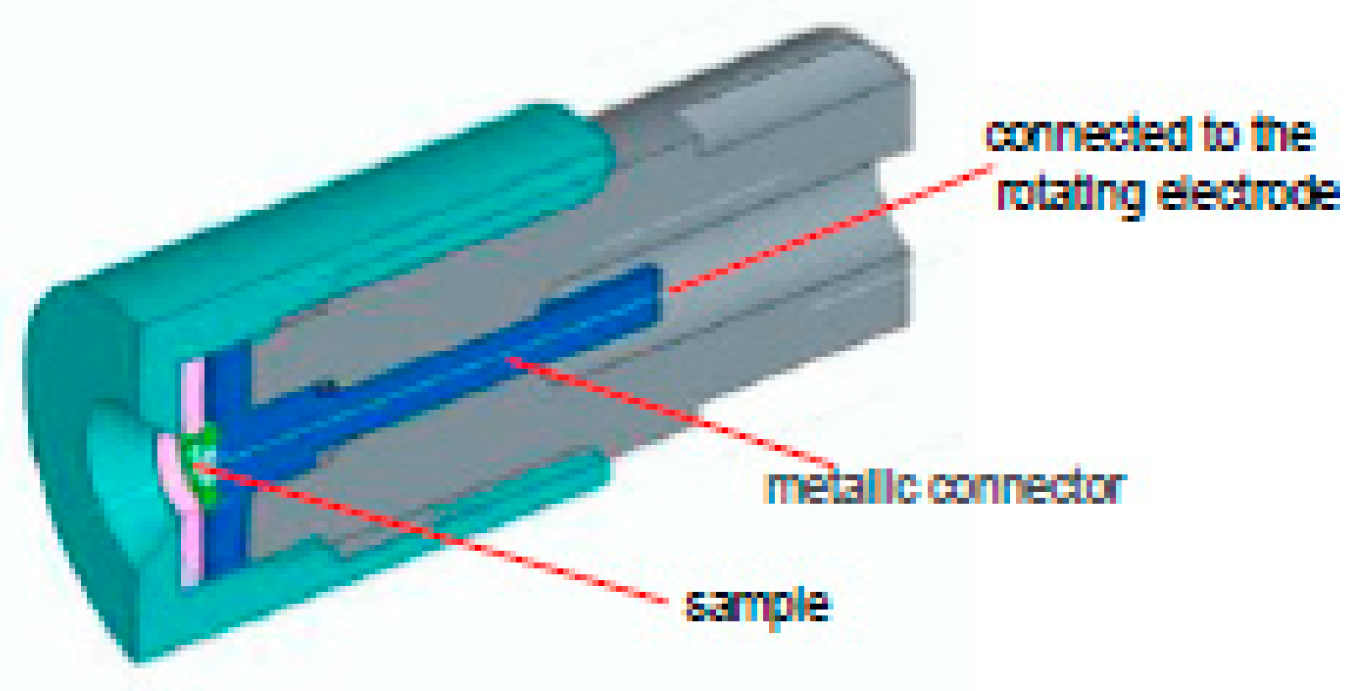
Figure 6.
(a) Schema of the rotating electrode; (b) Figure 6b Rotating Electrode.
Figure 6.
(a) Schema of the rotating electrode; (b) Figure 6b Rotating Electrode.
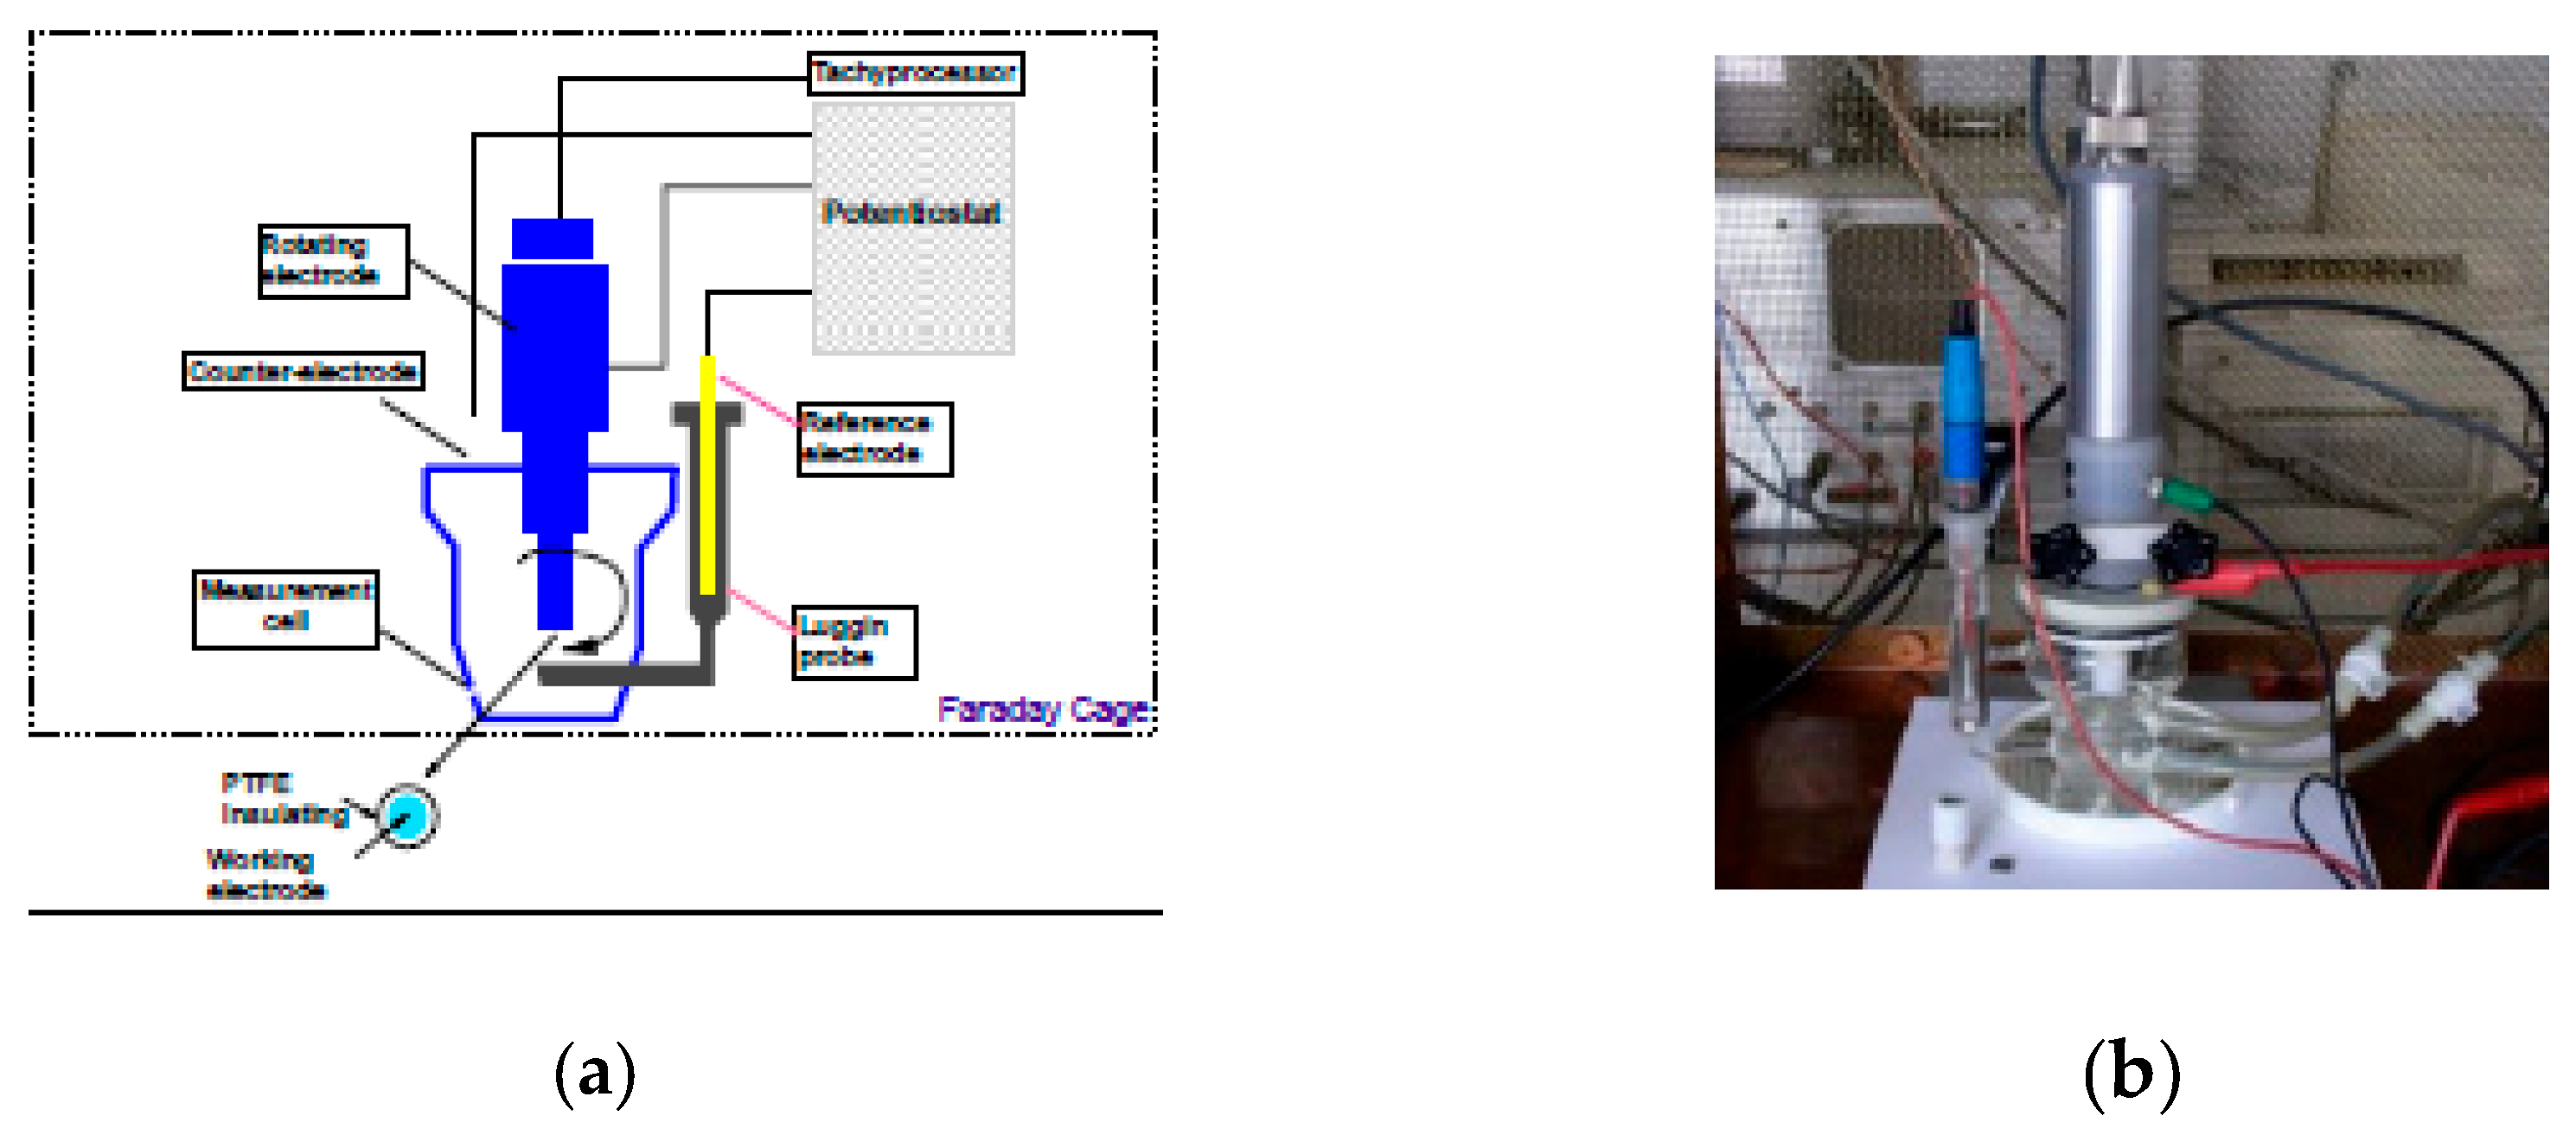
Figure 7.
a. Equivalent circuit used in the calculation of the Re, Rt and Cdc parameters. b. Determination of different parameters on the Nyquist diagram.
Figure 7.
a. Equivalent circuit used in the calculation of the Re, Rt and Cdc parameters. b. Determination of different parameters on the Nyquist diagram.
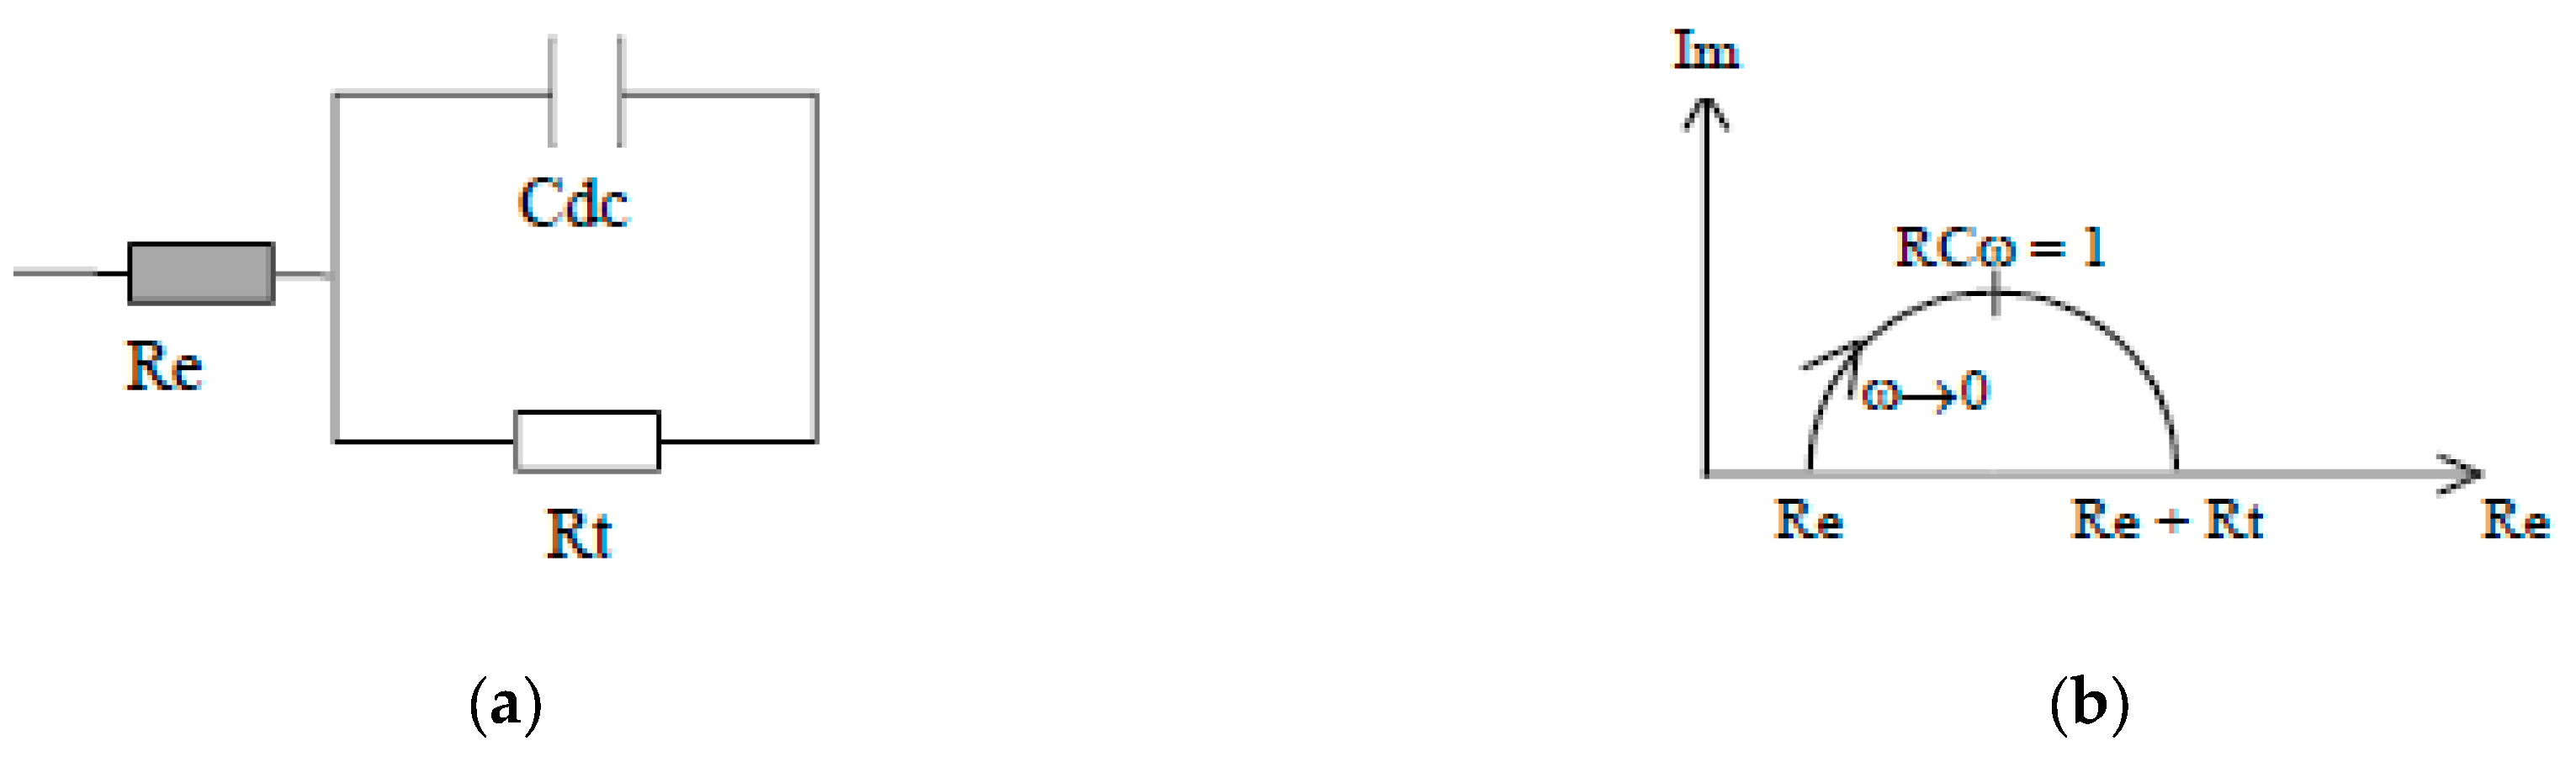
Figure 9.
Schematic Summary of the evaluation tests and samples used in this study.
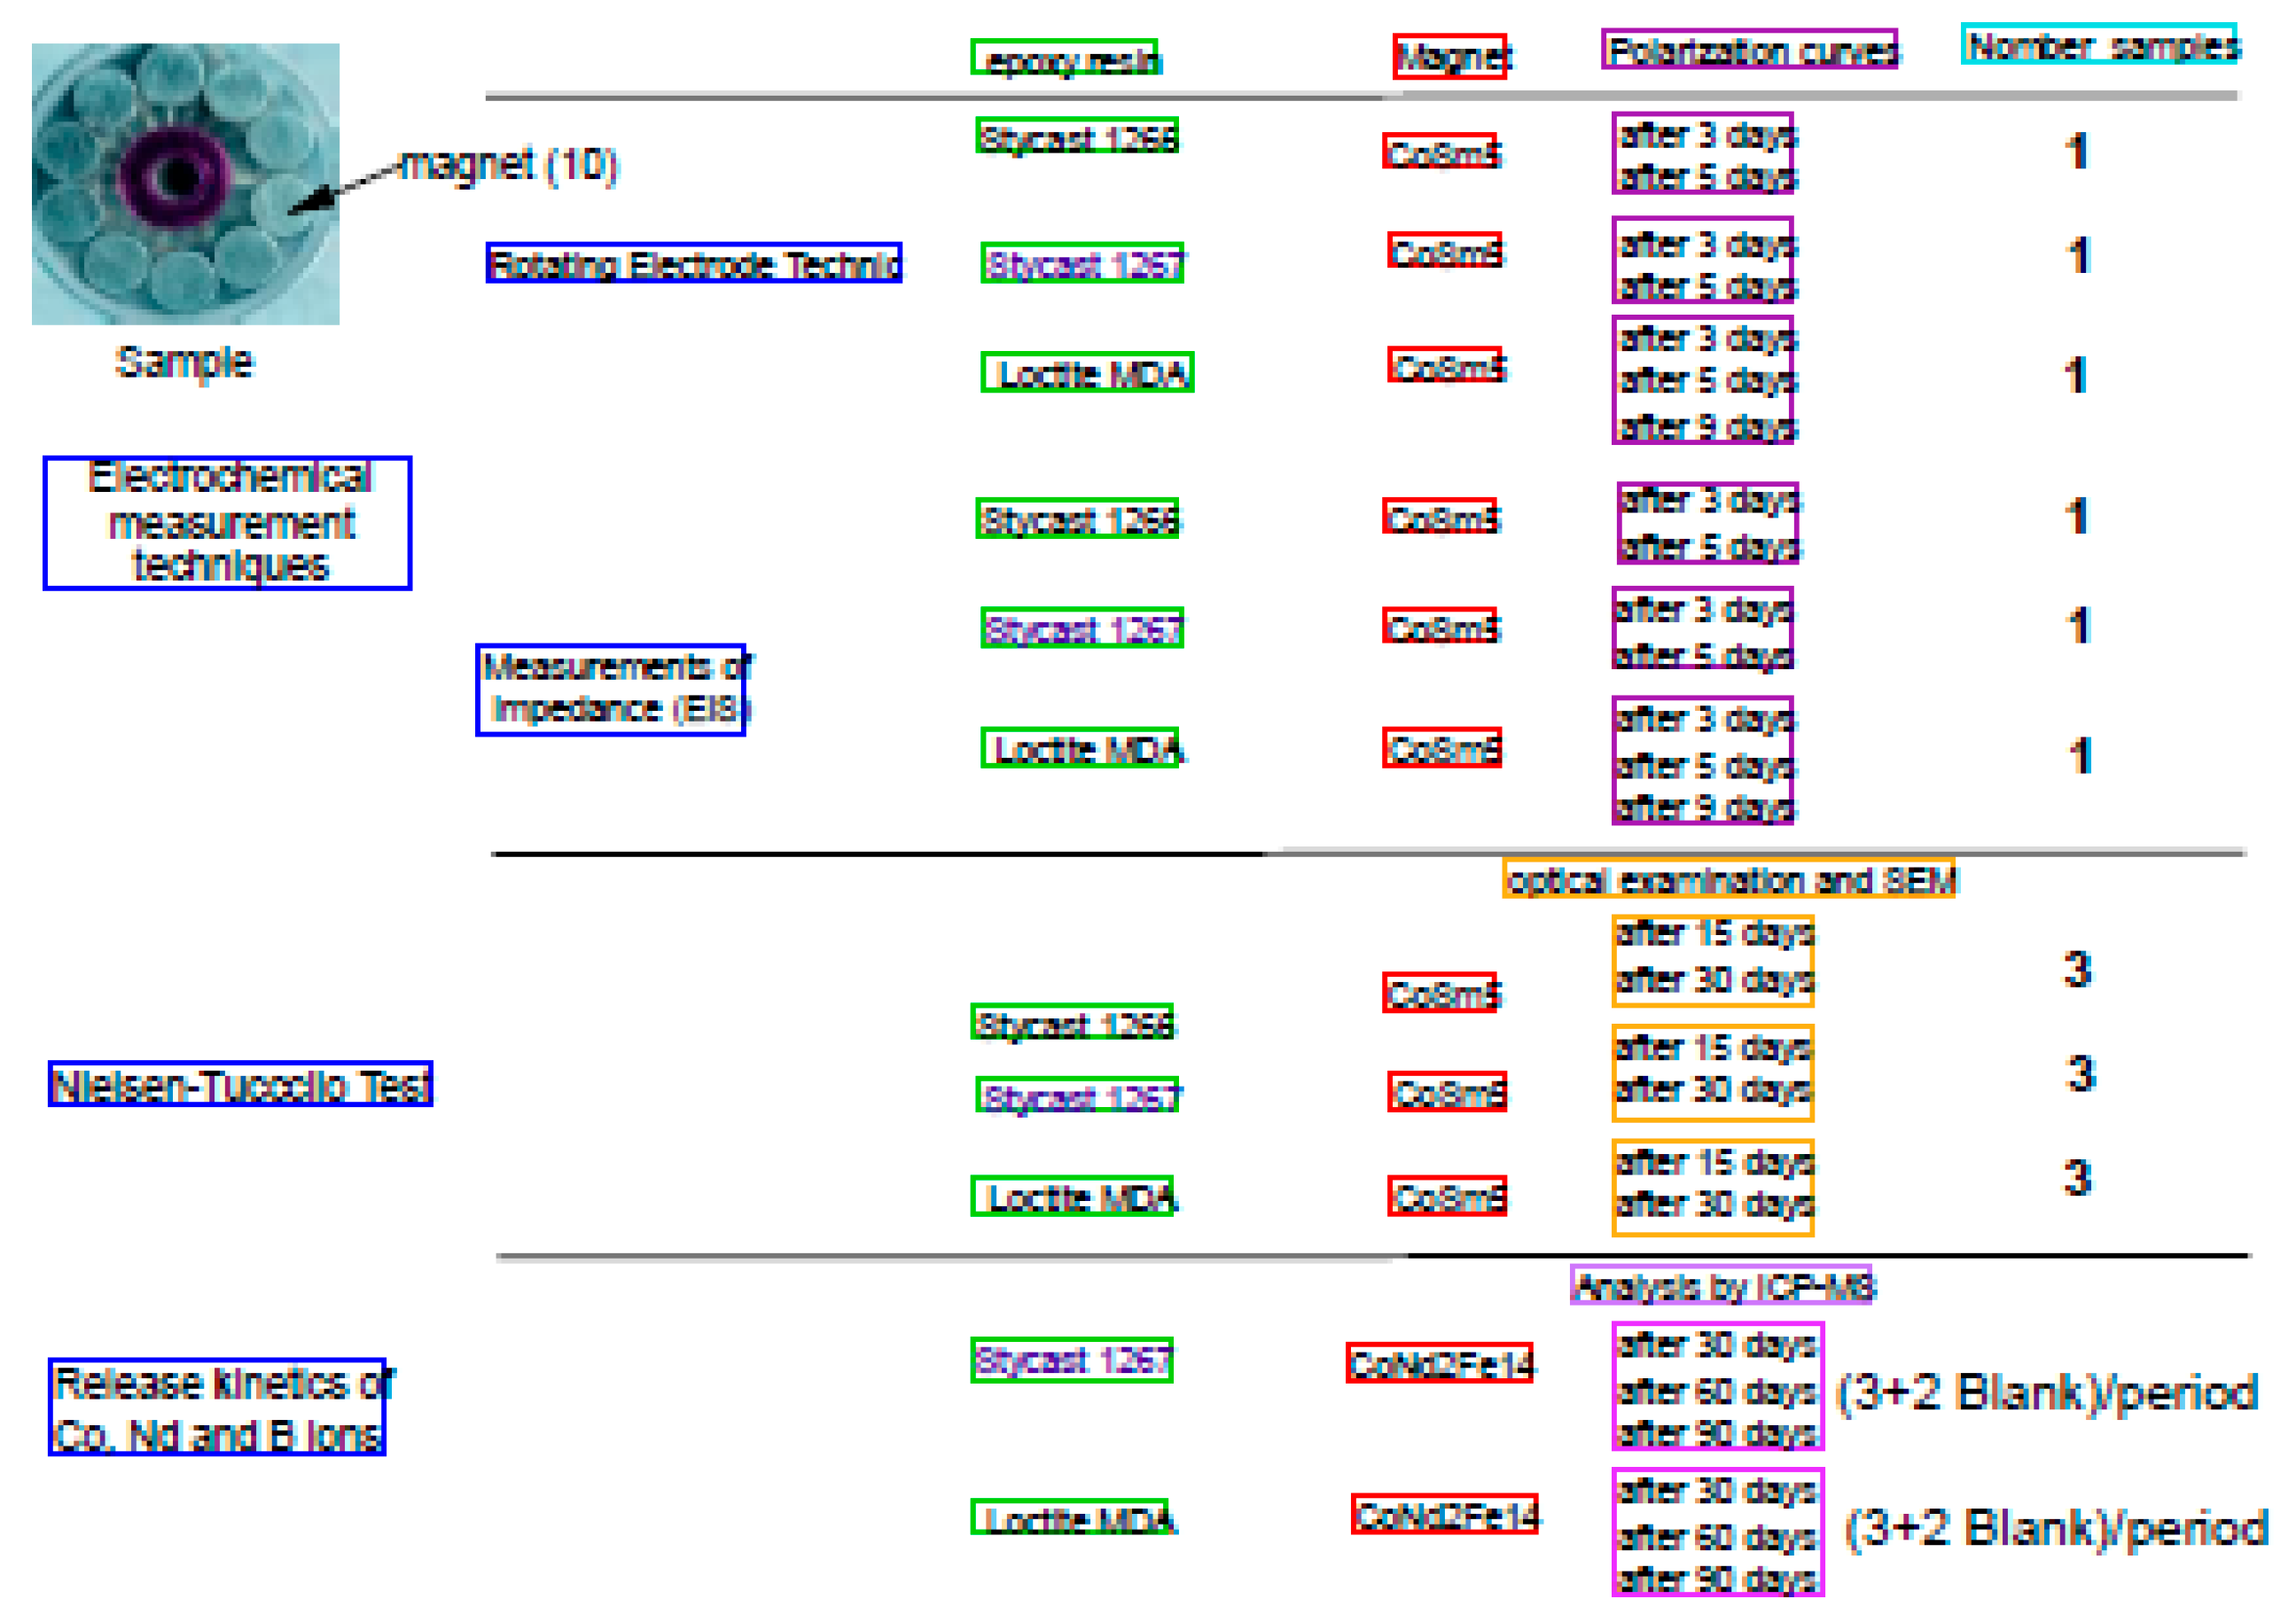
Figure 10.
Open circuit potential curves measured for the three types of resins used in the protection of CoSm5 magnets. After 3 days.
Figure 10.
Open circuit potential curves measured for the three types of resins used in the protection of CoSm5 magnets. After 3 days.
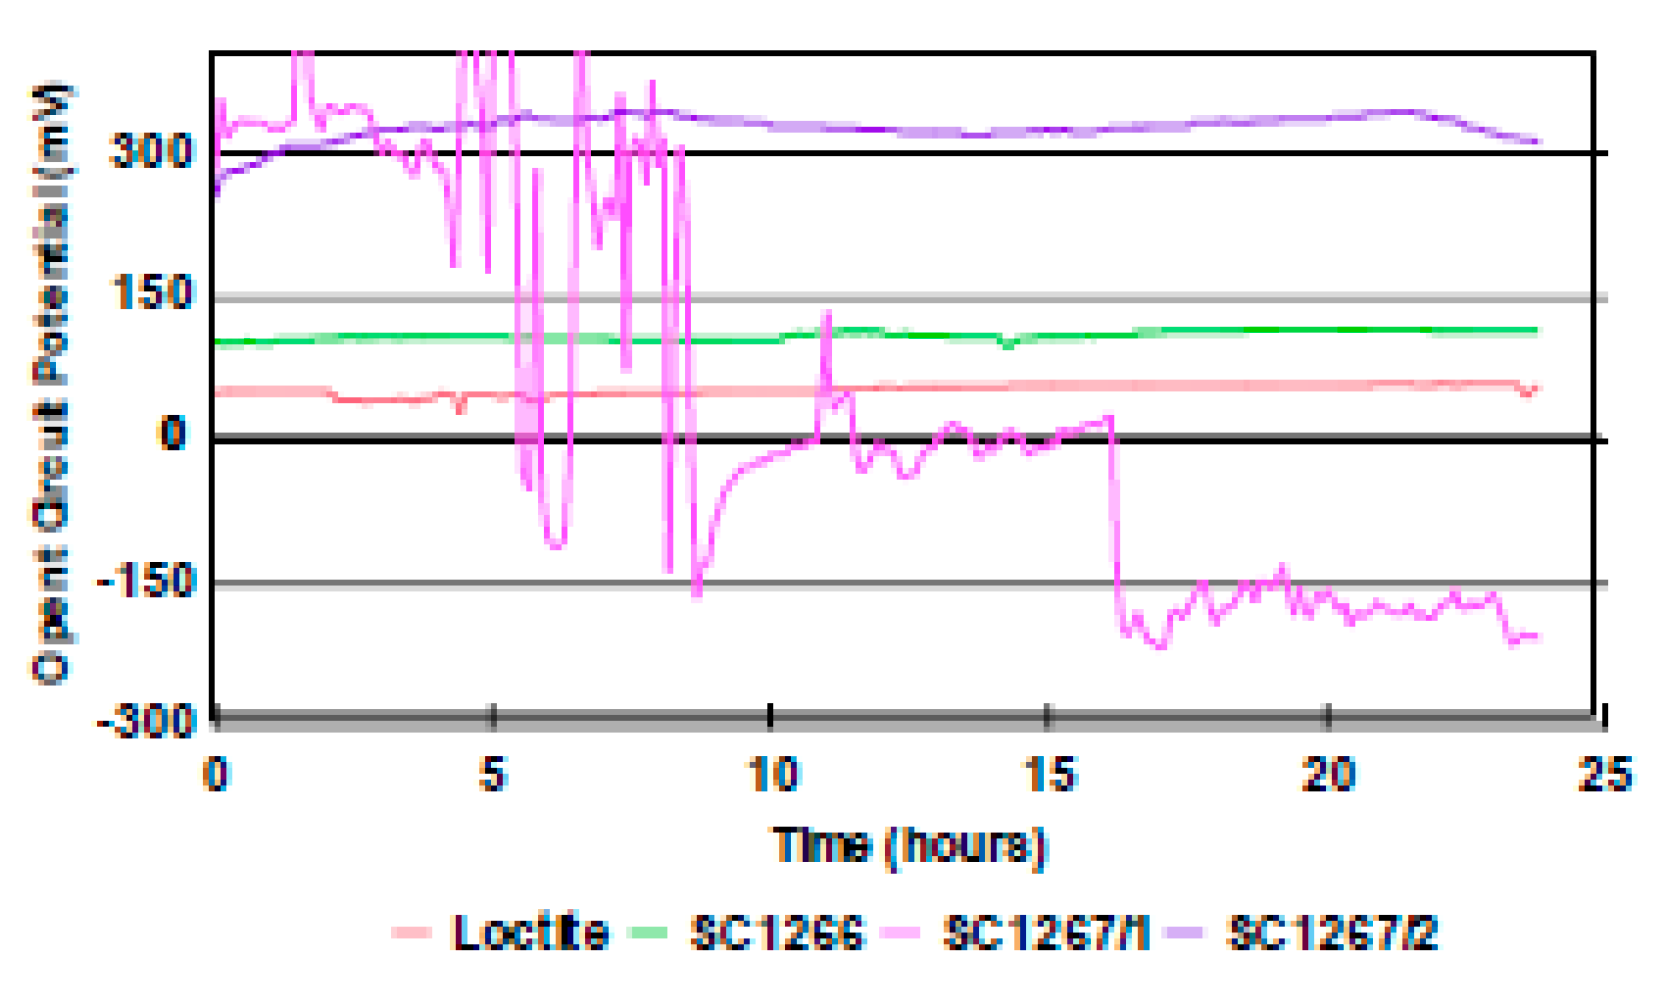
Figure 12.
Loctite. Optical image.
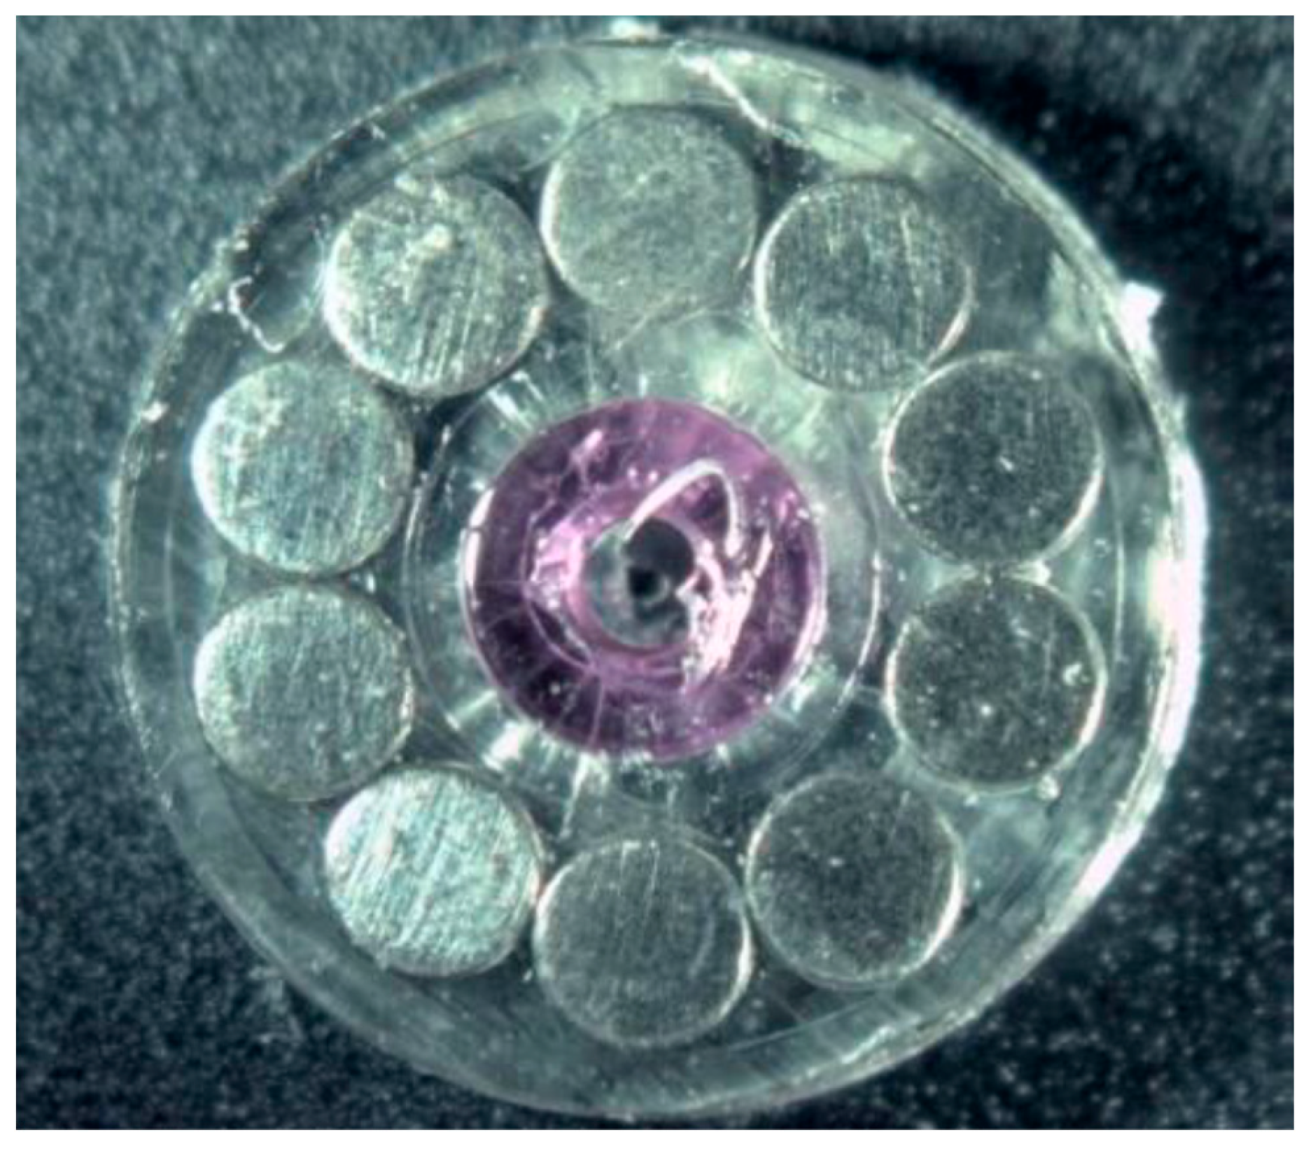
Figure 13.
Loctite. Optical image.
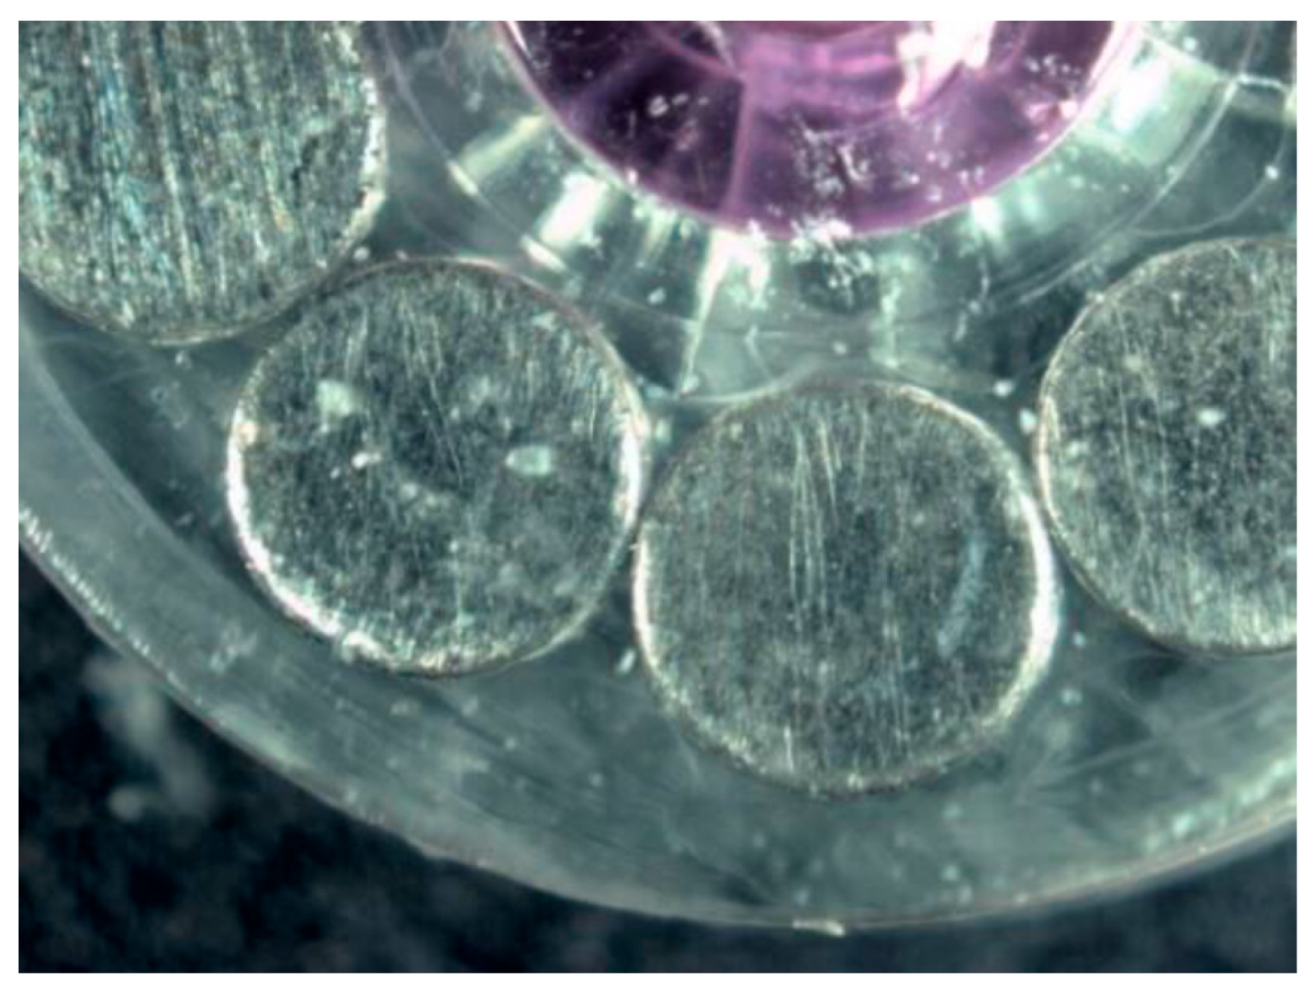
Figure 14.
StyCast 1267. Optical image.
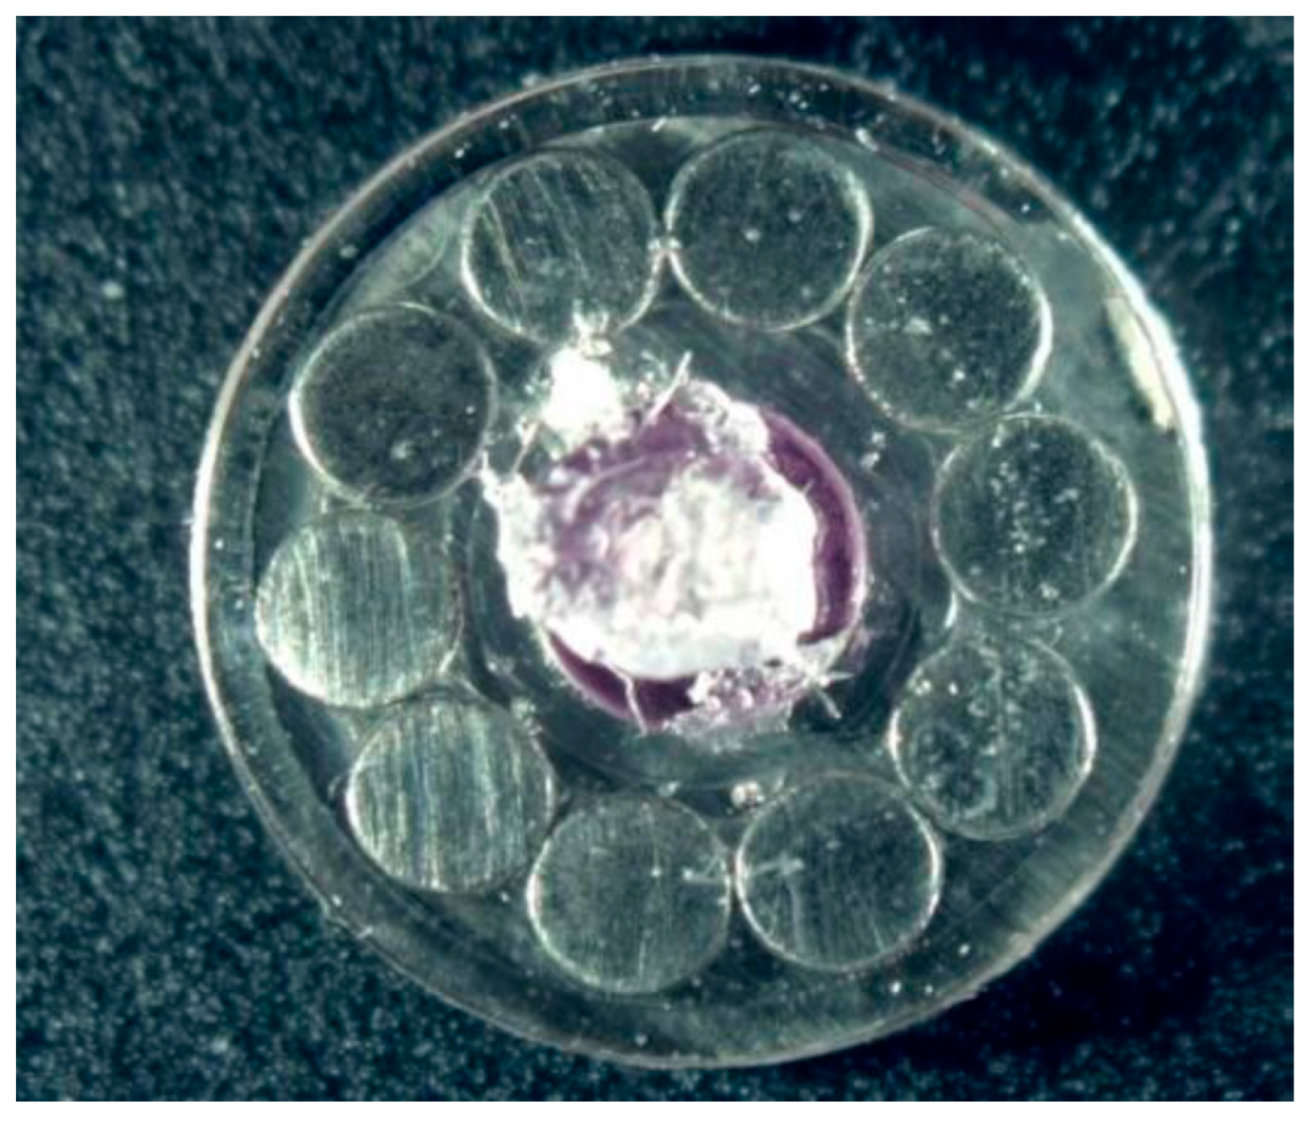
Figure 15.
StyCast 1267. Optical image.
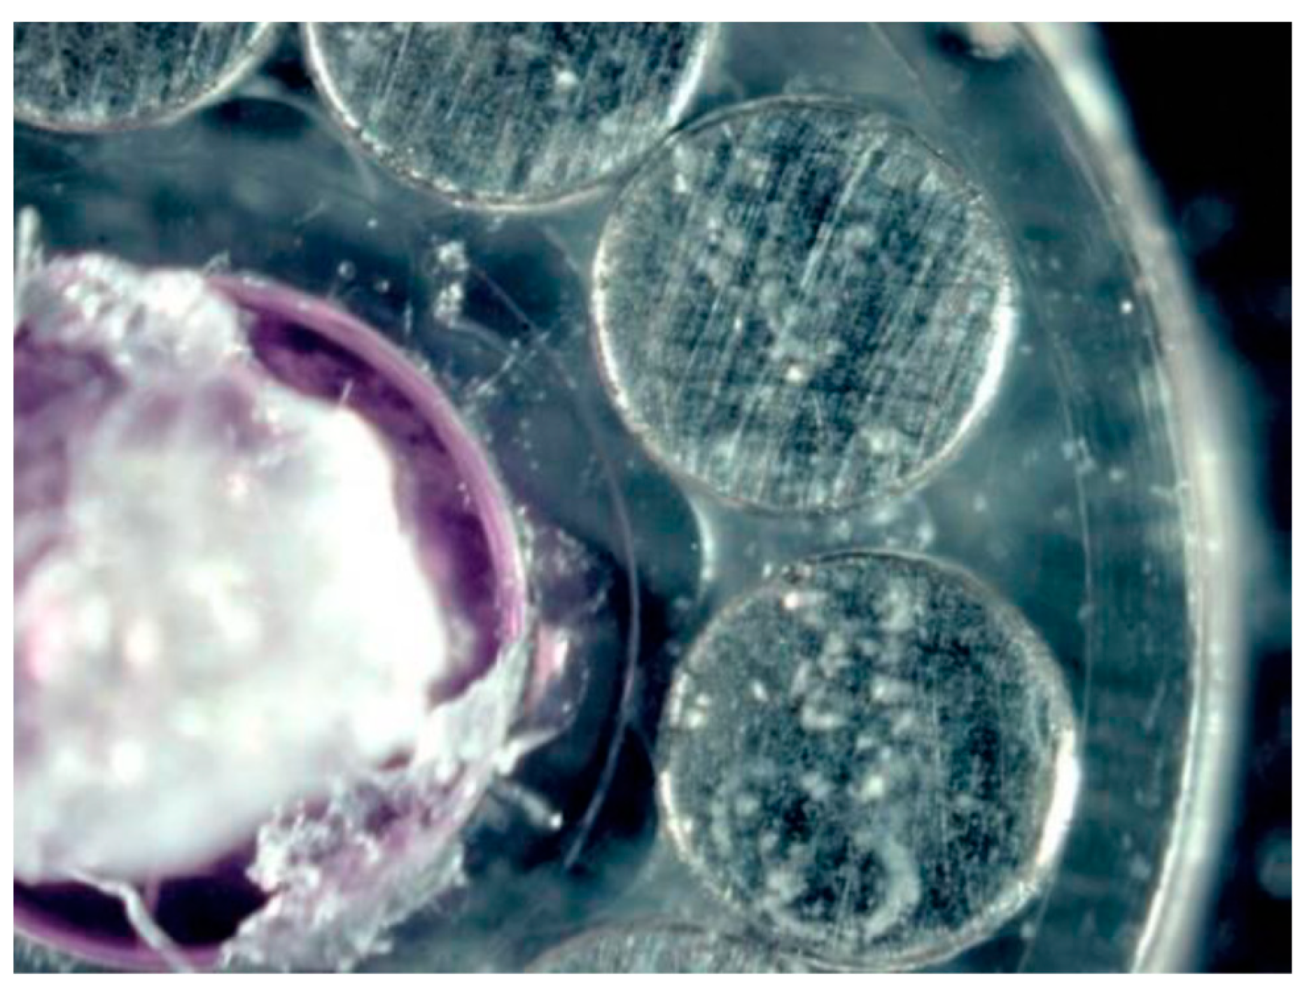
Figure 16.
StyCast 1266. Optical image.
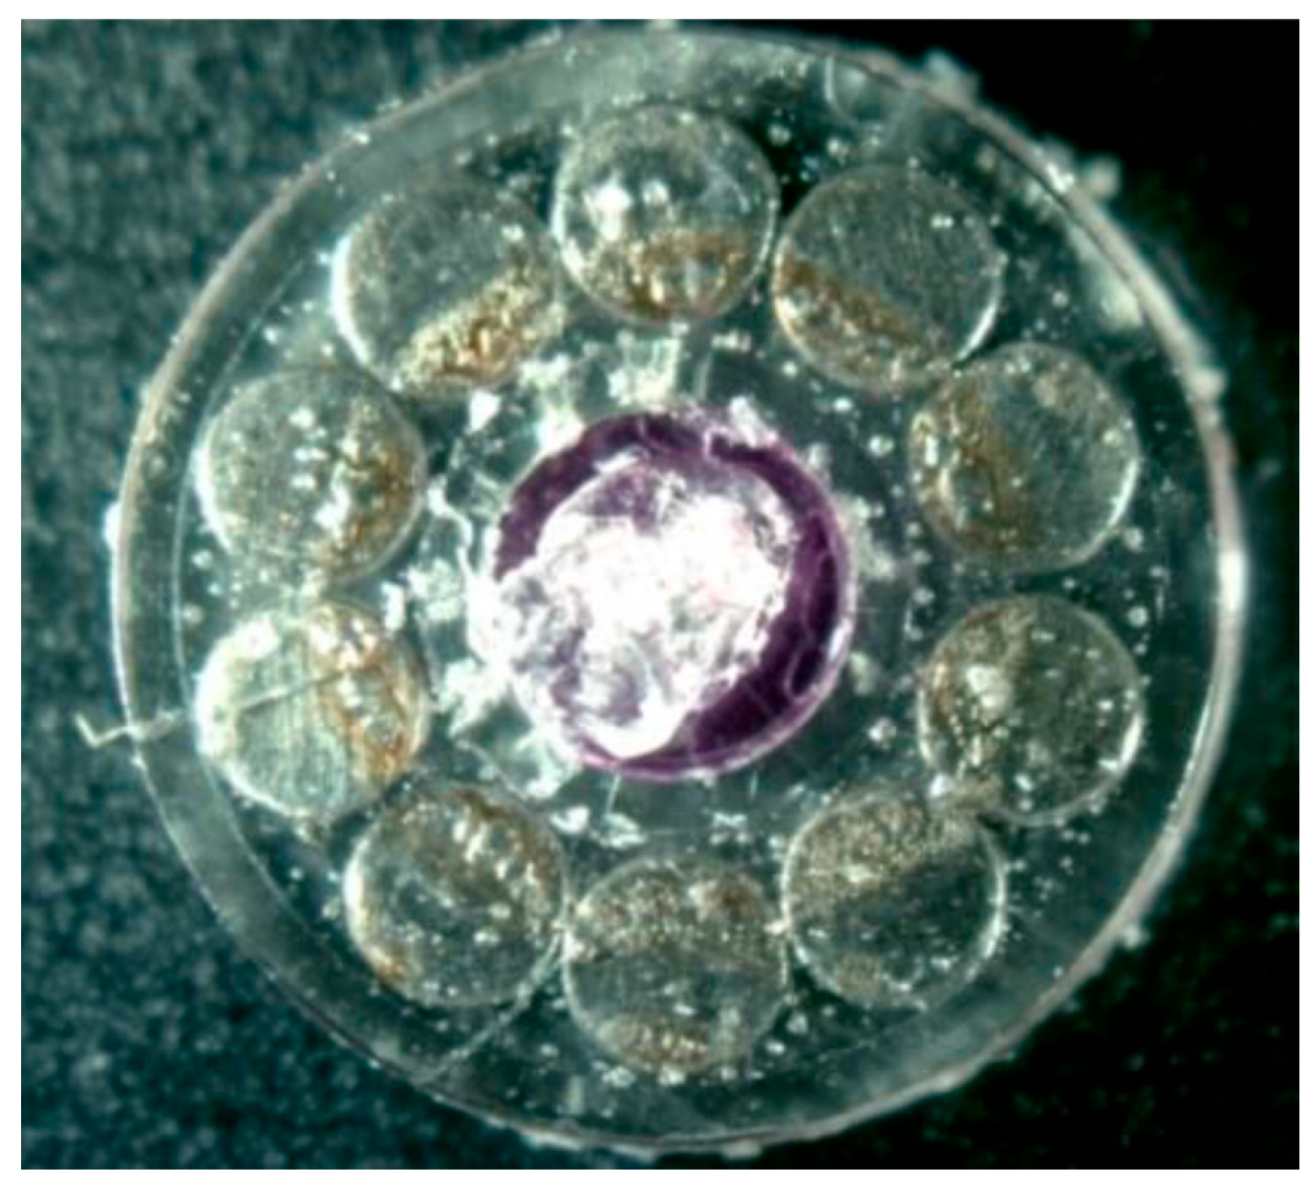
Figure 17.
StyCast 1266. Optical image.
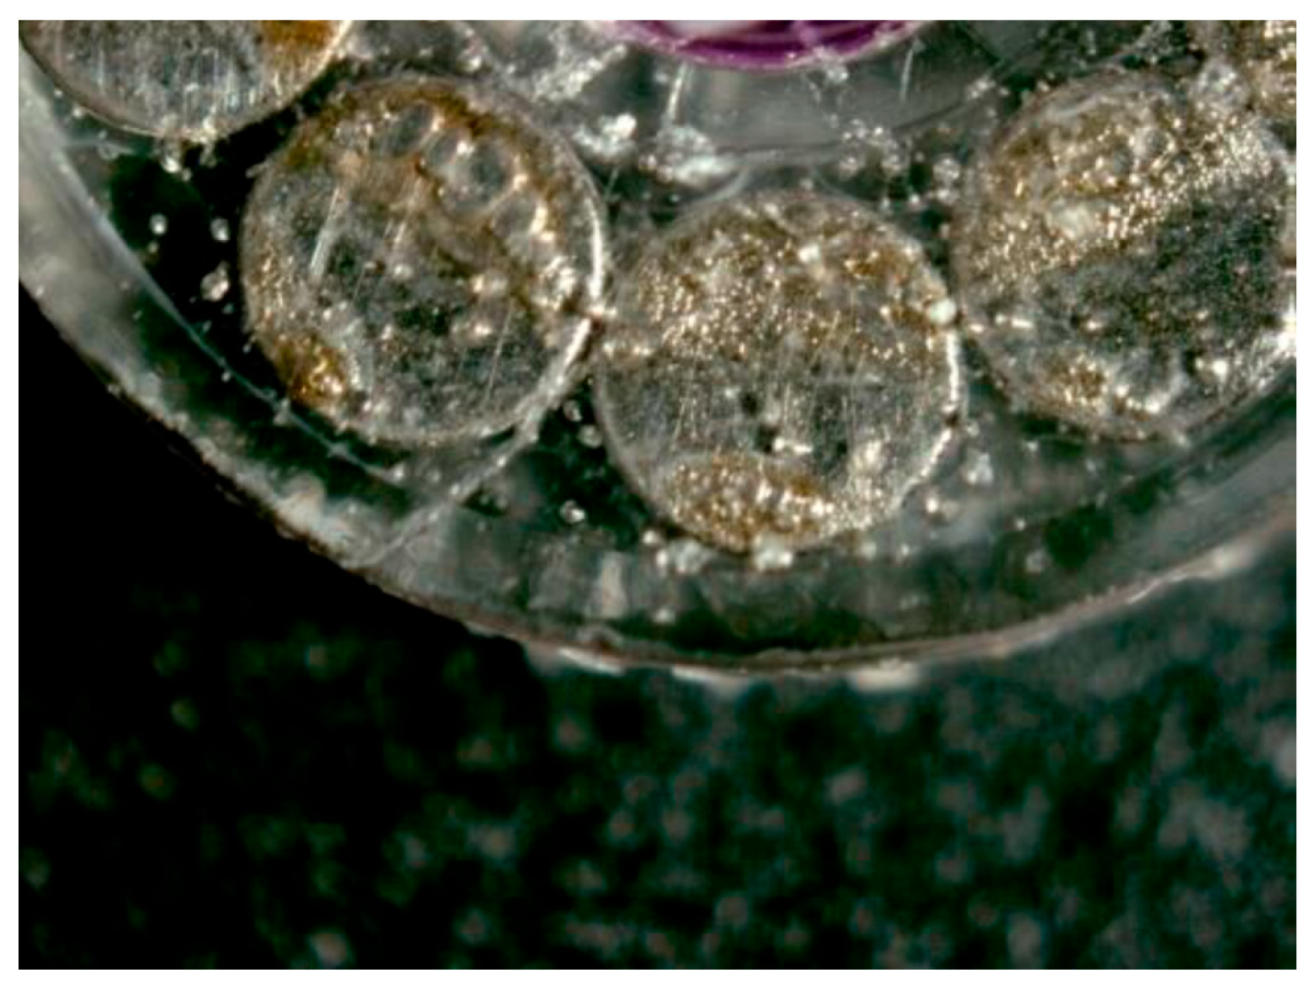
Figure 18.
Nyquist measurement diagrams for the Loctite polymer layer after 3 days, 5 days and 9 days of immersion.
Figure 18.
Nyquist measurement diagrams for the Loctite polymer layer after 3 days, 5 days and 9 days of immersion.
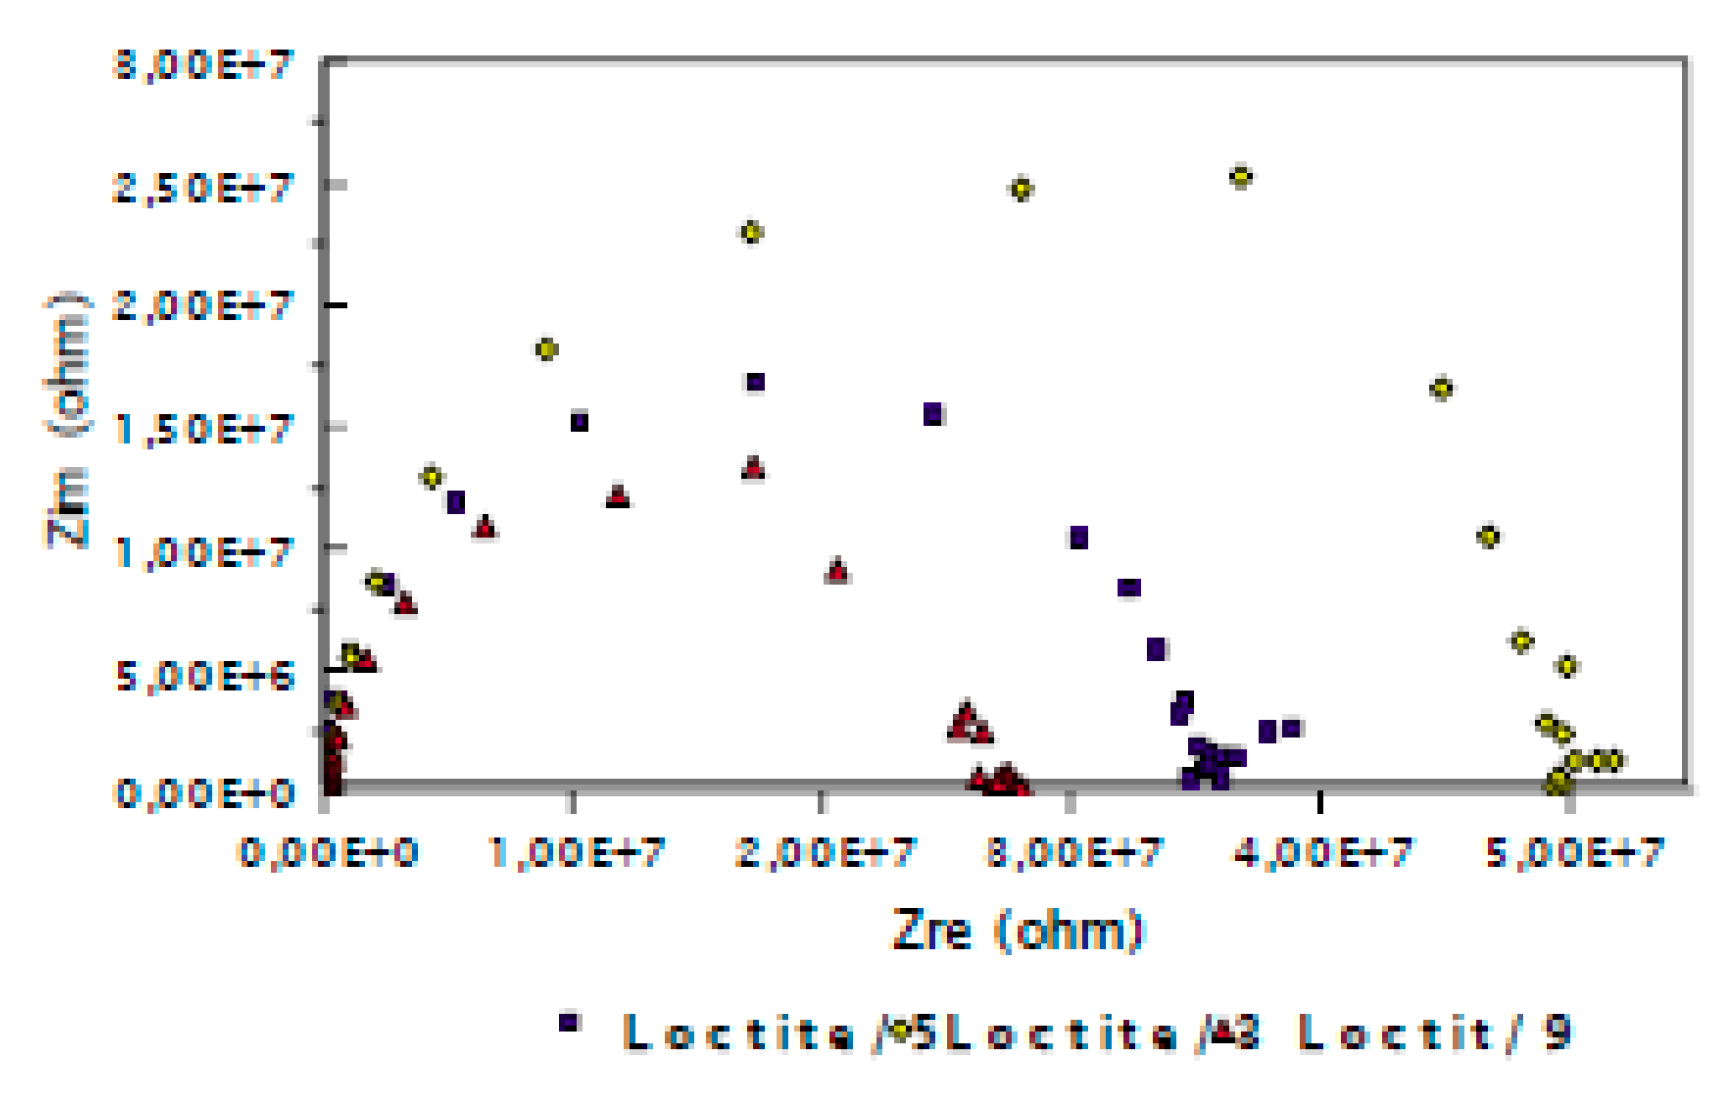
Figure 19.
Nyquist diagram measured for the Loctite, Stycast 1266 and Stycast 1267 coating layers after three days of immersion.
Figure 19.
Nyquist diagram measured for the Loctite, Stycast 1266 and Stycast 1267 coating layers after three days of immersion.
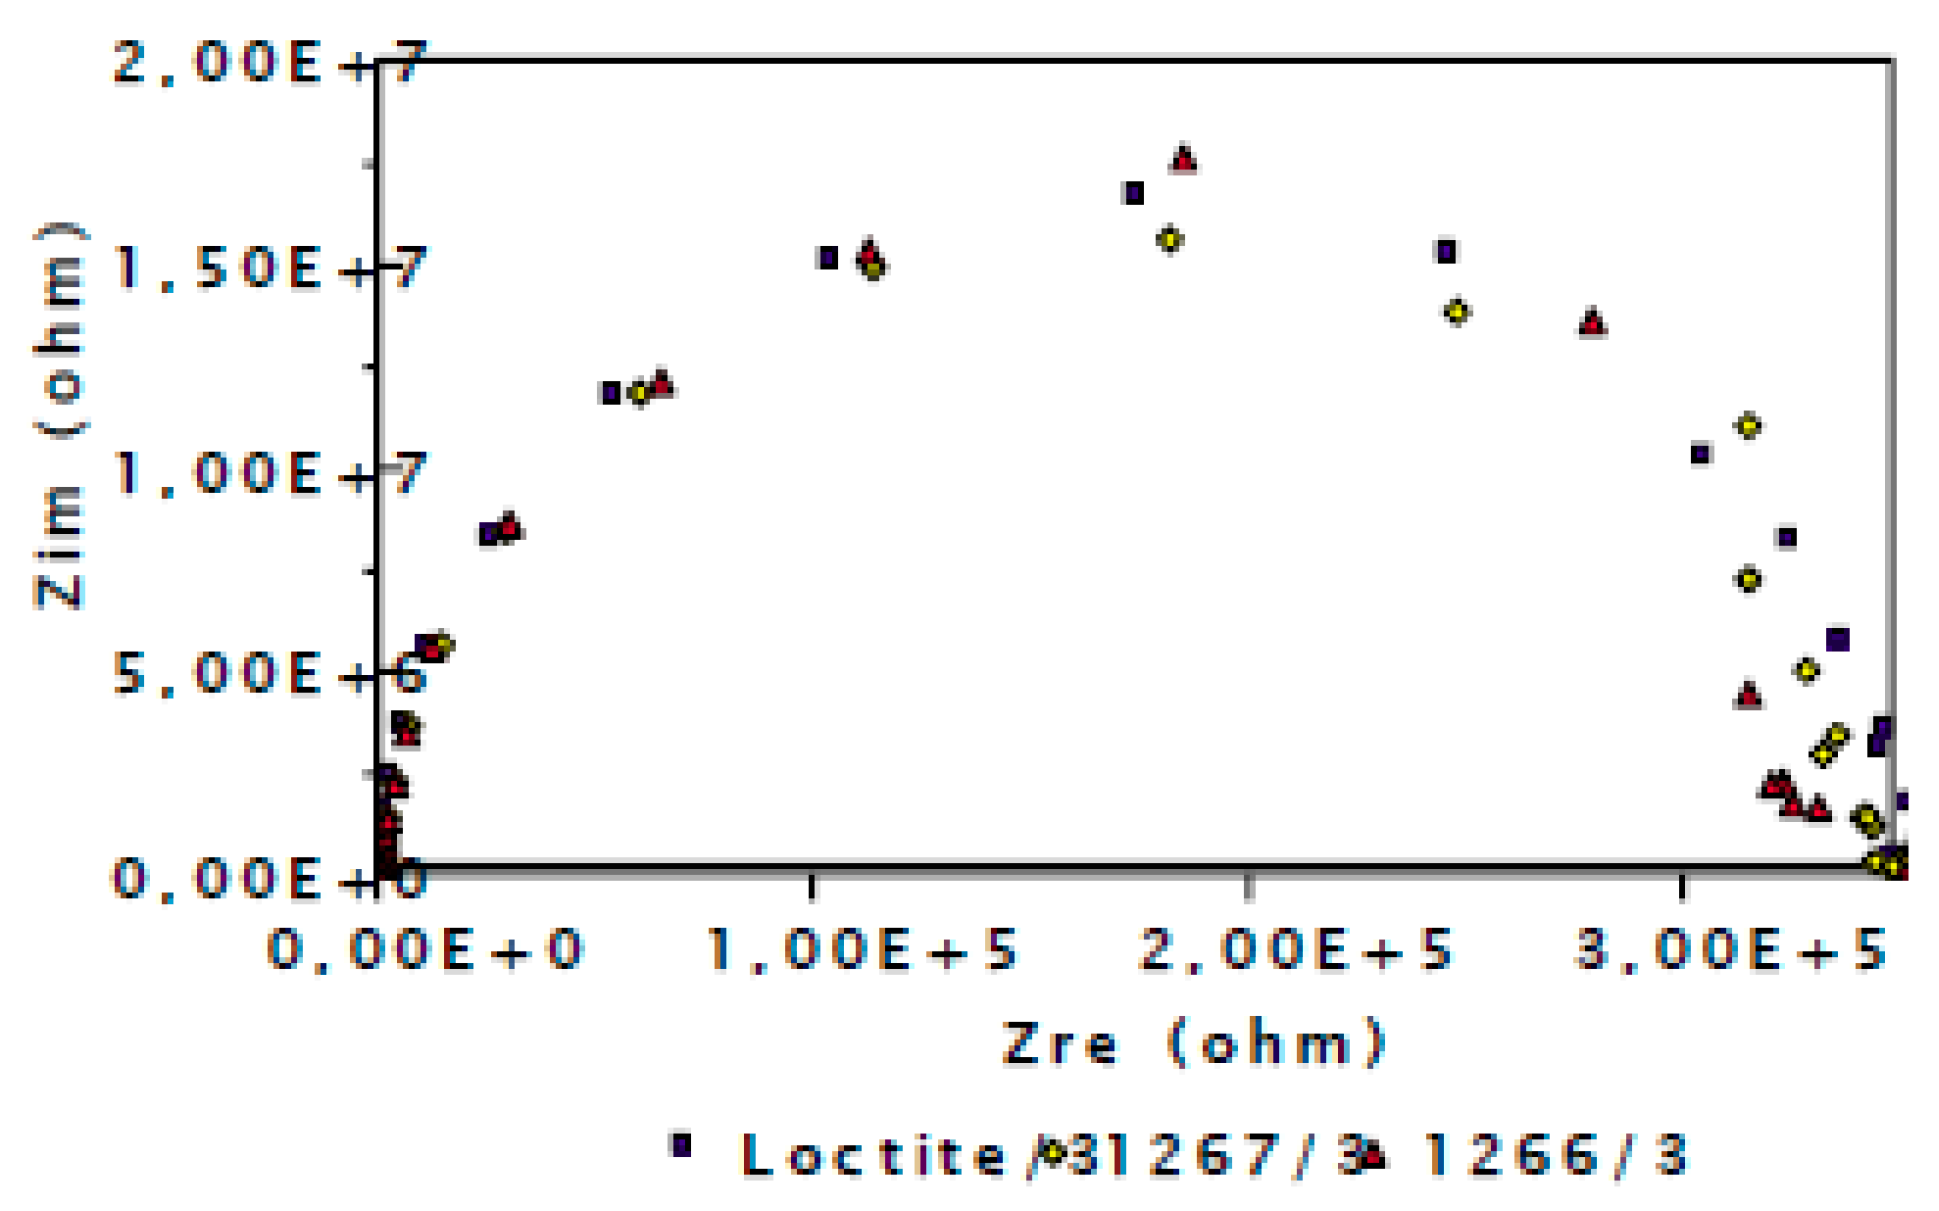
Figure 20.
Nyquist diagram measured for the Loctite, Stycast 1266 and Stycast 1267 coating layers after five days of immersion.
Figure 20.
Nyquist diagram measured for the Loctite, Stycast 1266 and Stycast 1267 coating layers after five days of immersion.
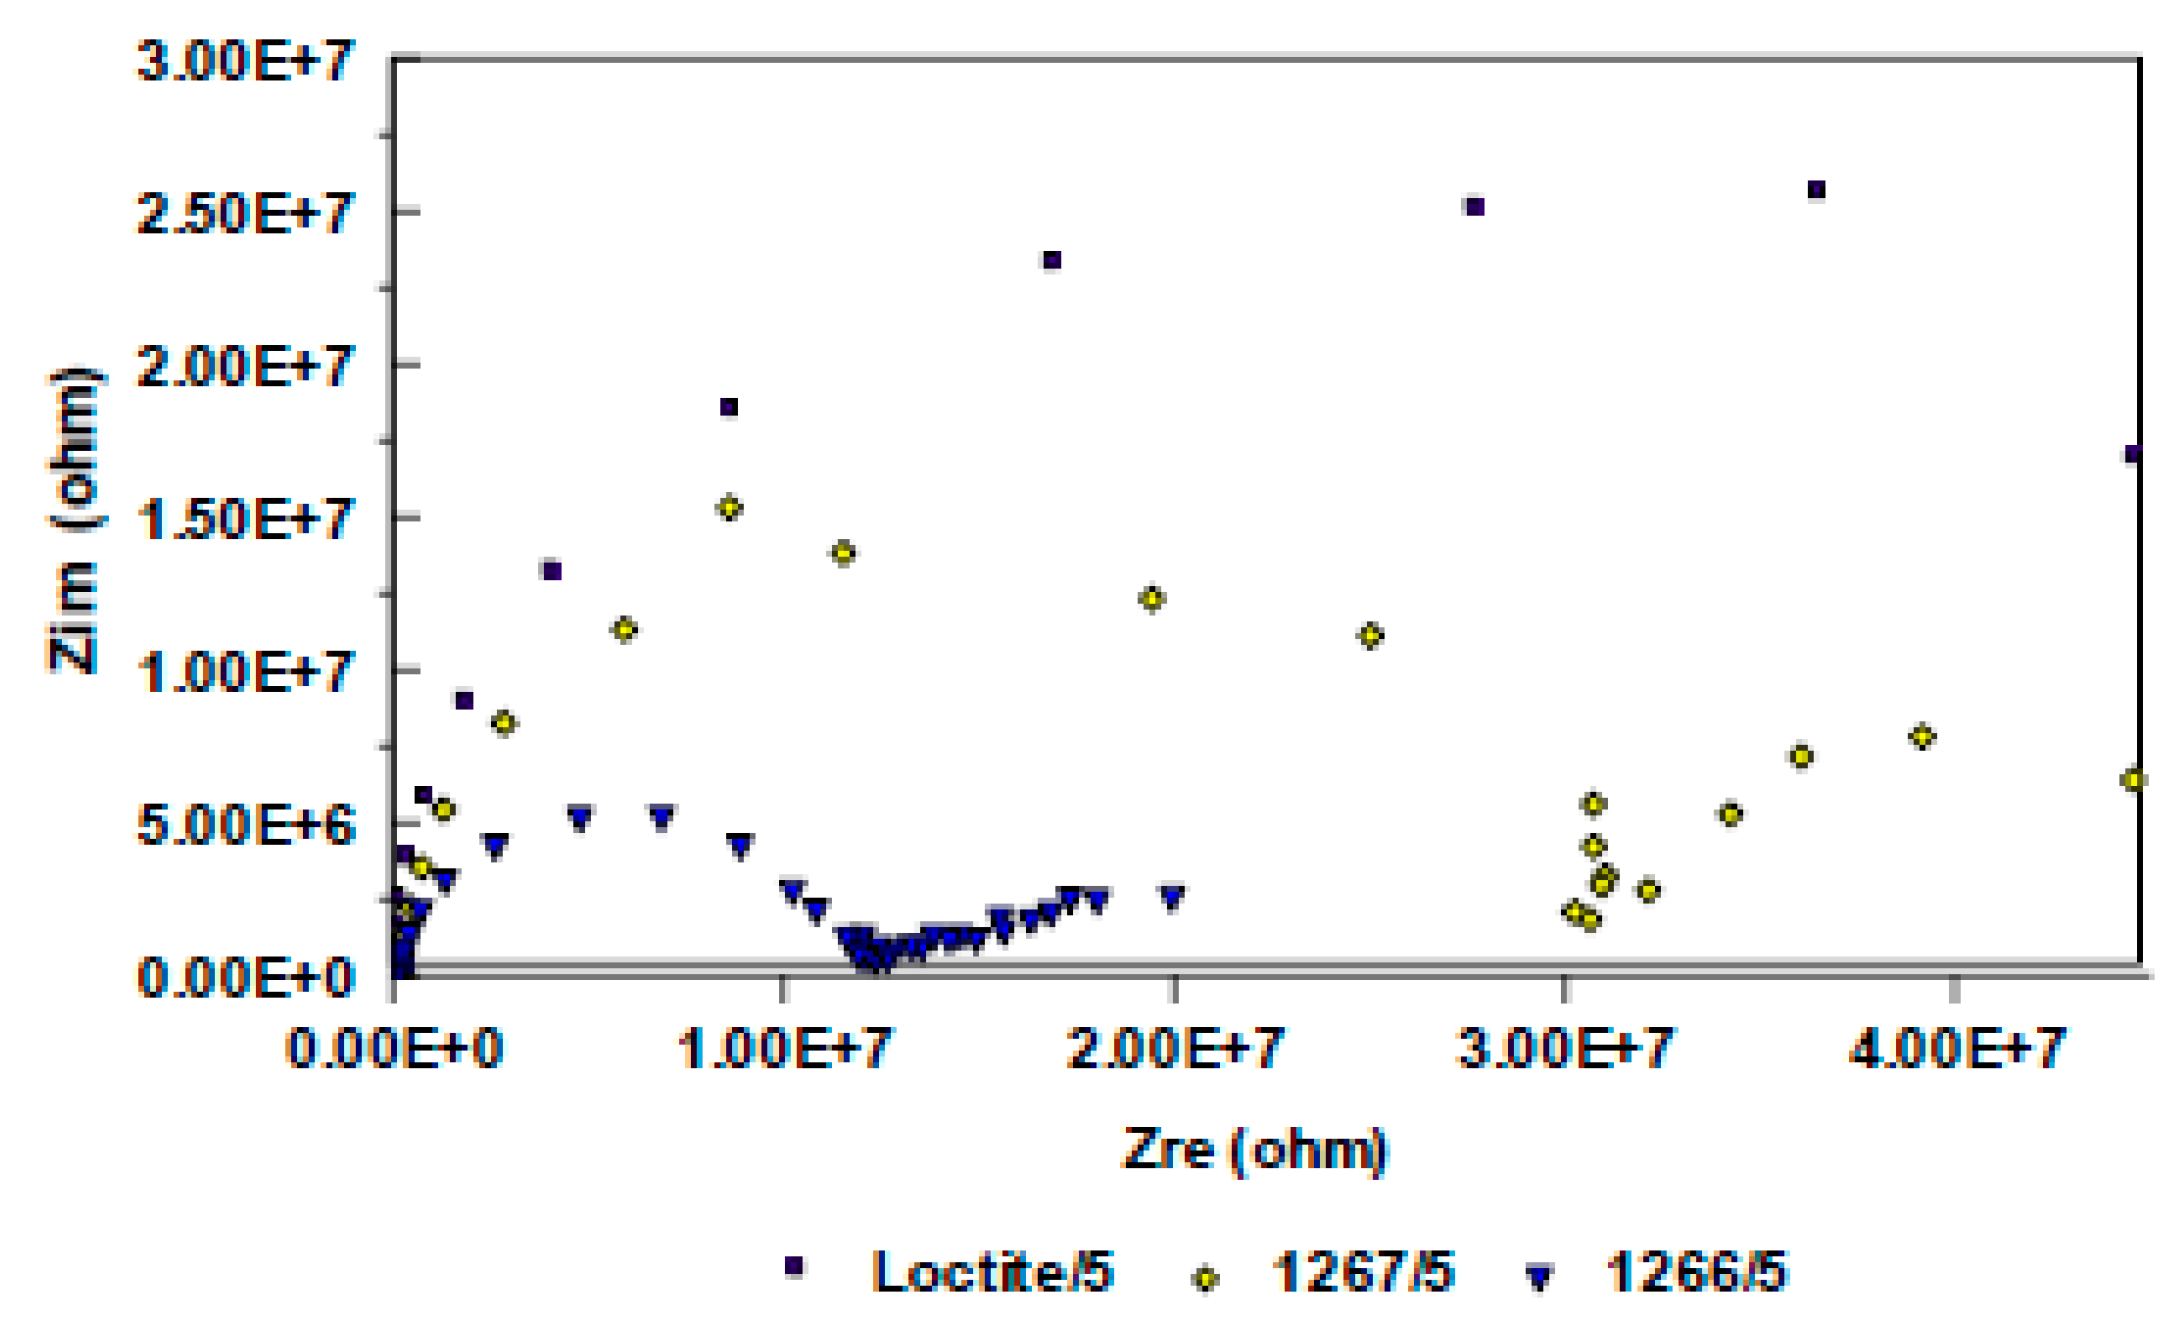
Figure 21.
Loctite. Optical image.
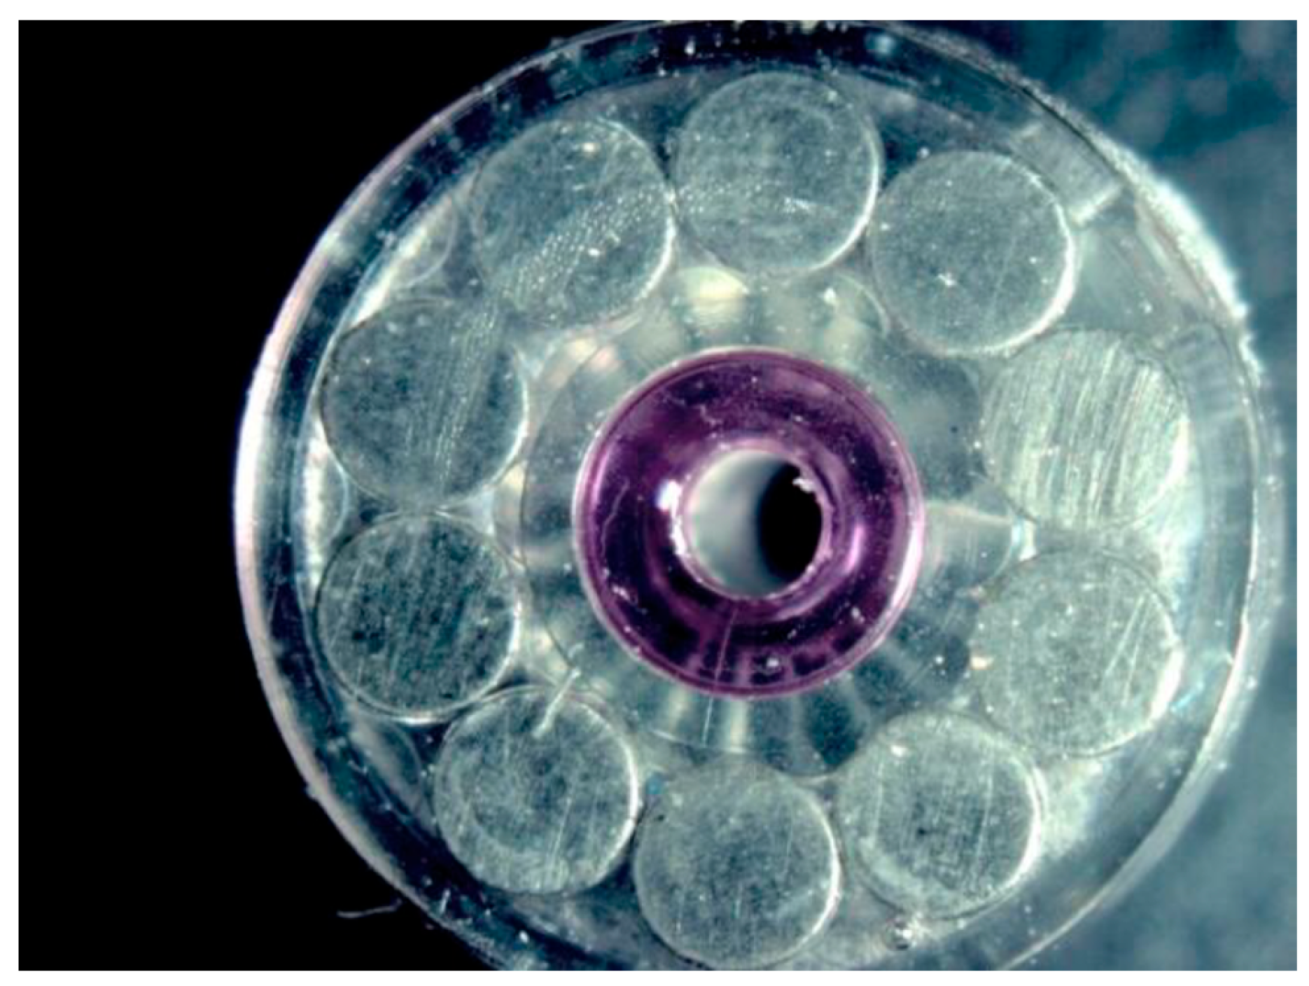
Figure 22.
Loctite. Optical image.
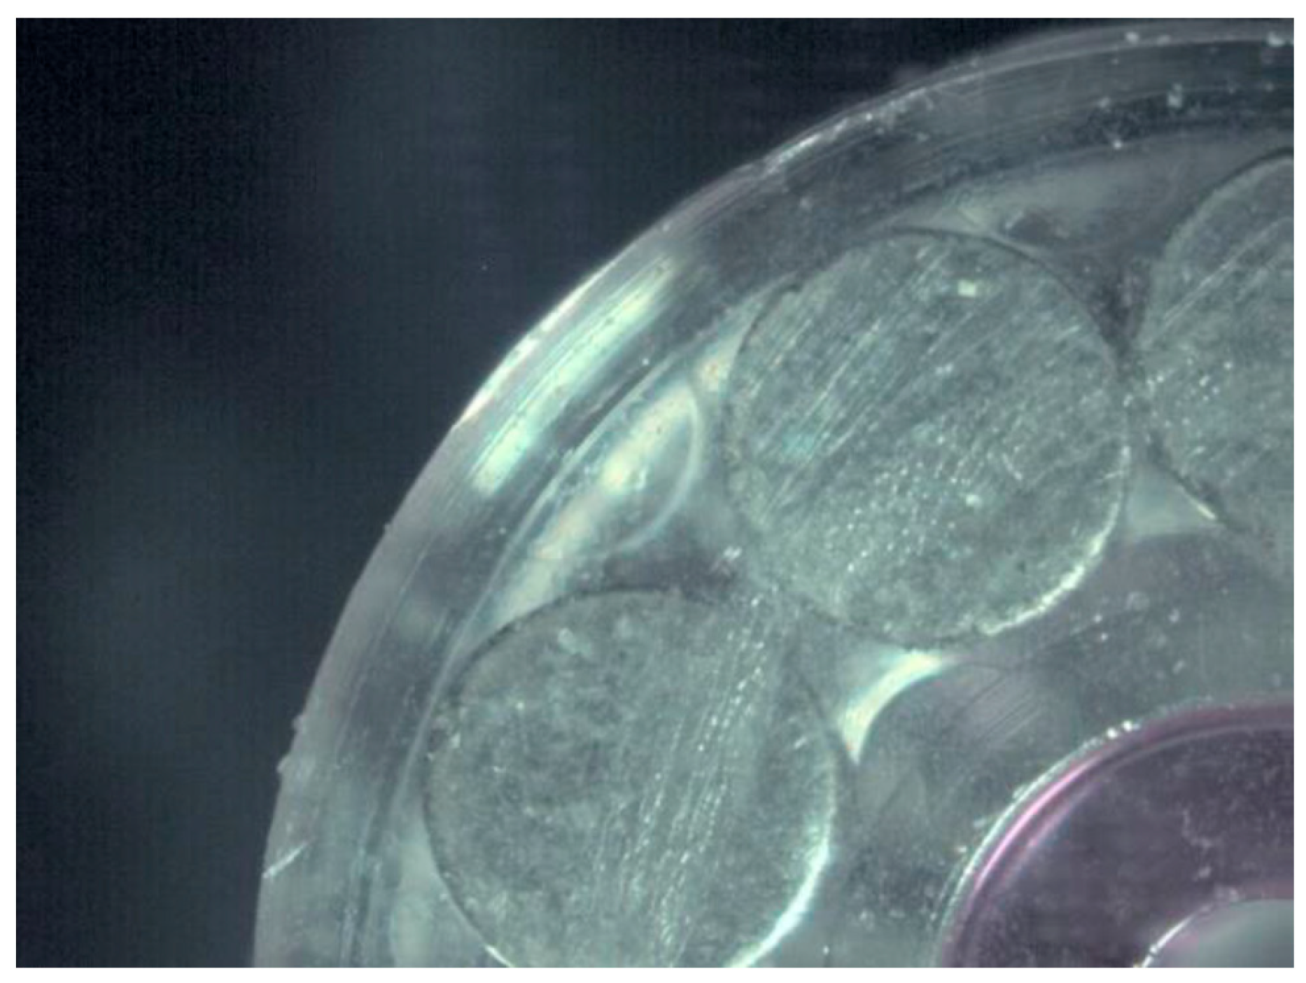
Figure 23.
Stacast 1267. Optical image.
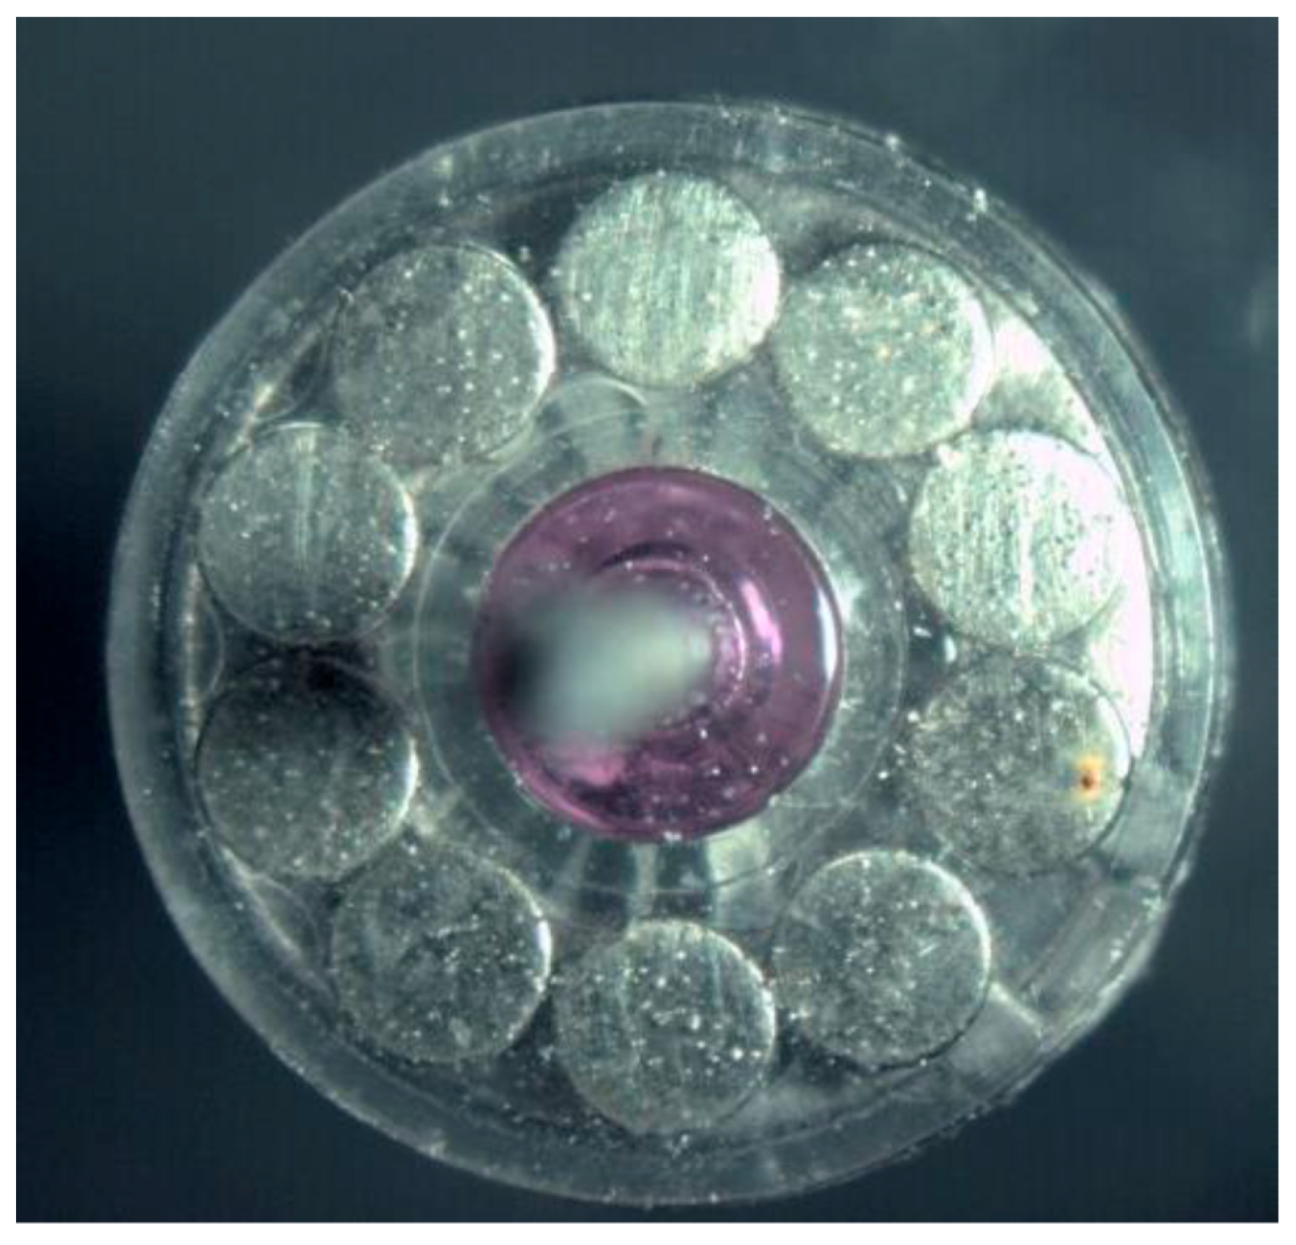
Figure 24.
Stycast 1267. Optical image.
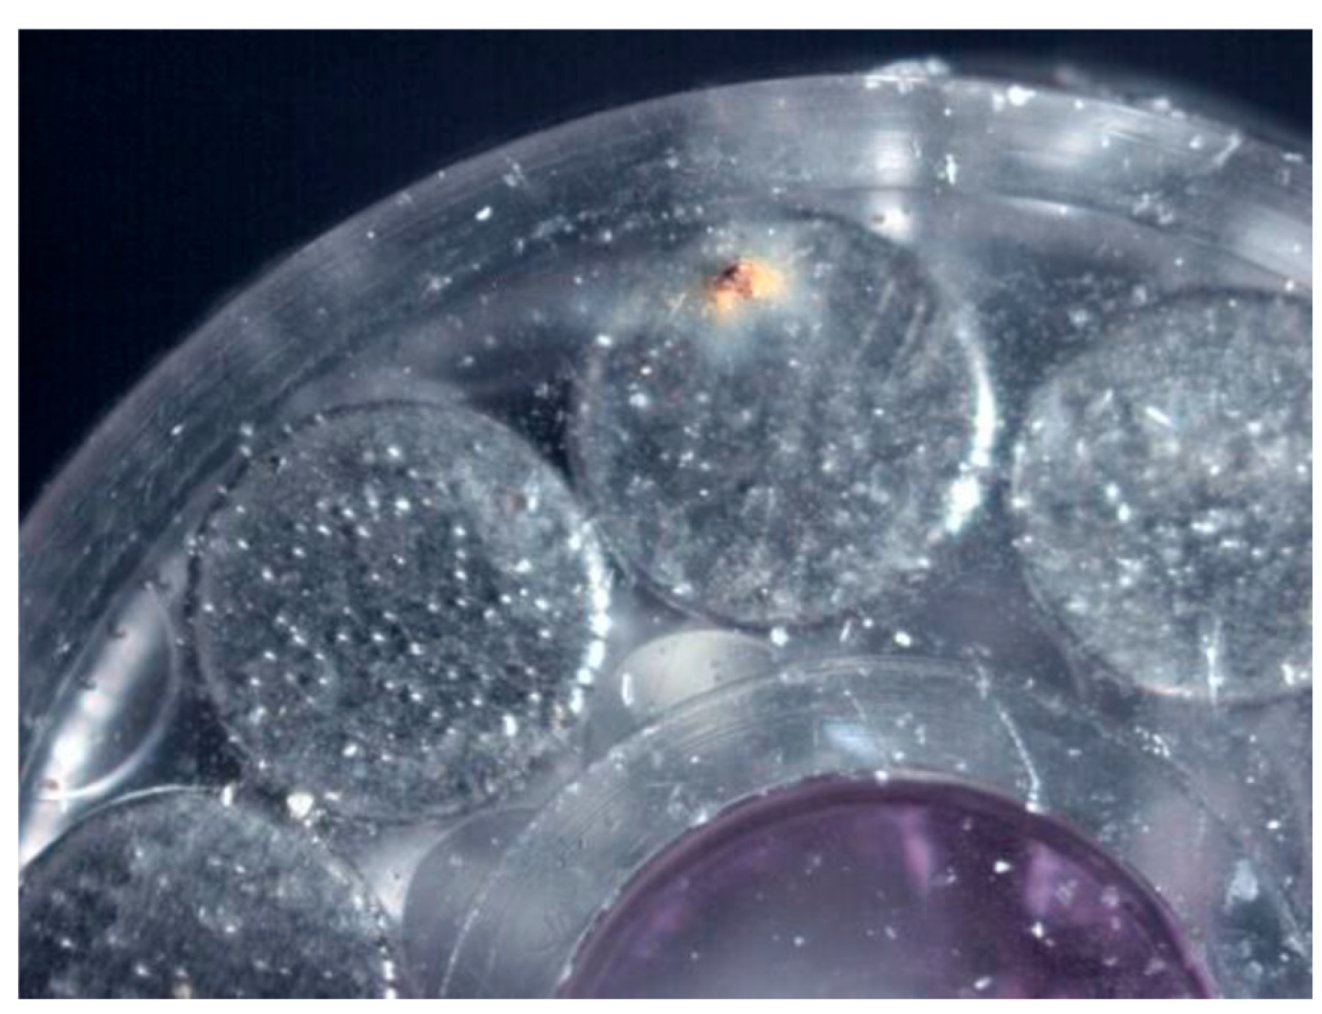
Figure 25.
Stycast 1266. Optical image.
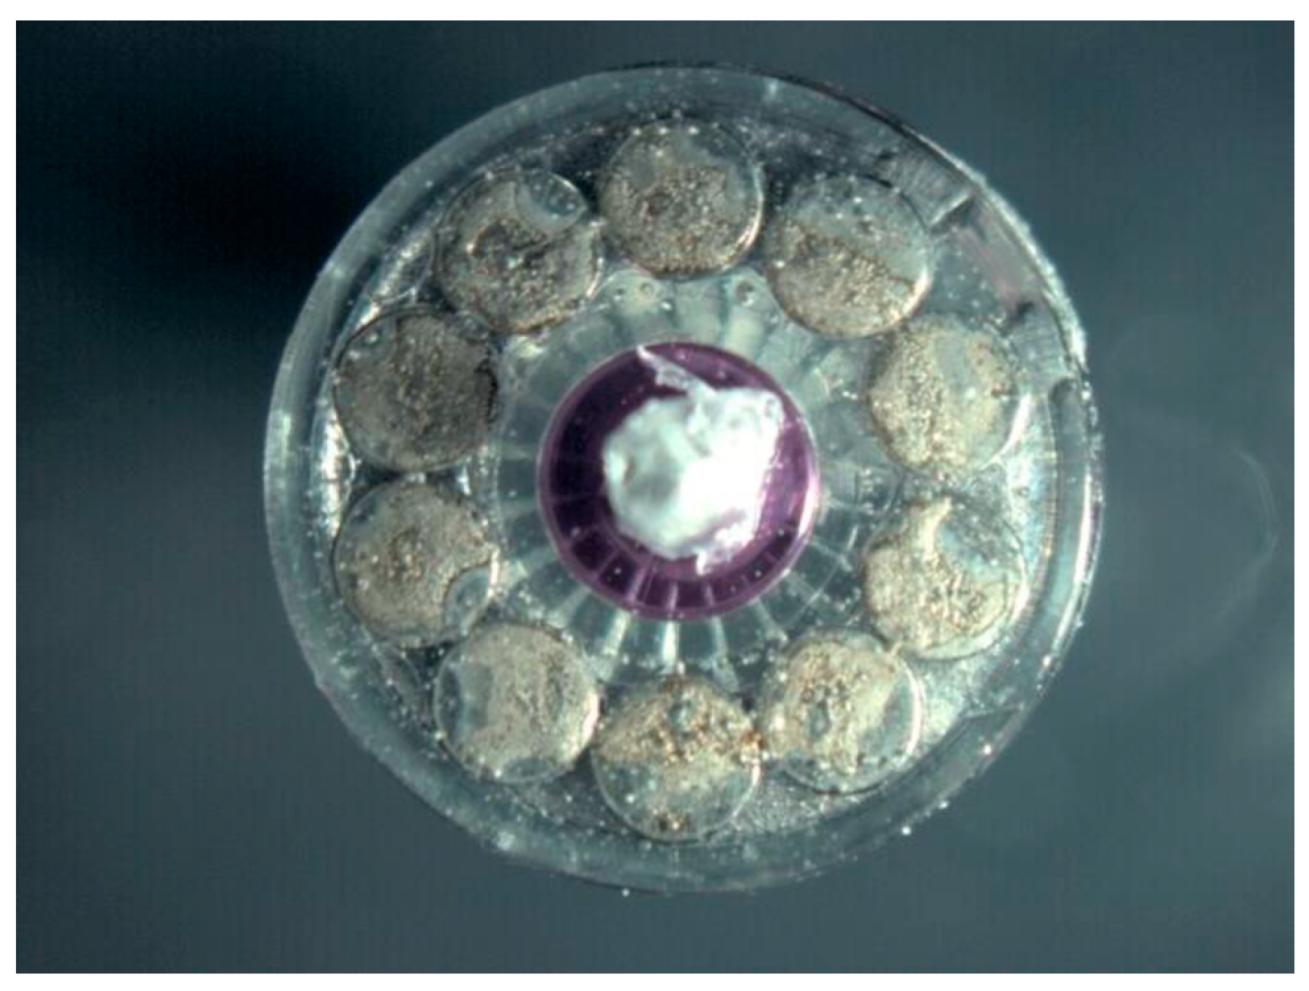
Figure 26.
Stycast 1266. Optical image.
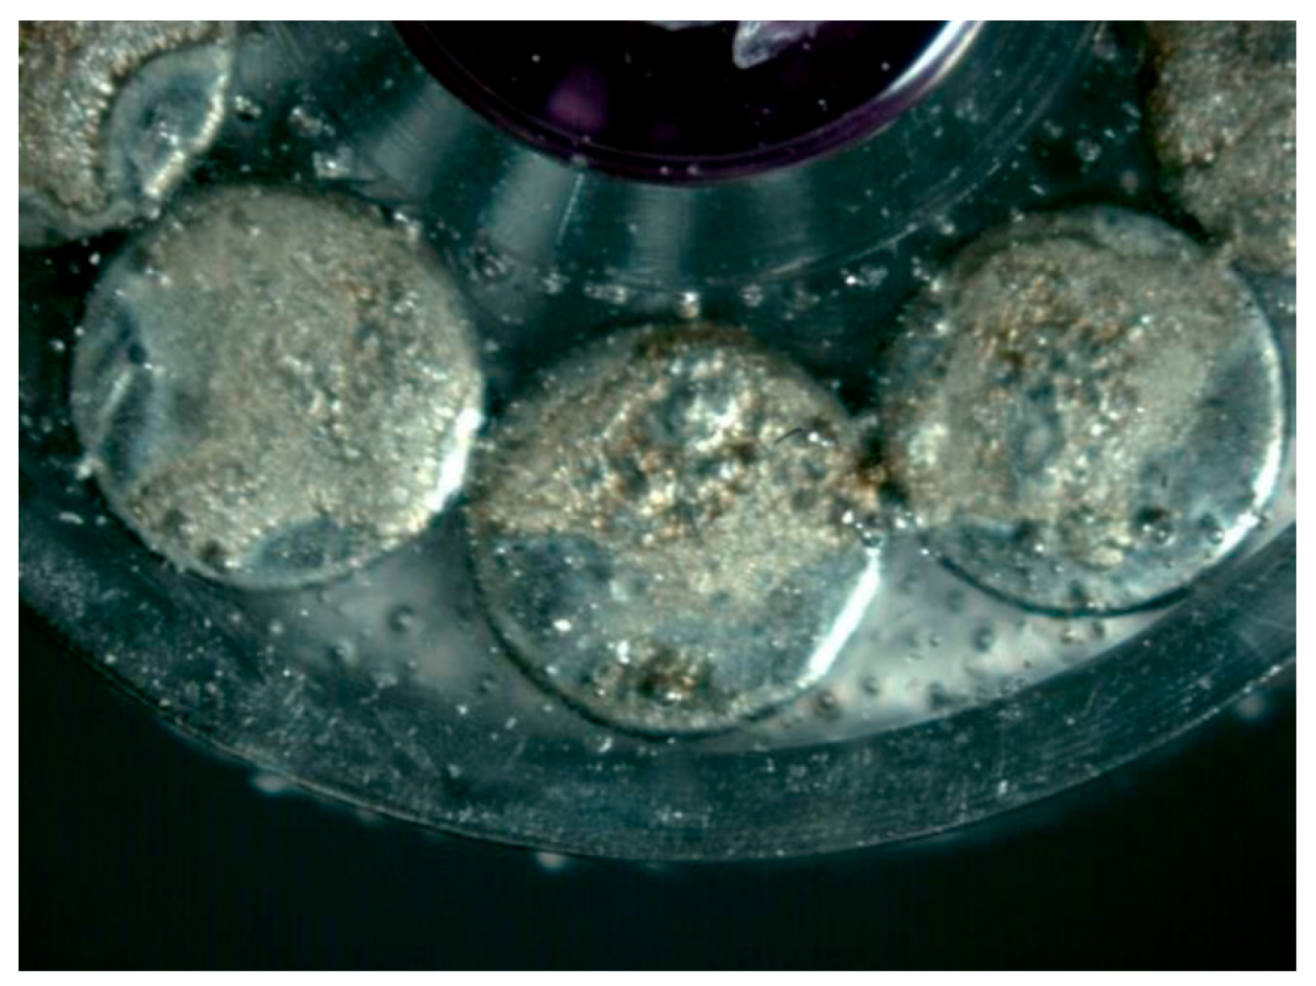
Figure 27.
Release of cobalt.
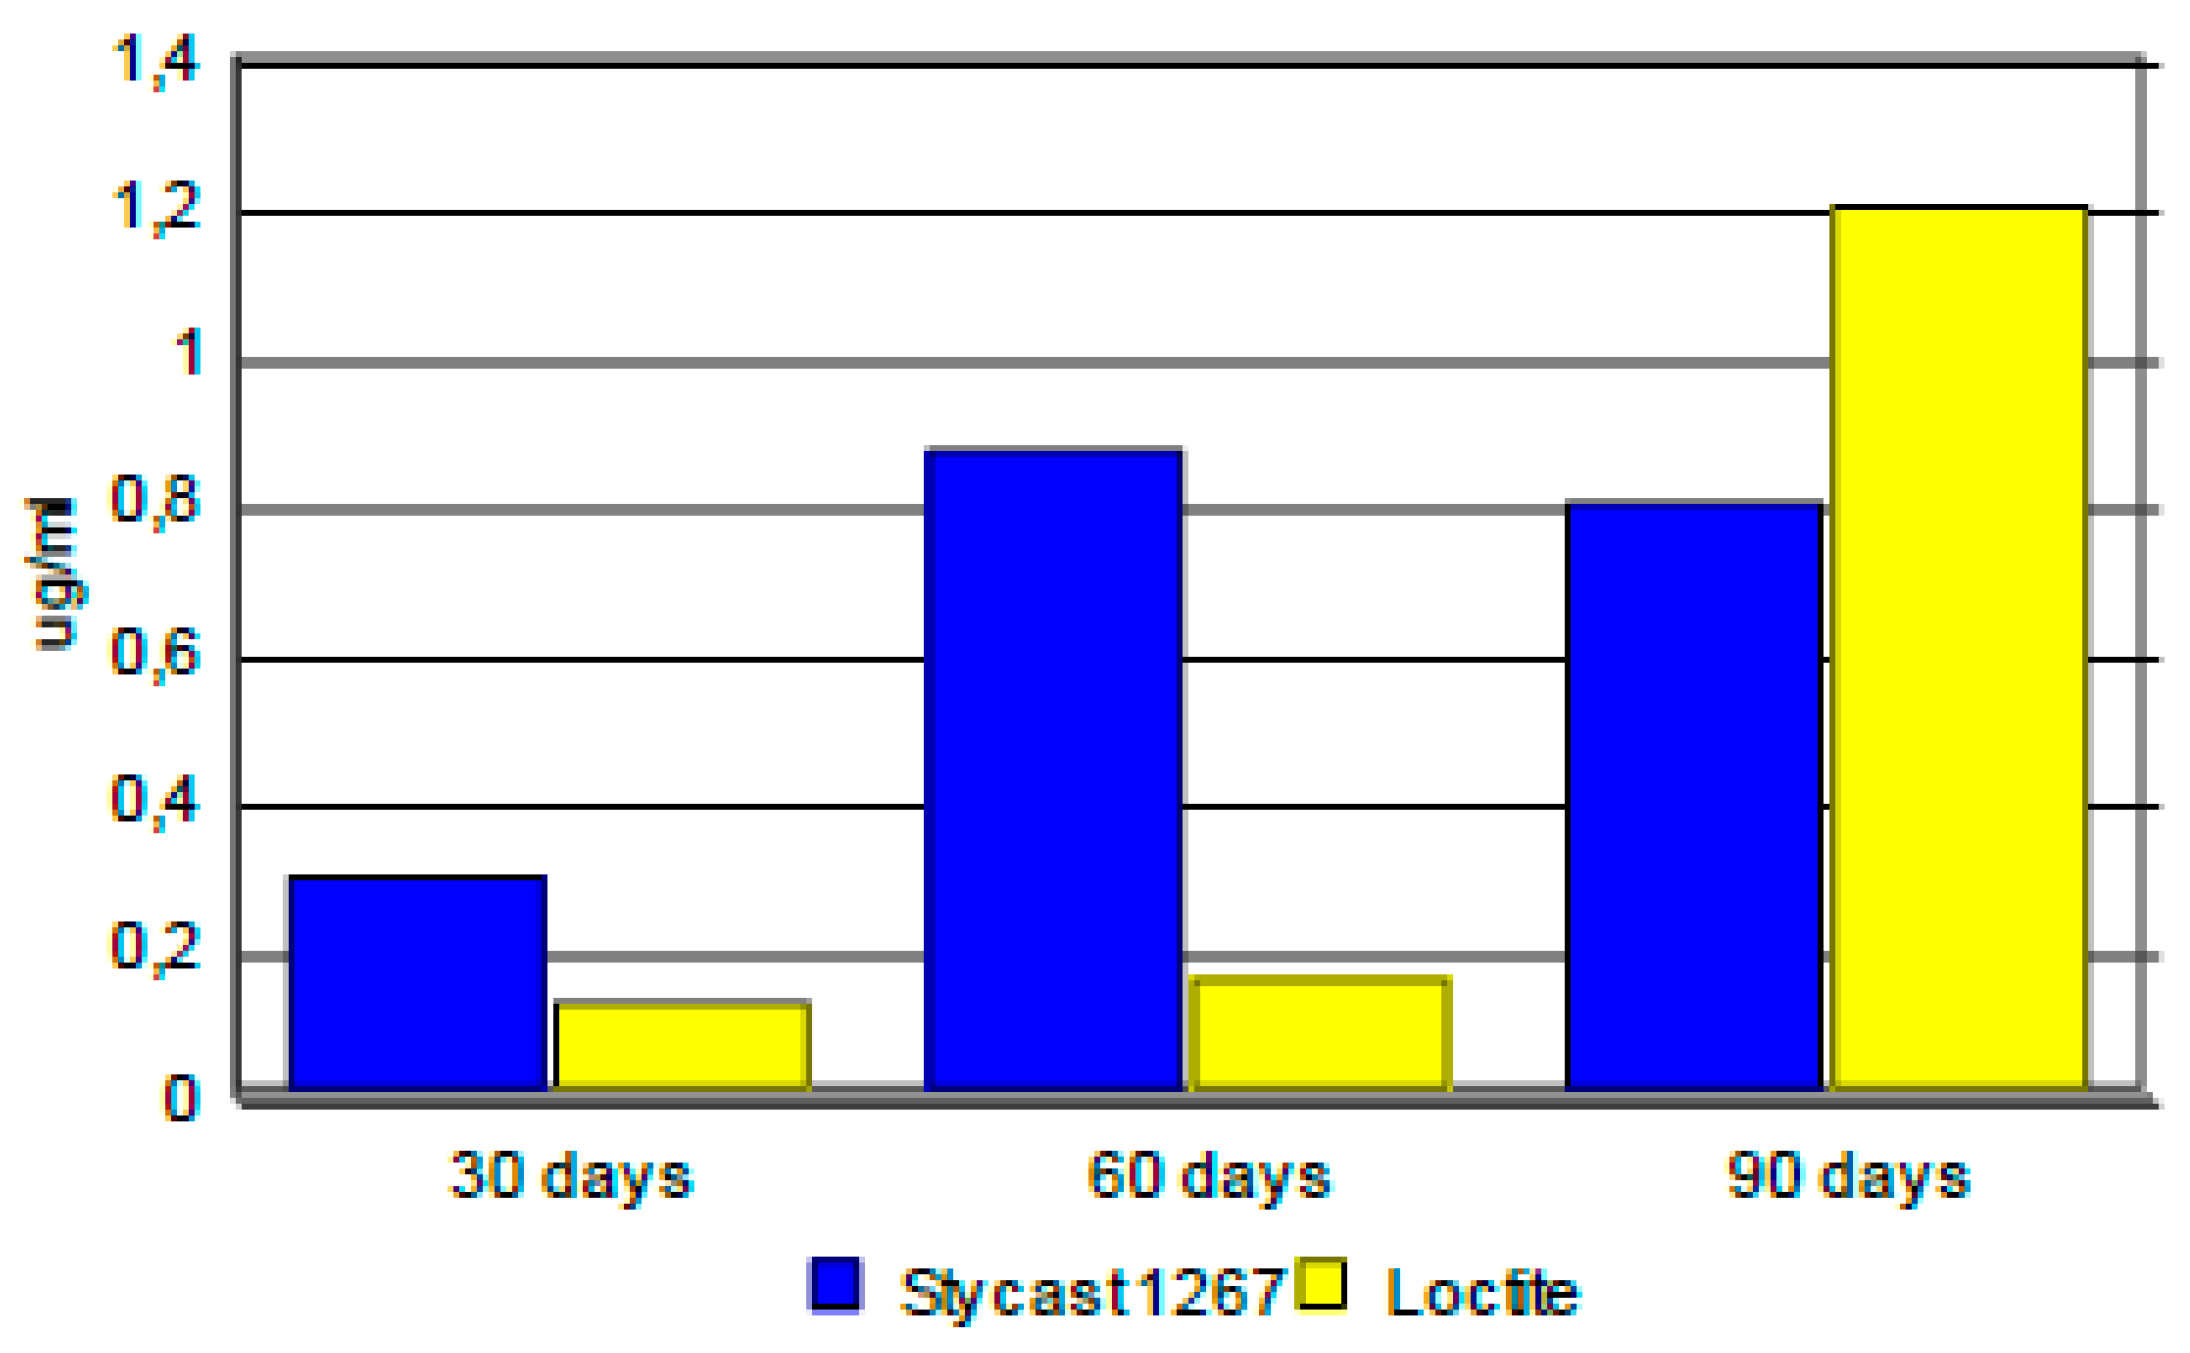
Figure 28.
Release of Nyodymium. LD = detection limit.
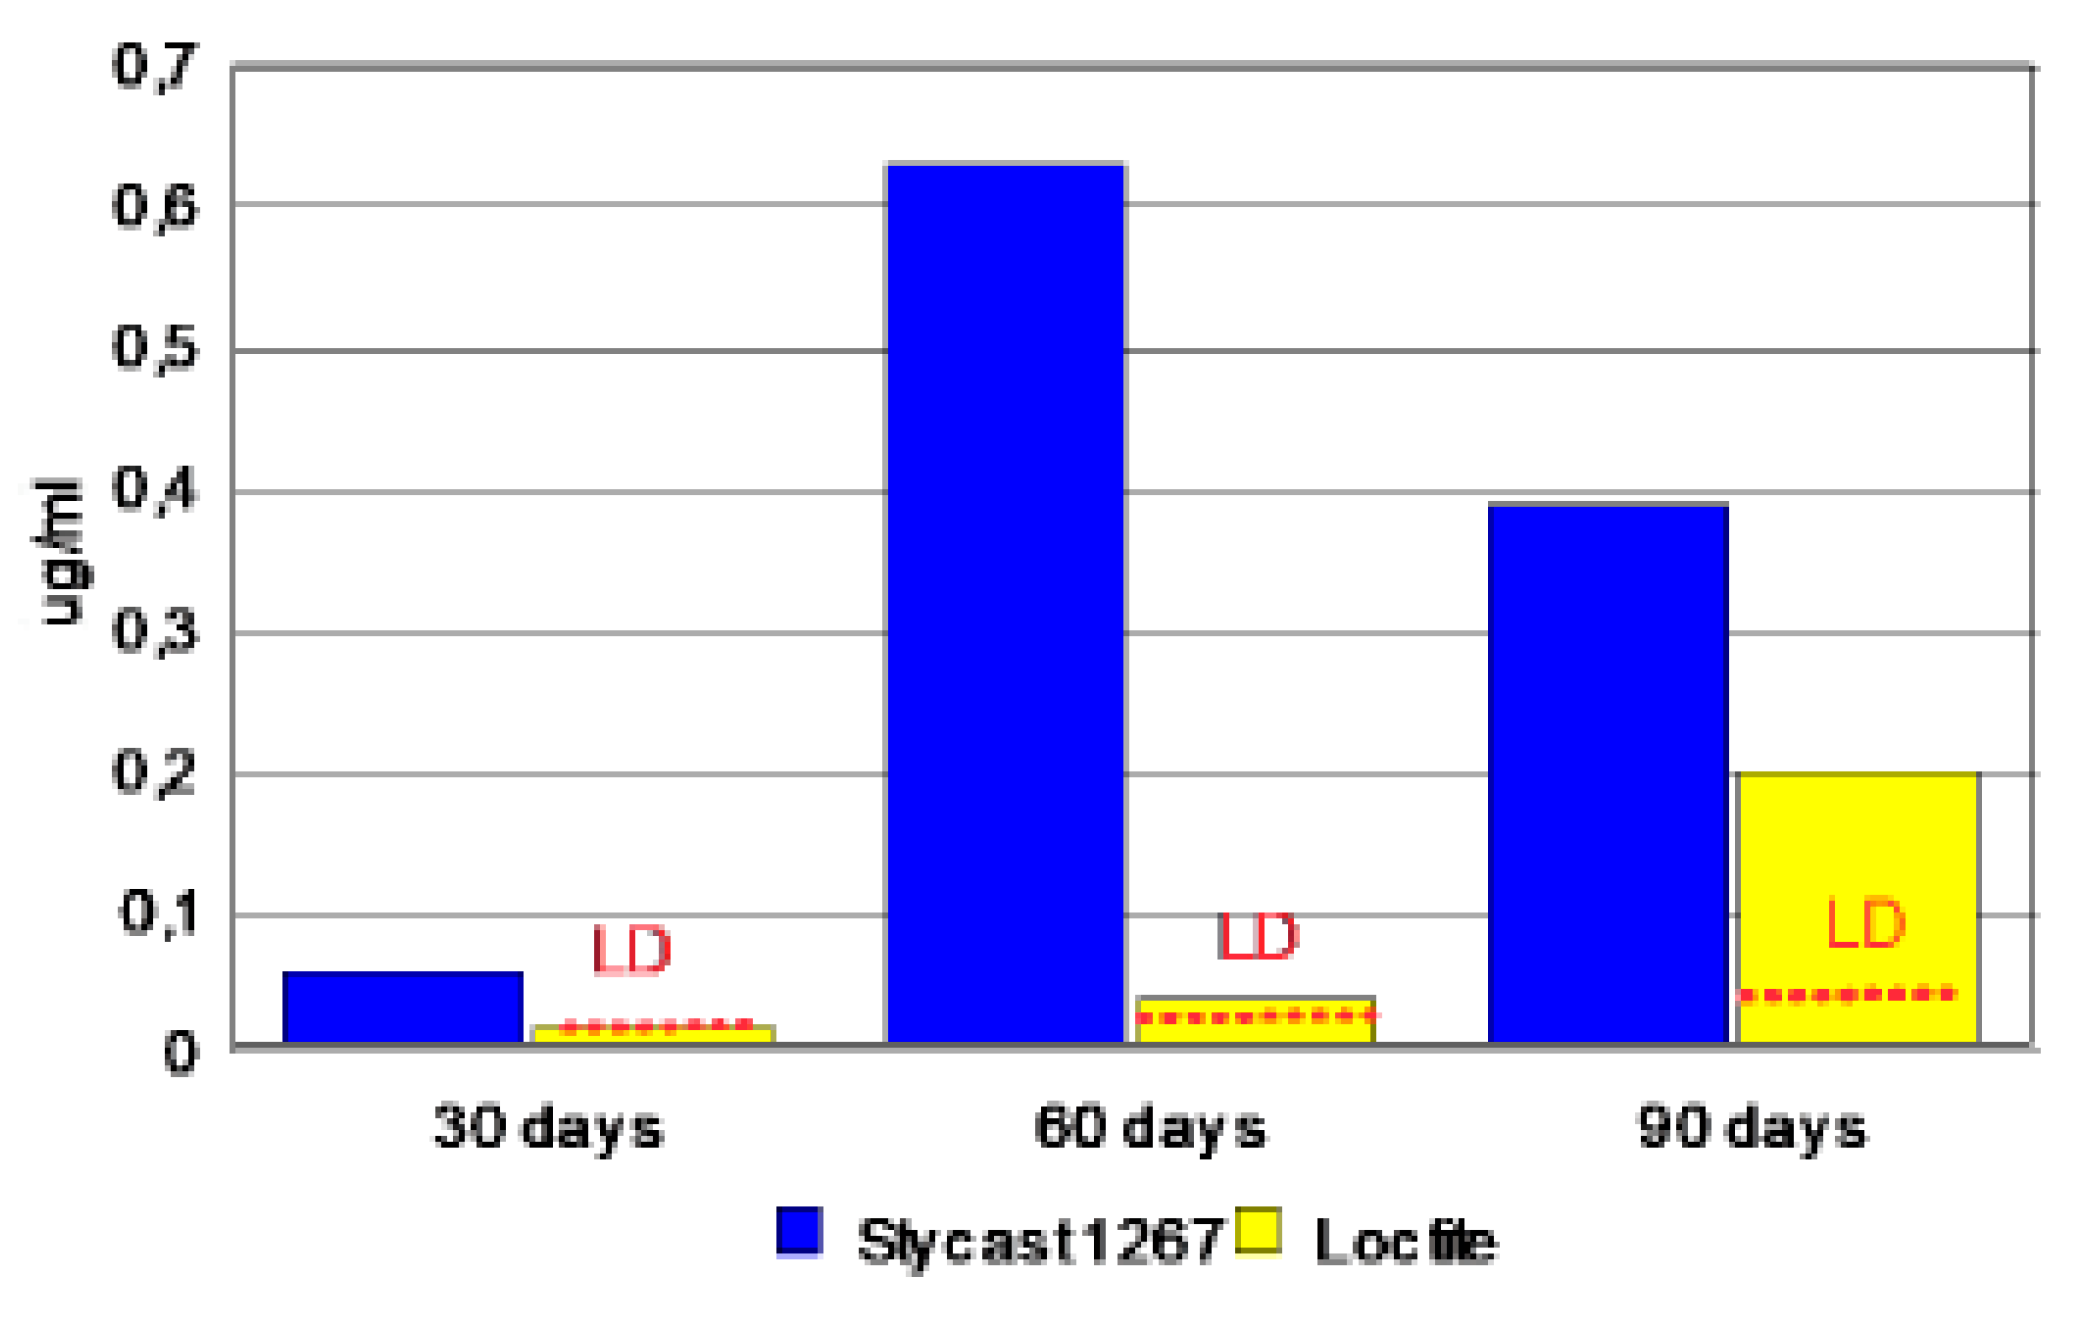
Figure 29.
CoSm5 magnet after Nielsen-Tuccillo method testing and removal of the Stycast 1266 epoxy resin. SEM image.
Figure 29.
CoSm5 magnet after Nielsen-Tuccillo method testing and removal of the Stycast 1266 epoxy resin. SEM image.
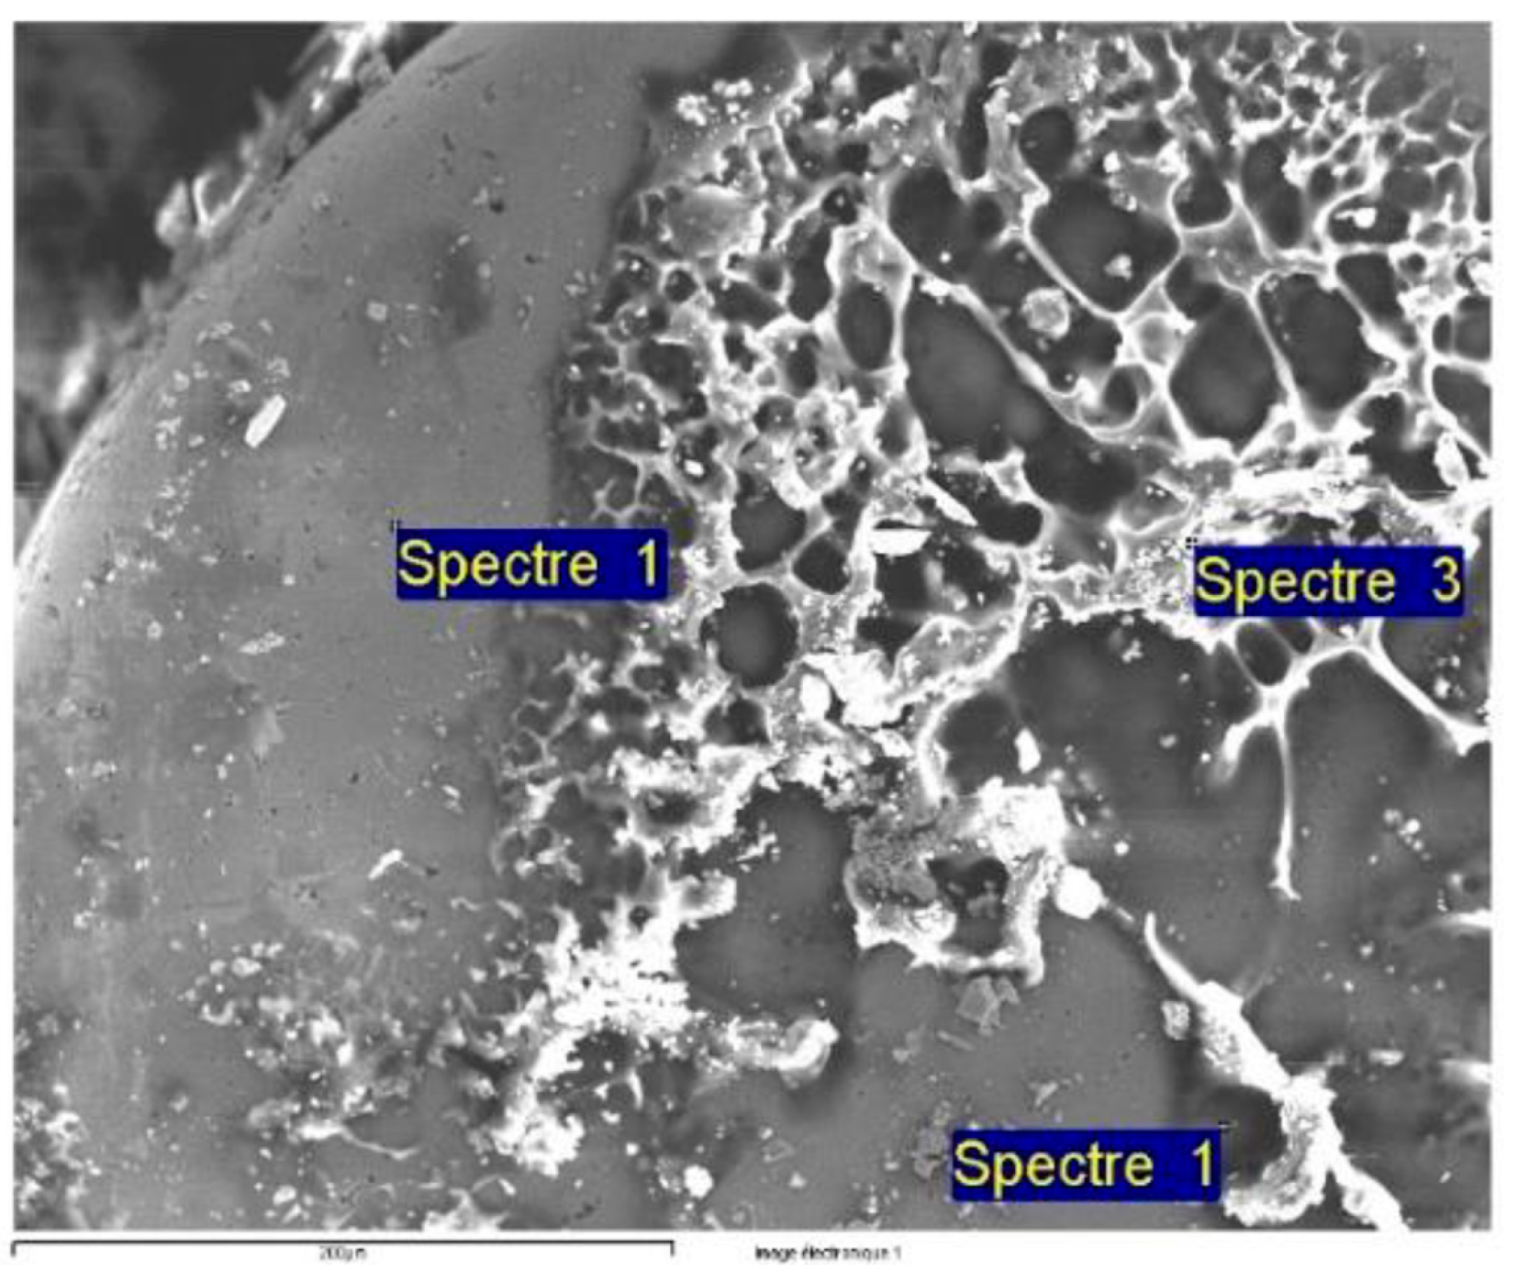
Figure 30.
Potentiodynamic sweeping curves traced after three days for the studied polymers.
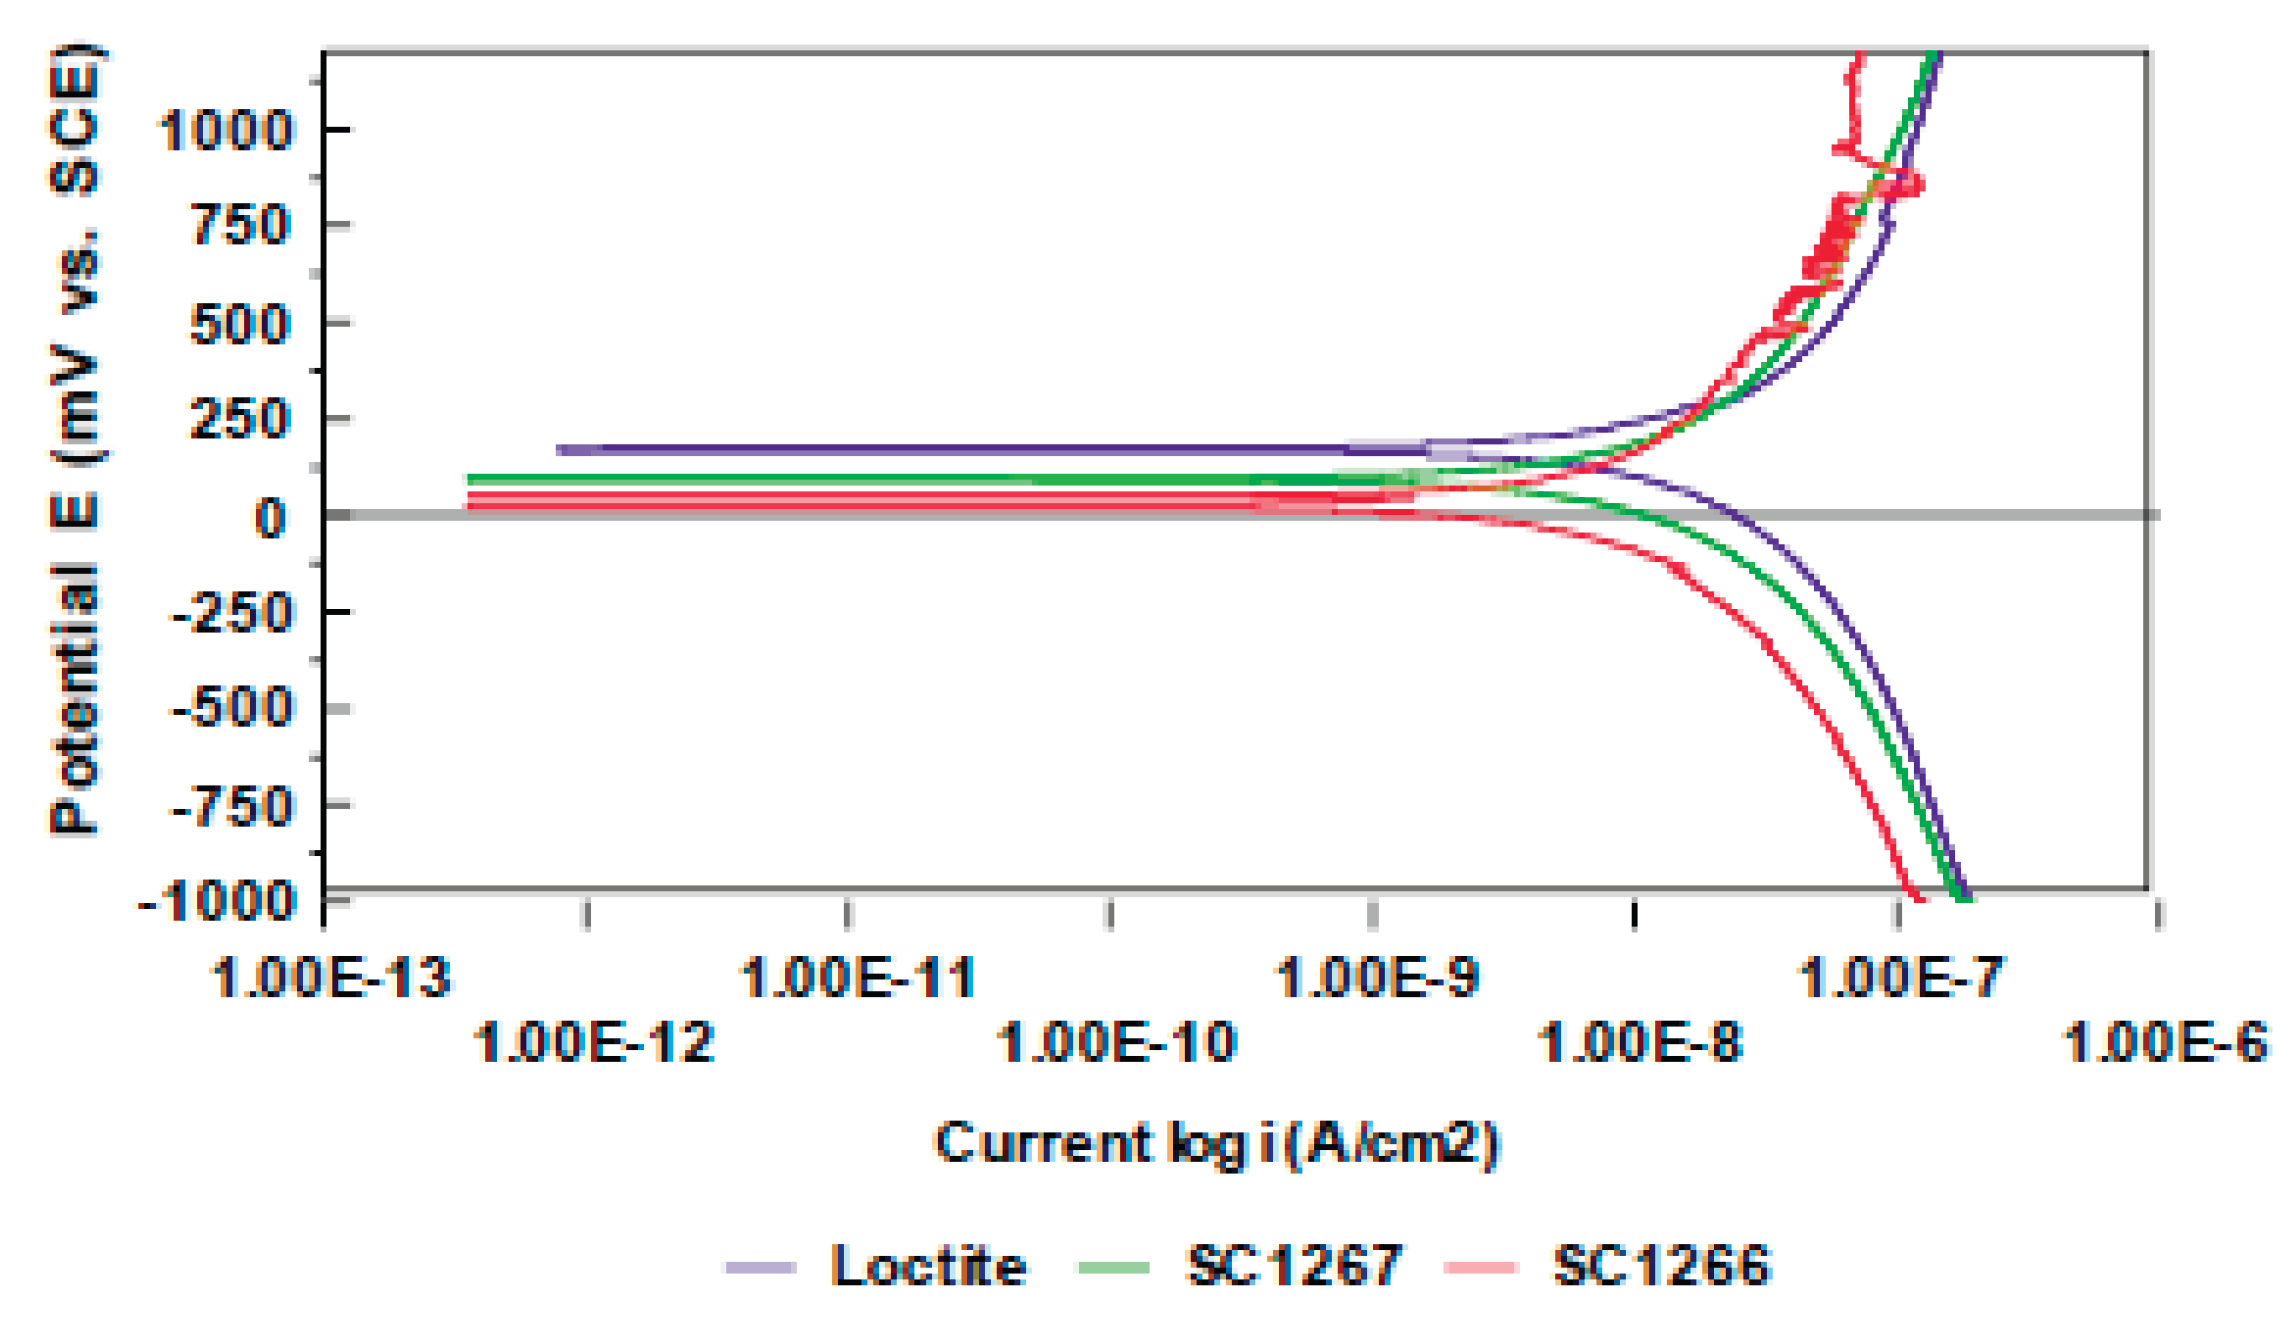
Figure 31.
Schematic representation of the exchange process in the metal – polymer - electrolyte interfaces.
Figure 31.
Schematic representation of the exchange process in the metal – polymer - electrolyte interfaces.
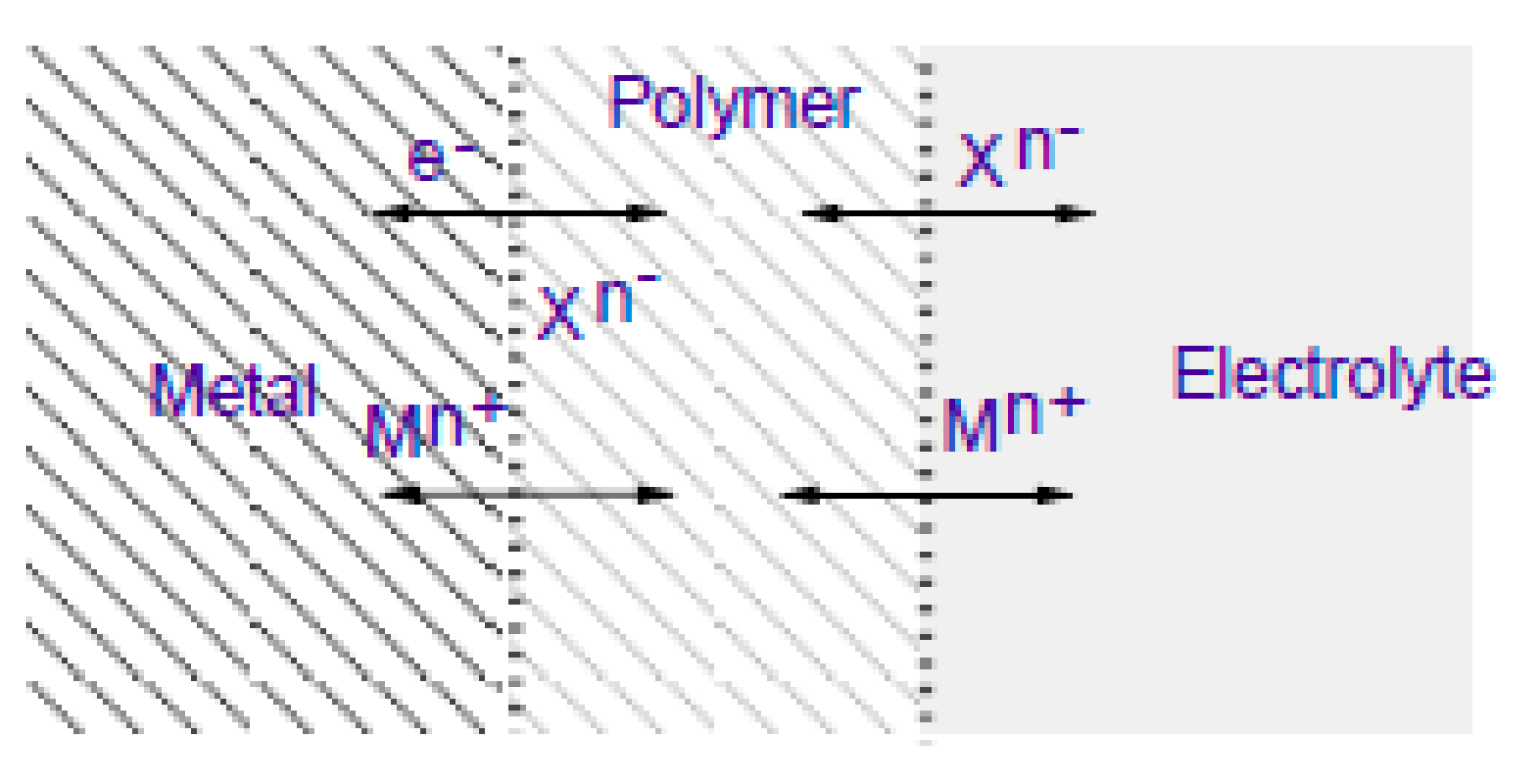
Table 2.
Electrochemical parameters calculated from the linear polarization curve lines and the Tafel slopes.
Table 2.
Electrochemical parameters calculated from the linear polarization curve lines and the Tafel slopes.
| Surface treatment | Corrosion potential E(i=0) (mV) |
Polarization resistance Rp (MOhms /cm2) |
Corrosion current density icorr (nA/cm2) |
|
|---|---|---|---|---|
| Loctite | after 3 days after 5 days after 9 days |
182.5 215.6 155.0 |
102.6 67.0 32.47 |
1.7 2.6 5.4 |
| Stycast 1267 | after 3 days after 5 days |
187.7 172.0 |
67.4 41.3 |
2.6 4.2 |
| StyCast 1266 | after 3 days after 5 days |
209.1 169.5 |
59.43 39.9 |
2.9 4.4 |
Disclaimer/Publisher’s Note: The statements, opinions and data contained in all publications are solely those of the individual author(s) and contributor(s) and not of MDPI and/or the editor(s). MDPI and/or the editor(s) disclaim responsibility for any injury to people or property resulting from any ideas, methods, instructions or products referred to in the content. |
© 2025 by the authors. Licensee MDPI, Basel, Switzerland. This article is an open access article distributed under the terms and conditions of the Creative Commons Attribution (CC BY) license (http://creativecommons.org/licenses/by/4.0/).
Copyright: This open access article is published under a Creative Commons CC BY 4.0 license, which permit the free download, distribution, and reuse, provided that the author and preprint are cited in any reuse.


