
Submitted:
11 November 2025
Posted:
12 November 2025
You are already at the latest version
Abstract
Background: Physical functioning is traditionally assessed and presented as self-reported measures, which have shown either improvement or stability during the last decades at population level. On the other hand, objectively measured, performance-based measures of physical functioning have indicated increased body weight and decreased physical fitness. Therefore, there is a need for objective, measured total physical functioning index (MePFIX). Methods: The MePFIX was developed from the data of 5238 working-aged adults (60% women) who took part in the FINFIT studies from years 2017 and 2021. The outcomes of measured body composition, cardiorespiratory fitness, muscular fitness, physical activity, stationary behavior, and time in bed were used to create the MePFIX. Results: The best performing index contained the fol-lowing measures: waist circumference, estimated maximal oxygen consumption, modified push-up, mean of daily 1-minute metabolic equivalent, high-movement time in bed, lying and reclining during waking hours >20-min bouts, standing, daily step count, moderate-to-vigorous physical activity in absolute terms, and light physical activity relative to fitness. Conclusions: The developed MePFIX is based on population-based data, containing measured outcomes of body composition, cardiorespiratory fitness, muscular fitness, physical activity, sedentary behavior and time in bed. The index could serve as an objective indicator of physical functioning among the target population. The MePFIX can be used as a figure of merit of measured physical functioning for research community and policy makers both at cross-sectional and at longitudinal analyses.
Keywords:
body composition
; cardiorespiratory fitness
; muscular fitness
; physical functioning
1. Introduction
International Classification of Functioning, Disability and Health (ICF) framework defines functioning as a dynamic interaction between a person’s health condition, environmental factors and personal factors [1]. In this framework, physical functioning can be assessed on the level of bodily functions, structures, and activities (physical activity, PA). Physical functioning is a prerequisite for independent life, health, and well-being. From a societal perspective, physical functioning confers economic significance, as its decline may increase the risk of sickness absence and early retirement [2,3]. The physiological properties important for physical functioning include muscular strength and endurance, cardiorespiratory fitness, joint mobility, motor control and abilities, and the functions of the central nervous system coordinating the above. Thus, the components of physical functioning are very much the same as those of physical fitness [4].
Both self-reported and performance-based methods have been used to assess physical functioning. Self-reports reflect person’s perception of his/her functioning and the adaptations that he/she has made to facilitate routine day-to-day performance. They are easy to use since they do not require a lot of time, space or special equipment. However, self-reports may fail to capture small changes in physical functioning [5], especially among high-functioning adults. Performance-based methods have been developed for different age groups. Usually, they include test items assessing walking ability/speed, lower extremity strength/function and balance [6,7,8,9]. The measurements assess actual performance of standardized tasks at a particular point of time. They may not fully reflect activities performed in daily life, but they provide relevant information beyond that obtained from self-reports [9]. Thus, self-reported and performance-based measurements assess different aspects of physical functioning. One reason for the discrepancy between the self-reported and performance-based outcomes may be the fact that occupation-related PA has decreased for several decades in Western counties [10,11].
According to national studies conducted in Finland, self-reported physical functioning of working-aged adults has improved from 1980s to 2000 [12]. An improvement can be seen also from 2000 to 2011, mainly among the individuals aged 45 years or older [13]. At the same time when self-reported physical functioning has been reported to improve in the Finnish population samples, several objectively measured outcomes describing the physical functioning and ability to manage the daily life have demonstrated unfavorable changes. The mean body weight of adults has increased in Finland for several decades similarly as in other high-income countries [14,15]. Along with pandemia of obesity, both cardiorespiratory and muscular fitness have decreased in young adults since 1980’s [14]. Further, the device-measured outcomes of PA [like number of daily steps, minutes of moderate-to-vigorous PA (MVPA) and minutes of light PA (LPA)] have been reported to either decrease or remain unchanged during the recent decade [16,17]. In addition, especially young adults have reported substantially shorter sleep duration during the decade before COVID-19 pandemic [18].
While both physical fitness and PA have changed during the last decades, there is a need to measure these parameters simultaneously in the same study. Device-based measurements of PA indicate that individuals with poorer cardiorespiratory fitness spend more time in lying and reclining postures compared to their fitter peers [19]. However, they tend to reach higher relative intensities in daily activities when expressed as a percentage of their individual aerobic capacity [20]. Thus, individuals with lower fitness may experience greater physical strain during everyday routines, potentially increasing their need for recovery in lying and reclining positions. Since bodily functions, structures, and activities are the key components of ICF-framework [1], it is important to consider both fitness and absolute and relative intensities of PA when assessing physical functioning.
The trend of objectively measured outcomes of physical functioning draws a very different picture than that of self-reported physical functioning. Therefore, there is a need for objectively measured population-level index of physical functioning. For the government and research community it would be informative if physical functioning could be described with one number, an index that describes total physical functioning of the target population. The purpose of this study was to construct an index that describes physical functioning of Finnish working-aged adult population based on selected measured indicators of body composition, cardiorespiratory fitness, muscular fitness, PA, stationary behavior, and time in bed as a proxy for sleep.
2. Materials and Methods
This study is based on two population-based FINFIT studies from 2017 and 2021, which are multifactorial studies on PA, physical fitness, and health conducted with independent stratified random samples of 20–69-year-old Finnish adults. In 2017, potential participants were drawn from the population registry in seven city-centered regions of Finland: 300 men and 300 women from both Helsinki and Tampere regions and 150 men and 150 women from each of the Turku, Kuopio, Jyväskylä, Oulu, and Rovaniemi regions spread across five age groups (20–29, 30–39, 40–49, 50–59, and 60–69 years). In 2021, 150 men and 150 women from Tampere, Turku, Kuopio, Jyväskylä, Oulu, and Rovaniemi regions were drawn from the registry in the five age groups. From Helsinki region the sampling was 300 men and women in each age group. Further, an additional sample was drawn from nine surrounding municipalities in Tampere (7 x 500) and Turku (2 x 500) regions. Other inclusion or exclusion criteria were not used. Invitation letters containing information about the study and informed consent with the option to withdraw from the study at any time were mailed to 13,500 (2017) and 16,500 (2021) potential participants belonging to the sample. The data collections were conducted between September 2017 and March 2019, and between September 2021 and May 2022. At both times the study comprised three parts: (1) a questionnaire assessing health status; (2) a health examination, including blood samples, anthropometric measurements, and physical fitness tests; and (3) 24/7 measurement of physical behaviors with a triaxial accelerometer. Descriptive results of the accelerometer measurements have been reported previously [21].
Fitness Measurements
Participants’ physical fitness was measured at the health examination by 4–5 fitness tests that have been previously described [22,23]. Jump--and--reach was used to measure the maximum power of lower extremity extender muscles. Modified push--up was used to indicate the strength endurance of the upper extremity extensor muscles and the ability of the trunk muscles to stabilize and control the back posture, and 6--min walking test (6MWT) was used to measure submaximal endurance performance and physical functioning [24]. Maximal oxygen uptake can also be estimated by 6MWT with reasonable accuracy [24]. The tests have been shown to be safe [7,25] and feasible in terms of low exclusion rates [23].
In addition, participants’ body weight, height, and waist circumference were measured at the health examinations. Measurements were conducted in light clothing without shoes.
Accelerometer-Based Data
Participants’ physical behavior was measured by a tri-axial accelerometer (UKK RM42, UKK Terveyspalvelut Oy, Tampere, Finland) 24/7. During waking hours, the accelerometer was attached to an elastic belt and worn on the right side of hip, excluding water-based activities. For the assessment of TIB, the accelerometer was moved from the belt to an adjustable wristband and attached to the non-dominant wrist. The accelerometer collected and stored the raw triaxial data in actual g-units in ±16 G range at a 100 Hz sampling rate [26].
Regarding the accelerometer data collected from the hip, it was analyzed in 6 s epochs. For each epoch, the mean amplitude deviation (MAD) was calculated from the resultant acceleration signal as well as from the acceleration signals in each orthogonal direction. The epoch-wise acceleration values were then converted to METs [20]. The epoch-wise MET values were further smoothed by calculating a one-minute exponential moving average. The intensity of PA was categorized in absolute and relative terms, using the smoothed MET values. In absolute terms, the total PA was classified as light PA (LPA, 1.5–2.9 METs), moderate PA (MPA, 3.0–5.9 METs), or vigorous PA (VPA, 6 METs or more) [27]. In relative terms, the individual cut-points were based on the oxygen uptake reserve (VO2R), which denotes the reserve between the resting and maximal oxygen uptake (VO2max) level. Accordingly, the LPA had intensity between 1.5 METs and 39% of VO2R, MPA ranged from 40% to 59% of VO2R and VPA was defined as exceeding 60% of VO2R [27]. The daily peak MET values were detected for 1-minute, 3-minute, 6-minute, 10-minute, 15-minute, 20-minute and 30-minute exponential moving average windows [28].
The epochs with less than 1.5 METs (i.e., MAD value less than 22.5 mg) were further analyzed with the angle for posture estimation (APE) method [19,29]. The APE denotes the angle between the measured epoch vector and reference vector. The accelerometer orientation during walking was used as a reference value, and the recognition of walking was based on the intensity of activity, step rate, and movement steadiness. The APE method is validated both under laboratory conditions through direct posture observation by researchers, and in real-life settings against a thigh-worn accelerometer. In real-life settings, the APE method has shown over 90% accuracy in classifying body postures [29]. APE values less than 11.6° denoted standing, those between 11.6° and 30° sitting, the values between 30° and 73.9° reclining, and values exceeding 73.9° lying [19,29].
Regarding the wrist-worn time indicating TIB, the analysis was based on changes in the wrist orientation between consecutive epochs and the time interval between changes exceeding five degrees were calculated. The method used is nearly similar to the one described by van Hees et al. [30]. The TIB was classified into three categories according to the number of changes in the wrist angle during the time window covering the preceding 10 min and following 10 min periods: high-movement (HM), medium-movement (MM), and low-movement (LM) [22].
Background Characteristics and Self-Reported Measures of Functioning
The FINFIT questionnaires included several questions on participants’ background and indicators of self-reported functioning [22]. As the background characteristics, we utilized marital status, educational status, urban-rural status of the residence, work ability score with the scale 1–10 and self-reported health status in terms of perceived health, perceived fitness and several diagnosed diseases (diabetes, hypertension or high blood pressure, chronic or recurrent back pain, knee or hip osteoarthritis, asthma, bronchitis, emphysema, angina pectoris, coronary thrombosis, other heart disease, stroke, peripheral artery disease, osteoporosis and cancer). Self-reported measures of physical functioning included ability to lift 10 kg from the floor to the table, carry 6 kg for 100 m, climb 1 flight of stairs without resting, ability to climb several flights of stairs without resting, walk ½ km without resting, run 100m and ability to walk in the forest. Finnish version of the RAND-36 [31] was used to assess quality of life in terms of both physical and mental components and perceived physical functioning.
Creating the Objectively Measured Total Physical Functioning Index
A total of eleven measures of physical functioning and one measure of mental functioning from the FINFIT questionnaires were used to find the best combination of 66 objective measures from five categories: PA (activities), fitness tests (body functions), body composition (body structures), stationary behavior (activities) and time in bed (activities) (Table 1). Each of the 66 objective measures were standardized to obtain Z-scores. For VO2 max, waist circumference and modified push ups, Z-scores were calculated separately for men and women.
Table 2 presents the objective measures of physical functioning for which the Z-scores were calculated. Most of the categories included several variables.
Figure 1 presents all rank sum minimums and means for each candidate variable of measured physical functioning. In the second phase Partial Eta effect sizes were calculated between each Z-score and twelve FINFIT questions (Table 1). Mean of the twelve effect sizes were also used as a measure to see which of the Z-scores had, on average, the strongest association for the subjective questions. To obtain direction of the associations for objective measures, Spearman rank correlation between the sum of the nine categorical physical functioning questions and Z-scores were calculated. Correlation coefficients were also used as one of the 14 measures for goodness of Z-scores.
In the third phase, Z-scores were put in rank order against each 14 measures of goodness. Mean and minimum of rank orders were considered the final selection criteria for the best objective measure of physical functioning. Maximum of two variables from each category presented in Table 2 were selected based on expert group’s evaluation. The selected variables represent different aspects of physical functioning. After selecting 10 variables for the index, weight for each Z-score were calculated based on the mean of proportion of Eta and correlation coefficient from sum of 10 Eta’s and correlation coefficients multiplied by 10. For Eta, sign of correlation was applied to maintain the direction of the association. Finally, 5 was added to the weighted index and the result was multiplied by 2 to achieve baseline mean of 100 with reasonable variation. Hence, the index of physical functioning is determined by the Equation (1).
where = weight for variable i and = Z-score for variable i.
3. Results
The study included 5238 participants (59.9% women) with the mean age of 49.9 years (SD 13.4). In 10-year age groups, the number of participants was n=470 (20–29-year-olds), n=832 (30–39-year-olds), n=1081 (40–49-year-olds), n=1258 (50–59-year-olds) and n=1597 (60–69-year-olds).
Creating the Index
Final selection of variables included in the MePFIX was based on Figure 1 which presents all rank sum minimums and means for each candidate variable. For the sedentary behavior category, daily mean minutes of lying or reclining bouts lasting at least 20 minutes had on average the lowest mean of rank scores and was selected for the index. Some of the Z-scores, mainly related to lying, had smaller minimum of rank scores, but according to rank mean they were not performing that well. Daily mean of standing was the only potential variable in the standing category and was therefore selected.
For the PA category, daily mean of steps and daily mean of absolute MVPA were the best performing variables according to both rank minimum and rank mean and were selected. For PA relative to fitness category daily mean of LPA was considered the obvious choice while in the MET category differences between the variables were quite small. Our selection for the MET category was mean of daily 1 minute peak.
For the Time in bed (TIB) category daily mean of HM during TIB was the best choice according to both minimum and mean rank and was selected. For Body composition -category both waist circumference and body mass index (BMI) were one of the best performing variables to be included in the MePFIX. Waist circumference was the better choice according to our criterion.
In the physical fitness tests category, there were three well performing variables. Modified push-ups measures different feature than 6MWT distance and estimated VO2max and was selected. Between 6MWT distance and VO2max, our selection to the MePFIX was VO2max even if 6MWT distance was slightly better according to our criteria. VO2max was considered more universal measure which can be estimated with several different ways while for 6MWT distance, a certain test is needed. Selected components for MePFIX are presented in Table 3 with means and SDs needed for standardization to Z-scores and weight for each variable. These values should be used with Equation (1) when calculating MePFIX to maintain the comparability to the original data.
Describing the Index
The MePFIX is a sum of 10 different standardized variables modified to assure easier interpretation of results and avoiding negative values. The sum of 10 standardized variables would have a mean of 0 and single values ranging from negative to positive. Standardized variables are modified with Equation (1) so that the mean of the single variable moves from 0 to 10 and sum of 10 variables moves from mean = 10 to mean = 100 while SD is increased to allow easier interpretation of changes on MePFIX. Weighting is used to give more weight to the variables that are considered more important to physical functioning. Due to the nature of the sum, the change in a single component in Equation (1) equals the same change in the MePFIX. Theoretically, the mean of MePFIX is 100.0 but due to missing data, not all participants that were affecting standardization of single variables were included when calculating the actual sum of selected variables. Number of participants varies from 3703 to 4302 depending on the component while for MePFIX the number of participants is 3062. MePFIX higher than 100.0 in this case means that these partially involved participants had worse than average value on most of the components they were involved.
The developed MePFIX in this data follows an approximately normal distribution (Figure 2) with a mean of 101.4 and a standard deviation of 12.4. The skewness (0.024) and kurtosis (0.38) values further support the assumption of normality.
We examined MePFIX across several demographic and functional variables (Figure 3, Supplementary Table S1). Higher index values were consistently observed among younger individuals, those with higher education, and individuals reporting no difficulty climbing stairs. Conversely, lower index values were found among older adults, individuals with lower education levels, and those experiencing stair-climbing difficulties. The index also clearly distinguishes individuals with reported diseases from healthy ones, with lower mean values observed in the former group. No substantial differences in the index values were observed between sexes or between urban and rural classifications, which align with expectations and further support the index’s internal consistency.
Index Simulations
With Z-scores, the most effective way to improve MePFIX is to improve Z-scores on variables that has the highest absolute value on weight. This means that improvement in VO2max is the most important factor of MePFIX while daily minutes of standing has the lowest effect. When considering changing the absolute value on MePFIX components, defining importance of MePFIX components is not that straightforward. Ratio of mean/SD multiplied by weight (Table 3) gives numbers of importance for each component when trying to improve MePFIX. This means that improving 20% in waist circumference is more effective way to increase MePFIX than improving 20% in VO2max even if VO2max has higher absolute value of weight. Figure 4 presents the simulation of the MePFIX with the 20% improment in all components.
4. Discussion
To our knowledge, this is first study to calculate the measured index of total physical functioning (MePFIX) that is based on objectively measured outcomes of components of ICF framework (WHO): body function, structures and activities [1]. The outcomes were body composition, cardiorespiratory and muscular fitness, accelerometer–measured PA, stationary behavior, and time in bed as a proxy for sleep. The MePFIX is meant to be used as an objective measure of population-based total physical functioning, which can be used as a single outcome to describe the level of total physical functioning. The MePFIX can be calculated from population-based data of working-aged adults of certain region or country.
The current MePFIX is a sum index, which consists of ten different parameters, which are waist circumference, maximal oxygen uptake, modified push-ups, and the seven accelerometer-based outcomes: Mean of daily 1-minute maximum MET mean time of high-movement TIB, mean time of lying and reclining accumulating from bouts lasting longer than 20 min, mean time of standing, mean time of absolute MVPA minutes, mean time of relative LPA, and mean number of daily steps. All seven outcomes from accelerometer data were calculated using daily data. For every ten outcomes, we used the Z-score of the outcome. In addition to the chosen outcomes, we had dozens of other outcomes that were tested. However, the ones used in the MePFIX were the ones performing best and we took only one outcome from each physical feature.
Although based on performance- and device-based parameters, the MePFIX associates with participants’ perceived physical functioning. Those with more self-reported functional difficulties had poorer index than those with no perceived difficulties. Previous studies have reported large variations and only poor to fair agreement between self-reported and performance-based assessment methods of physical functioning [32,33,34]. A recent cross-sectional study by Moser et al. [35] revealed a strong association between self-reported health status and physical functioning assessed by six minutes walking distance, which supports the present findings. However, Moser et al. [35] used only one performance-based outcome that does not cover different components of physical functioning presented in the ICF framework.
The MePFIX needs data of ten outcomes from population-based studies, which can be considered a demanding request. However, all outcomes used in the current MePFIX are strongly associated with elements of self-rated physical functioning. Therefore, all outcomes used in the MePFIX are considered relevant and they are based on the data used in population-based studies that are executed in Finland every fourth year. A similar index using partly different outcomes than the current index using data from the Finnish population-based samples could be relevant for some other countries, if data of all outcomes are not available. However, when modifying the index, it is worth testing and validating it against self-rated physical functioning.
Limitations and Strengths
Although this study provides important insights into the development and practical use of a physical functioning index some limitations must be considered. First, it is possible that the MePFIX measured in controlled test settings does not fully correspond to the demands of physical functioning faced by working-age individuals in actual occupational environments and everyday life. Second, the use of several measures to assess physical functioning may require specific technical resources and expertise, which could present some challenges for the wider implementation of the index. Thirdly, differences in labor policies and cultural contexts between countries may pose challenges to the index’s international applicability.
Despite some limitations, the MePFIX has several strengths that support its practical application. First, the indicators used as the basis for the total physical functioning index provide a comprehensive picture of physical functioning and are in line with ICF framework [1]. This enables a realistic assessment of the population’s physical functioning in relation to the demands of working life and everyday activities. Second, the use of performance- and device-based measures reduces recall bias and limits the influence of individual interpretation, thereby enhancing the reliability of the results. Third, the index offers a concrete and understandable tool for assessing physical functioning, which can be utilized in the planning of health and labor policies. This, in turn, may contribute to the more efficient allocation of societal resources.
5. Conclusions
This is the first study to calculate the objectively measured single number index of total physical functioning (MePFIX). The MePFIX is based on population-based data, containing measured outcomes of body composition, cardiorespiratory fitness, muscular fitness, PA, stationary behavior, and TIB as a proxy for sleep. The index could serve as an objective indicator of physical functioning among working-aged target populations. The MePFIX can be used both in cross-sectional and at longitudinal analyses as a single number outcome of measured physical functioning for research community and policy makers.
Supplementary Materials
The following supporting information can be downloaded at the website of this paper posted on Preprints.org. Table S1: Mean values and 95% confidence intervals (CI) of the physical functioning index across demographic and other variables.
Author Contributions
Conceptualization, T.V., K.T., J.R., H.VY., OP.N., P.K., H.S. and P.H.; methodology, K.T., J.R. and H.VY.; software, K.T. and J.R.; validation, T.V., K.T., J.R., H.VY., OP.N. and P.H.; formal analysis, K.T.; resources, T.V.; data curation, K.T., J.R. and H.VY.; writing—original draft preparation, T.V. and P.H.; writing—review and editing, T.V., K.T., J.R., H.VY., OP.N., P.K., H.S. and P.H.; visualization, K.T. and J.R.; supervision, T.V. and H.S.; project administration, T.V.; funding acquisition, T.V. All authors have read and agreed to the published version of the manuscript.
Funding
This research was funded by The Finnish Ministry of Education and Culture.
Institutional Review Board Statement
The study was conducted in accordance with the Declaration of Helsinki and approved by the Regional Ethics Committee of the Expert Responsibility Area of Tampere University Hospital (R17030, R21050).
Informed Consent Statement
All participants gave signed informed consent before participation.
Data Availability Statement
The data are maintained at the UKK Institute. The datasets analyzed in the present study are not publicly available due to ethical restrictions (the Regional Ethics Committee of the Expert Responsibility Area of Tampere University Hospital), but more detailed information on the data is available from the corresponding author (TV) on reasonable request.
Acknowledgments
The laboratory staff of the participating research centers (the LIKES Research Centre for Physical Activity and Health, Jyväskylä; the Department of Sports and Exercise Medicine, Oulu Deaconess Institute Foundation sr, Oulu; the Kuopio Research Institute of Exercise Medicine, Kuopio; the Paavo Nurmi Centre, Turku; Santasport, Rovaniemi; city of Helsinki; and Turku University of Applied Sciences) are acknowledged for collecting data for this study.
Conflicts of Interest
The authors declare no conflicts of interest. The funders had no role in the design of the study; in the collection, analyses, or interpretation of data; in the writing of the manuscript; or in the decision to publish the results.
Abbreviations
The following abbreviations are used in this manuscript:
| APE | Angle for posture estimation |
| BMI | Body mass index |
| CI | Confidence interval |
| FINFIT | Population-based FINFIT study |
| HM | High-movement time in bed |
| ICF | International Classification of Functioning, Disability and Health |
| LPA | Light physical activity |
| LM | Low-movement time in bed |
| MAD | Mean amplitude deviation |
| MET | Metabolic equivalent |
| MePFIX | Measured Physical Functioning Index |
| MM | Medium-movement time in bed |
| MPA | Moderate physical activity |
| MVPA | Moderate-to-vigorous physical activity |
| PA | Physical activity |
| 6MWT | 6-min walking test |
| SD | Standard deviation |
| TIB | Time in bed |
| VO2 max | Maximal oxygen uptake |
| VO2R | Oxygen uptake reserve |
| VPA | Vigorous physical activity |
| WHO | World Health Organization |
References
- WHO. The International Classification of Functioning, Disability and Health (ICF). 2001 [cited 2025 24.9.]; Available from: www.who.int/standards/classifications/international-classification-of-functioning-disability-and-health.
- Laaksonen, M. , et al., Different domains of health functioning as predictors of sickness absence--a prospective cohort study. Scand J Work Environ Health, 2011. 37(3): p. 213-8.
- Eyjolfsdottir, H.S. , et al., Physical functioning as a predictor of retirement: Has its importance changed over a thirty-year period in Sweden? Eur J Ageing, 2022. 19(4): p. 1417-1428.
- Caspersen, C.J., K. E. Powell, and G.M. Christenson, Physical activity, exercise, and physical fitness: definitions and distinctions for health-related research. Public Health Rep, 1985. 100(2): p. 126-31.
- Hoeymans, N. , et al., Measuring functional status: cross-sectional and longitudinal associations between performance and self-report (Zutphen Elderly Study 1990-1993). J Clin Epidemiol, 1996. 49(10): p. 1103-10.
- Guralnik, J.M. , et al., Lower extremity function and subsequent disability: consistency across studies, predictive models, and value of gait speed alone compared with the short physical performance battery. J Gerontol A Biol Sci Med Sci, 2000. 55(4): p. M221-31.
- Suni, J.H. , et al., Health-related fitness test battery for adults: aspects of reliability. Arch Phys Med Rehabil, 1996. 77(4): p. 399-405.
- Rikli RE, J.J. , Measuring functional fitness of older adults. Journal of Active Ageing, 2002: p. 24-30.
- Nuuttila, O.P. , et al., Adherence to health-related fitness tests in working-aged adults-who are we (not) measuring? Clin Physiol Funct Imaging, 2025. 45(5): p. e70020.
- Church, T.S. , et al., Trends over 5 decades in U.S. occupation-related physical activity and their associations with obesity. PLoS One, 2011. 6(5): p. e19657.
- Morseth, B. , et al., Secular trends and correlates of physical activity: The Tromso Study 1979-2008. BMC Public Health, 2016. 16(1): p. 1215.
- Aromaa A, K.S. , Health and functional capacity in Finland. Baseline results of the Health 2000 health examination survey. Publications of the National Public Health Institute B3/2002. 2002, Helsinki.
- Sainio P, S.S. , Vaara M, Rask S, Valkeinen H, Rantanen T., Fyysinen toimintakyky (In Finnish, Physical functioning). Health, functional capacity and welfare in Finland in 2011, ed. L.A. Koskinen S, Ristiluoma N. Vol. Report 68 /2012. 2012, Helsinki: National Institute for Health and Welfare (THL). 120-124.
- Santtila, M. , et al., Physical Fitness in Young Men between 1975 and 2015 with a Focus on the Years 2005-2015. Med Sci Sports Exerc, 2018. 50(2): p. 292-298.
- Ng, M.G., E.; Lo, J.; Abate, Y.H; Abbafati, C.; Abbas, N.; Abbasian, M.; Abd ElHafeez, S.; Abdel-Rahman, W.M.; Abd-Elsalam, S.; et al. , Global, regional, and national prevalence of adult overweight and obesity, 1990-2021, with forecasts to 2050: a forecasting study for the Global Burden of Disease Study 2021. Lancet, 2025. 405: p. 813-838.
- Husu, P. , et al., Physical activity has decreased in Finnish children and adolescents from 2016 to 2022. BMC Public Health, 2024. 24(1): p. 1343.
- Strain, T. , et al., National, regional, and global trends in insufficient physical activity among adults from 2000 to 2022: a pooled analysis of 507 population-based surveys with 5.7 million participants. Lancet Glob Health, 2024. 12(8): p. e1232-e1243.
- Merikanto, I. and T. Partonen, Increase in eveningness and insufficient sleep among adults in population-based cross-sections from 2007 to 2017. Sleep Med, 2020. 75: p. 368-379.
- Vaha-Ypya, H. , et al., Measurement of Sedentary Behavior-The Outcomes of the Angle for Posture Estimation (APE) Method. Sensors (Basel), 2024. 24(7).
- Vaha-Ypya, H. , et al., Performance of Different Accelerometry-Based Metrics to Estimate Oxygen Consumption during Track and Treadmill Locomotion over a Wide Intensity Range. Sensors (Basel), 2023. 23(11).
- Husu, P. , et al., Measurement of Physical Fitness and 24/7 Physical Activity, Standing, Sedentary Behavior, and Time in Bed in Working-Age Finns: Study Protocol for FINFIT 2021. Methods Protoc, 2022. 5(1).
- Husu, P. , Tokola, K., Vähä-Ypyä, H., Sievänen, H., Suni, J., Heinonen, O., Heiskanen, J., Kaikkonen, K., Savonen, K., Kokko, S., Vasankari, T., Physical activity, sedentary behavior and time in bed among Finnish adults measured 24/7 by triaxial accelerometry. J Meas Phys Behav, 2021. 4(2): p. 163-173.
- Nuuttila, O.P. , et al., Cut-off values for estimated cardiorespiratory fitness in terms of physical functioning among middle-aged to older adults. J Sports Med Phys Fitness, 2025. 65(3): p. 361-368.
- Manttari, A. , et al., Six-minute walk test: a tool for predicting maximal aerobic power (VO(2) max) in healthy adults. Clin Physiol Funct Imaging, 2018.
- Suni, J.H. , et al., Safety and feasibility of a health-related fitness test battery for adults. Phys Ther, 1998. 78(2): p. 134-48.
- Vaha-Ypya, H. , et al., A universal, accurate intensity-based classification of different physical activities using raw data of accelerometer. Clin Physiol Funct Imaging, 2015. 35(1): p. 64-70.
- Garber, C.E. , et al., American College of Sports Medicine position stand. Quantity and quality of exercise for developing and maintaining cardiorespiratory, musculoskeletal, and neuromotor fitness in apparently healthy adults: guidance for prescribing exercise. Med Sci Sports Exerc, 2011. 43(7): p. 1334-59.
- Vaha-Ypya, H. , et al., What Can One Minute of the Day Tell about Physical Activity? Int J Environ Res Public Health, 2023. 20(19).
- Vaha-Ypya, H. , et al., Reliable recognition of lying, sitting, and standing with a hip-worn accelerometer. Scand J Med Sci Sports, 2018. 28(3): p. 1092-1102.
- van Hees, V.T. , et al., A Novel, Open Access Method to Assess Sleep Duration Using a Wrist-Worn Accelerometer. PLoS One, 2015. 10(11): p. e0142533.
- Aalto, A.-M. , Aro, AR, Teperi, J., Rand-36 terveyteen liittyvän elämänlaadun mittarina: Mittarin luotettavuus ja suomalaiset väestöarvot. Research reports / National Research and Development Centre for Welfare and Health. Vol. 101. 1999, Helsinki: Stakes.
- Mikkelsson, L. , et al., Associations between self-estimated and measured physical fitness among 40-year-old men and women. Scand J Med Sci Sports, 2005. 15(5): p. 329-35.
- Aandstad, A. , Relationship between self-reported and objectively measured physical fitness in young men and women. Eur J Sport Sci, 2023. 23(2): p. 301-309.
- Obling, K.H. , et al., Association between self-reported and objectively measured physical fitness level in a middle-aged population in primary care. Prev Med Rep, 2015. 2: p. 462-6.
- Moser, N. , et al., Association between self-reported and objectively assessed physical functioning in the general population. Sci Rep, 2024. 14(1): p. 16236.
Figure 1.
All rank sum minimums and means for each candidate variable of measured physical functioning.
Figure 1.
All rank sum minimums and means for each candidate variable of measured physical functioning.
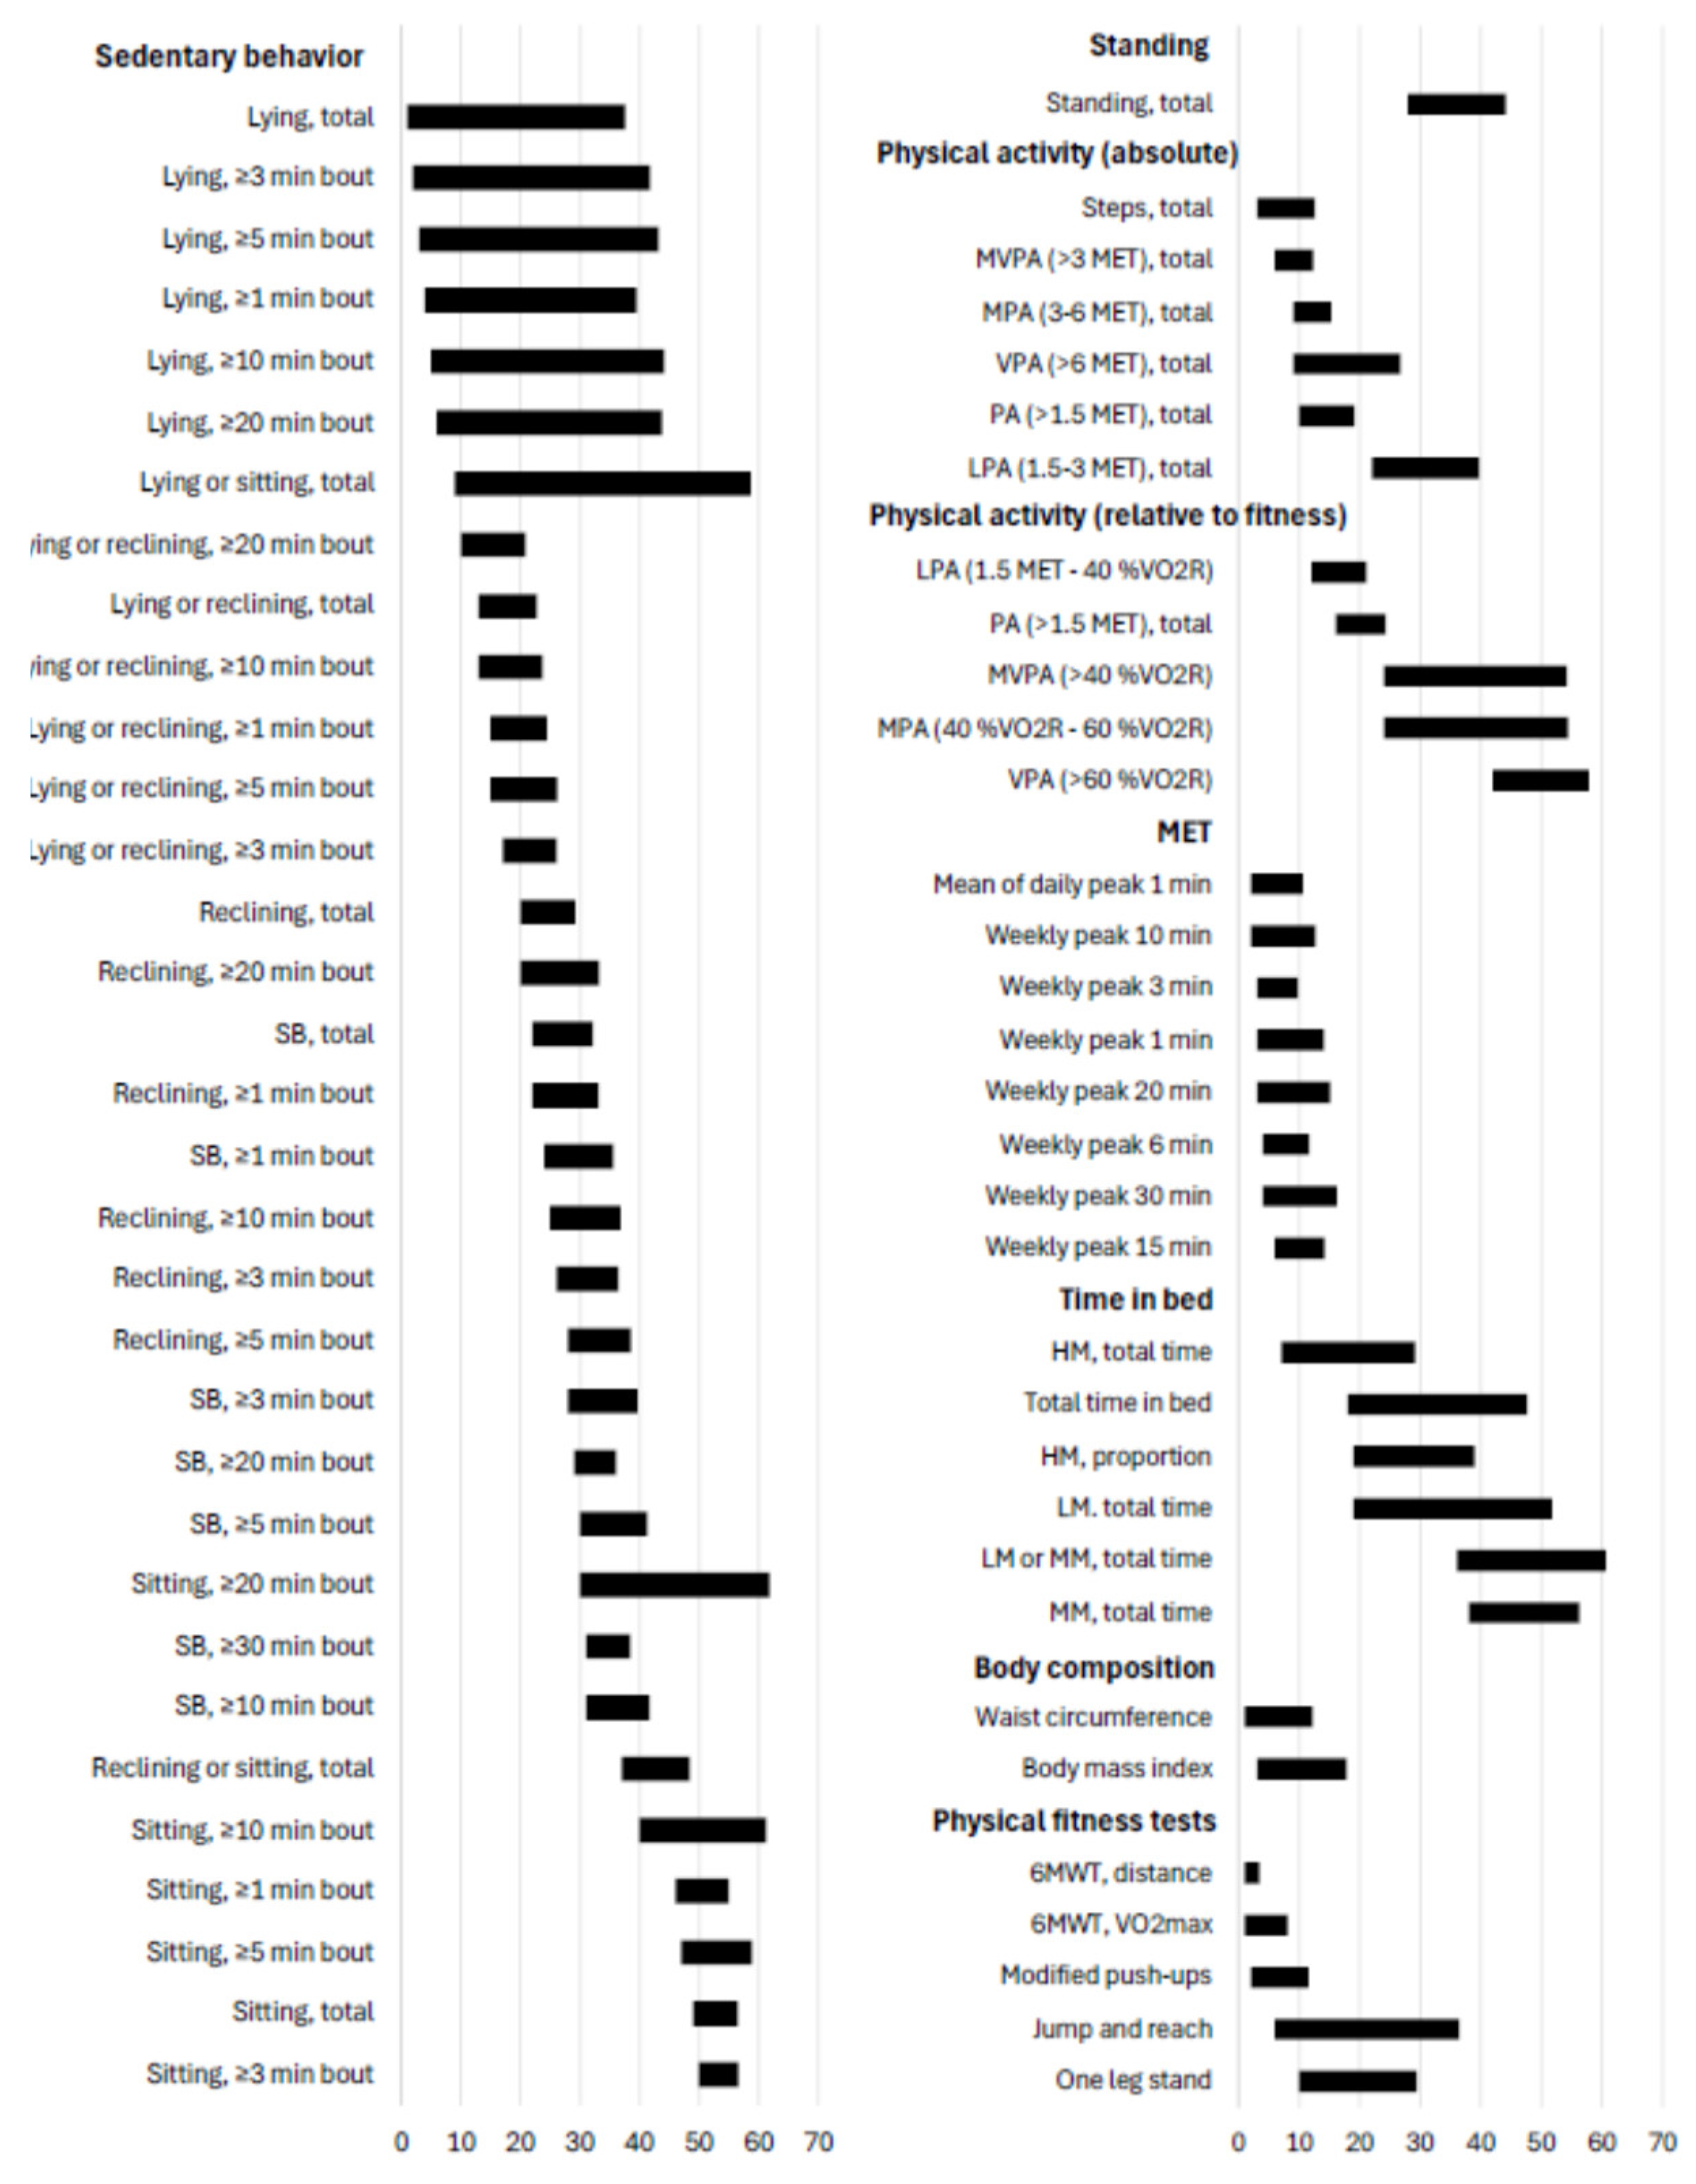
Figure 2.
Histogram of the measured physical functioning index (MePFIX).
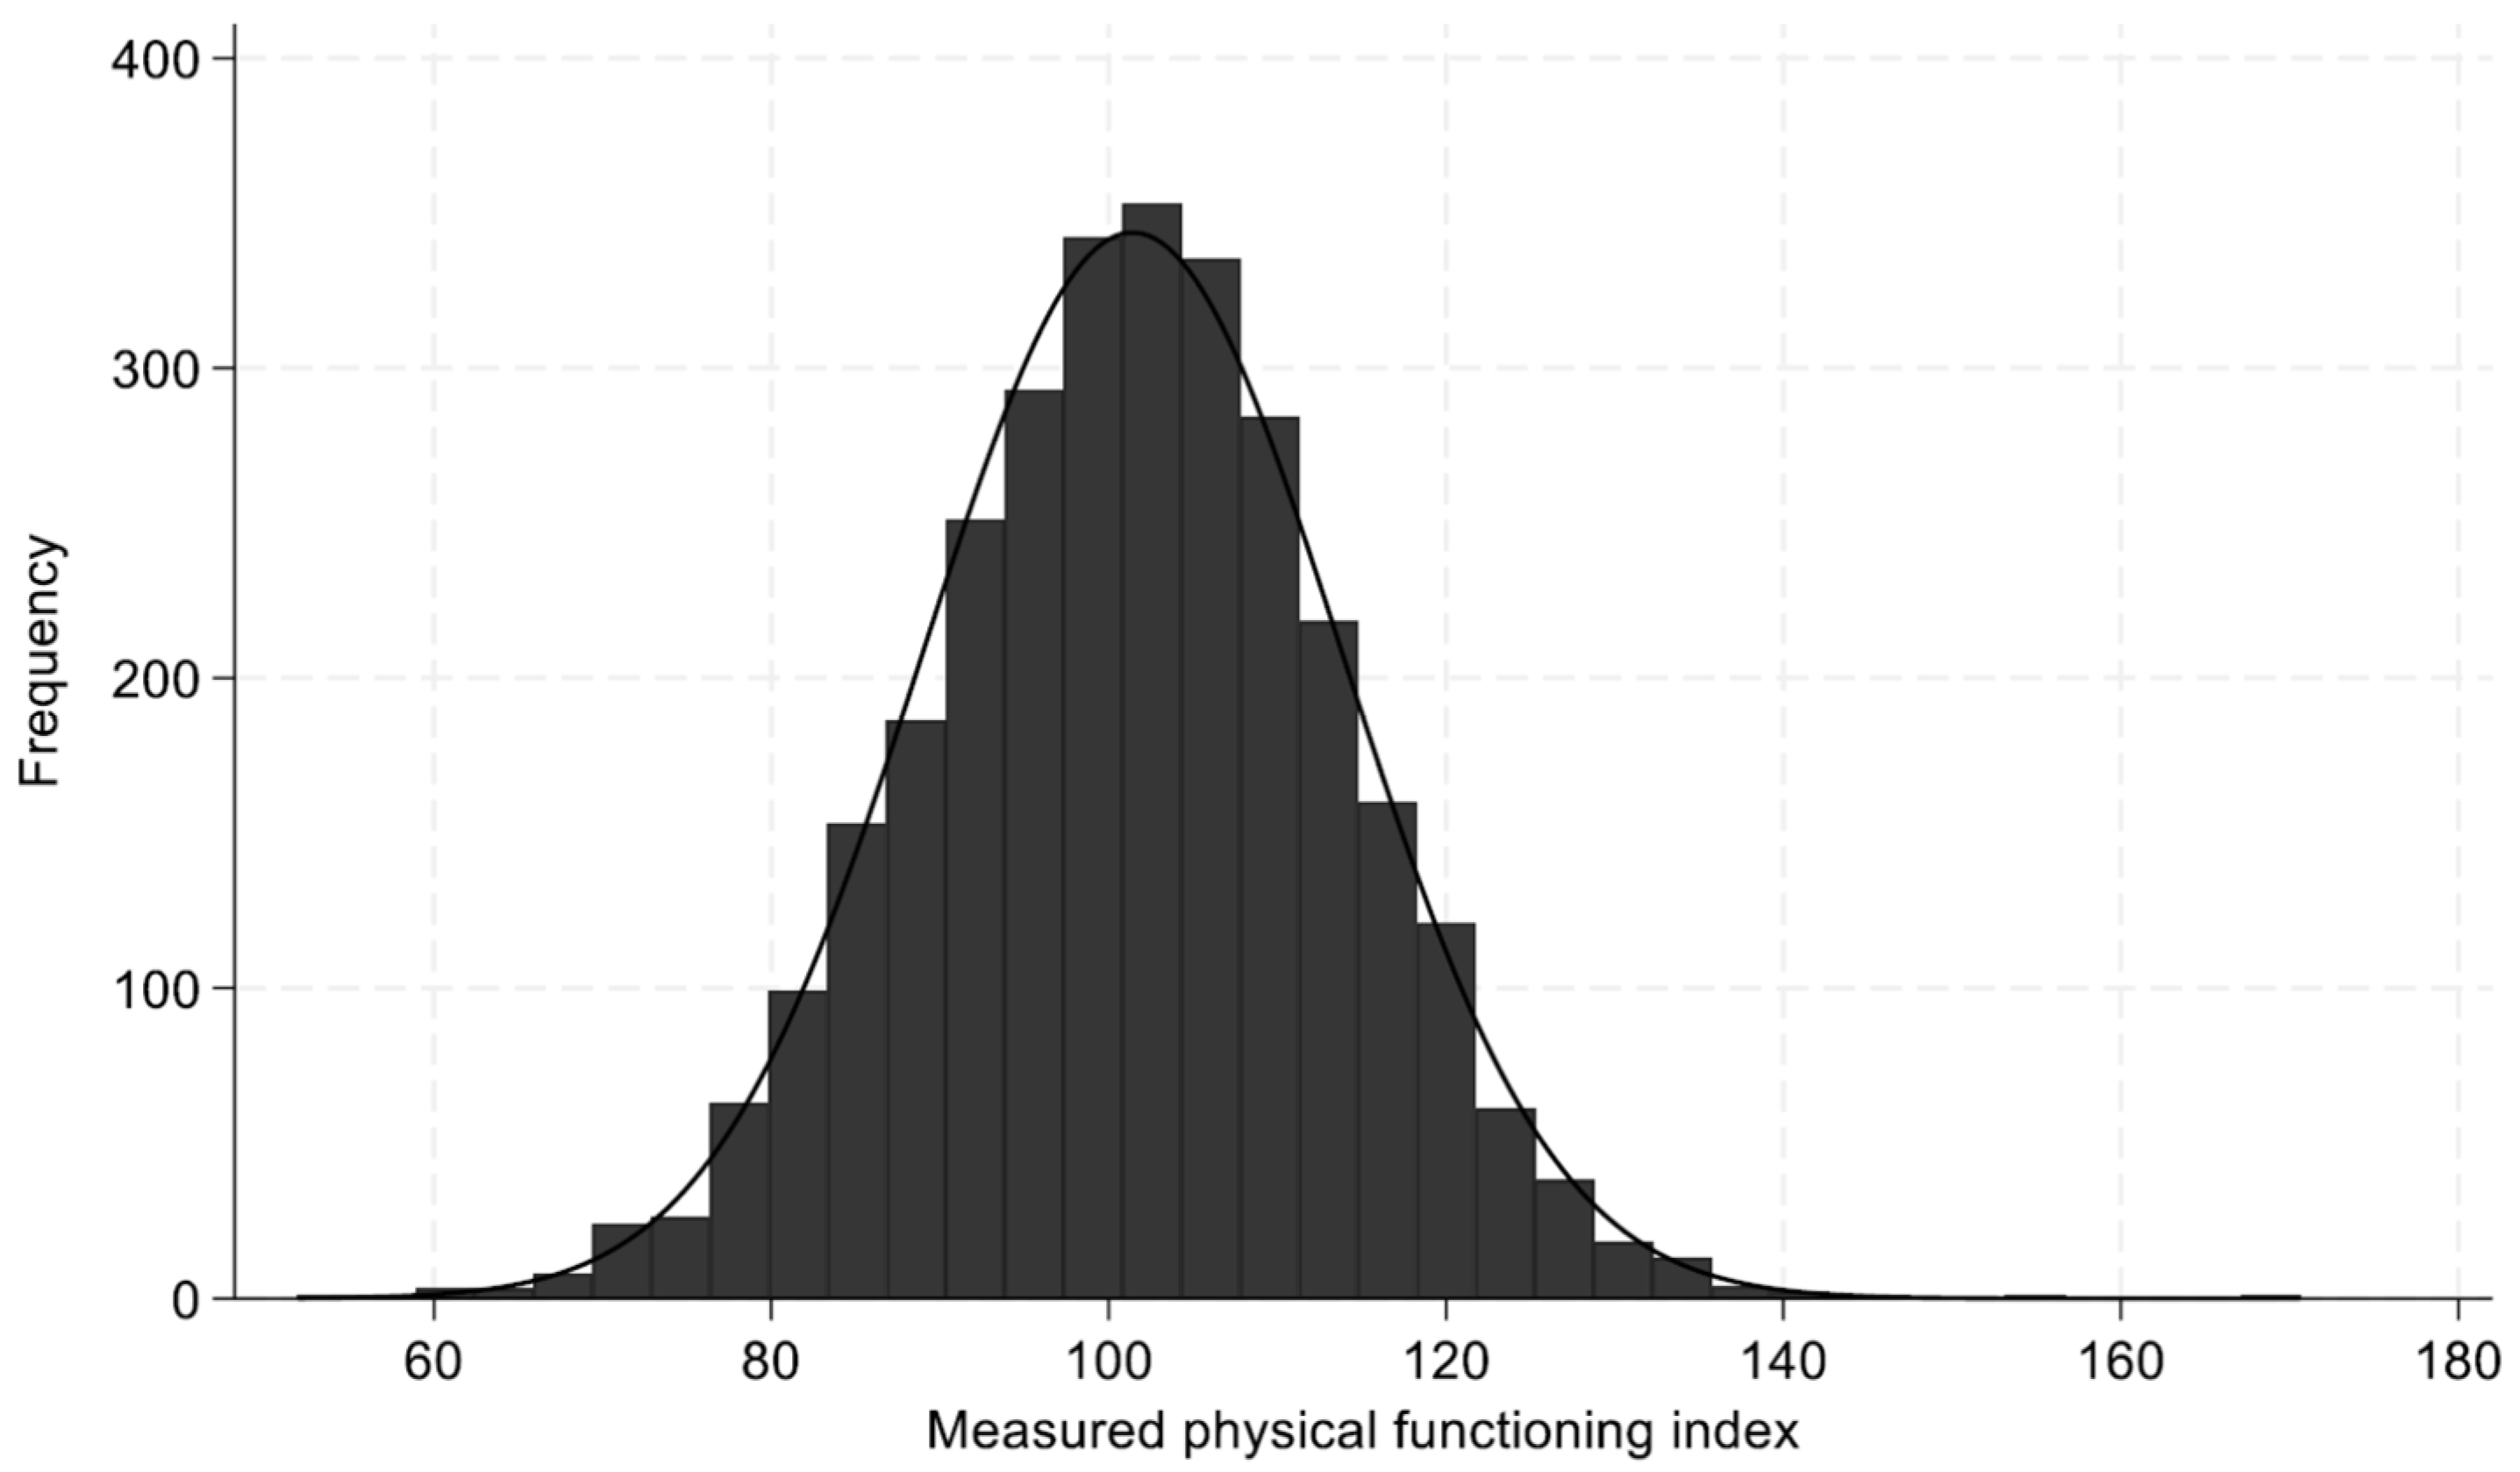
Figure 3.
Mean values and 95% confidence intervals (CI) of the physical functioning index (MePFIX) across demographic and other variables.
Figure 3.
Mean values and 95% confidence intervals (CI) of the physical functioning index (MePFIX) across demographic and other variables.
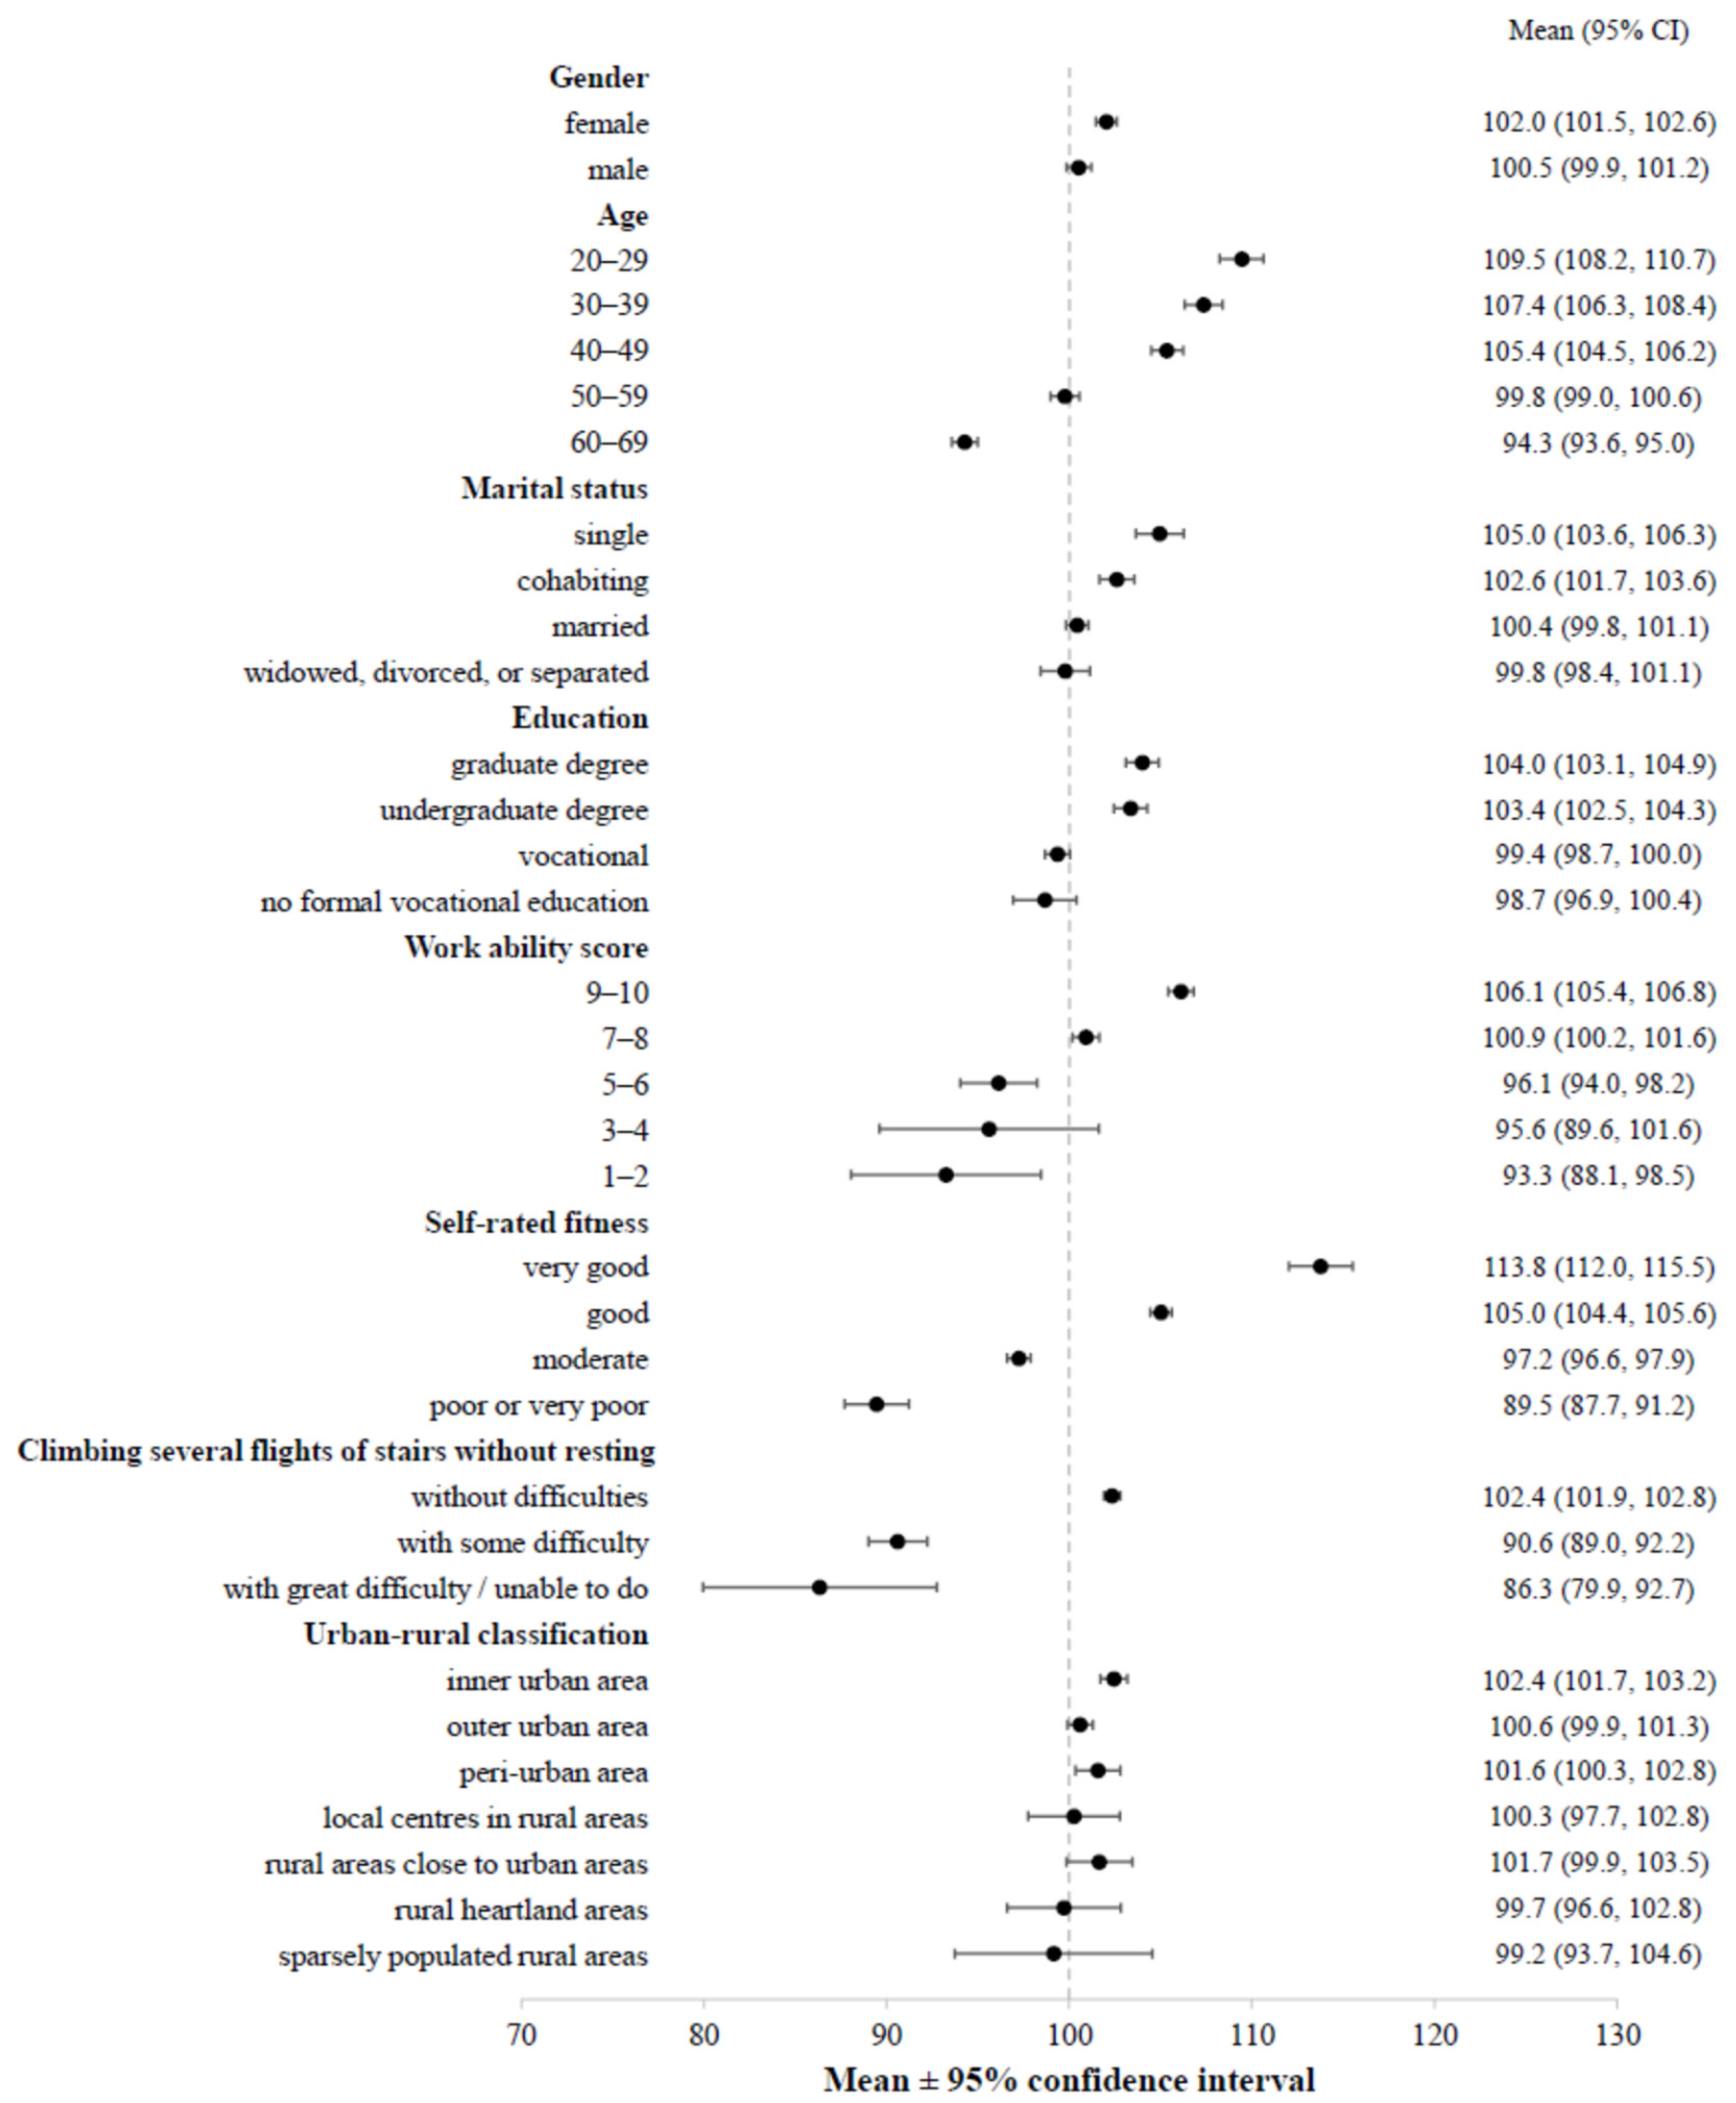
Figure 4.
the simulation of the MePFIX with the 20% improvement in all components.
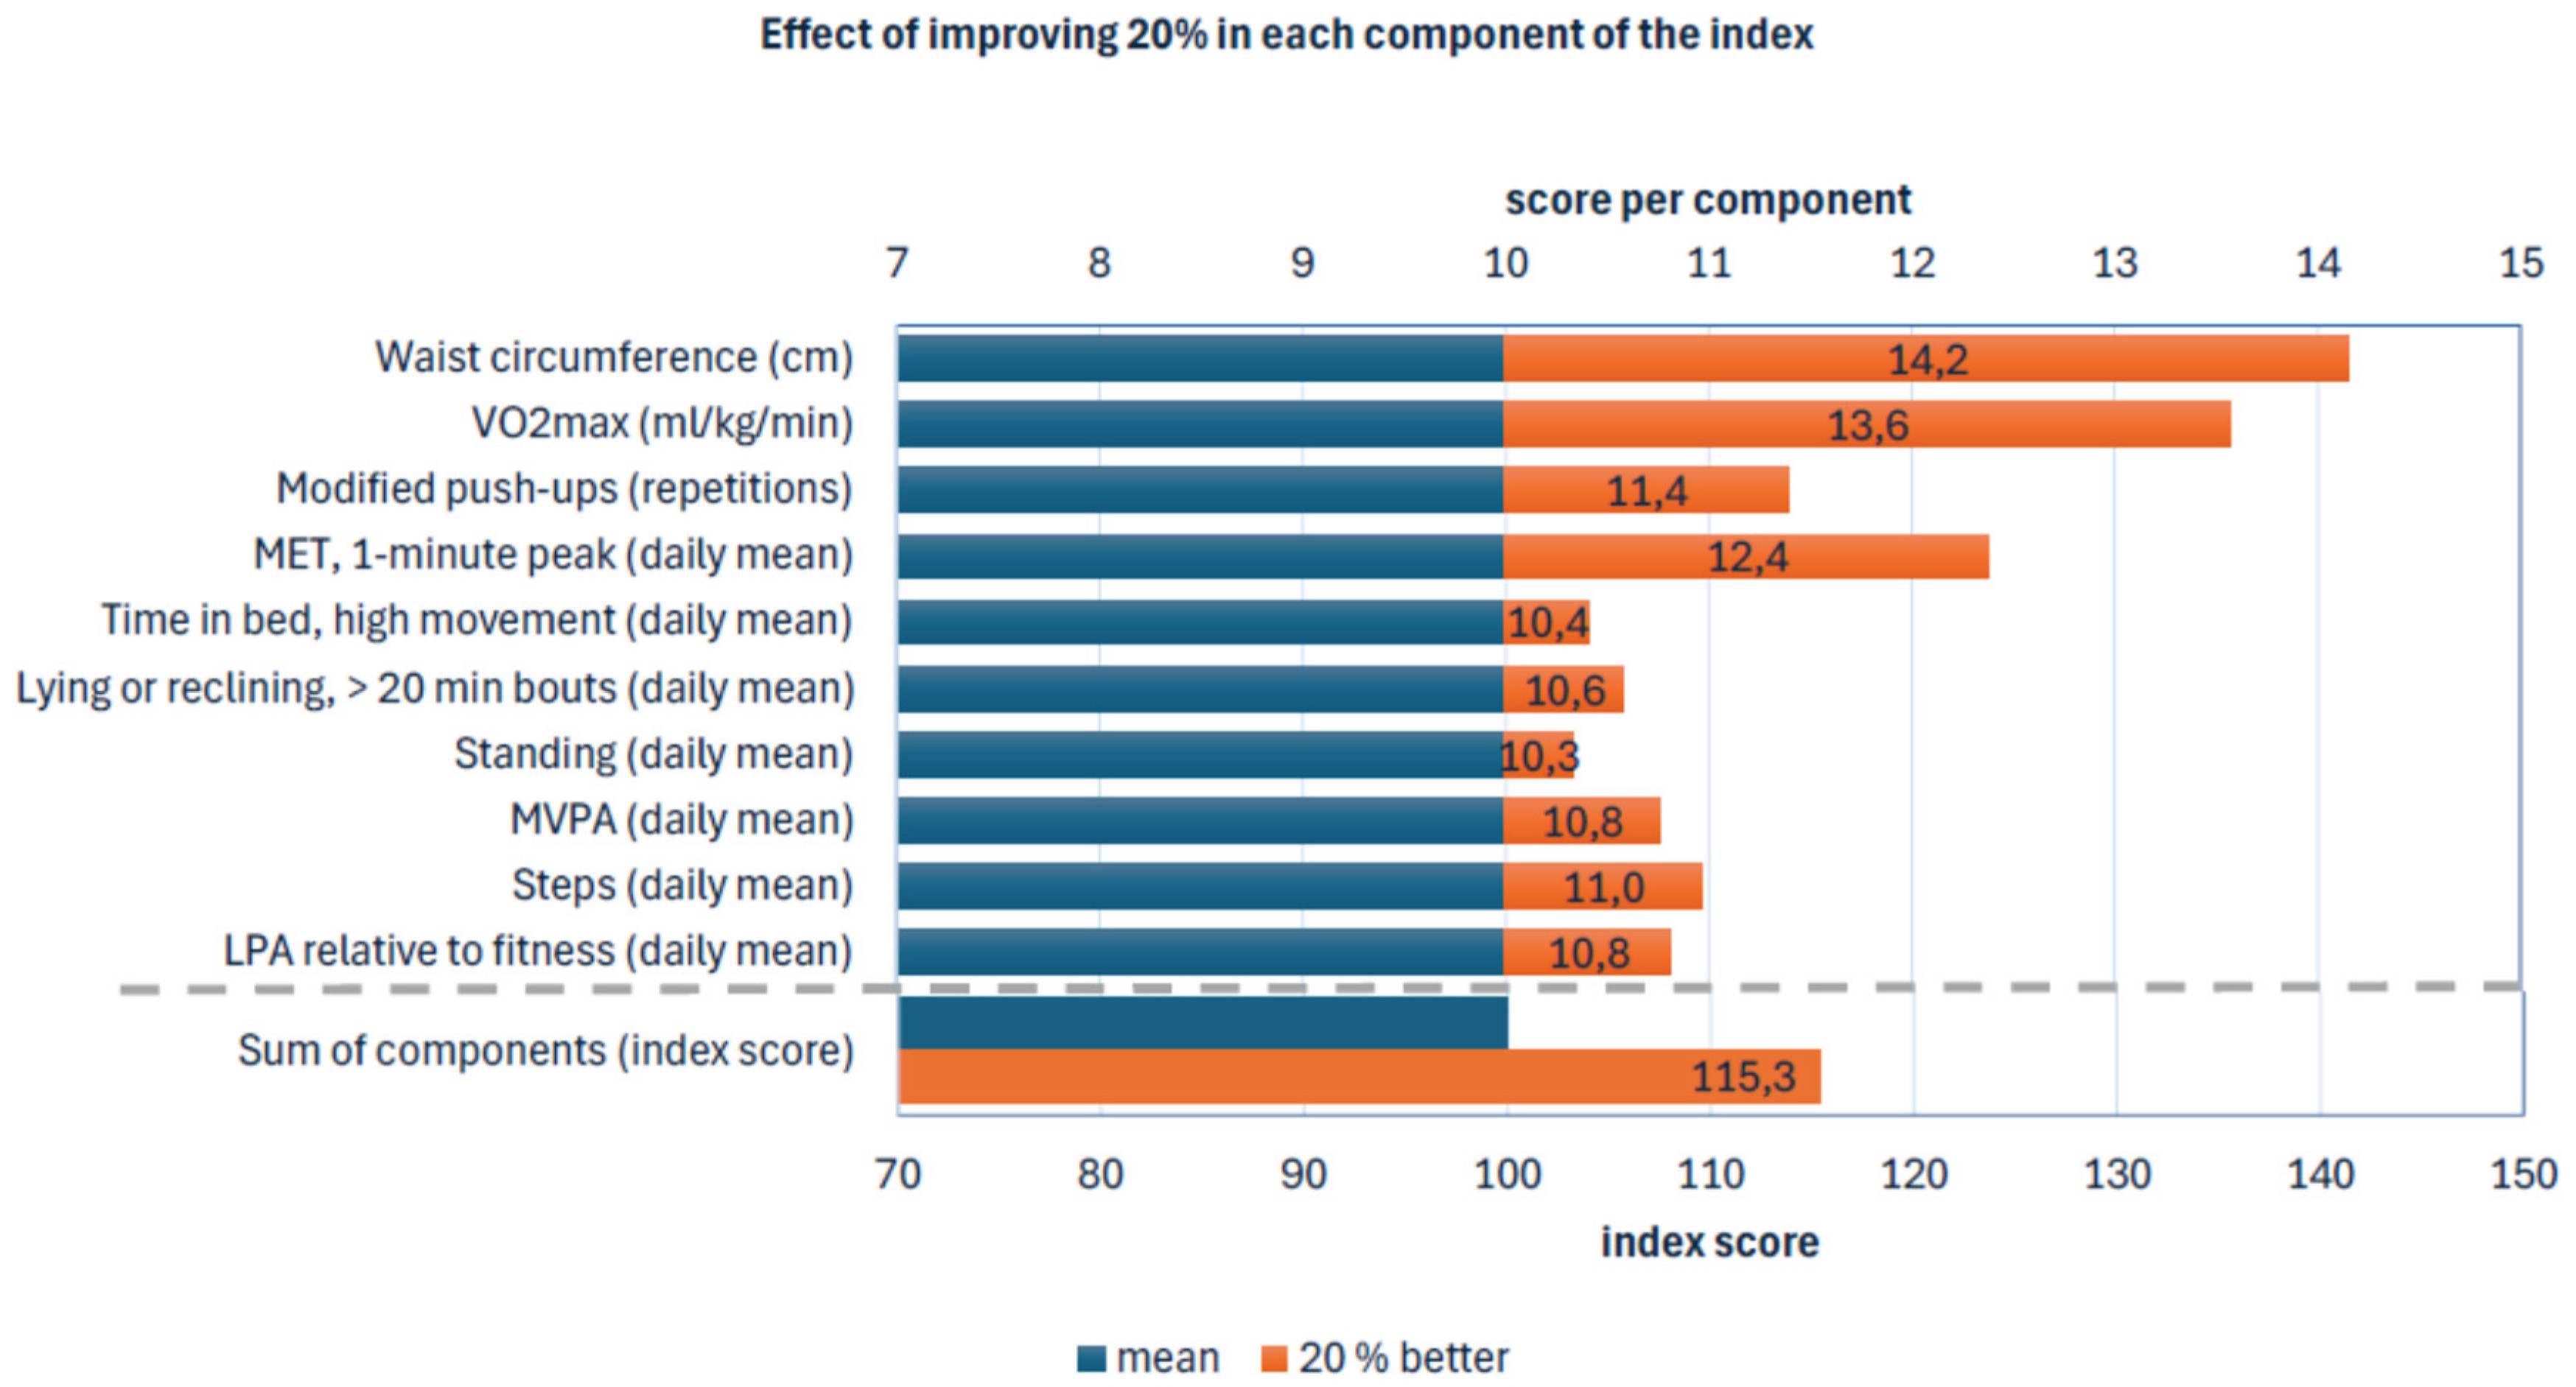

Table 1.
Subjective measures of functioning from FINFIT questionnaire.
| Variable | Type (range) |
| perceived fitness | categorical 1–4 |
| perceived health | categorical 1–4 |
| lifting 10 kg from the floor to the table | categorical 1–4 |
| carrying 6 kg for 100 m | categorical 1–4 |
| climbing 1 flight of stairs without resting | categorical 1–4 |
| climbing several flights of stairs without resting | categorical 1–4 |
| walking ½ km without resting | categorical 1–4 |
| running 100 m | categorical 1–4 |
| walking in the forest | categorical 1–4 |
| RAND-36: Physical functioning | numeric 0–100 |
| RAND-36: Sum of physical components | numeric 0–400 |
| RAND-36: Sum of mental components | numeric 0–400 |
Table 2.
Measures of physical functioning used as Z-scores.
| Category | Variables | Bout length/units |
| Sedentary behavior | lying, reclining, sitting, lying or reclining, lying or reclining or sitting | daily mean in minutes, > 1 minute, > 3 minutes, > 5 minutes, >10 minutes, >20 minutes, >30 minutes for lying or reclining or sitting |
| Standing | standing still | daily mean in minutes |
| Physical activity (absolute intensity) | LPA, MPA, VPA, MVPA, LPA or MVPA steps |
daily mean in minutes daily mean of step count |
| Physical activity (intensity relative to fitness) | LPA, MPA, VPA, MVPA, LPA or MVPA | daily mean in minutes |
| Metabolic equivalent | daily 1 minute mean, weekly 1-minute max, weekly 3-minute max, weekly 6-minute max, weekly 10-minute max, weekly 15-minute max, weekly 20-minute max, weekly 30-minute max | |
| Time in bed | HM, MM, LM, MM or HM, total, proportion of HM | daily mean in minutes |
| Body composition | BMI, waist circumference | kg/m2, cm |
| Physical fitness tests | 6MWT VO2max, 6MWTmeters, modified push-ups, 1 leg standing, jump test | ml/kg/min, m, repetitions, s, cm |
BMI= body mass index, HM=high-movement, LPA=light physical activity, LM=low-movement, MM=medium-movement, MPA=moderate physical activity, VPA=vigorous physical activity, MVPA=moderate-to-vigorous physical activity, 6MWT=6-min walking test.
Table 3.
Means, standard deviations (SD) and weight for the selected MePFIX variables.
| Variable | mean | SD | weight | mean/SD*weight |
| Waist circumference, men | 97.5 | 11.8 | -1.39 | -11.49 |
| Waist circumference, women | 88.2 | 13.2 | -1.39 | -9.29 |
| VO2max, men | 35.0 | 6.7 | 1.75 | 9.14 |
| VO2max, women | 31.7 | 6.4 | 1.75 | 8.67 |
| Modified push-ups, men | 12.1 | 3.9 | 1.24 | 3.85 |
| Modified push-ups, women | 9.7 | 3.9 | 1.24 | 3.08 |
| Mean of daily 1-minute maximum MET | 5.6 | 1.3 | 1.38 | 5.94 |
| TIB, HM, daily minutes | 91.9 | 39.4 | -0.44 | -1.03 |
| Lying or reclining, sum of > 20 min bouts | 202.0 | 92.2 | -0.66 | -1.45 |
| Standing, daily minutes | 112.4 | 54.9 | 0.40 | 0.82 |
| MVPA daily minutes | 46.5 | 26.4 | 1.07 | 1.88 |
| Daily step count | 7308 | 3028 | 1.00 | 2.41 |
| Daily LPA relative to fitness | 245.9 | 80.9 | 0.67 | 2.04 |
HM=high-movement, LPA=light physical activity, MET=metabolic equivalent, MVPA=moderate-to-vigorous physical activity, TIB=time in bed, VO2max=maximal oxygen uptake.
Disclaimer/Publisher’s Note: The statements, opinions and data contained in all publications are solely those of the individual author(s) and contributor(s) and not of MDPI and/or the editor(s). MDPI and/or the editor(s) disclaim responsibility for any injury to people or property resulting from any ideas, methods, instructions or products referred to in the content. |
© 2025 by the authors. Licensee MDPI, Basel, Switzerland. This article is an open access article distributed under the terms and conditions of the Creative Commons Attribution (CC BY) license (http://creativecommons.org/licenses/by/4.0/).
Copyright: This open access article is published under a Creative Commons CC BY 4.0 license, which permit the free download, distribution, and reuse, provided that the author and preprint are cited in any reuse.


