Submitted:
14 September 2025
Posted:
17 September 2025
You are already at the latest version
Abstract
Water is one of a fundamental natural resource and strategic compound. However, with socio-economic development, the water environment is being confronted with a series of problems such as aggravated pollution. Accurate monitoring of the water quality is the prerequisite and foundation for water environment supervision and governance. With the development of remote sensing and computer technologies, the retrieval of water quality parameters has attracted increasing attention from researchers and practitioners. This paper aims to present progress of remote sensing technique in water quality parameter retrieval methods and applications. The following aspects were investigated in this review: (a) water quality parameters retrieval data source; (b) water quality parameters retrieval models and evaluation metrics; (c) water quality parameters remote sensing retrieval applications; (d) some challenges and potential directions for water quality parameters retrieval. This review provides some support for re-searchers, as well as management departments, in theoretical research and application for remote sensing water quality parameters retrieval.
Keywords:
water quality
; remote sensing techniques
; retrieval models
; satellite data
1. Introduction
Water resources play a crucial role in the sustainability of human and ecological systems [1,2,3]. Rapid urbanization and socio-economic development have caused a series of environmental issues, such as water shortages and water pollution. Effective water quality monitoring is essential for addressing the threats of water environment deterioration, as well as effective supervision and governance of the water environment [4,5].
Traditionally, water quality monitoring is based on measurements at certain sampling points, which is time-consuming, expensive, and limited to small scales. Due to the advantages of large spatial and temporal coverages, remote sensing technology makes large-scale water quality parameters retrieval possible [6,7,8]. Continuous, stable, and high-quality remote sensing image data are a prerequisite for remote sensing water quality parameter retrieval. Since the first civilian Earth observation satellite (Landsat) was launched in 1972, many countries have launched satellite systems, which provide various and stable remote sensing images and water environment monitoring services [9,10,11,12,13]. In recent years, aerial remote sensing data, as well as ground data, have also provided rich data sources for water quality parameters retrieval [14,15,16].
Based on rich remote sensing data sources, scholars have explored various water quality parameter retrieval models and algorithms in the past few decades. Bibliometric analysis shows that the number of research publications has increased each year [17,18,19]. The water quality parameter retrieval models mainly include bio-optical, empirical, semi-empirical and artificial intelligence models (AI) [20,21,22,23]. The bio-optical models take into account the retrieval mechanism of water quality parameters with a higher accuracy. Empirical models establish mathematical relationships between water quality parameters and reflectance to obtain water quality parameters. Semi-empirical models consider the mechanism and spectral characteristics of water quality parameters. Compared with traditional empirical and semi-empirical models, AI models have unique advantages in explaining these complex relationships, as well as in achieving a higher accuracy.
The key to water quality parameters retrieval by remote sensing technique is to establish relationships between water quality parameters and the reflection of water bodies. Due to the distinct spectral characteristics, most research and applications have focused on three major components, namely, chlorophyll-a (Chl-a), total suspended solids (TSS), and colored dissolved organic matter (CDOM)[24,25] in early water quality remote sensing research. With the improvement of the spectral resolutions of sensors, some water quality parameters without obvious spectral response characteristics, such as the total nitrogen (TN), total phosphorus (TP), ammonia nitrogen (NH3N), dissolved oxygen (DO), and chemical oxygen demand (COD), are increasingly being retrieved [26,27,28,29].
In the past few decades, remote sensing technology has achieved great success in water quality parameter retrieval, with a series of high-precision and stable models aiding in water quality parameters retrieval. To demonstrate the advancements in the use of remote sensing for water quality parameters retrieval, this paper reviews the latest progress in quantitative water quality estimation in terms of the research trends, data sources, retrieval models, and several water quality parameters retrieval applications. Furthermore, the current challenges and possible solutions are discussed.
2. Bibliometric Analysis
The Web of Science (WOS) and CiteSpace were chosen as the analysis tools for the bibliometric analysis. According to the statement of “TI=(("water quality parameter" OR "water quality" OR "water parameter")NOT("land*")NOT("vegeta*") NOT("drink*")NOT("sea"))”and TS=("RS" OR "remote sens*" OR "remotely sens*" OR "spectr*"), the irrelevant literature was removed, and 1311 papers were obtained for subsequent analysis.
The trend of the number of water quality papers published during the period 2000–2024 is shown in Figure 1. The bar chart suggests that the publication volume of water quality papers has been increasing since 2000. To reflect the changes in the proportion of water quality literature to remote sensing literature, the proportion of water quality to remote sensing is also presented. The results indicate that water quality has attracted increasing attention in remote sensing research.
Figure 2 shows a pie chart of the proportion of published papers in the top 10 countries. The top 10 countries account for approximately 90% of the total publication of water quality remote sensing literature, forming the main pillars in this direction. More specifically, China has made significant contributions in this field, accounting for over 40% of all publications, followed by the United States (approximately 20%).
According to the publications of water quality remote sensing articles, a statistical table of the number of articles in publications indexed by the WOS was created (Table 1). In terms of publications, Remote Sensing accounts for the largest proportion (approximately 18%), followed by The Science of the Total Environment and Water (16.1% and 11.4%, respectively).
Figure 3 shows the keywords appearing in the collected articles from 2000 to 2024. An annual analysis of the keywords in the bibliographic data was conducted, and a co-citation analysis of the keywords was performed using CiteSpace. The time scale was from 2000 to 2024, the time slice was set to 1, and the node type was set to keywords. Labels were assigned based on the frequency of occurrence. The visualization graph shows that Chl-a, DO, TP, and TN were the main water quality parameters studied; rivers, lakes, and coastal zones were the main research areas; and machine learning and deep learning were the research methods commonly used.
3. Water Quality Parameters Retrieval Data Acquisition
The radiation information about water surfaces at various wavelengths can be recorded by remote sensors, which include satellite, aviation, ground, airship data. This section mainly introduces satellite, aviation and ground data.
3.1. Satellite Data
With the development of remote sensing technology and the increasing demand for applications, the United States, Europe, China, Russia, Japan, Canada, India, and other countries and regions have operated several satellite systems to provide considerable remote sensing images and Earth observation services in the past few decades. According to the spatial resolution, satellite remote sensing images can be divided into coarse-, medium-, and high-spatial-resolution images, the parameters of which are presented in Table 2.
The coarse-spatial-resolution satellites for water quality parameters retrieval mainly include the Advanced Very High Resolution Radiometer (AVHRR) onboard the National Oceanic and Atmospheric Administration (NOAA) satellites, Moderate Resolution Imaging Spectroradiometer (MODIS), Medium Resolution Imaging Spectrometer (MERIS), Geostationary Ocean Color Imager (GOCI), and Sentinel-3 Ocean and Land Color Instrument (OLCI)[30,31,32,33]. Due to the short revisit period and high signal-to-noise ratio, the coarse-spatial-resolution satellite data have significant advantages in large-scale and even global-scale water environment research.
Common medium-resolution remote sensing sensors mainly include the Landsat multi-spectral scanner (MSS)/thematic mapper (TM)/enhanced thematic mapper plus (ETM+)/operational land imager (OLI), SPOT 1–4, Hyperion, and Sentinel-2 Multi-spectral Instrument (MSI)[34,35,36,37]. Because of the good agreement of their temporal, spatial, and spectral resolutions, the medium-resolution optical images have large advantages in regional water quality parameters retrieval, while they have limitations in terms of instantaneous changes in retrieval results under cloudy and rainy weather.
The high-spatial-resolution remote sensing used in water quality parameters retrieval mainly include IKONOS, QuickBird, WorldView, SPOT series. It is worth noting that China has launched a series of high-resolution remote sensing satellites, including the Gaofen (GF), Zhuhai, Ziyuan (ZY) and Beijing series satellites in recent years. These high-spatial-resolution satellites have effectively promoted the application of water environment monitoring, especially in urban areas[38,39,40].
3.2. Aviation Data
With the miniaturization of hardware equipment, multispectral and hyperspectral remote sensing data based on human-machine and unmanned aerial vehicle (UAV) platforms have begun to be applied in the field of water quality parameters retrieval [41,42,43]. Compared with satellite platform, the flight time, heights and route of the aircraft platform can be selected according to the actual demand. Image data obtained by aircraft platform with a higher spatial resolution, which can reflect the spectral and spatial information about water bodies better, thus improving the accuracy of water quality parameters retrieval [44,45,46,47].
The commonly used manned airborne systems include HyMAP-C developed in Australia, the Prob series developed in the United States, CASI/SASI/TASI developed in Canada, AISA+ developed in Finland, and PHI developed in China. Current UAV platform-based hyperspectral equipment mainly includes OCI developed in the United States, SPECIM developed in Finland, HySpex developed in Norway, and small imaging hyperspectral systems developed by the Changchun Institute of Optics, Fine Mechanics and Physics, the Shanghai Institute of Technical Physics, and Aerospace Information Research Institute, Chinese Academy of Sciences. Table 3 lists the technical specifications of common airborne hyperspectral remote sensors.
3.3. Ground Data
Field spectrometers can flexibly and inexpensively obtain spectral data on ground objects, which is widely used for water spectral data acquisition[48,49,50]. Currently, the main manufacturers of field spectrometers include Ocean Optics (US), ASD (US), and Avantes (Netherlands). Ground spectrometers commonly used in water spectra data acquisition include the FieldSpec 4, USB4000, and Torus series miniature spectrometers. Although micro spectrometers cannot compare with large spectrometers in resolution and spectral range, they have the advantages of portability, intelligence, and integrations. The technical specifications of common ground field spectrometers are presented in Table 4.
4. Water Quality Parameters Retrieval Models and Evaluation
4.1. Bio-Optical Model
The bio-optical model is based on radiation transmission models. The upstream and downstream irradiance of the water body is calculated, and then, the relationship between the upstream and downstream irradiance, absorption coefficient, and backscattering coefficient of each component of the water body is established[51,52,53]. The principle of the bio-optical model is shown in the equation (1):
where is the ratio of the upward irradiance to downward irradiance on the surface of the water body at wavelength , is the absorption coefficient of the water body, is the backscattering coefficient of the water body, and is a variable parameter. and are the linear sums of the contributions of each component of the water body.
The bio-optical model has a clear theoretical basis and physical significance, and it depends less on the measured sample points, which makes it easy to analyze sources of error with higher universality[54,55]. However, the composition of the water body and radiation transmission procedure are rather complex, and many input parameters (such as inherent optical characteristics, surface tourism characteristics, and water quality variables) still need to be measured, which limits practical applications. Some examples of water quality parameters studied using bio-optical models are presented in Table 5.
4.2. Empirical Models
Empirical models were developed in early applications for water quality parameter retrieval using multispectral remote sensing data. In these models, the correlations between the remote sensing reflectance and water quality parameter values are calculated, and then, the optimal band or band combination is selected. Finally, the water quality parameter values of unmeasured points are calculated through the statistical relationships established[60,61,62,63,64].
The advantages of empirical models are that the relationships between the remote sensing reflectance and water quality parameters are easy to establish and that the model is simple and feasible. The disadvantage is that the explanation of the model mechanism is insufficient, resulting in poor applicability of the model. It is also easily limited by the research area and data. Empirical models mainly include the single band method, logarithmic method, spectral differentiation method, ratio method, and difference method[65,66]. The calculation equations are presented in Table 6.
4.3. Semi-Empirical Models
Semi-empirical models were developed for the application of hyperspectral remote sensing in water quality parameters retrieval. Based on the empirical model, the semi-empirical model considers the spectral characteristics and other prior knowledge of water quality parameter retrieval[72,73,74]. Then, the optimal band or band combination is selected, and the relationships between remote sensing reflectance and water quality parameters are established using appropriate mathematical methods.
Semi-empirical models partially make up for the defects of empirical models in water quality parameter retrieval, while they are limited to a special time and region because they depend on synchronization of the measured water quality data and remote sensing observation data[66,75]. Semi-empirical models commonly used for water quality parameter retrieval include the three-band method, four-band method, APPLE model, and Tassan model, whose calculation equations are presented in Table 7.
4.4. Artificial Intelligence Model
4.4.1. Machine Learning Model
As a branch of computer science, machine learning models have been widely applied in water quality parameter retrieval due to its good computational performances and nonlinear mapping abilities[80,81]. Many researchers have analyzed the relationships between water quality parameters and the spectral reflectance based on measured data[82,83,84]. The influence mechanism of spectral characteristics of various elements in water bodies is unclear, while machine learning models has certain advantages in solving these complex problems because of its black box mode, as well as in effectively improving the accuracy of water quality parameter retrieval.
The machine learning water quality parameters retrieval models commonly used mainly include support vector regression (SVR), random forest (RF), extreme gradient boosting (XGBoost), adaptive boosting (Adaboost), multilayer perceptron (MLP), backpropagation network (BP)[85,86,87]. Similar to empirical and semi-empirical models, the accuracy of machine learning models is also greatly affected by the study area and sample point distribution. Some studies on water quality parameter retrieval using machine learning models are listed in Table 8.
4.4.2. Deep Learning Model
With the development of computer technology and the improvement of the performance of computer hardware equipment, deep learning models have been shown to have great superiority in remote sensing image classification and spectral information reconstruction, which provide new technical methods for water quality parameters retrieval. Traditional regression methods have difficulty extracting deep spectral information from spectral data. There are multiple hidden layers between the input and output layers of deep learning models, which can effectively simulate complex nonlinear relationships between spectral and water quality parameters data so as to achieve a higher accuracy in water quality parameter retrieval and better revealing the spatiotemporal distribution patterns of water quality parameters [94,95,96,97]. However, deep learning models also have problems such as unclear mechanisms and low model universality. Some examples of the use of deep learning models to invert water quality parameters are presented in Table 9.
4.5. Model Evaluation Metrics
Appropriate evaluation metrics can be used to assess the accuracy of model training, over-fitting or under-fitting correction, and model transferability. Based on the research status and progress, the following model evaluation metrics are summarized: the coefficient of determination (R2), root mean square error (RMSE), mean square error (MSE), mean absolute error (MAE), relative error (RE), and residual prediction deviation (RPD). The equations of these metrics are as equation (2) to (7):
where is the average value, and and are the observed and predicted values of observation point i, respectively. Among these metrics, is the most commonly used and accepted evaluation metric. Excessive pursuit of a higher value may lead to over-fitting and poor transferability of the model. Therefore, is usually used in combination with other evaluation metrics to balance the fitting accuracy, portability, and computational complexity of the model, as well as enabling a more objective and comprehensive evaluation of the model.
5. Water Quality Parameter Retrieval Via Remote Sensing Techniques
5.1. Chlorophyll-a
Chl-a is the most basic indicator of the trophic state of water bodies, which can indicate the distribution of plankton biomass[103,104]. The spectral characteristics of chlorophyll include strong absorption between 450 and 475 nm and at 670 nm, and peaks at 550 nm and near 700 nm[105,106]. The reflection peak at 700 nm is a typical spectral feature of chlorophyll-a, which is of great significance for estimating chlorophyll in water bodies. The peak position of water spectra shifts from approximately 680 nm to 710 nm as the peak amplitude value increases due to an increase in the Chl-a concentration.
In addition to the optical properties of phytoplankton, the optical properties of inland and coastal water bodies are determined by a composite of dissolved organic matter, dead particles, organic matter, and inorganic particles from land-based sources[113,114,115,116]. Therefore, retrieval of the Chl-a concentration is much more complex and less accurate, and as a result, these components are not statistically correlated. Based on the absorption and reflection characteristics, a series of algorithms have been developed to retrieve the Chl-a concentration. Several models for retrieving the Chl-a concentration are listed in Table 10.
5.2. Total Suspended Solids
The TSS concentration is one of the key water quality parameters for water bodies. It is related to incoming sunlight, which affects photosynthesis for the growth of algae and plankton, as well as the primary productivity of the water body. The TSS have reflectance spectral characteristics at 580–680 nm and 700–900 nm. Many studies have shown that when chosen appropriately, a single band or a combination of bands can achieve a high accuracy in TSS retrieval[117,118]. However, the reflectance of water is affected by the complex substances in the water body, so different spectral bands can be used for TSS retrieval. Some models for retrieving the TSS concentration are summarized in Table 11.
5.3. Total Phosphorus and Total Nitrogen
The TP and TN in water bodies mainly come from the external environment and the release of the water itself[124,125]. Excessive nitrogen and phosphorus concentrations can lead to microbial proliferation, the rapid growth of plankton, and eutrophication of water bodies, resulting in further deterioration of the water quality. Scientific and accurate retrieval of nitrogen and phosphorus is the premise and foundation for controlling nitrogen and phosphorus source pollution.
Currently, research on water quality parameters retrieval through remote sensing has mainly focused on the three major components, including the concentrations of chlorophyll, TSS and CDOM. Numerous scholars have conducted studies on TP and TN retrieval by remote sensing, while the TP and TN concentrations, as optically insensitive water quality parameters, are theoretically difficult to invert using physical models, which poses significant challenges[126,127,128,129]. The currently used methods for TP and TN retrieval can be mainly divided into direct and indirect methods.
5.3.1. Direct Methods
The direct methods establish a retrieval model for the TP and TN concentrations by calculating the relationships between the remote sensing reflectance (Rrs) and the measured water quality parameters. The direct methods estimate the TP and TN concentrations using statistical methods. However, the direct methods fail to consider the underlying mechanisms of TP and TN, and the retrieval results are largely dependent on the study and measured data, leading to limited applicability. Relevant studies on the retrieval of the TP and TN concentrations using direct methods are listed in Table 12.
5.3.2. Indirect Methods
Chl-a, TSS, and CDOM have well-defined optical properties and spectral responses. Many studies have shown that there is a correlation between the chlorophyll, TP, and TN concentrations, which provides a theoretical basis for TP and TN retrieval using chlorophyll-sensitive wavelengths[138,139,140,141,142]. The TP and TN concentrations are related to the concentrations of optically active water quality parameters, which can be determined using the equation (8):
That is, the concentrations of TP and TN are positively correlated with the Chl-a, TSS, and CDOM concentrations and other water quality parameters, and the concentrations of these parameters can be obtained by remote sensing methods.
Based on equations (8) and (9), the relationship between the TP and TN concentrations of the water and the remote sensing reflectance is as following equation (10):
The indirect methods establish the relationship between the TP and TN concentrations and optically active water quality parameters, and then, the TP and TN concentrations are calculated indirectly according to the retrieval results of the optically active water quality parameters[143]. Compared with the direct methods, the indirect methods consider the remote sensing retrieval mechanism of the TP and TN concentrations. The retrieval results of the optically active water quality parameters, as well as the correlation between the optically active water quality parameters, affect the accuracy of the retrieval results of TP and TN.
6. Challenges and Future Development
Water Quality Parameters Retrieval of Small-scale River and Lakes
Currently, most satellite data are mainly suitable for large-scale water quality parameters retrieval. There are several challenges in water quality parameters retrieval of small lakes and narrow rivers in urban areas because of the limitations in fine spectral, spatial, and temporal resolutions of remote sensing data. Therefore, future research could focus on integrate satellite, aviation, and ground data to meet the needs of long-term and fine-scale regional studies. Meanwhile, regional high-spatiotemporal-resolution data can be obtained through autonomously operate and control satellites along any trajectory, or through data fusion methods.
Interpretable Deep Learning Water Quality Parameter Retrieval Models
Although machine learning models have the significant advantage of the occurrence of nonlinear relationships between the water reflectance and water quality parameters, there are still some challenges. First, a single machine learning model has some shortcomings such as over-fitting, high dimensionality, and slow convergence. Second, data-driven methods, represented by empirical and machine learning methods, have difficulty explaining physical mechanisms, which limits the accuracies and generalization abilities of these models. The attainment of a large amount of measured data and the use of integrated machine learning are notable research directions. In addition, model optimization and improvement should be combined with inherent optical properties to enrich the physical significance of data-driven methods.
Water Quality Parameter Retrieval Models Integrating Multiple Environmental Factors
Most previous studies focused on three major components of the ocean color, namely the Chl-a, CDOM, and TSS concentrations, while additional parameters (including TP, TN, NH3-N, DO concentrations, and COD) are not well investigated because of the weak optical characteristics. Given the complexity of the water environment, revised water quality models are generally established for certain regional water bodies, to retrieval water quality parameters more accurately. In future research, the influences of various environmental factors should be considered to retrieval multiple water quality parameters.
7. Conclusions
Good water quality is crucial for human survival and health, ecological balance, and sustainable socio-economic development. Over the past few decades, numerous scholars have developed a series of algorithms for remote sensing water quality parameter retrieval based on multi-platform remote sensing data. This review provides a comprehensive introduction to remote sensing water quality parameter retrieval, including literature analysis, remote sensing data sources, retrieval models, several water quality parameter retrieval application, current challenges, and future development directions.
From 2000 to 2024, the number of published papers on water quality remote sensing increased each year. The research hotspots mainly included remote sensing, Chl-a, DO, TP, and TN. A series of satellite, aviation, and ground data were used for remote sensing water quality parameter retrieval. In terms of the spatial resolution, remote sensing data can be divided into high-, medium-, and low-resolution data. Water quality parameter retrieval models include bio-optical, empirical, semi-empirical, and AI models. Several water quality parameters (such as Chl-a, TSS, TP, and TN) have been extensively studied. Among them, Chl-a and TSS have distinct spectral characteristics, thus can be retrieved by empirical or semi-empirical models. However, the optical characteristics of TP and TN are unclear, usually retrieved using both direct and indirect methods. Future research could establish interpretable deep learning models considering multiple environmental factors to retrieval water quality parameters more accurately. At the same time, water quality parameters retrieval of small-scale river and lakes should also be paid more attention.
Author Contributions
Conceptualization, L.Z. (Linshan Zhang) and L.Z. (Lifu Zhang); methodology, L.Z. (Linshan Zhang) and L.Z. (Lifu Zhang); software, L.Z. (Linshan Zhang) and L.C.; validation, L.Z. (Linshan Zhang) and D.Z.; formal analysis, L.Z. (Linshan Zhang) and Y.Z.; investigation, L.Z. (Linshan Zhang) and Y.G.; writing—original draft preparation, L.Z. (Linshan Zhang); writing—review and editing, L.Z. (Linshan Zhang), L.Z. (Lifu Zhang), H.Z. and J.H.; funding acquisition, L.Z. (Lifu Zhang). All authors have read and agreed to the published version of the manuscript.”
Funding
This research was funded by the National Key Research and Development Program of China (grant no. 2022YFF0904400)
Acknowledgments
The authors also would like to thank anonymous reviewers for their great comments and suggestions.
Conflicts of Interest
The authors declare no conflicts of interest.
Abbreviations
| Adaboost | adaptive boosting |
| BP | backpropagation network |
| CDOM | colored dissolved organic matter |
| Chl-a | chlorophyll-a |
| COD | chemical oxygen demand |
| DO | dissolved oxygen |
| MAE | mean absolute error |
| ML | machine learning |
| MLP | multilayer perceptron |
| MSE | mean square error |
| R2 | coefficient of determination |
| RE | relative error |
| RF | random forest |
| RMSE | root mean square error |
| RPD | residual prediction deviation |
| Rrs | remote sensing reflectance |
| SVR | support vector regression |
| TN | total nitrogen |
| TP | total phosphorus |
| TSS | total suspended solids |
| UAV | unmanned aerial vehicle |
| WOS | Web of Science |
| XGBoost | extreme gradient boosting |
References
- Wang, H.H.; Liu, C.; Li, L.; Kong, Y.H.; Akbar, A.; Zhou, X.T. High-precision inversion of urban river water quality via integration of riparian spatial structures and river spectral signatures. Water Research. 2025, 278, 12. [Google Scholar] [CrossRef] [PubMed]
- Shu, P.; Aslam, R.W.; Naz, I.; Ghaffar, B.; Kucher, D.E.; Quddoos, A.; Raza, D.; Abdullah-Al-Wadud, M.; Zulqarnain, R.M. Deep Learning-Based Super-Resolution of Remote Sensing Images for Enhanced Groundwater Quality Assessment and Environmental Monitoring in Urban Areas. Ieee Journal of Selected Topics in Applied Earth Observations and Remote Sensing. 2025, 18, 7933–7949. [Google Scholar] [CrossRef]
- Zhang, L.; Wang, S.; Cen, Y.; Huang, C.; Zhang, H.; Sun, X.; Tong, Q. Monitoring Spatio-Temporal Dynamics in the Eastern Plain Lakes of China Using Long-Term MODIS UNWI Index. Remote Sensing. 2022, 14, 985. [Google Scholar] [CrossRef]
- Xia, K.; Wu, T.X.; Li, X.T.; Wang, S.D.; Tang, H.Z.; Zu, Y.; Yang, Y.Y. A novel method for assessing water quality status using MODIS images: A case study of large lakes and reservoirs in China. Journal of Hydrology. 2024, 638, 16. [Google Scholar] [CrossRef]
- Lai, Y.Q.; Zhang, J.; Li, W.W.; Song, Y.Y. Water quality monitoring of large reservoirs in China based on water color change from 1999 to 2021. Journal of Hydrology. 2024, 633, 15. [Google Scholar] [CrossRef]
- Zhang, L.; Zhang, S.; Rehman, A.U.R.; Wang, S.; Sun, X.; Liu, Y.; Tong, Q. A revolutionary multi-dimensional data format for remote sensing. The Innovation. 2025, 6. [Google Scholar] [CrossRef]
- Liang, Y.C.; Ding, F.Y.; Liu, L.; Yin, F.; Hao, M.M.; Kang, T.T.; Zhao, C.P.; Wang, Z.T.; Jiang, D. Monitoring water quality parameters in urban rivers using multi-source data and machine learning approach. Journal of Hydrology. 2025, 648, 15. [Google Scholar] [CrossRef]
- Zhou, X.T.; Liu, C.; Carrion, D.; Akbar, A.; Wang, H.H. Spectro-environmental factors integrated ensemble learning for urban river network water quality remote sensing. Water Research. 2024, 267, 15. [Google Scholar] [CrossRef]
- Cao, Z.G.; Hu, C.M.; Ma, R.H.; Duan, H.T.; Liu, M.; Loiselle, S.; Song, K.S.; Shen, M.; Liu, D.; Xue, K. MODIS observations reveal decrease in lake suspended particulate matter across China over the past two decades. Remote Sensing of Environment. 2023, 295, 18. [Google Scholar] [CrossRef]
- Wang, X.Y.; Jiang, Y.Y.; Jiang, M.L.; Cao, Z.G.; Li, X.; Ma, R.H.; Xu, L.G.; Xiong, J.F. Estimation of Total Phosphorus Concentration in Lakes in the Yangtze-Huaihe Region Based on Sentinel-3/OLCI Images. Remote Sensing. 2023, 15, 18. [Google Scholar] [CrossRef]
- Ren, J.H.; Zhou, H.Y.; Tao, Z.; Ge, L.; Song, K.S.; Xu, S.Q.; Li, Y.; Zhang, L.L.; Zhang, X.Y.; Li, S.J. Long-term monitoring chlorophyll-a concentration using HJ-1 A/B imagery and machine learning algorithms in typical lakes, a cold semi-arid region. Opt. Express. 2024, 32, 16371–16397. [Google Scholar] [CrossRef] [PubMed]
- Yin, Z.; Li, J.; Zhang, B.; Liu, Y.; Yan, K.; Gao, M.; Xie, Y.; Zhang, F.; Wang, S. Increase in chlorophyll-a concentration in Lake Taihu from 1984 to 2021 based on Landsat observations. Science of the Total Environment. 2023, 873. [Google Scholar] [CrossRef] [PubMed]
- Zhao, Z.L.; Shi, K.; Zhang, Y.L. Remote sensing estimation of dissolved organic carbon concentrations in Chinese lakes based on Landsat images. Journal of Hydrology. 2024, 638, 15. [Google Scholar] [CrossRef]
- Guo, H.W.; Huang, J.J.; Zhu, X.T.; Tian, S.; Wang, B.L. Spatiotemporal variation reconstruction of total phosphorus in the Great Lakes since 2002 using remote sensing and deep neural network. Water Research. 2024, 255, 15. [Google Scholar] [CrossRef]
- Cook, K.V.; Beyer, J.E.; Xiao, X.M.; Hambright, D. Ground-based remote sensing provides alternative to satellites for monitoring cyanobacteria in small lakes. Water Research. 2023, 242, 12. [Google Scholar] [CrossRef]
- Cai, X.L.; Lei, S.H.; Li, Y.M.; Li, J.Z.; Xu, J.; Lyu, H.; Li, J.D.; Dong, X.Z.; Wang, G.L.; Zeng, S. Humification levels of dissolved organic matter in the eastern plain lakes of China based on long-term satellite observations. Water Research. 2024, 250, 14. [Google Scholar] [CrossRef]
- Ma, T.; Zhang, D.; Li, X.; Huang, Y.; Zhang, L.; Zhu, Z.; Sun, X.; Lan, Z.; Guo, W. Hyperspectral remote sensing technology for water quality monitoring: knowledge graph analysis and Frontier trend. Frontiers in Environmental Science. 2023, 11. [Google Scholar] [CrossRef]
- Yang, Z.; Liu, C.; Nie, R.; Zhang, W.; Zhang, L.; Zhang, Z.; Li, W.; Liu, G.; Dai, X.; Zhang, D.; et al. Research on Uncertainty of Landslide Susceptibility Prediction—Bibliometrics and Knowledge Graph Analysis. Remote Sensing. 2022, 14. [Google Scholar] [CrossRef]
- Duan, L.; Liu, C.; Xu, H.; Huali, H.; Liu, H.; Yan, X.; Liu, T.; Yang, Z.; Liu, G.; Dai, X.; et al. Susceptibility Assessment of Flash Floods: A Bibliometrics Analysis and Review. Remote Sensing. 2022, 14. [Google Scholar] [CrossRef]
- Kowe, P.; Ncube, E.; Magidi, J.; Ndambuki, J.M.; Rwasoka, D.T.; Gumindoga, W.; Maviza, A.; de jesus Paulo Mavaringana, M.; Kakanda, E.T. Spatial-temporal variability analysis of water quality using remote sensing data: A case study of Lake Manyame. Scientific African. 2023, 21. [Google Scholar] [CrossRef]
- Adjovu, G.E.; Stephen, H.; James, D.; Ahmad, S. Overview of the Application of Remote Sensing in Effective Monitoring of Water Quality Parameters. Remote Sensing. 2023, 15. [Google Scholar] [CrossRef]
- Yang, H.; Kong, J.; Hu, H.; Du, Y.; Gao, M.; Chen, F. A Review of Remote Sensing for Water Quality Retrieval: Progress and Challenges. Remote Sensing. 2022, 14. [Google Scholar] [CrossRef]
- Chen, J.; Chen, S.; Fu, R.; Li, D.; Jiang, H.; Wang, C.; Peng, Y.; Jia, K.; Hicks, B.J. Remote Sensing Big Data for Water Environment Monitoring: Current Status, Challenges, and Future Prospects. Earth's Future. 2022, 10. [Google Scholar] [CrossRef]
- Gomes, A.; Bernardo, N.; Carmo, A.; Rodrigues, T.; Alcântara, E. Diffuse Attenuation Coefficient Retrieval in CDOM Dominated Inland Water with High Chlorophyll-a Concentrations. Remote Sensing. 2018, 10, 1063. [Google Scholar] [CrossRef]
- Luviano Soto, I.; Sánchez, Y.C.; Raya, A. Water quality polluted by total suspended solids classified within an artificial neural network approach. Water Quality Research Journal. 2025, 60, 214–228. [Google Scholar] [CrossRef]
- Murray, C.; Larson, A.; Goodwill, J.; Wang, Y.; Cardace, D.; Akanda, A.S. Water Quality Observations from Space: A Review of Critical Issues and Challenges. Environments. 2022, 9. [Google Scholar] [CrossRef]
- Yang, L.; Driscol, J.; Sarigai, S.; Wu, Q.; Lippitt, C.D.; Morgan, M. Towards Synoptic Water Monitoring Systems: A Review of AI Methods for Automating Water Body Detection and Water Quality Monitoring Using Remote Sensing. Sensors. 2022, 22. [Google Scholar] [CrossRef]
- Zhu, X.; Wen, Y.; Li, X.; Yan, F.; Zhao, S. Remote Sensing Inversion of Typical Water Quality Parameters of a Complex River Network: A Case Study of Qidong’s Rivers. Sustainability. 2023, 15. [Google Scholar] [CrossRef]
- Wang, H.; Zhang, L.; Wu, R.; Zhao, H. Enhancing Dissolved Oxygen Concentrations Prediction in Water Bodies: A Temporal Transformer Approach with Multi-Site Meteorological Data Graph Embedding. Water. 2023, 15. [Google Scholar] [CrossRef]
- Lv, J.N.; Feng, L.; Zhao, D. Validation of Global Gridded Aerosol Models in Inland/Coastal Water Atmospheric Correction for MODIS, VIIRS, and Landsat. Ieee Transactions on Geoscience and Remote Sensing. 2024, 62, 10. [Google Scholar] [CrossRef]
- Shi, J.R.; Qin, H.; Cheng, J.H.; Xu, J.; Liu, G.; Li, Z.C.; Song, K.S. Real-time detection of harmful algal blooms using GOCI II and buoy-based dissolved oxygen variations. Environ. Res. Lett. 2025, 20, 14. [Google Scholar] [CrossRef]
- Li, J.; Li, Y.; Song, K.S.; Liu, G.; Shao, S.D.; Han, B.Q.; Zhou, Y.J.; Lyu, H. Satellite remote sensing of turbidity in Lake Xingkai using eight years of OLCI observations. Journal of Environmental Management. 2025, 377, 19. [Google Scholar] [CrossRef]
- Guan, Q.; Feng, L.; Hou, X.; Schurgers, G.; Zheng, Y.; Tang, J. Eutrophication changes in fifty large lakes on the Yangtze Plain of China derived from MERIS and OLCI observations. Remote Sensing of Environment. 2020, 246, 111890. [Google Scholar] [CrossRef]
- Qiu, Z.Q.; Liu, D.; Duan, M.W.; Chen, P.P.; Yang, C.; Li, K.Y.; Duan, H.T. Four-decades of sediment transport variations in the Yellow River on the Loess Plateau using Landsat imagery. Remote Sensing of Environment. 2024, 306, 16. [Google Scholar] [CrossRef]
- Zheng, Y.; Wei, C.; Fu, H.; Li, H.; He, Q.; Yu, D.; Fu, M. Spatial-temporal evolution analysis of pollutants in Daitou River watershed based on Sentinel-2 satellite images. Ecological Indicators. 2024, 166. [Google Scholar] [CrossRef]
- Wang, X.; Jiang, Y.; Jiang, M.; Cao, Z.; Li, X.; Ma, R.; Xu, L.; Xiong, J. Estimation of Total Phosphorus Concentration in Lakes in the Yangtze-Huaihe Region Based on Sentinel-3/OLCI Images. Remote Sensing. 2023, 15. [Google Scholar] [CrossRef]
- Hu, M.Q.; Ma, R.H.; Xue, K.; Cao, Z.G.; Chen, X.; Xiong, J.F.; Xu, J.D.; Huang, Z.H.; Yu, Z.Y. A dataset of trophic state index for nation-scale lakes in China from 40-year Landsat observations. Sci. Data. 2024, 11, 14. [Google Scholar] [CrossRef]
- Huang, C.; Zheng, Z.B.; Li, Y.M.; Lyu, H.; Huang, C.C.; Ren, J.L.; Chen, N.; Bi, S.; Liu, G.; Li, Y.; et al. Enhanced Algorithm for Water Transparency Estimation in Turbid Plateau Waters Using Orbita Hyperspectral (OHS) Imagery. Ieee Transactions on Geoscience and Remote Sensing. 2025, 63, 16. [Google Scholar] [CrossRef]
- Li, J.Z.; Zheng, Z.B.; Li, Y.M.; Lyu, H.; Ren, J.L.; Cai, X.L.; Du, C.; Chen, N.; Liu, G.; Lei, S.H.; et al. A hybrid algorithm for estimating total nitrogen from a large eutrophic plateau lake using Orbita hyperspectral (OHS) satellite imagery. International Journal of Applied Earth Observation and Geoinformation. 2024, 131, 18. [Google Scholar] [CrossRef]
- Feng, Y.; Zhang, J.; Guo, S.; Zhang, Y.; Zhang, Z. High precision water quality retrieval in Dianchi Lake using Gaofen 5 data and machine learning methods. Scientific Reports. 2025, 15. [Google Scholar] [CrossRef]
- Lee, J.-S.; Baek, J.-Y.; Shin, J.; Kim, J.-S.; Jo, Y.-H. Suspended Sediment Concentration Estimation along Turbid Water Outflow Using a Multispectral Camera on an Unmanned Aerial Vehicle. Remote Sensing. 2023, 15. [Google Scholar] [CrossRef]
- Ma, Q.; Li, S.; Qi, H.; Yang, X.; Liu, M. Rapid Prediction and Inversion of Pond Aquaculture Water Quality Based on Hyperspectral Imaging by Unmanned Aerial Vehicles. Water. 2025, 17. [Google Scholar] [CrossRef]
- Zhao, B.; Zhang, A.; Wang, H.; Pang, J.; Hou, Y.; Ma, P.; Zhao, B. Water function zone: A method to improve the accuracy of remote sensing retrieval of water bodies. Ecological Indicators. 2024, 164. [Google Scholar] [CrossRef]
- Wasehun, E.T.; Hashemi Beni, L.; Di Vittorio, C.A. UAV and satellite remote sensing for inland water quality assessments: a literature review. Environmental Monitoring and Assessment. 2024, 196. [Google Scholar] [CrossRef]
- Lao, Z.; Fu, B.; Wei, Y.; Deng, T.; He, W.; Yang, Y.; He, H.; Gao, E. Retrieval of chlorophyll content for vegetation communities under different inundation frequencies using UAV images and field measurements. Ecological Indicators. 2024, 158. [Google Scholar] [CrossRef]
- Qun'ou, J.; Lidan, X.; Siyang, S.; Meilin, W.; Huijie, X. Retrieval model for total nitrogen concentration based on UAV hyper spectral remote sensing data and machine learning algorithms – A case study in the Miyun Reservoir, China. Ecological Indicators. 2021, 124. [Google Scholar] [CrossRef]
- Zhang, D.; Zhang, L.; Sun, X.; Gao, Y.; Lan, Z.; Wang, Y.; Zhai, H.; Li, J.; Wang, W.; Chen, M.; et al. A New Method for Calculating Water Quality Parameters by Integrating Space–Ground Hyperspectral Data and Spectral-In Situ Assay Data. Remote Sensing. 2022, 14. [Google Scholar] [CrossRef]
- Malthus, T.J.; Ohmsen, R.; Woerd, H.J.v.d. An Evaluation of Citizen Science Smartphone Apps for Inland Water Quality Assessment. Remote Sensing. 2020, 12. [Google Scholar] [CrossRef]
- Ouma, Y.O.; Waga, J.; Okech, M.; Lavisa, O.; Mbuthia, D. Estimation of Reservoir Bio-Optical Water Quality Parameters Using Smartphone Sensor Apps and Landsat ETM+: Review and Comparative Experimental Results. Journal of Sensors. 2018, 2018, 1–32. [Google Scholar] [CrossRef]
- Ha, N.T.T.; Vinh, P.Q.; Thao, N.T.P.; Linh, P.H.; Parsons, M.; Van Manh, N. A Method for Assessing the Lake Trophic Status Using Hyperspectral Reflectance (400–900 nm) Measured Above Water. IEEE Journal of Selected Topics in Applied Earth Observations and Remote Sensing. 2024, 17, 17890–17902. [Google Scholar] [CrossRef]
- Lee, Z.; Carder, K.L. Absorption spectrum of phytoplankton pigments derived from hyperspectral remote-sensing reflectance. Remote Sensing of Environment. 2004, 89, 361–368. [Google Scholar] [CrossRef]
- Astuti, I.S.; Mishra, D.R.; Mishra, S.; Schaeffer, B. Spatio-temporal dynamics of inherent optical properties in oligotrophic northern Gulf of Mexico estuaries. Continental Shelf Research. 2018, 166, 92–107. [Google Scholar] [CrossRef]
- Zhang, Y.; Zhang, L.; Cen, Y.; Zhao, H.; Li, J.; Tong, Q. The ƒ'/Q Factor in the Relationship Between Inherent and Apparent Optical Properties in a Typical Inland Water (Lake Taihu, China). IEEE Journal of Selected Topics in Applied Earth Observations and Remote Sensing. 2024, 17, 1565–1574. [Google Scholar] [CrossRef]
- Dall’Olmo, G.; Gitelson, A.A. Effect of bio-optical parameter variability on the remote estimation of chlorophyll-a concentration in turbid productive waters: experimental results. Applied Optics. 2005, 44, 412. [Google Scholar] [CrossRef]
- Zhang, B.; Li, J.; Shen, Q.; Chen, D. A bio-optical model based method of estimating total suspended matter of Lake Taihu from near-infrared remote sensing reflectance. Environ Monit Assess. 2008, 145, 339–347. [Google Scholar] [CrossRef] [PubMed]
- Arabi, B.; Salama, M.S.; Wernand, M.R.; Verhoef, W. Remote sensing of water constituent concentrations using time series of in-situ hyperspectral measurements in the Wadden Sea. Remote Sensing of Environment. 2018, 216, 154–170. [Google Scholar] [CrossRef]
- Lee, Z.P.; Carder, K.L.; Arnone, R.A. Deriving inherent optical properties from water color: a multiband quasi-analytical algorithm for optically deep waters. Applied Optics. 2002, 41, 5755–5772. [Google Scholar] [CrossRef] [PubMed]
- Hoge, F.E.; Lyon, P.E. Satellite retrieval of inherent optical properties by linear matrix inversion of oceanic radiance models: An analysis of model and radiance measurement errors. Journal of Geophysical Research: Oceans. 1996, 101, 16631–16648. [Google Scholar] [CrossRef]
- Maritorena, S.; Siegel, D.A.; Peterson, A.R. Optimization of a semianalytical ocean color model for global-scale applications. Applied Optics. 2002, 41, 2705–2714. [Google Scholar] [CrossRef] [PubMed]
- Abdelmalik, K.W. Role of statistical remote sensing for Inland water quality parameters prediction. The Egyptian Journal of Remote Sensing and Space Science. 2018, 21, 193–200. [Google Scholar] [CrossRef]
- Ampe, E.M.; Raymaekers, D.; Hestir, E.L.; Jansen, M.; Knaeps, E.; Batelaan, O. A Wavelet-Enhanced Inversion Method for Water Quality Retrieval From High Spectral Resolution Data for Complex Waters. IEEE Transactions on Geoscience and Remote Sensing. 2015, 53, 869–882. [Google Scholar] [CrossRef]
- Cao, F.; Tzortziou, M.; Hu, C.M.; Mannino, A.; Fichot, C.G.; Del Vecchio, R.; Najjar, R.G.; Novak, M. Remote sensing retrievals of colored dissolved organic matter and dissolved organic carbon dynamics in North American estuaries and their margins. Remote Sensing of Environment. 2018, 205, 151–165. [Google Scholar] [CrossRef]
- Chen, F.; Xiao, D.; Li, Z. Developing water quality retrieval models with in situ hyperspectral data in Poyang Lake, China. Geo-spatial Information Science. 2016, 19, 255–266. [Google Scholar] [CrossRef]
- Nazeer, M.; Nichol, J.E. Improved water quality retrieval by identifying optically unique water classes. Journal of Hydrology. 2016, 541, 1119–1132. [Google Scholar] [CrossRef]
- Li, S.; Song, K.; Li, Y.; Liu, G.; Wen, Z.; Shang, Y.; Lyu, L.; Fang, C. Performances of Atmospheric Correction Processors for Sentinel-2 MSI Imagery Over Typical Lakes Across China. IEEE Journal of Selected Topics in Applied Earth Observations and Remote Sensing. 2023, 16, 2065–2078. [Google Scholar] [CrossRef]
- Gholizadeh, M.H.; Melesse, A.M.; Reddi, L. A Comprehensive Review on Water Quality Parameters Estimation Using Remote Sensing Techniques. Sensors. 2016, 16, 1298. [Google Scholar] [CrossRef]
- Petus, C.; Chust, G.; Gohin, F.; Doxaran, D.; Froidefond, J.-M.; Sagarminaga, Y. Estimating turbidity and total suspended matter in the Adour River plume (South Bay of Biscay) using MODIS 250-m imagery. Continental Shelf Research. 2010, 30, 379–392. [Google Scholar] [CrossRef]
- Han, L.H.; Jordan, K.J. Estimating and mapping chlorophyll-a concentration in Pensacola Bay, Florida using Landsat ETM plus data. International Journal of Remote Sensing. 2005, 26, 5245–5254. [Google Scholar] [CrossRef]
- Rundquist, D.C.; Han, L.; Schalles, J.F.; Peake, J.S. Remote measurement of algal chlorophyll in surface waters: the case for the first derivative of reflectance near 690 nm. Photogrammetric Engineering and Remote Sensing. 1996, 62, 195–200. [Google Scholar]
- Gitelson, A.A.; Schalles, J.F.; Hladik, C.M. Remote chlorophyll-a retrieval in turbid, productive estuaries: Chesapeake Bay case study. Remote Sensing of Environment. 2007, 109, 464–472. [Google Scholar] [CrossRef]
- Wang, X.; Wen, Z.; Liu, G.; Tao, H.; Song, K. Remote estimates of total suspended matter in China’s main estuaries using Landsat images and a weight random forest model. ISPRS Journal of Photogrammetry and Remote Sensing. 2022, 183, 94–110. [Google Scholar] [CrossRef]
- Zhao, M.; O'Loughlin, F. A Multiplatform Approach for Chlorophyll Level Estimation for Irish Lakes. IEEE Journal of Selected Topics in Applied Earth Observations and Remote Sensing. 2025, 18, 8261–8274. [Google Scholar] [CrossRef]
- Caballero, C.B.; Guedes, H.A.S.; Andrade, A.C.F.D.E.; Martins, V.S.; Fraga, R.S.; Mendes, K.G.P. Empirical and semi-empirical chlorophyll-a modeling for water quality assessment through river-lake transition in extreme Southern Brazil. Anais da Academia Brasileira de Ciências. 2022, 94. [Google Scholar] [CrossRef]
- Lednicka, B.; Kubacka, M. Semi-Empirical Model of Remote-Sensing Reflectance for Chosen Areas of the Southern Baltic. Sensors. 2022, 22. [Google Scholar] [CrossRef]
- Adjovu, G.E.; Stephen, H.; James, D.; Ahmad, S. Measurement of Total Dissolved Solids and Total Suspended Solids in Water Systems: A Review of the Issues, Conventional, and Remote Sensing Techniques. Remote Sensing. 2023, 15. [Google Scholar] [CrossRef]
- Dall'Olmo, G.; Gitelson, A.A.; Rundquist, D.C. Towards a unified approach for remote estimation of chlorophyll-a in both terrestrial vegetation and turbid productive waters. Geophysical Research Letters. 2003, 30, 1938. [Google Scholar] [CrossRef]
- Le, C.; Li, Y.; Zha, Y.; Sun, D.; Huang, C.; Lu, H. A four-band semi-analytical model for estimating chlorophyll a in highly turbid lakes: The case of Taihu Lake, China. Remote Sensing of Environment. 2009, 113, 1175–1182. [Google Scholar] [CrossRef]
- El-Alem, A.; Chokmani, K.; Laurion, I.; El-Adlouni, S.E. Comparative Analysis of Four Models to Estimate Chlorophyll-a Concentration in Case-2 Waters Using MODerate Resolution Imaging Spectroradiometer (MODIS) Imagery. Remote Sensing. 2012, 4, 2373. [Google Scholar] [CrossRef]
- Tassan, S. Local algorithms using SeaWiFS data for the retrieval of phytoplankton, pigments, suspended sediment, and yellow substance in coastal waters. Applied Optics. 1994, 33, 2369–2378. [Google Scholar] [CrossRef] [PubMed]
- Wang, S.; Zhang, L.; Zhang, H.; Cen, Y.; Zhang, L.; Tong, Q. Spatiotemporal variations of total suspended sediment concentrations in the Peace-Athabasca Delta during 2000 to 2020. Journal of Applied Remote Sensing. 2022, 16. [Google Scholar] [CrossRef]
- Chen, F.; Chen, X.; Van de Voorde, T.; Roberts, D.; Jiang, H.; Xu, W. Open water detection in urban environments using high spatial resolution remote sensing imagery. Remote Sensing of Environment. 2020, 242, 111706. [Google Scholar] [CrossRef]
- Zounemat-Kermani, M.; Batelaan, O.; Fadaee, M.; Hinkelmann, R. Ensemble machine learning paradigms in hydrology: A review. Journal of Hydrology. 2021, 598. [Google Scholar] [CrossRef]
- Chen, B.; Mu, X.; Chen, P.; Wang, B.; Choi, J.; Park, H.; Xu, S.; Wu, Y.; Yang, H. Machine learning-based inversion of water quality parameters in typical reach of the urban river by UAV multispectral data. Ecological Indicators. 2021, 133. [Google Scholar] [CrossRef]
- Qiao, Z.; Sun, S.; Jiang, Q.o.; Xiao, L.; Wang, Y.; Yan, H. Retrieval of Total Phosphorus Concentration in the Surface Water of Miyun Reservoir Based on Remote Sensing Data and Machine Learning Algorithms. Remote Sensing. 2021, 13. [Google Scholar] [CrossRef]
- Deng, Y.; Zhang, Y.; Pan, D.; Yang, S.X.; Gharabaghi, B. Review of Recent Advances in Remote Sensing and Machine Learning Methods for Lake Water Quality Management. Remote Sensing. 2024, 16. [Google Scholar] [CrossRef]
- Mohan, S.; Kumar, B.; Nejadhashemi, A.P. Integration of Machine Learning and Remote Sensing for Water Quality Monitoring and Prediction: A Review. Sustainability. 2025, 17. [Google Scholar] [CrossRef]
- Yan, X.; Zhang, T.; Du, W.; Meng, Q.; Xu, X.; Zhao, X. A Comprehensive Review of Machine Learning for Water Quality Prediction over the Past Five Years. Journal of Marine Science and Engineering. 2024, 12. [Google Scholar] [CrossRef]
- Arias-Rodriguez, L.F.; Duan, Z.; Sepúlveda, R.; Martinez-Martinez, S.I.; Disse, M. Monitoring Water Quality of Valle de Bravo Reservoir, Mexico, Using Entire Lifespan of MERIS Data and Machine Learning Approaches. Remote Sensing. 2020, 12. [Google Scholar] [CrossRef]
- Li, N.; Ning, Z.; Chen, M.; Wu, D.; Hao, C.; Zhang, D.; Bai, R.; Liu, H.; Chen, X.; Li, W.; et al. Satellite and Machine Learning Monitoring of Optically Inactive Water Quality Variability in a Tropical River. Remote Sensing. 2022, 14, 5466. [Google Scholar] [CrossRef]
- Lu, Q.; Si, W.; Wei, L.; Li, Z.; Xia, Z.; Ye, S.; Xia, Y. Retrieval of Water Quality from UAV-Borne Hyperspectral Imagery: A Comparative Study of Machine Learning Algorithms. Remote Sensing. 2021, 13. [Google Scholar] [CrossRef]
- Xiao, Y.; Guo, Y.; Yin, G.; Zhang, X.; Shi, Y.; Hao, F.; Fu, Y. UAV Multispectral Image-Based Urban River Water Quality Monitoring Using Stacked Ensemble Machine Learning Algorithms—A Case Study of the Zhanghe River, China. Remote Sensing. 2022, 14. [Google Scholar] [CrossRef]
- Zhao, Y.; Yu, T.; Hu, B.; Zhang, Z.; Liu, Y.; Liu, X.; Liu, H.; Liu, J.; Wang, X.; Song, S. Retrieval of Water Quality Parameters Based on Near-Surface Remote Sensing and Machine Learning Algorithm. Remote Sensing. 2022, 14, 5305. [Google Scholar] [CrossRef]
- Hu, W.T.; Jin, S.G.; Zhang, Y.Y. Water Quality Variations in the Lower Yangtze River Based on GA-RF Model From GF-1, Landsat-8, and Sentinel-2 Images. Ieee Journal of Selected Topics in Applied Earth Observations and Remote Sensing. 2025, 18, 4992–5004. [Google Scholar] [CrossRef]
- Deng; Zhang; Cen. Retrieval of Chemical Oxygen Demand through Modified Capsule Network Based on Hyperspectral Data. Applied Sciences. 2019, 9, 4620. [Google Scholar] [CrossRef]
- Su, S.; Ma, K.; Zhou, T.; Yao, Y.; Xin, H. Advancing methodologies for assessing the impact of land use changes on water quality: a comprehensive review and recommendations. Environmental Geochemistry and Health. 2025, 47. [Google Scholar] [CrossRef]
- Yu, X.; Chen, S.; Zhang, X.; Wu, H.; Guo, Y.; Guan, J. Research progress of the artificial intelligence application in wastewater treatment during 2012–2022: a bibliometric analysis. Water Science & Technology. 2023, 88, 1750–1766. [Google Scholar] [CrossRef]
- Amieva, J.F.; Oxoli, D.; Brovelli, M.A. Machine and Deep Learning Regression of Chlorophyll-a Concentrations in Lakes Using PRISMA Satellite Hyperspectral Imagery. Remote Sensing. 2023, 15. [Google Scholar] [CrossRef]
- Zhang, Y.; Wu, L.; Deng, L.; Ouyang, B. Retrieval of water quality parameters from hyperspectral images using a hybrid feedback deep factorization machine model. Water Res. 2021, 204, 117618. [Google Scholar] [CrossRef]
- Niu, C.; Tan, K.; Jia, X.; Wang, X. Deep learning based regression for optically inactive inland water quality parameter estimation using airborne hyperspectral imagery. Environ Pollut. 2021, 286, 117534. [Google Scholar] [CrossRef]
- Guo, H.; Tian, S.; Jeanne Huang, J.; Zhu, X.; Wang, B.; Zhang, Z. Performance of deep learning in mapping water quality of Lake Simcoe with long-term Landsat archive. ISPRS Journal of Photogrammetry and Remote Sensing. 2022, 183, 451–469. [Google Scholar] [CrossRef]
- Ilteralp, M.; Ariman, S.; Aptoula, E. A Deep Multitask Semisupervised Learning Approach for Chlorophyll-a Retrieval from Remote Sensing Images. Remote Sensing. 2021, 14. [Google Scholar] [CrossRef]
- Ali, A.; Zhou, G.; Pablo Antezana Lopez, F.; Xu, C.; Jing, G.; Tan, Y. Deep learning for water quality multivariate assessment in inland water across China. International Journal of Applied Earth Observation and Geoinformation. 2024, 133. [Google Scholar] [CrossRef]
- Xia, L.; Zhu, Y.; Zhao, Z. Optimization and Screening of Chl-a Inversion Model for Urban Water Bodies Based on Ground-Based Hyperspectra. Water. 2024, 16. [Google Scholar] [CrossRef]
- Biliani, I.; Skamnia, E.; Economou, P.; Zacharias, I. A Novel Methodology to Correct Chlorophyll-a Concentrations from Satellite Data and Assess Credible Phenological Patterns. Remote Sensing. 2025, 17. [Google Scholar] [CrossRef]
- Oki, K. Why is the Ratio of Reflectivity Effective for Chlorophyll Estimation in the Lake Water? Remote Sensing. 2010, 2, 1722–1730. [Google Scholar] [CrossRef]
- Lin, Q.; Chuanmin, H.; Hongtao, D.; Yuchao, Z.; Ronghua, M. Influence of Particle Composition on Remote Sensing Reflectance and MERIS Maximum Chlorophyll Index Algorithm: Examples From Taihu Lake and Chaohu Lake. IEEE Geoscience and Remote Sensing Letters. 2015, 12, 1170–1174. [Google Scholar] [CrossRef]
- Wasehun, E.T.; Beni, L.H.; Di Vittorio, C.A.; Zarzar, C.M.; Young, K.R.L. Comparative analysis of Sentinel-2 and PlanetScope imagery for chlorophyll-a prediction using machine learning models. Ecological Informatics. 2025, 85. [Google Scholar] [CrossRef]
- Peng, J.; Chen, B. Inversion of Chlorophyll-a Concentrations in Chaohu Lake Based on GF-1 WFV Images. IEEE Access. 2024, 12, 24791–24802. [Google Scholar] [CrossRef]
- Fan, W.; Xu, Z.; Dong, Q.; Chen, W.; Cai, Y. Remote sensing-based spatiotemporal variation and driving factor assessment of chlorophyll-a concentrations in China’s Pearl River Estuary. Frontiers in Marine Science. 2023, 10. [Google Scholar] [CrossRef]
- Xu, J.; Gao, C.; Wang, Y. Extraction of Spatial and Temporal Patterns of Concentrations of Chlorophyll-a and Total Suspended Matter in Poyang Lake Using GF-1 Satellite Data. Remote Sensing. 2020, 12. [Google Scholar] [CrossRef]
- Xiao, Y.; Chen, J.; Xu, Y.; Guo, S.; Nie, X.; Guo, Y.; Li, X.; Hao, F.; Fu, Y.H. Monitoring of chlorophyll-a and suspended sediment concentrations in optically complex inland rivers using multisource remote sensing measurements. Ecological Indicators. 2023, 155. [Google Scholar] [CrossRef]
- Chen, J.; Chen, S.; Fu, R.; Wang, C.; Li, D.; Peng, Y.; Wang, L.; Jiang, H.; Zheng, Q. Remote Sensing Estimation of Chlorophyll-A in Case-II Waters of Coastal Areas: Three-Band Model Versus Genetic Algorithm–Artificial Neural Networks Model. IEEE Journal of Selected Topics in Applied Earth Observations and Remote Sensing. 2021, 14, 3640–3658. [Google Scholar] [CrossRef]
- Merder, J.; Zhao, G.; Pahlevan, N.; Rigby, R.A.; Stasinopoulos, D.M.; Michalak, A.M. A novel algorithm for ocean chlorophyll-a concentration using MODIS Aqua data. ISPRS Journal of Photogrammetry and Remote Sensing. 2024, 210, 198–211. [Google Scholar] [CrossRef]
- Llodrà-Llabrés, J.; Martínez-López, J.; Postma, T.; Pérez-Martínez, C.; Alcaraz-Segura, D. Retrieving water chlorophyll-a concentration in inland waters from Sentinel-2 imagery: Review of operability, performance and ways forward. International Journal of Applied Earth Observation and Geoinformation. 2023, 125. [Google Scholar] [CrossRef]
- Bertone, E.; Ajmar, A.; Tonolo, F.G.; Dunn, R.J.K.; Doriean, N.J.C.; Bennett, W.W.; Purandare, J. Satellite-based estimation of total suspended solids and chlorophyll-a concentrations for the Gold Coast Broadwater, Australia. Mar. Pollut. Bull. 2024, 201. [Google Scholar] [CrossRef]
- Ahmad, H.; Jose, F.; Dash, P.; Shoemaker, D.J.; Jhara, S.I. Machine learning-based estimation of chlorophyll-a in the Mississippi Sound using Landsat and ocean optics data. Environmental Earth Sciences. 2025, 84. [Google Scholar] [CrossRef]
- Park, E.; Latrubesse, E.M. Modeling suspended sediment distribution patterns of the Amazon River using MODIS data. Remote Sensing of Environment. 2014, 147, 232–242. [Google Scholar] [CrossRef]
- Shi, K.; Zhang, Y.; Zhu, G.; Liu, X.; Zhou, Y.; Xu, H.; Qin, B.; Liu, G.; Li, Y. Long-term remote monitoring of total suspended matter concentration in Lake Taihu using 250m MODIS-Aqua data. Remote Sensing of Environment. 2015, 164, 43–56. [Google Scholar] [CrossRef]
- Torres-Vera, M.A. Mapping of total suspended solids using Landsat imagery and machine learning. International Journal of Environmental Science and Technology. 2023, 20, 11877–11890. [Google Scholar] [CrossRef]
- M, R.V.; Kupssinsku, L.S.; T, T.G.; Koste, E.C.; da Silva, J.M.; de Souza, L.V.; Oliverio, W.F.M.; Jardim, R.S.; Koch, I.E.; de Souza, J.G.; et al. Proposal of a Method to Determine the Correlation between Total Suspended Solids and Dissolved Organic Matter in Water Bodies from Spectral Imaging and Artificial Neural Networks. Sensors (Basel). 2018, 18. [Google Scholar] [CrossRef]
- Liu, H.; Li, Q.; Shi, T.; Hu, S.; Wu, G.; Zhou, Q. Application of Sentinel 2 MSI Images to Retrieve Suspended Particulate Matter Concentrations in Poyang Lake. Remote Sensing. 2017, 9. [Google Scholar] [CrossRef]
- Hou, X.; Feng, L.; Duan, H.; Chen, X.; Sun, D.; Shi, K. Fifteen-year monitoring of the turbidity dynamics in large lakes and reservoirs in the middle and lower basin of the Yangtze River, China. Remote Sensing of Environment. 2017, 190, 107–121. [Google Scholar] [CrossRef]
- Tian, L.; Wai, O.W.H.; Chen, X.; Li, W.; Li, J.; Li, W.; Zhang, H. Retrieval of total suspended matter concentration from Gaofen-1 Wide Field Imager (WFI) multispectral imagery with the assistance of Terra MODIS in turbid water – case in Deep Bay. International Journal of Remote Sensing. 2016, 37, 3400–3413. [Google Scholar] [CrossRef]
- Wang, J.; Shi, T.; Yu, D.; Teng, D.; Ge, X.; Zhang, Z.; Yang, X.; Wang, H.; Wu, G. Ensemble machine-learning-based framework for estimating total nitrogen concentration in water using drone-borne hyperspectral imagery of emergent plants: A case study in an arid oasis, NW China. Environmental Pollution. 2020, 266, 115412. [Google Scholar] [CrossRef] [PubMed]
- Shi, K.; Zhang, Y.; Zhou, Y.; Liu, X.; Zhu, G.; Qin, B.; Gao, G. Long-term MODIS observations of cyanobacterial dynamics in Lake Taihu: Responses to nutrient enrichment and meteorological factors. Sci Rep. 2017, 7, 40326. [Google Scholar] [CrossRef] [PubMed]
- Du, C.; Wang, Q.; Li, Y.; Lyu, H.; Zhu, L.; Zheng, Z.; Wen, S.; Liu, G.; Guo, Y. Estimation of total phosphorus concentration using a water classification method in inland water. International Journal of Applied Earth Observation and Geoinformation. 2018, 71, 29–42. [Google Scholar] [CrossRef]
- Gao, Y.; Gao, J.; Yin, H.; Liu, C.; Xia, T.; Wang, J.; Huang, Q. Remote sensing estimation of the total phosphorus concentration in a large lake using band combinations and regional multivariate statistical modeling techniques. J Environ Manage. 2015, 151, 33–43. [Google Scholar] [CrossRef]
- Sun, D.; Qiu, Z.; Li, Y.; Shi, K.; Gong, S. Detection of Total Phosphorus Concentrations of Turbid Inland Waters Using a Remote Sensing Method. Water, Air, & Soil Pollution. 2014, 225, 1953. [Google Scholar] [CrossRef]
- Wu, C.; Wu, J.; Qi, J.; Zhang, L.; Huang, H.; Lou, L.; Chen, Y. Empirical estimation of total phosphorus concentration in the mainstream of the Qiantang River in China using Landsat TM data. International Journal of Remote Sensing. 2010, 31, 2309–2324. [Google Scholar] [CrossRef]
- Arıman, S. Determination of inactive water quality variables by MODIS data: A case study in the Kızılırmak Delta-Balik Lake, Turkey. Estuarine, Coastal and Shelf Science. 2021, 260. [Google Scholar] [CrossRef]
- Hossen, H.; Mahmod, W.E.; Negm, A.; Nakamura, T. Assessing Water Quality Parameters in Burullus Lake Using Sentinel-2 Satellite Images. Water Resources. 2022, 49, 321–331. [Google Scholar] [CrossRef]
- Shang, W.; Jin, S.; He, Y.; Zhang, Y.; Li, J. Spatial–Temporal Variations of Total Nitrogen and Phosphorus in Poyang, Dongting and Taihu Lakes from Landsat-8 Data. Water. 2021, 13. [Google Scholar] [CrossRef]
- Sun, X.; Zhang, Y.; Shi, K.; Zhang, Y.; Li, N.; Wang, W.; Huang, X.; Qin, B. Monitoring water quality using proximal remote sensing technology. Sci Total Environ. 2022, 803, 149805. [Google Scholar] [CrossRef]
- Xiong, J.; Lin, C.; Cao, Z.; Hu, M.; Xue, K.; Chen, X.; Ma, R. Development of remote sensing algorithm for total phosphorus concentration in eutrophic lakes: Conventional or machine learning? Water Res. 2022, 215, 118213. [Google Scholar] [CrossRef]
- Yuan, X.; Wang, S.; Fan, F.; Dong, Y.; Li, Y.; Lin, W.; Zhou, C. Spatiotemporal dynamics and anthropologically dominated drivers of chlorophyll-a, TN and TP concentrations in the Pearl River Estuary based on retrieval algorithm and random forest regression. Environ Res. 2022, 215, 114380. [Google Scholar] [CrossRef]
- Zhang, H.; Xue, B.; Wang, G.; Zhang, X.; Zhang, Q. Deep Learning-Based Water Quality Retrieval in an Impounded Lake Using Landsat 8 Imagery: An Application in Dongping Lake. Remote Sensing. 2022, 14. [Google Scholar] [CrossRef]
- Cao, X.; Zhang, J.; Meng, H.; Lai, Y.; Xu, M. Remote sensing inversion of water quality parameters in the Yellow River Delta. Ecological Indicators. 2023, 155. [Google Scholar] [CrossRef]
- Liang, Z.; Soranno, P.A.; Wagner, T. The role of phosphorus and nitrogen on chlorophyll a: Evidence from hundreds of lakes. Water Res. 2020, 185, 116236. [Google Scholar] [CrossRef]
- Søndergaard, M.; Larsen, S.E.; Jørgensen, T.B.; Jeppesen, E. Using chlorophyll a and cyanobacteria in the ecological classification of lakes. Ecological Indicators. 2011, 11, 1403–1412. [Google Scholar] [CrossRef]
- Song, K.; Li, L.; Li, S.; Tedesco, L.; Hall, B.; Li, L. Hyperspectral Remote Sensing of Total Phosphorus (TP) in Three Central Indiana Water Supply Reservoirs. Water, Air, & Soil Pollution. 2011, 223, 1481–1502. [Google Scholar] [CrossRef]
- Tong, Y.; Xu, X.; Zhang, S.; Shi, L.; Zhang, X.; Wang, M.; Qi, M.; Chen, C.; Wen, Y.; Zhao, Y.; et al. Establishment of season-specific nutrient thresholds and analyses of the effects of nutrient management in eutrophic lakes through statistical machine learning. Journal of Hydrology. 2019, 578. [Google Scholar] [CrossRef]
- Zhang, L.; Zhang, L.; Cen, Y.; Wang, S.; Zhang, Y.; Huang, Y.; Sultan, M.; Tong, Q. Prediction of Total Phosphorus Concentration in Macrophytic Lakes Using Chlorophyll-Sensitive Bands: A Case Study of Lake Baiyangdian. Remote Sensing. 2022, 14. [Google Scholar] [CrossRef]
- Song, K.; Li, L.; Tedesco, L.; Li, S.; Shi, K.; Hall, B. Remote Estimation of Nutrients for a Drinking Water Source Through Adaptive Modeling. Water Resources Management. 2014, 28, 2563–2581. [Google Scholar] [CrossRef]
Figure 1.
Number of published articles on water quality and its proportion to remote sensing literature.
Figure 1.
Number of published articles on water quality and its proportion to remote sensing literature.
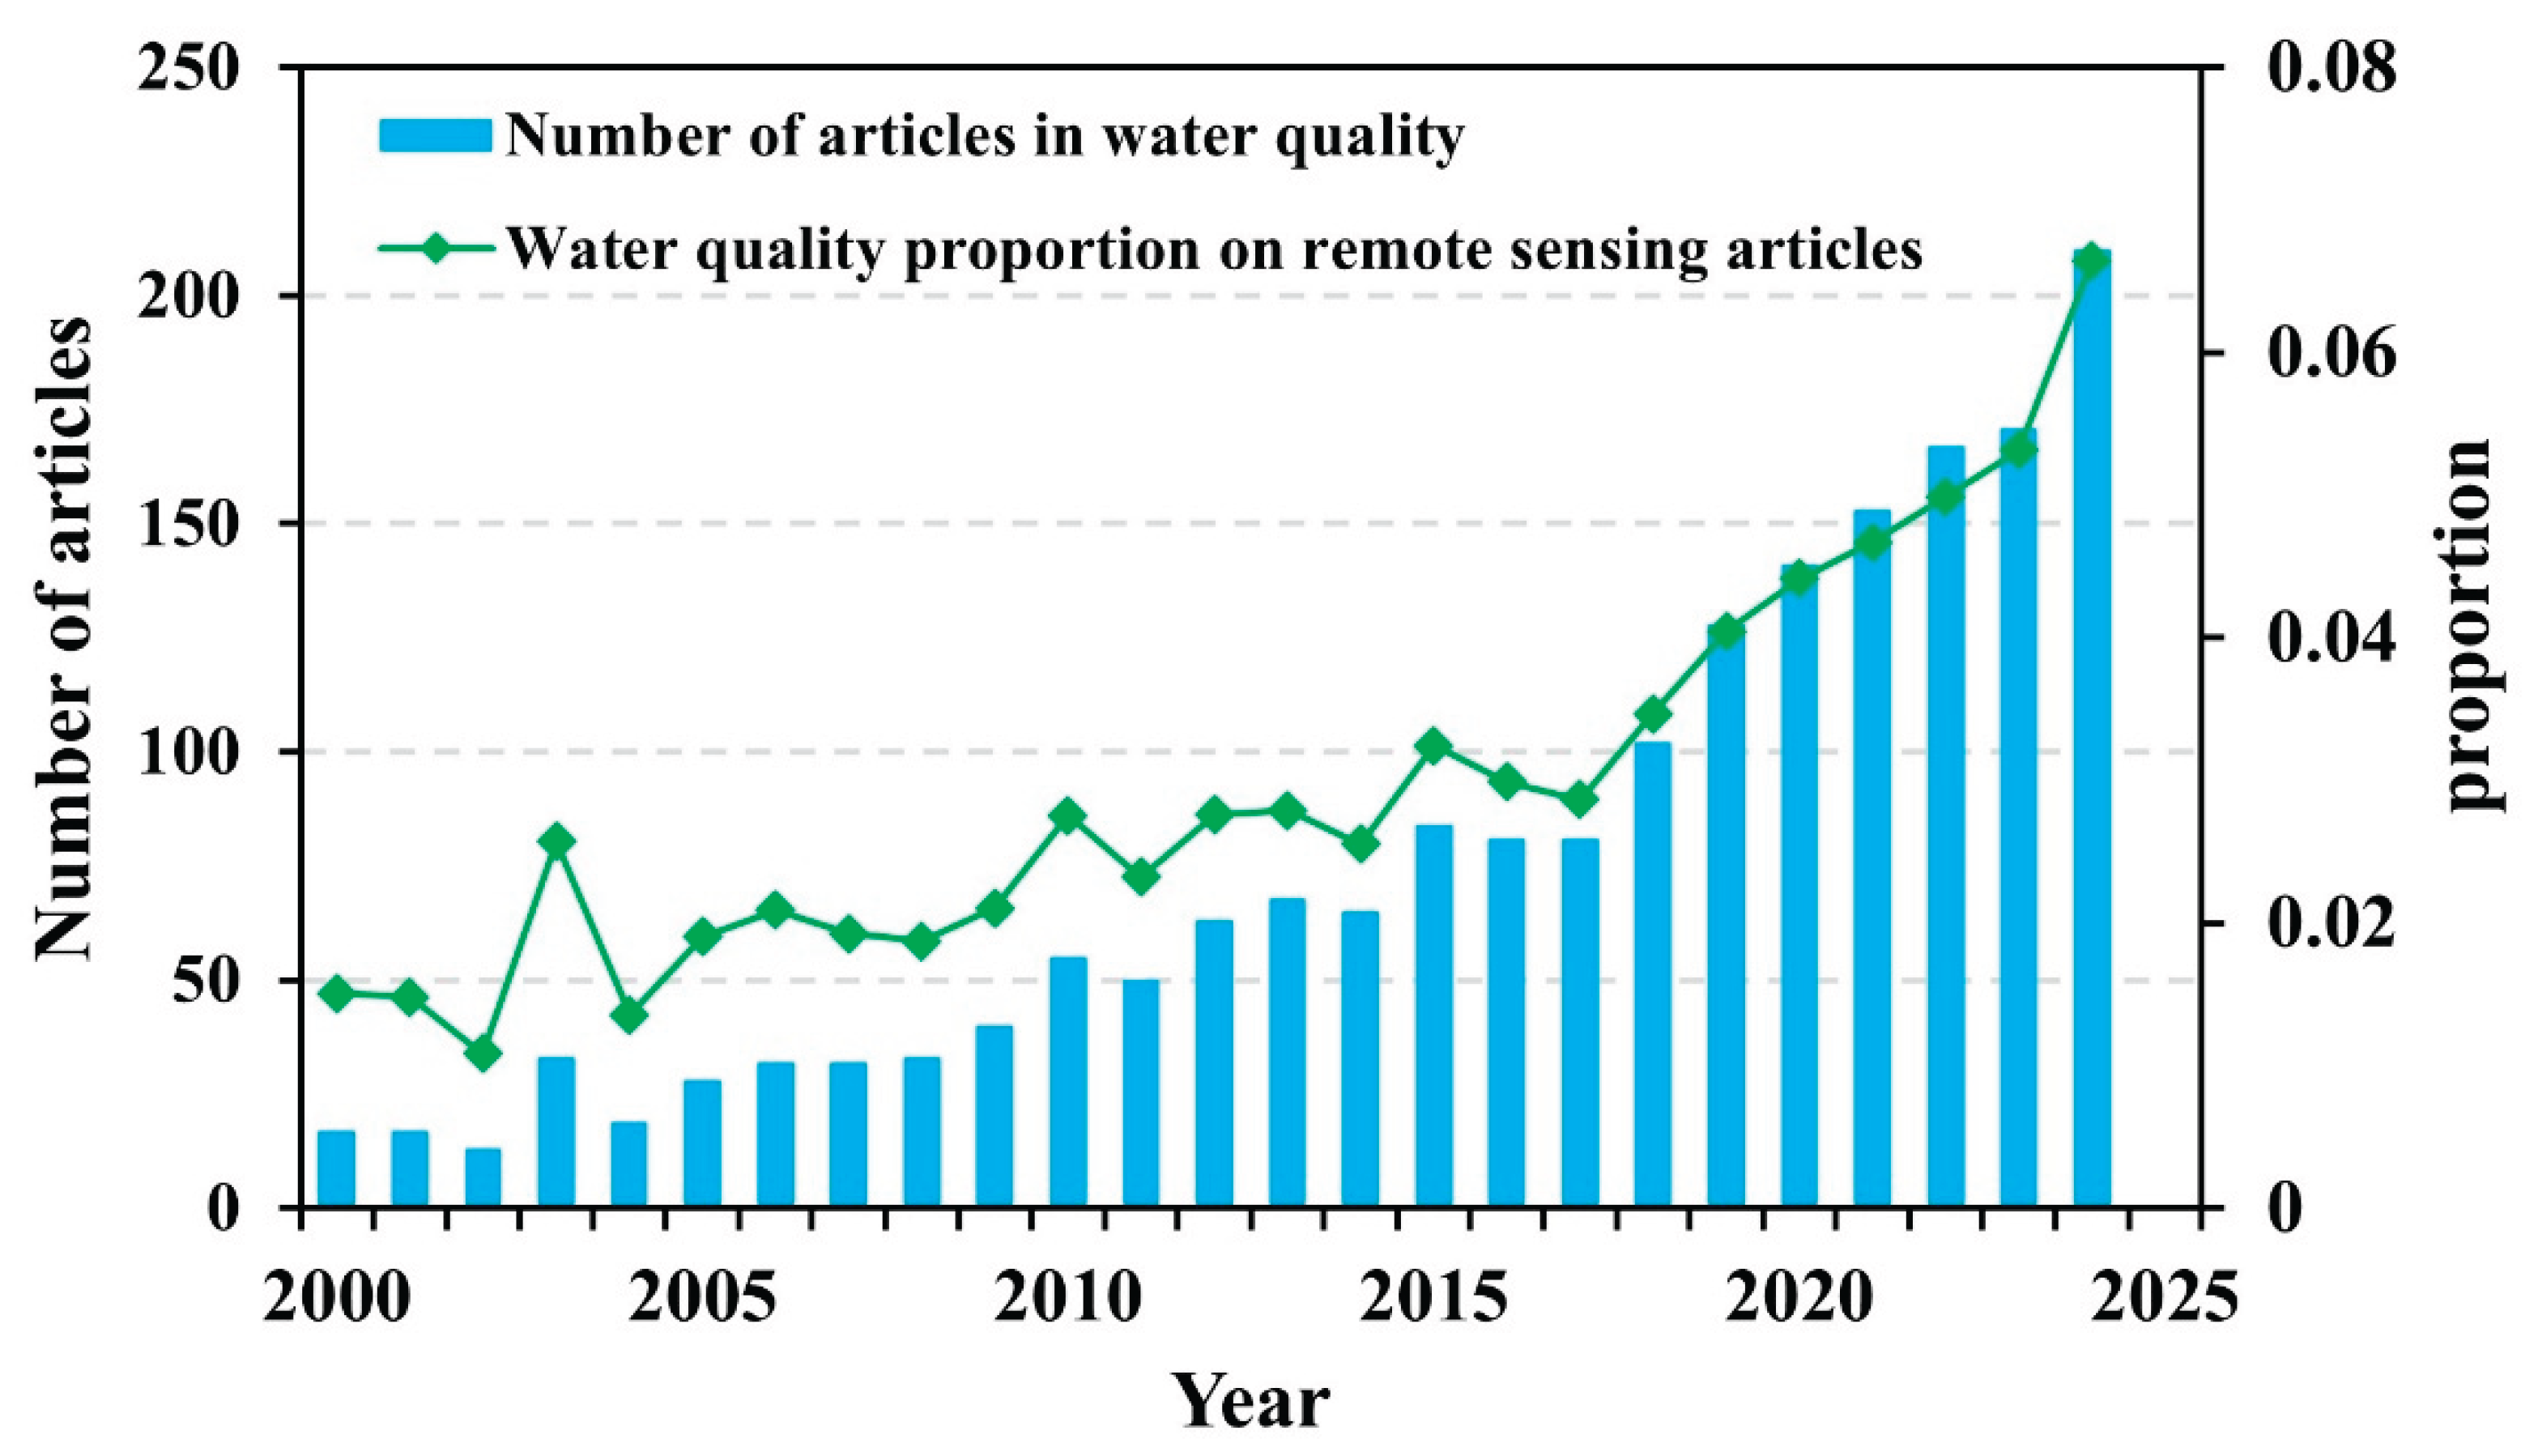
Figure 2.
Proportion of articles published by top 10 countries.
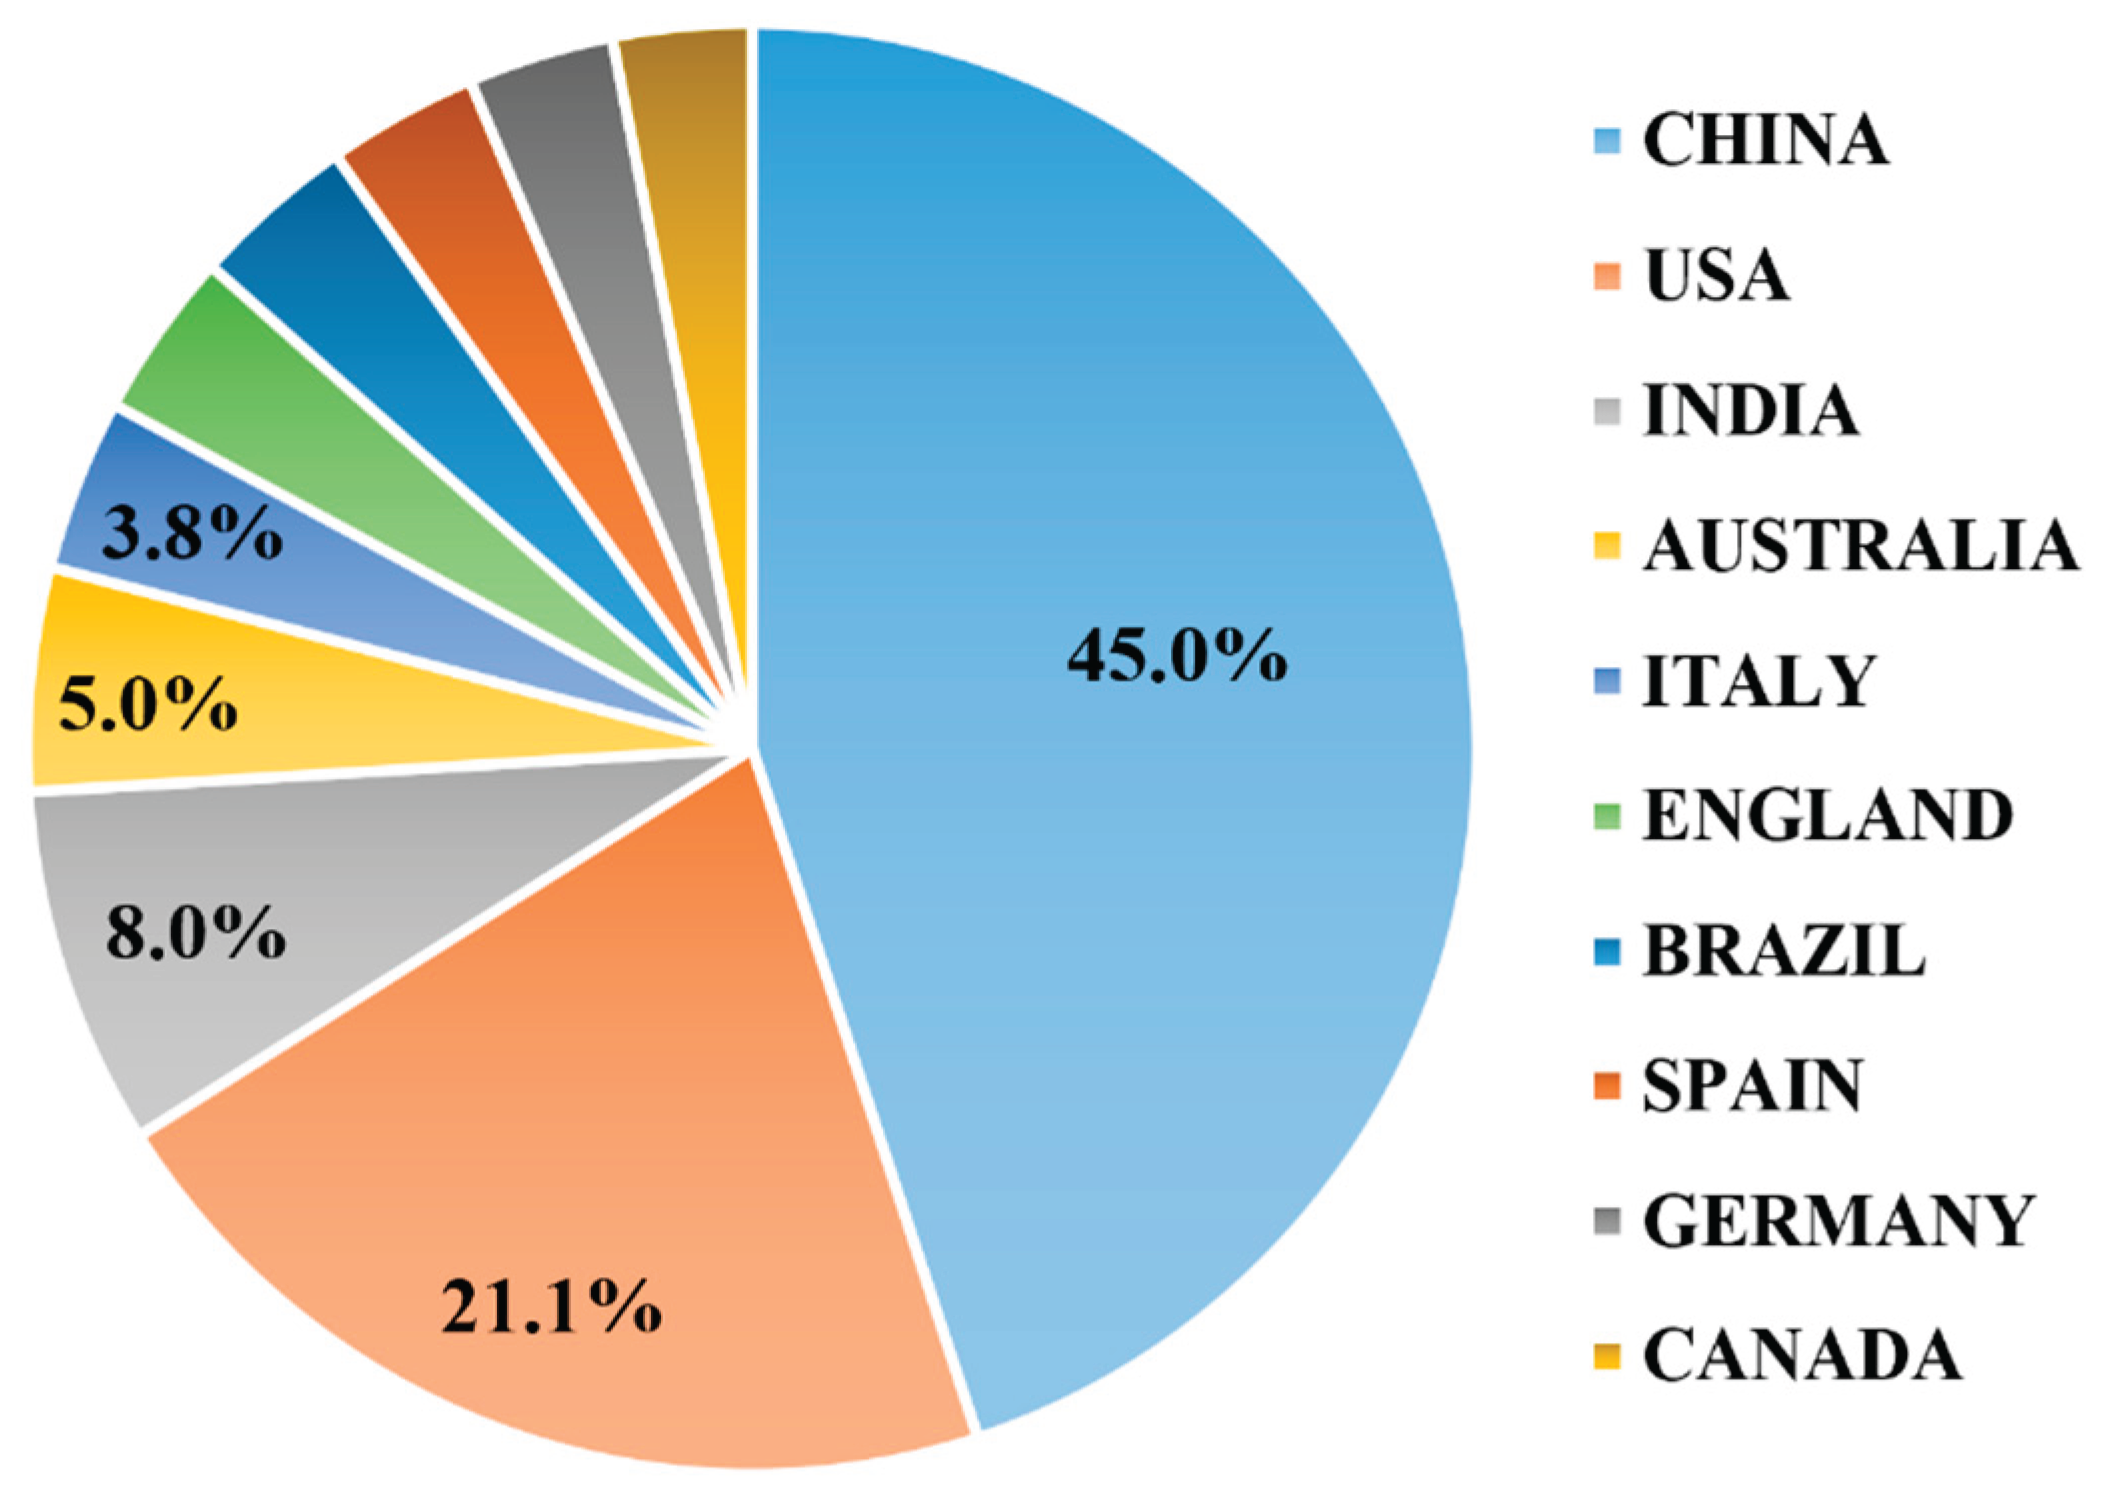
Figure 3.
Visualization of the keyword network for the period 2000–2024.
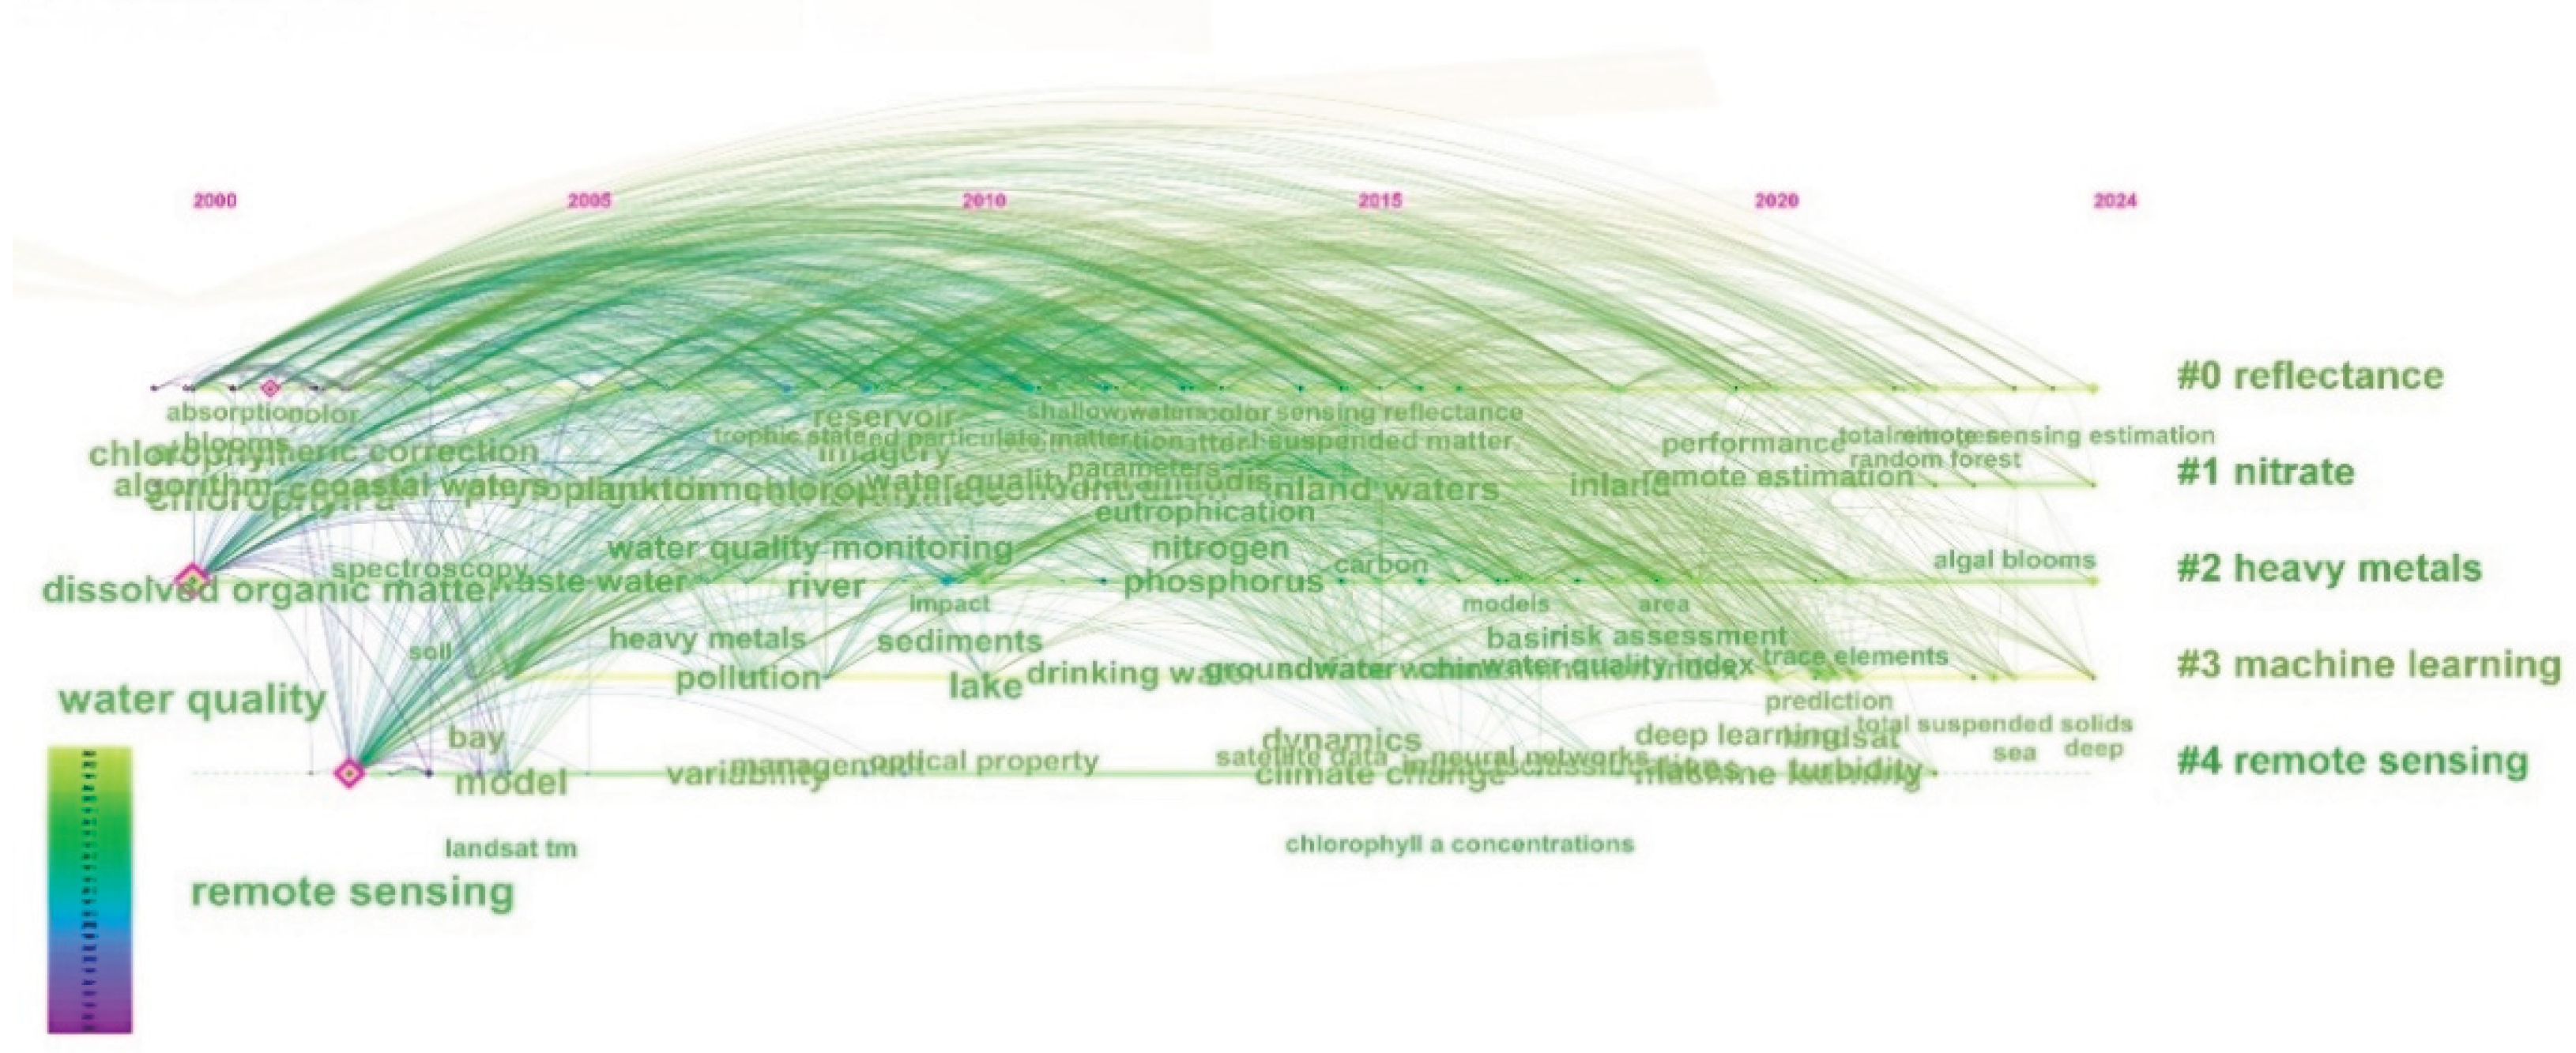

Table 1.
Statistics on the number of publications indexed by the WOS.
| Ranking | Publication | Record Count |
|---|---|---|
| 1 | REMOTE SENSING | 102 |
| 2 | THE SCIENCE OF THE TOTAL ENVIRONMENT | 89 |
| 3 | WATER | 63 |
| 4 | ENVIRONMENTAL MONITORING AND ASSESSMENT | 50 |
| 5 | IEEE INTERNATIONAL SYMPOSIUM ON GEOSCIENCE AND REMOTE SENSING IGARSS | 49 |
| 6 | PROCEEDINGS OF SPIE | 45 |
| 7 | ENVIRONMENTAL SCIENCE AND POLLUTION RESEARCH | 41 |
| 8 | ENVIRONMENTAL SCIENCE AND POLLUTION RESEARCH INTERNATIONAL | 41 |
| 9 | SPECTROSCOPY AND SPECTRAL ANALYSIS | 41 |
| 10 | PROCEEDINGS OF THE SPIE THE INTERNATIONAL SOCIETY FOR OPTICAL ENGINEERING | 32 |
Table 2.
Technical specifications of common satellite remote sensors used in water quality parameters retrieval.
Table 2.
Technical specifications of common satellite remote sensors used in water quality parameters retrieval.
| Category | Sensor | Height on orbit (km) | Orbital swath (km) | Spatial resolution (m) | Temporal resolution (day) | Bands | Spectral range (nm) |
|---|---|---|---|---|---|---|---|
| Coarse resolution |
AVHRR | 833–870 | 2800 | 1100 | 0.5 | 5 | 550–12,500 |
| MODIS | 705 | 2330 | 250–1000 | 0.5 | 36 | 400–14,400 | |
| GOCI | 35,837 | 2500 | 500 | 1/24 | 8 | 402–885 | |
| MERIS | 790 ± 10 | 1150 | 300 | 3 | 22 | 465–2135 | |
| Sentinel-3 | 814.5 | 1270 | 300 | 2 | 21 | 400–1020 | |
| Medium resolution | Landsat 1–3 | 907–915 | 185 | 78 | 18 | 4 | 500–1100 |
| Landsat-4/5 | 705 | 185 | 30–120 | 16 | 7 | 450–12,500 | |
| Landsat-7 | 705 | 185 | 15–60 | 16 | 8 | 450–12,500 | |
| Landsat-8 | 705 | 185 | 15–100 | 16 | 11 | 430–12,510 | |
| Landsat-9 | 705 | 185 | 15–100 | 16 | 11 | 435–12,500 | |
| SPOT 1–4 | 822 | 60 | 10–20 | 26 | 4–5 | 500–1750 | |
| Hyperion | 705 | 7.7 | 30 | 200 | 242 | 400–2500 | |
| Sentinel-2 | 786 | 290 | 10–60 | 5 | 13 | 420–2300 | |
| High resolution |
IKONOS | 681 | 11.3 | 0.82–4 | 1.5–3 | 5 | 445–900 |
| QuickBird | 450–482 | 16.8–18 | 0.61–2.88 | 1–6 | 5 | 450–900 | |
| WorldView 1–4 | 496 | 17.6 | 0.31–3.7 | 1.7–5.9 | 4–28 | 450–800 | |
| SPOT 5 | 822 | 60 | 2.5–20 | 26 | 5 | 480–1750 | |
| SPOT 6/7 | 694 | 60 | 1.5–6 | 26 | 5 | 500–890 | |
| ZY-3 | 506 | 50 | 2.1–5.8 | 3–5 | 7 | 500–890 | |
| GF-1/2/6 | 631–645 | 45–90 | 0.8–16 | 1–5 | 5–13 | 450–900 | |
| Zhuhai-1 | 500 | 150 | 0.44–10 | 1–32 | 32 | 400–1000 | |
| Beijing-3 | 500-700 | 12 | 0.3–0.5 1.2–2 |
—— | 4–6 | 400–900 |
Table 3.
Technical specifications of common airborne remote sensors used in water quality parameters retrieval.
Table 3.
Technical specifications of common airborne remote sensors used in water quality parameters retrieval.
| Sensors | Spectral range (nm) | Number of channels | Spectral resolution (nm) | Field of view (°) |
Imaging mode |
|---|---|---|---|---|---|
| AVIRIS | 380–2500 | 224 | 10 | 34 | Spectroscopic, scanning |
| CASI-1500 | 380–1050 | Adjustable, up to 288 | <3.5 | 40 | Spectroscopic, push-broom |
| PHI | 400–850 | 244 | <5 | 21 | Spectroscopic, push-broom |
| OMIS-II | 400–1100 | 64 | 10 | >70 | Spectroscopic, scanning |
| HyMap | 400–2500 | 128 | 15–20 | 60 | Spectroscopic, scanning |
| AISA | 430–900 | 288 | 3 | 38 | Spectroscopic, scanning |
Table 4.
Technical specifications of common ground field spectrometers used in water quality parameters retrieval.
Table 4.
Technical specifications of common ground field spectrometers used in water quality parameters retrieval.
| Manufacturer | Spectrometer | Spectral range (nm) | Number of channels | Spectral resolution (nm) |
|---|---|---|---|---|
| Spectral Evolution | PSR-3500 | 350–2500 | 1024 | 3.5 (350–1000 nm) |
| 10 (1000–1500 nm) | ||||
| 7 (1500–2100 nm) | ||||
| SVC | SVC 1024 | 350–2500 | 1024 | 3.5 (350–1000 nm) |
| 9.5 (1000–1900 nm) | ||||
| ASD | FieldSpec 4 | 350–2500 | 2151 | 3 (350–1000 nm) |
| 8 (1000–2500 nm) | ||||
| Ocean Optics | USB-4000 | 200–1100 | Configuration dependent | 0.1–10 |
Table 5.
Some studies of water quality parameter retrieval using optical models.
| Model | Water parameters | References |
|---|---|---|
| 2SeaColor | Chl-a, TSS, CDOM | [56] |
| QAA | Chl-a | [57] |
| LM | CDOM | [58] |
| GSM | Chl-a | [59] |
Table 6.
Common empirical models for water quality parameter retrieval.
| Model | Equation | Reference |
|---|---|---|
| Single band | [67] | |
| Logarithmic | [68] | |
| Spectral Differentiation |
, |
[69] |
| Ratio | [70] | |
| Difference | [71] |
Note: is the remote sensing reflectance of water at wavelength , and a and b are regression coefficients.
Table 7.
Common semi-empirical models for water quality parameter retrieval.
| Model | Equation | Water parameter | Reference |
|---|---|---|---|
| Three-band | Chl-a | [76] | |
| Four-band | Chl-a | [77] | |
| APPLE |
|
Chl-a | [78] |
| Tassan | TSS | [79] |
Note: are the remote sensing reflectance of the water body at wavelengths λ1, λ2, λ3, and λ4, respectively; and a and b are the regression coefficients.
Table 8.
Some studies on water quality parameter retrieval using machine learning models.
| Study area | Data source | Method | Water parameter | Reference |
|---|---|---|---|---|
| Valle de Bravo reservoir | MERIS | LR, RF, SVR, GPR | Turbidity | [88] |
| Nandu River | Landsat 8 | SVR, RF, ANN, RT, GBM | TN, TP, NH3N | [89] |
| Beigong Reservoir | UAV hyperspectral image | Adaboost, Gradient Boost, SVR, RF | Chl-a, TSS | [90] |
| Zhanghe River | UAV multispectral image | BP, RF, XGBoost | Chl-a, TP, TN, CODMn | [91] |
| Yuhe river | Near-surface hyperspectral spectra | LASSO, DTR, SVR, MLP | COD, NH3N, DO | [92] |
| Yangtze River | Sentinel-2, Landsat-8, GF-1 | GA-RF | TP, TN | [93] |
Table 9.
Some studies on water quality parameter retrieval using deep learning models.
| Study area | Data source | Model | Water quality | Reference |
|---|---|---|---|---|
| Maozhou River | UAV hyperspectral image | HF-DFM | Chl-a, COD | [98] |
| Guanhe River | Airborne hyperspectral image | DNNR | TP, TN, COD, NH3N | [99] |
| Simcoe Lake | Landsat | MDL | Chl-a, TP, TN | [100] |
| Balik Lake | Sentinel-2 | CNN | Chl-a | [101] |
| Liangzi lake | Sentinel-2 | DNN | Chl-a,TSS | [102] |
Table 10.
Some studies on Chl-a retrieval.
| Study area | Data source | Model | R2 | Reference |
|---|---|---|---|---|
| A lake in North Carolina, USA | Sentinel-2 | XGBoost, random forest, | 0.64 | [107] |
| Chaohu Lake, China | GF-1 | Normalized difference chlorophyll index | 0.93 | [108] |
| Pearl River Estuary, China | Landsat 5/7 | Two-band global algorithm | 0.71 | [109] |
| Poyang Lake, China | GF-1 | APPEL model | greater than 0.6 | [110] |
| Nanpaishui River,Nanyun River | UAV multispectral and hyperspectral imagery | stepwise regression | 0.77 | [111] |
| Hedi reservoir, Gaozhou reservoir | Sentinel-2 | GA–ANN | 0.87 | [112] |
Table 11.
Some studies on TSS retrieval.
| Study area | Data source | Model | R2 | Reference |
|---|---|---|---|---|
| Lake Chapala | Landsat 5-8 | Multiple linear regression | 0.81 | [119] |
| A lake at South Brazil | Landsat 8 | Artificial Neural Network | 0.6 | [120] |
| Poyang Lake | Sentinel-2 | Exponential model | 0.93 | [121] |
| Yangtze River | MODIS | Ratio model | 0.88 | [122] |
| Deep Bay, China | MODIS | Exponential retrieval model | 0.62 | [123] |
Table 12.
Some studies on TP and TN retrieval using direct models.
| Study area | Data source | Water quality | References |
|---|---|---|---|
| Balik Lake | MODIS | TP, TN | [130] |
| Burullus Lake | Sentinel-2 | TP, TN | [131] |
| Poyang Lake, Dongting Lake, Taihu Lake | Landsat 8 | TP, TN | [132] |
| Taihu Lake | proximal hyperspectral imager | TP, TN | [133] |
| Taihu Lake | MODIS | TP | [134] |
| Pearl River Estuary | Landsat 8 | TP, TN | [135] |
| Dongping Lake | Landsat 8 | TP, TN | [136] |
| Yellow River Delta | Sentinel-2 | TP, TN | [137] |
Disclaimer/Publisher’s Note: The statements, opinions and data contained in all publications are solely those of the individual author(s) and contributor(s) and not of MDPI and/or the editor(s). MDPI and/or the editor(s) disclaim responsibility for any injury to people or property resulting from any ideas, methods, instructions or products referred to in the content. |
© 2025 by the authors. Licensee MDPI, Basel, Switzerland. This article is an open access article distributed under the terms and conditions of the Creative Commons Attribution (CC BY) license (http://creativecommons.org/licenses/by/4.0/).
Copyright: This open access article is published under a Creative Commons CC BY 4.0 license, which permit the free download, distribution, and reuse, provided that the author and preprint are cited in any reuse.


