Submitted:
13 August 2025
Posted:
14 August 2025
You are already at the latest version
Abstract
The influence of supercritical CO2 on natural gas dissolution-exsolution mechanisms under high-temperature and high-pressure (HTHP) reservoir conditions remains insufficiently investigated, affecting reserve evaluation accuracy. This study systematically investigates fluid-phase characteristics in the LD10-X gas field, impacts of mixing ratio, sequence, temperature, and pressure on CO2/CH4 solubility, and CO2/CH4 exsolution patterns. Mixing ratio experiments showed CH4 will not appear in mixed solution when CO2 mole fraction exceeds 7%. Solubility sequence tests revealed CH4 will be no longer dissolved when CO2 reached solubility equilibrium. However, CO2 will continue to be dissolved when CH4 reaches the solubility equilibrium. Solubility with temperature and pressure experiments showed that solubility of both CO2 and CH4 increased with rising temperature and pressure. In addition, exsolution amount increased slowly and then increased rapidly with the increase of the pressure difference for the CO2 in the CO2 and CH4 phase. Besides, these laws were employed to explain the changes in CH4 and CO2 concentrations during the drill steam testing of wells LD10-X-10 and LD10-X-12, mainly because the extraction capacity of CO2 decreased after pressure reduction. Additionally, CO2 produced by chemical equilibrium movements will extract excess CH4 again. This study provides guidelines for the evaluation of CO2 geological storage abundance.
Keywords:
solubility
; exsolution
; CO2 and CH4
; high temperature
; high pressure
; LD10-X
1. Introduction
The solubility and exsolution of CO2 and CH4 in formation water is an important part of global carbon cycle research, which occupies a significant position in the research of natural gas reservoir exploration, development and CO2 geological storage [1,2,3,4,5]. Under high temperature and high pressure, CH4 is distributed as dissolved state, dispersed free state and continuous free state, respectively. Solution gas will gradually precipitate and migrate to the high part with the attenuation of reservoir pressure, which will form a new free gas reservoir [6,7,8]. At present, the law of hydrocarbon-water solubility and exsolution under formation conditions is mostly obtained by physical simulation experiments [9,10,11] or thermodynamic calculations [12,13,14,15] and molecular dynamics simulations [16,17]. The solubility of natural gas in formation water has been carried out early by foreign scholars. In the 1960s, many scholars have measured the solubility of hydrocarbon gases in water and proposed the possibility of forming water-soluble gas reservoirs [18,19,20]. The effects of temperature, pressure and salinity were systematically analyzed by Yang et al. It was found that the increase of pressure significantly increased the solubility, while the effect of temperature on solubility was complex and nonlinear [21]. In recent years, the research on the solubility of natural gas has gradually shifted from atmospheric gas reservoirs to the solubility of natural gas in water under the conditions of high pressure and high temperature gas reservoirs [22,23,24,25]. Many scholars have also carried out research on the solubility characteristics of non-hydrocarbon gases [26,27,28,29]. By adjusting the chemical composition of temperature, pressure and water, Hemmati-Sarapardeh (2020) found that the increase of pressure significantly increased the solubility of carbon dioxide, but it did not further explore the multi-factor interaction [30]. Under the condition of high temperature and high pressure, hydrocarbons are miscible with water and organic-inorganic interaction occurs. The presence of CO2 will promote a stronger degree of miscible between hydrocarbons and water. The main reason is that the CO2 produced and exsolution when the chemical equilibrium of CO2 moves will re-extract the excess CH4, resulting in a significant solubility of CH4 components and an increase in CH4 concentration [31]. Xie et al. (2014) conducted a comprehensive analysis of hydrocarbon component dissolution-exsolution dynamics across distinct sedimentary facies, establishing critical correlations between lithological characteristics and gas phase behaviors. They found that the properties of formation water, rock mineral composition and other factors in the sedimentary environment will affect the solubility and exsolution behavior of natural gas components. The adsorption of heavy hydrocarbon components in natural gas in clay-rich strata is enhanced, which affects the solubility and solubility process of natural gas in water [32]. Although many reports on the solubility process of CH4 and CO2 under single-phase and mixed-phase conditions at different temperatures and pressures, there are few experimental models suitable for complex geological conditions such as ultra-high temperature and pressure [33,34]. Besides, due to the lack of ultra-high temperature and high pressure experimental device, there are still lack solubility and exsolution parameters of CO2 and CH4 in the reservoir of ultra-high temperature and pressure can not fully meet the demand the evaluation of natural gas reservoir geological reserves and CO2 geological storage abundance. In this work, the fluid phase characteristics of LD10-X gas field, the effects of mixing ratio, mixing sequence, temperature and pressure on the solubility of CO2 and CH4, and the exsolution law of CO2 and CH4 were studied, respectively. At the same time, the solubility and exsolution law of CO2 and CH4 were employed to explain the reasons for the changes in CH4 and CO2 concentrations during the drill steam testing of wells LD10-X-10 and LD10-X-12 in the ultra-high temperature and pressure gas field. This study provides technical guidelines for the evaluation of natural gas reservoir geological reserves and CO2 geological storage abundance.
2. Geological Characteristics of LD10-X Gas Field
The LD10-X gas field is located in the southern part of the Yinggehai depression slope zone in the western part of the northern continental shelf of the South China Sea. The water depth within the gas field ranges from 87.0 m to 90.5 m. The Huangliu Formation in the LD10-X gas field represents a structural-lithologic gas reservoir. The burial depth of the central part of the gas reservoir is 3894.6m ~ 4273.3m. It is vertically divided into six gas-bearing layers: H1IV, H2I, H2II, H2III, H2IV and H2V gas groups. Planar analysis reveals that sand bodies have been truncated to form structural-lithologic gas reservoirs with varied gas-water systems (Figure 1). The formation pressure coefficient ranges from 2.174 to 2.305, indicating an abnormal high-pressure system. The original formation pressure spans 84.289 MPa to 93.598 MPa, with original formation temperatures ranging from 190.11 °C to 208.63 °C. What’s more, the geothermal gradient is 4.89 °C/100 m, which is an abnormal high temperature system. The gas reservoir drive type is mainly elastic drive, followed by weak edge water drive and individual bottom water drive [35,36,37]. In summary, the Huangliu Formation of LD10-X gas field is a structural-lithologic gas reservoir with abnormal high pressure elastic water drive.
The genesis of high-temperature and high-pressure fluids in the LD10-X area is associated with undercompaction overpressure caused by rapid sedimentation, fluid expansion overpressure formed after fluid injection, and late-stage deep thermal fluid activities. There were three main periods of significant fluid injections, with the first two periods involving high-pressure hydrocarbon fluids and the third period involving CO2-rich high-pressure thermal fluids. Microfractures in mudstone interlayers opened during the injection of CO2-rich high-pressure thermal fluids influenced by diapir structural activities, which lead to variations in natural gas composition, gas saturation, and the relative proportion of CO2 among different gas groups. The relative density of natural gas in the LD10-X gas field ranges from 0.670 to 1.258. Overall, the methane concentration varies between 24.58% and 82.97%, and carbon dioxide concentration spans from 6.18% to 70.99%. The distribution pattern of natural gas properties among different gas groups indicates that the concentration of CO2 increases with depth vertically, with the H2III gas group serving as a distinct boundary. Above the H2III gas group, the concentration of CO2 is relatively low (6.18%-23.49%). In contrast, the the concentration of CO2 in the H2IV gas group and deeper layers below the H2III gas group ranges from 43.43% to 70.99%. There is a gradual increase in the concentration of CO2 from the lower structural parts to the higher structural areas and further to the elevated sections of the eastern branch channel on the slope.
3. Materials and Methods
3.1. Materials
The ultra-high temperature and high pressure reactor used in the experiment was produced by Dustec Hochdrucktechnik company, Germany. The Agilent 7890B gas chromatograph employed in the study was obtained from Agilent Technologies, America. The 2331-D gas measurement used in the experiment was produced by Jiangsu Lianyou Scientific Research Instrument Co., Ltd. China.
3.2. Methods
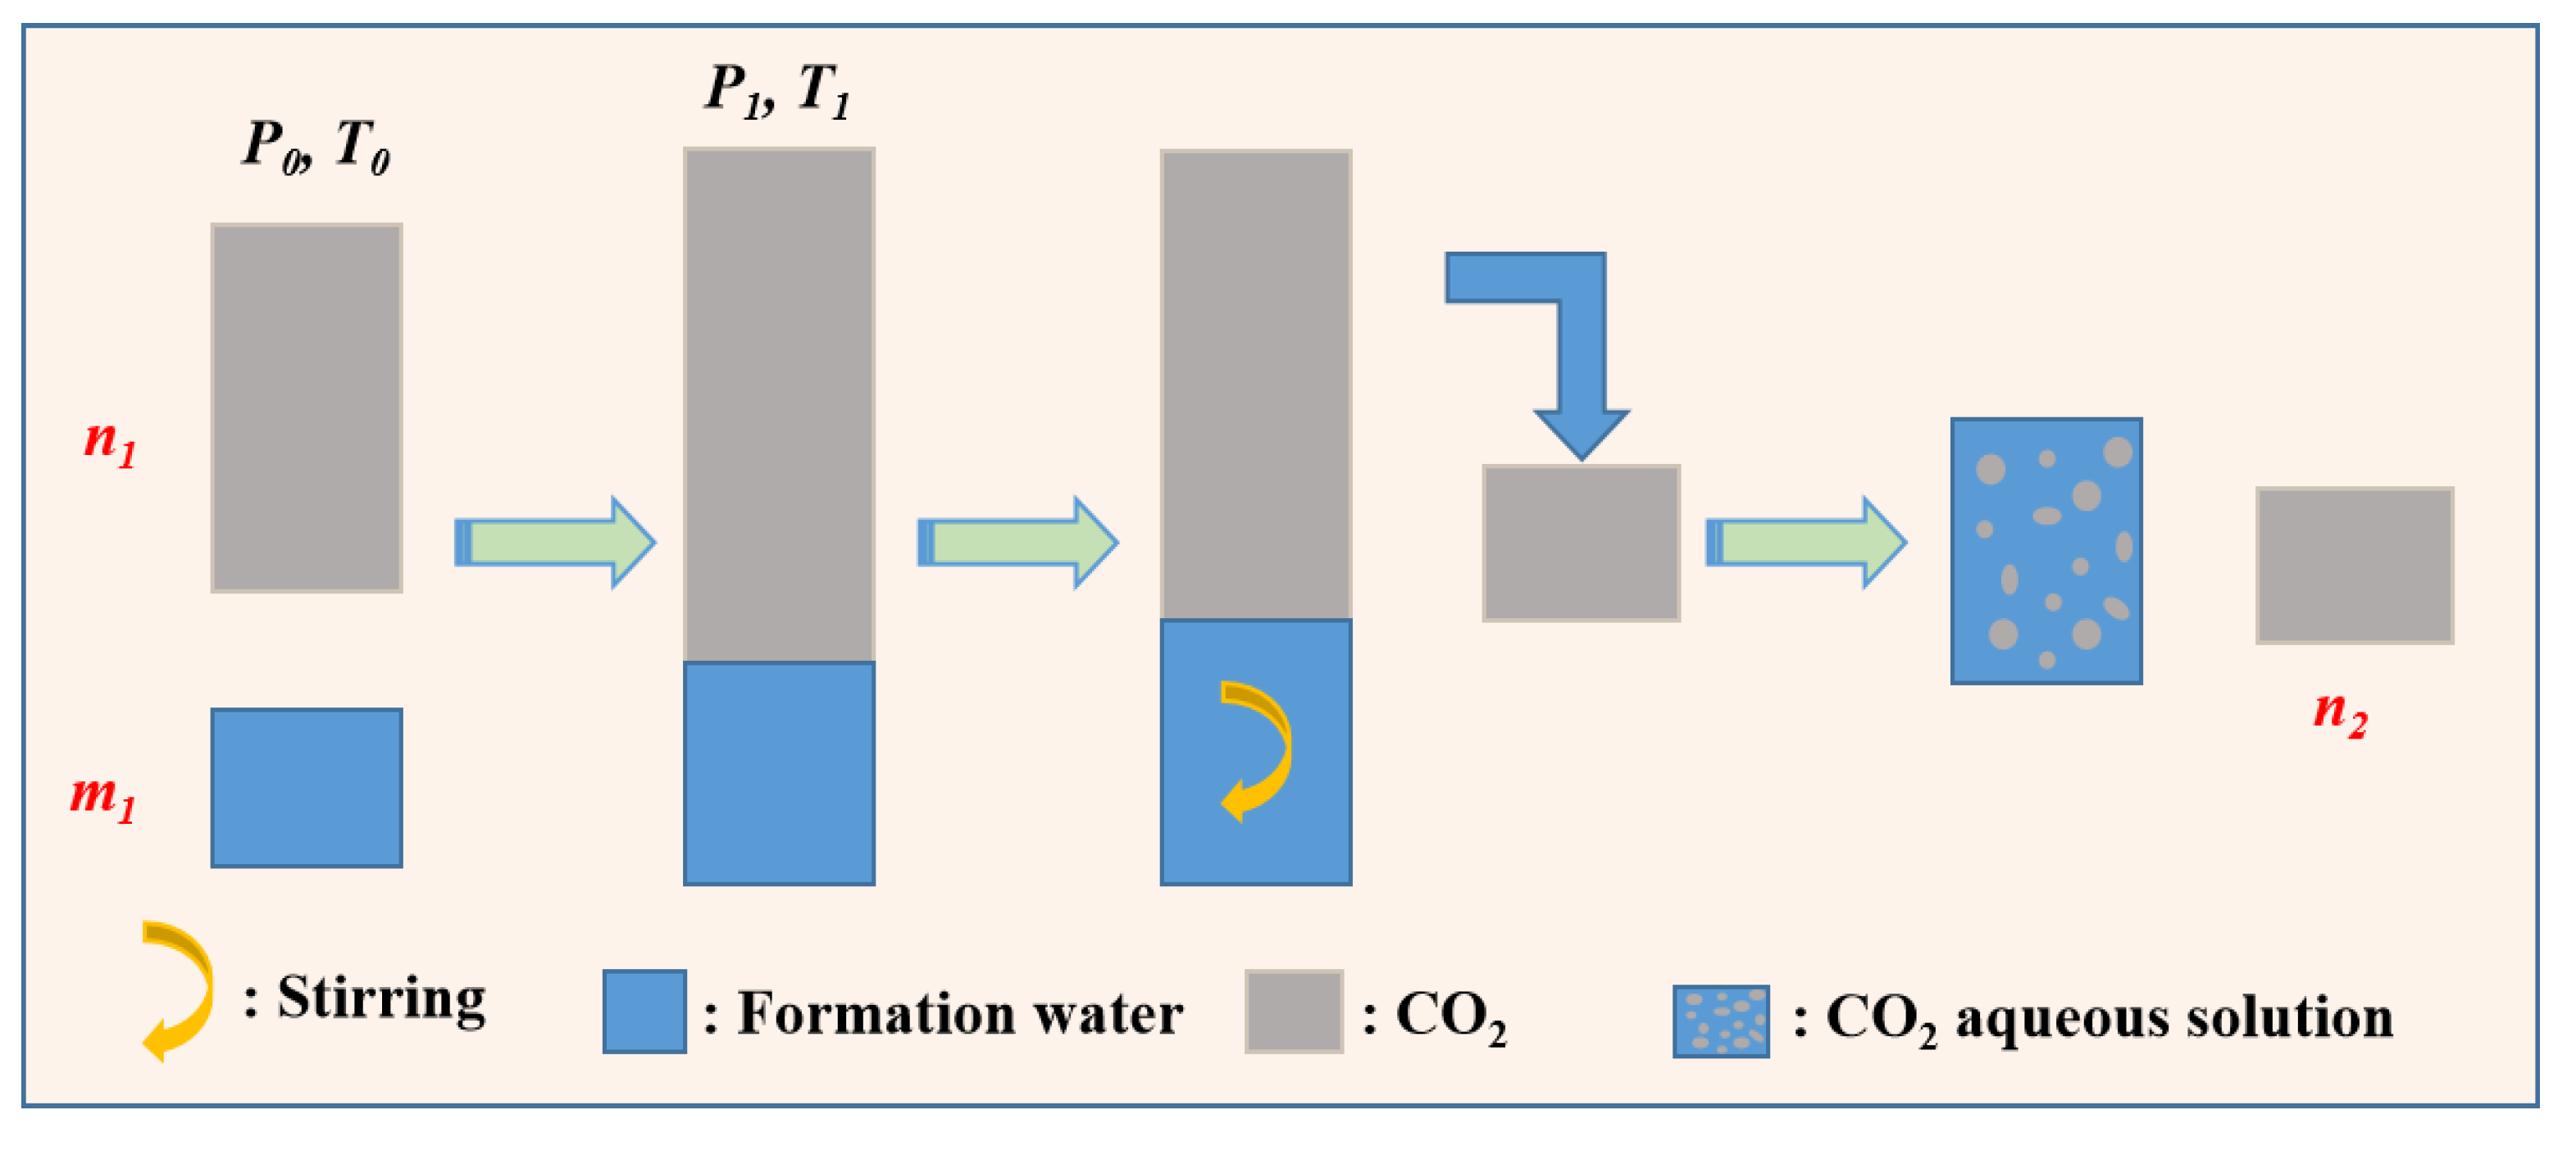
3.2.1. Measurement of Solubility of CO2
The formation water solution of LD10-X was loaded into the ultra-high temperature and high pressure reactor, and the experimental temperature and pressure were adjusted to P1 and T1. The excessive CO2 was injected into the formation aqueous solution and stirred for more than 24 h. After the gas-liquid equilibrium of the reactor was stable, the excess free gas was discharged. The concentration of each component was measured by the gas chromatograph, and the amount of CO2 gas discharged was measured by gas measurement. Table 1 depicts the characteristics of formation water in X-1 reservoir. Fig 2 demonstrates the ion composition of the formation water of LD10-X gas field. The solubility of CO2 is shown:
Where, S represents the solubility of CO2 (m3/m3), n1 and n2 represent the mole fraction of injected and free gas of CO2, respectively (m3). m1 is the initial volume of formation water (m3).
Figure 2.
Experimental diagram of CO2 solubility in formation water.
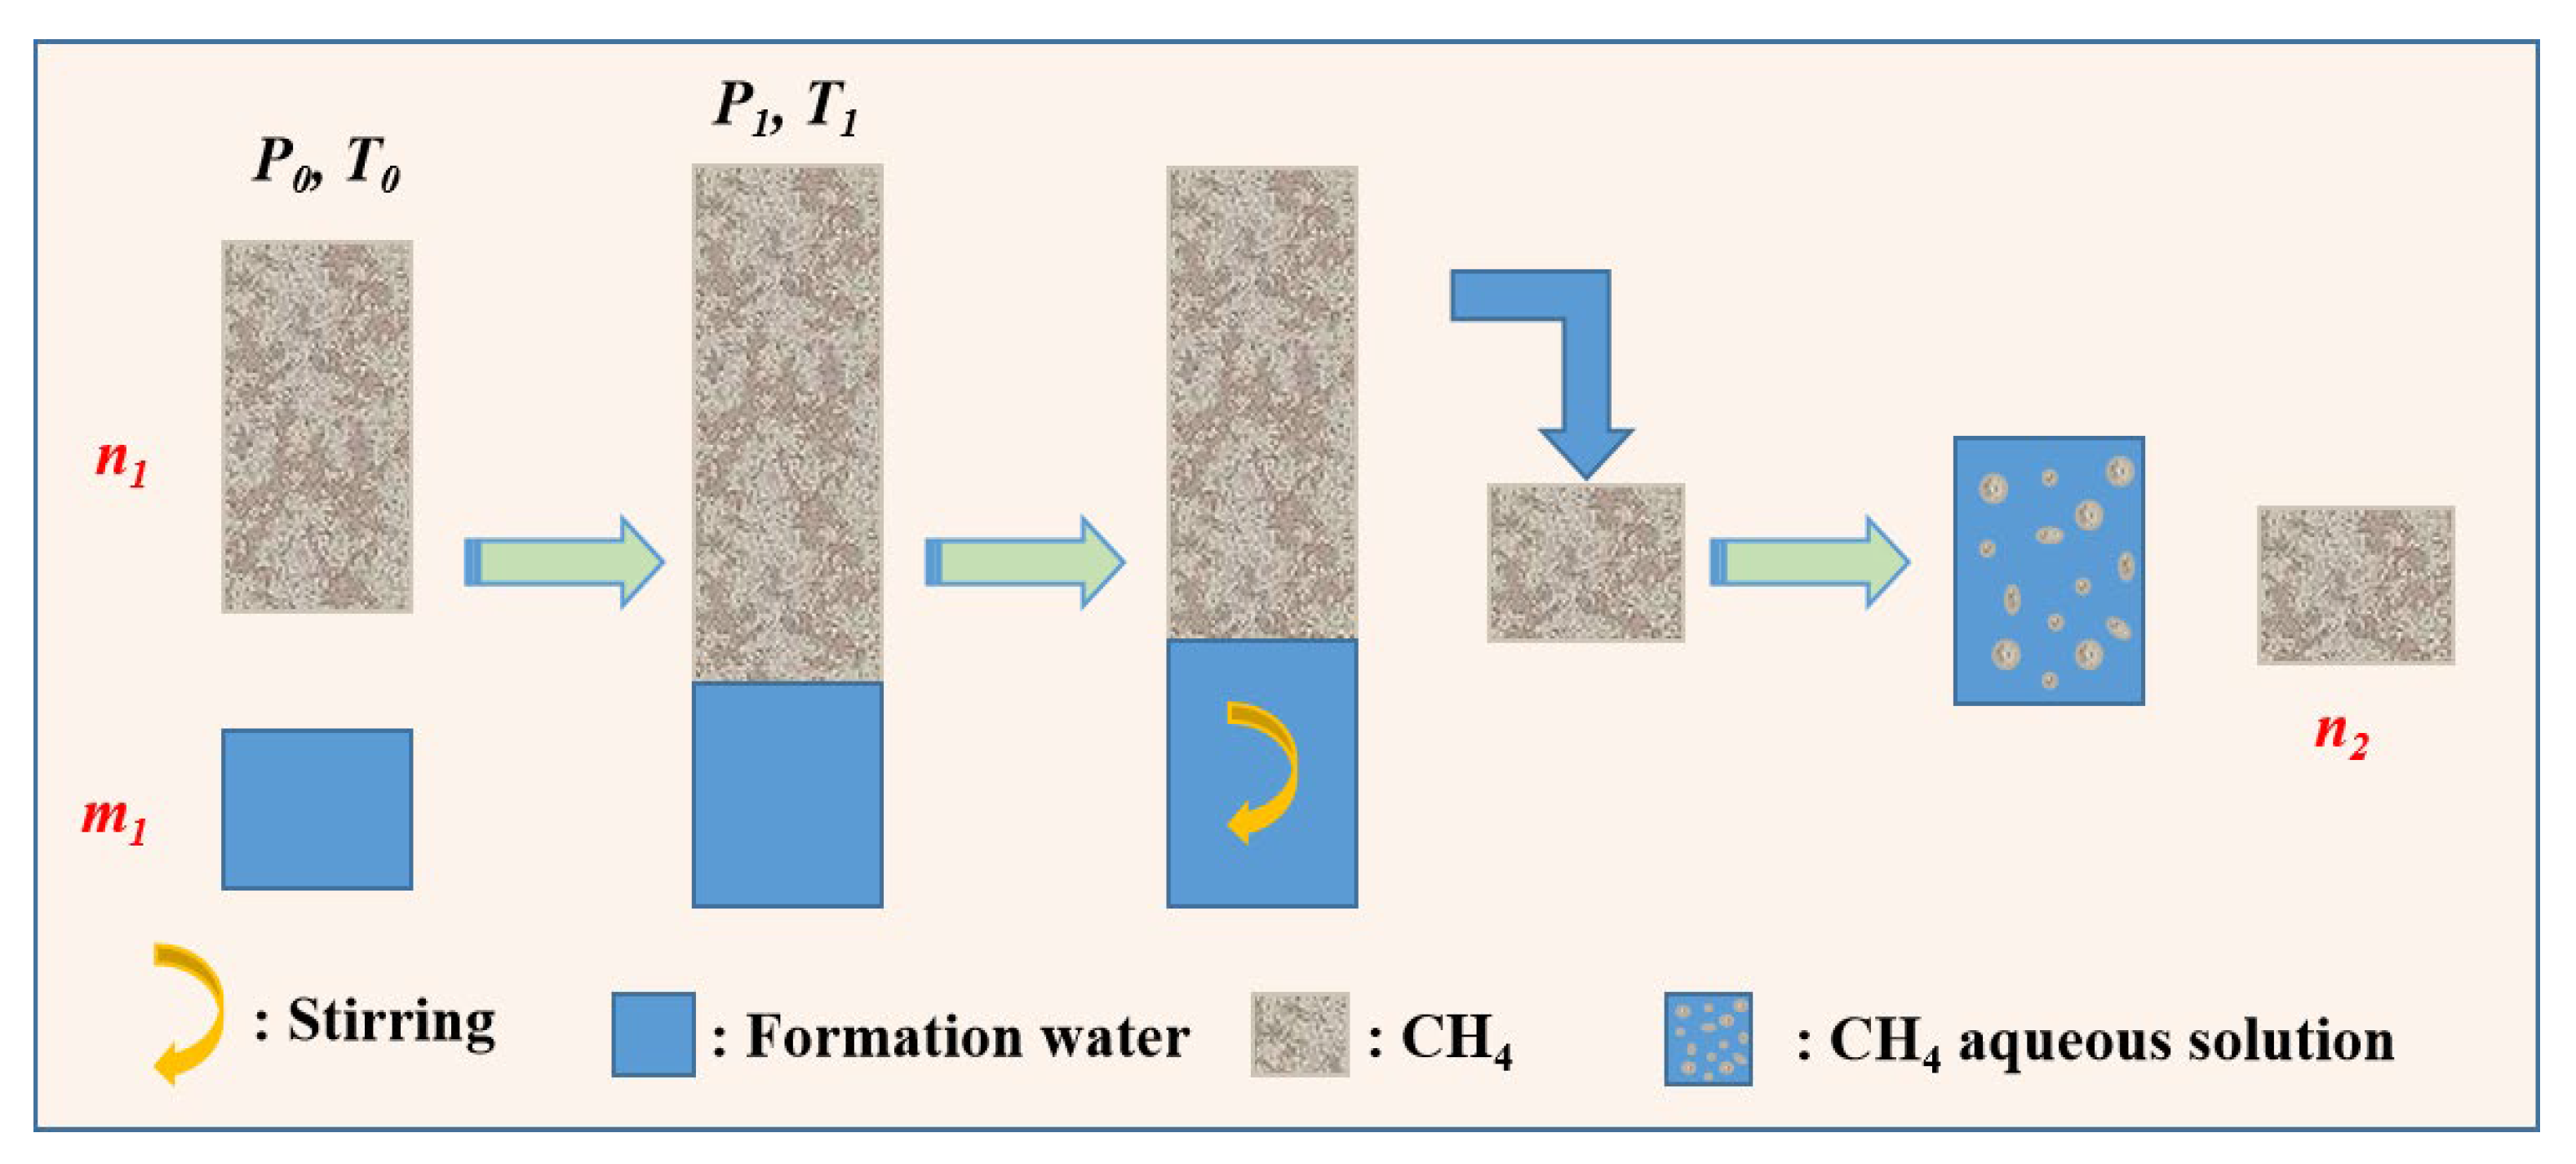
3.2.2. Measurement of Solubility of CH4
The formation water solution from LD10-X was transferred into the ultra-high temperature and high pressure reactor, and the experimental conditions were set to the predetermined values of P1 and T1. A predetermined volume of excess CH4 was then injected into the formation aqueous solution, followed by continuous stirring for at least 24 hours. Once the system reached gas-liquid equilibrium, the excess free gas was carefully discharged. The concentrations of all components were determined by the gas chromatograph, and the volume of CH4 gas released was measured using gas measurement. Fig 3 depicts the experimental diagram of CH4 solubility in formation water. The solubility of CH4 is shown in equation 2.
Where, S is the solubility of CH4 (m3/m3), n1 and n2 are the mole fraction of injected and free gas of CH4, respectively (m3). m1 represents the initial volume of formation water (m3).
Figure 3.
Experimental diagram of CH4 solubility in formation water.
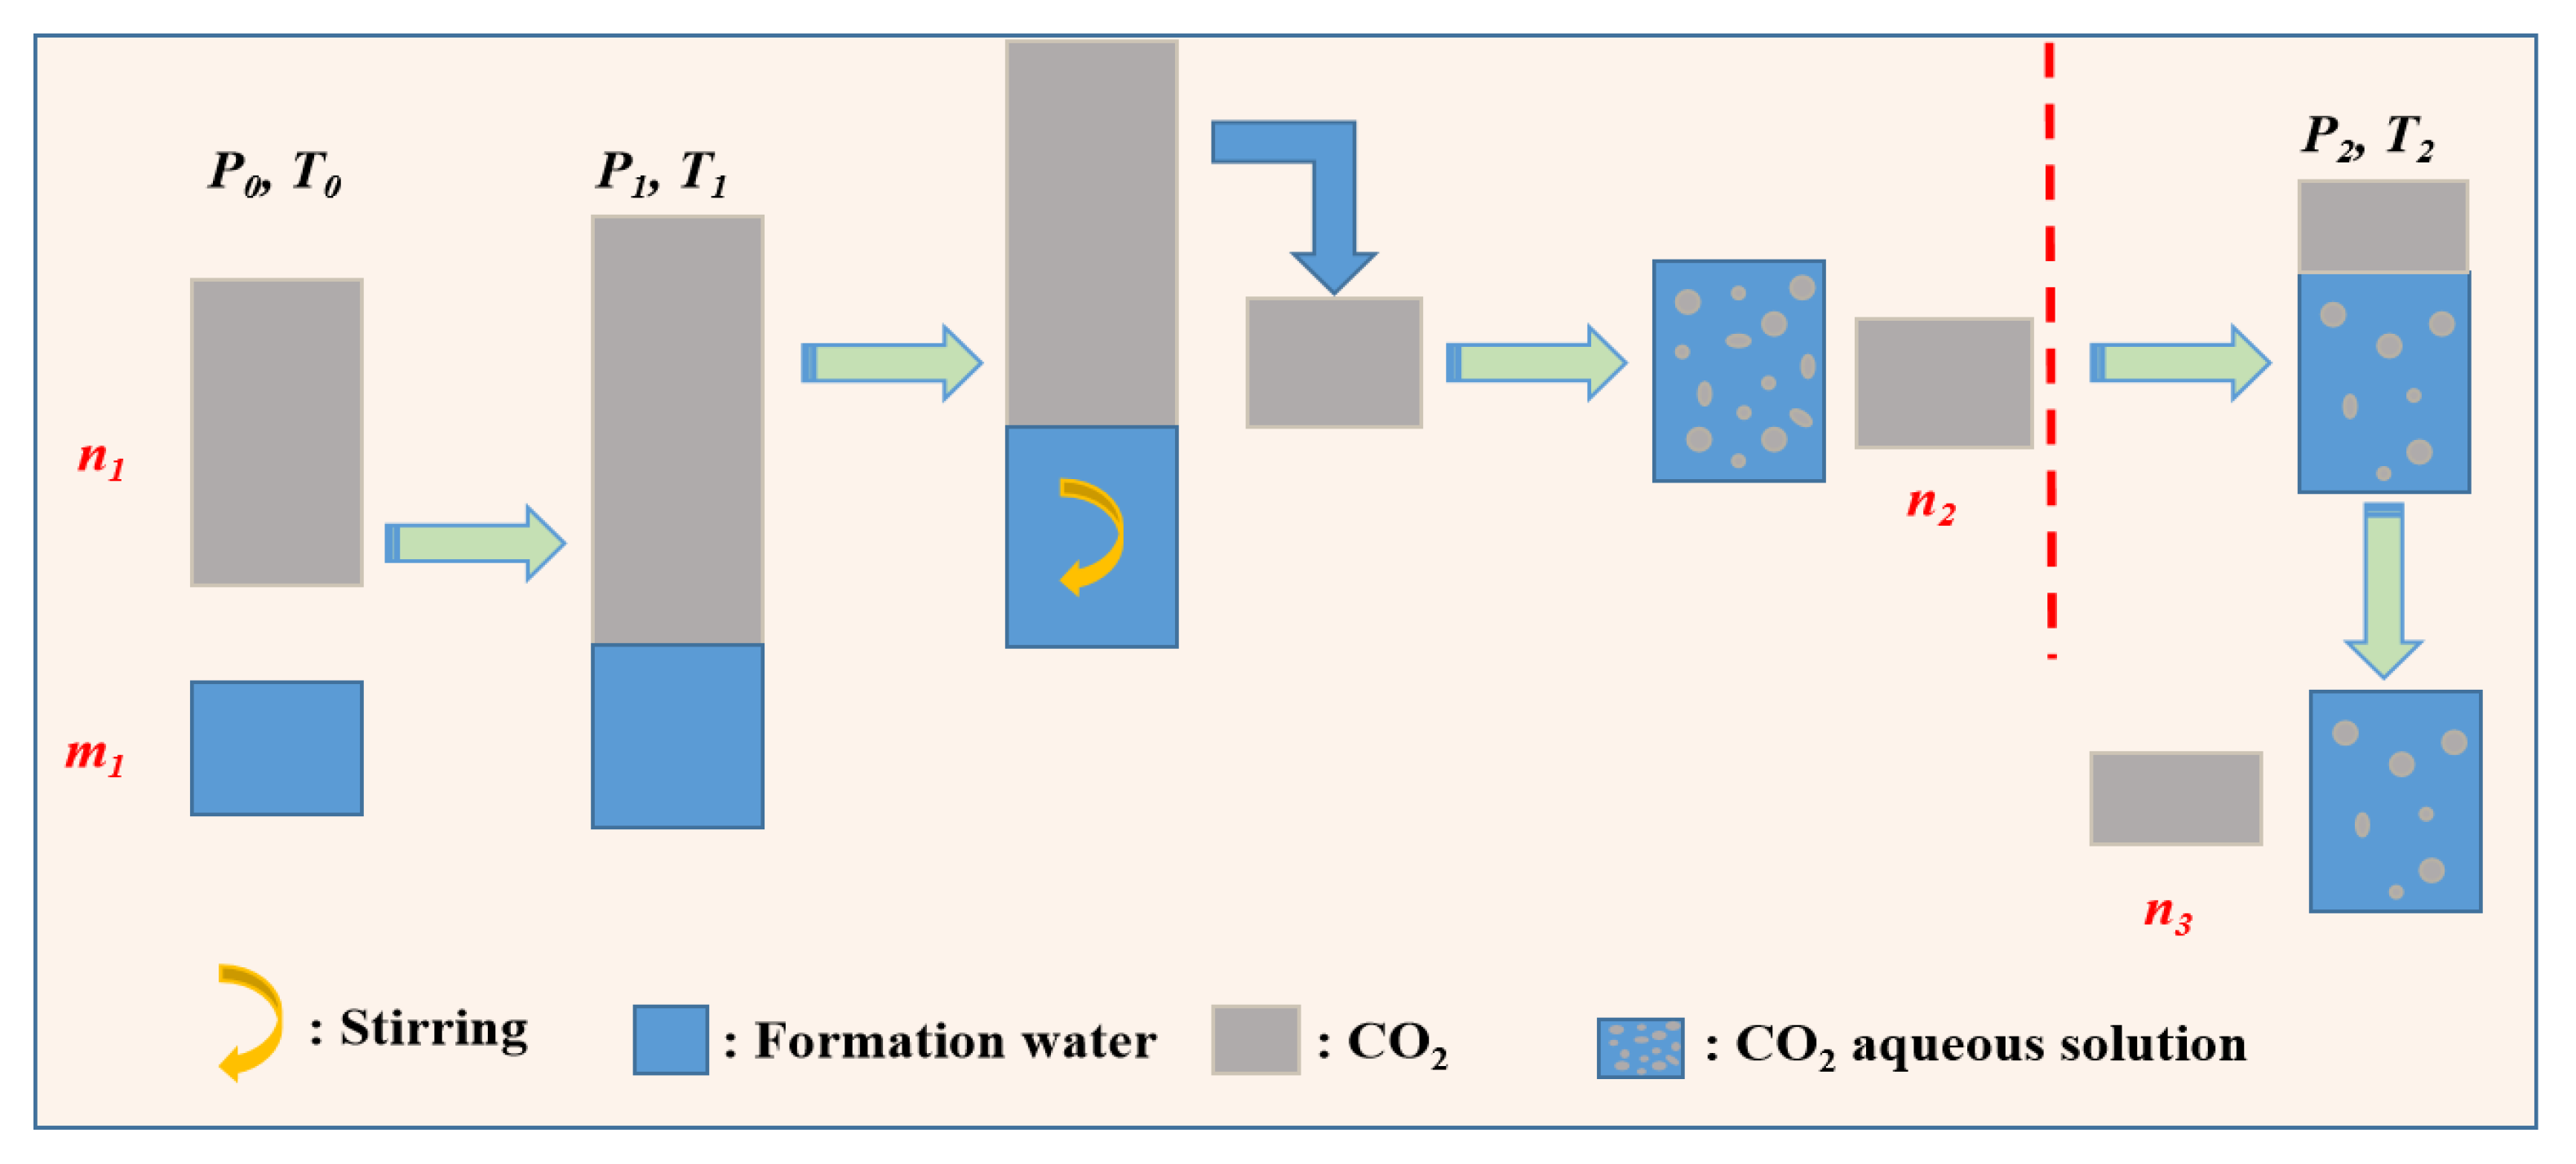
3.2.3. Measurement of Exsolution of CO2
The CO2 exsolution experiment was conducted based on the solubility of CO2 experimental foundation. The experimental methodology was primarily grounded in the principle of mass conservation, focusing on the equilibrium of CO2 and formation water before and after the experiment. Following the completion of the CO2 solubility test under P1 and T1 conditions, the excess gas was carefully discharged to transition the fluid in the ultra-high temperature and high pressure reactor from a supersaturated to a saturated state. The system was then brought to P2 and T2 conditions by gradually reducing the temperature and pressure. Once the gas-liquid phase equilibrium of the ultra-high temperature and high pressure reactor was stabilized, the exsolution free gas was slowly released under constant pressure conditions, and the volume of released gas was measured by gas measurement. Fig 4 demonstrates the Experimental diagram of CO2 exsolution in formation water. Equation 3 depicts the exsolution of CO2 in formation water.
Figure 4.
Experimental diagram of CO2 exsolution in formation water.
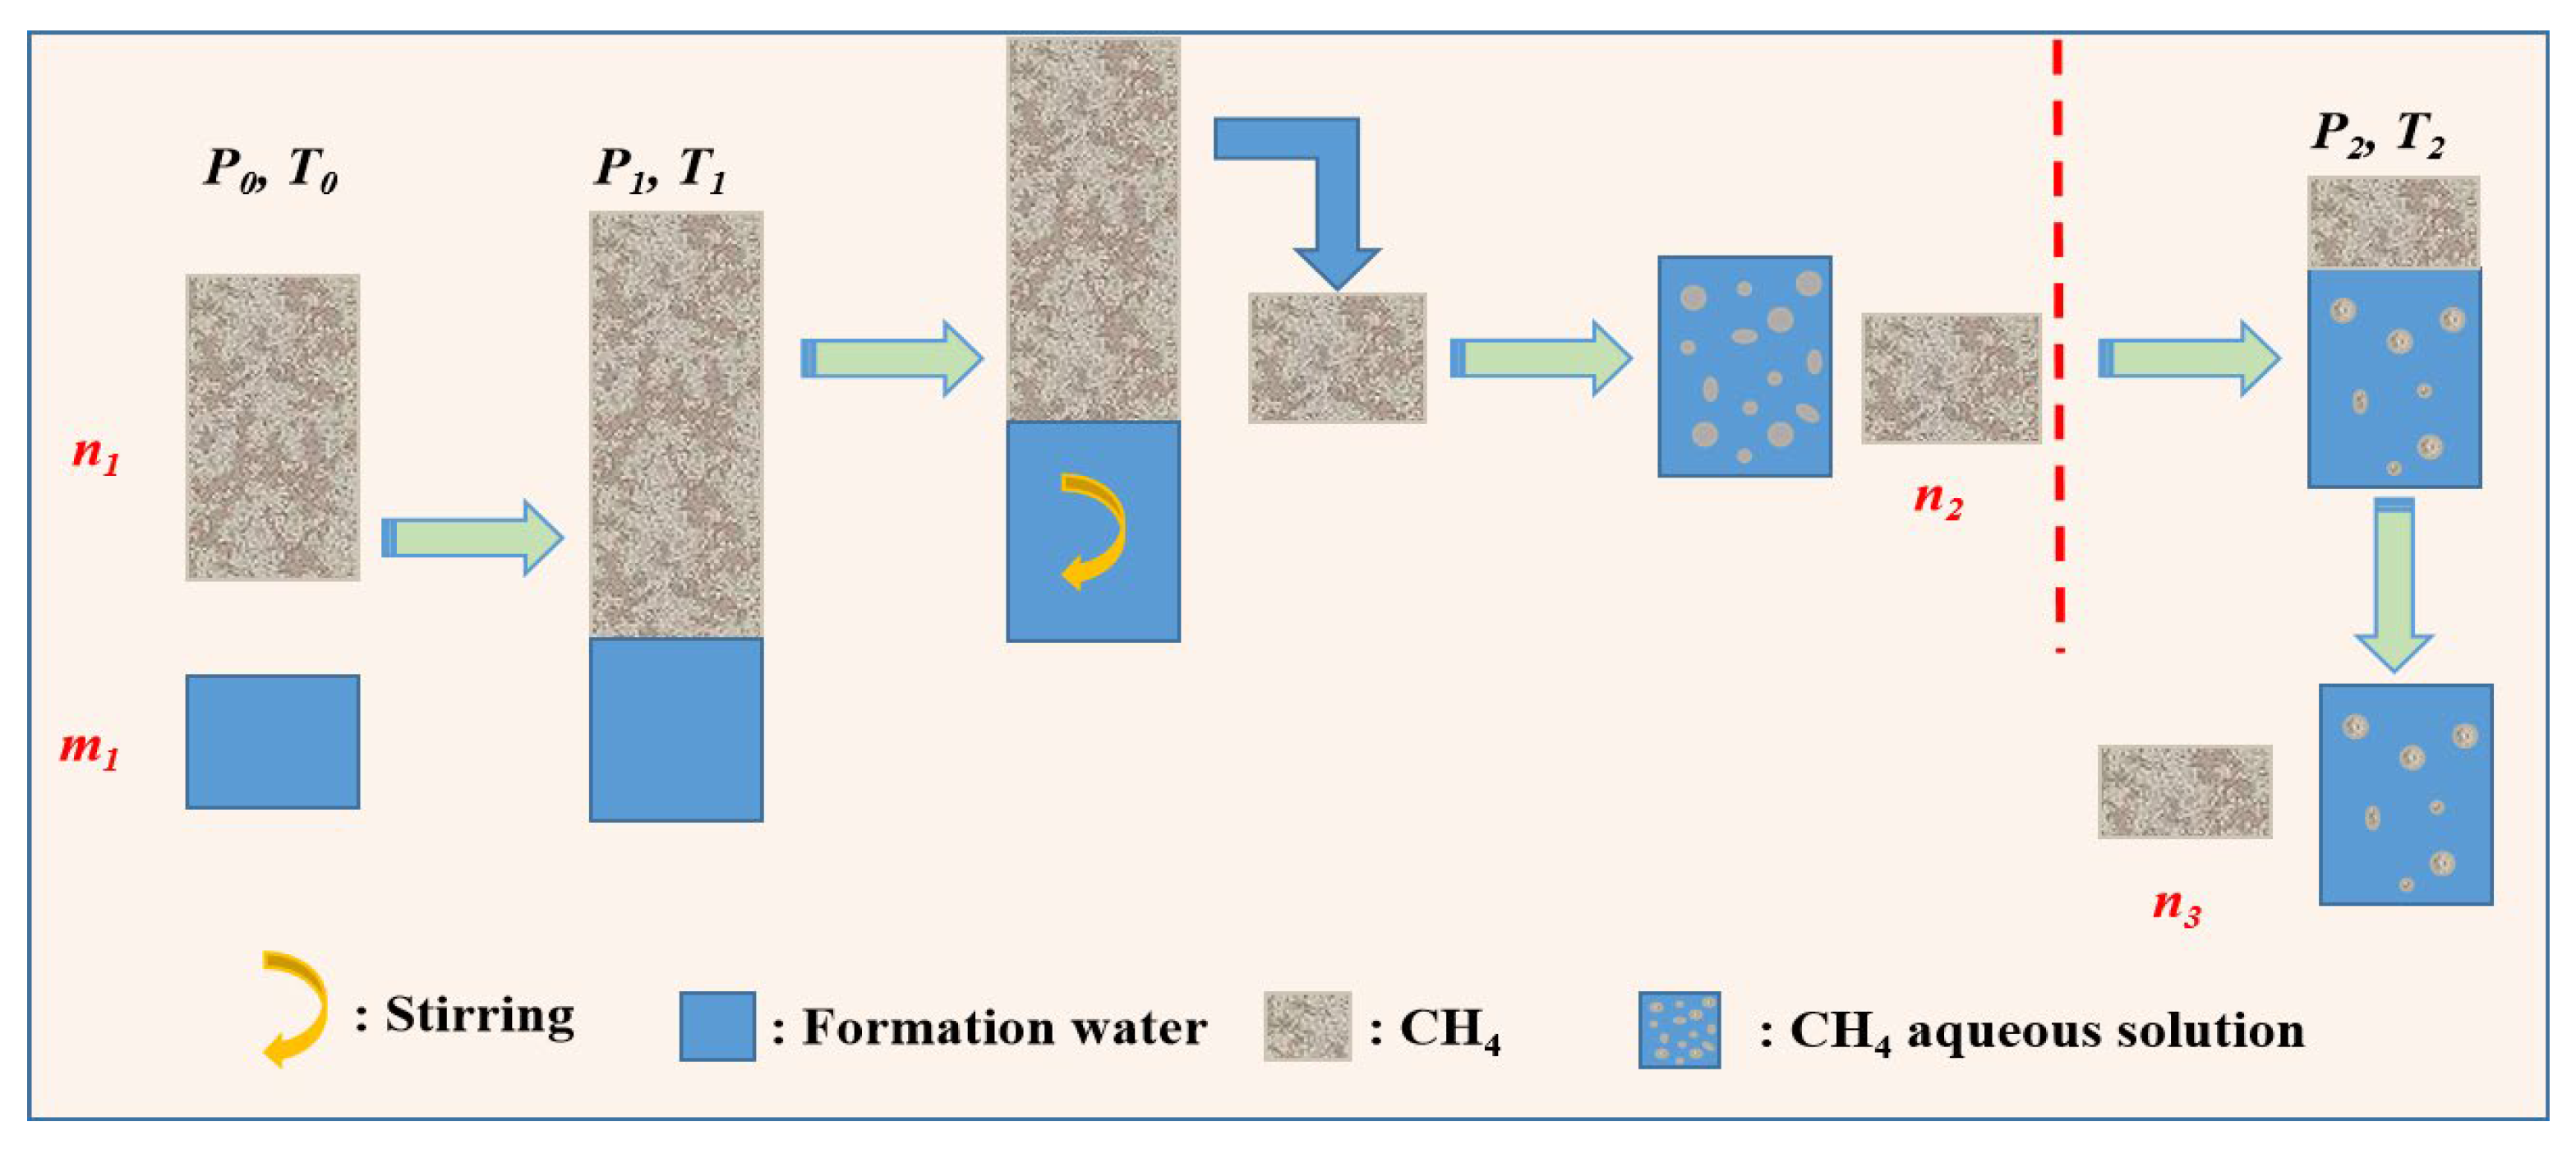
3.2.4. Measurement of Exsolution of CH4
The solubility experiment of CH4 was carried out on the basis of CH4 solubility experiment. The experimental principle was mainly based on the principle of mass conservation of CH4 and formation water before and after the experiment. After the solubility test of CH4 was completed under P1 and T1 conditions, the excess gas was discharged to change the fluid in the ultra-high temperature and high pressure reactor from supersaturated to saturated. The temperature and pressure were reduced to P2 and T2 conditions. After the gas-liquid phase equilibrium of the ultra-high temperature and high pressure reactor was stable, the dissolved free gas was slowly discharged at constant pressure and the amount of gas was measured using gas measurement. Fig 5 depicts the experimental diagram of CH4 exsolution in formation water. The exsolution of CH4 is shown in equation 4.
Figure 5.
Experimental diagram of CH4 exsolution in formation water.
4. Results and Discussion
4.1. Study on fluid Phase Characteristics of LD10-X Gas Field
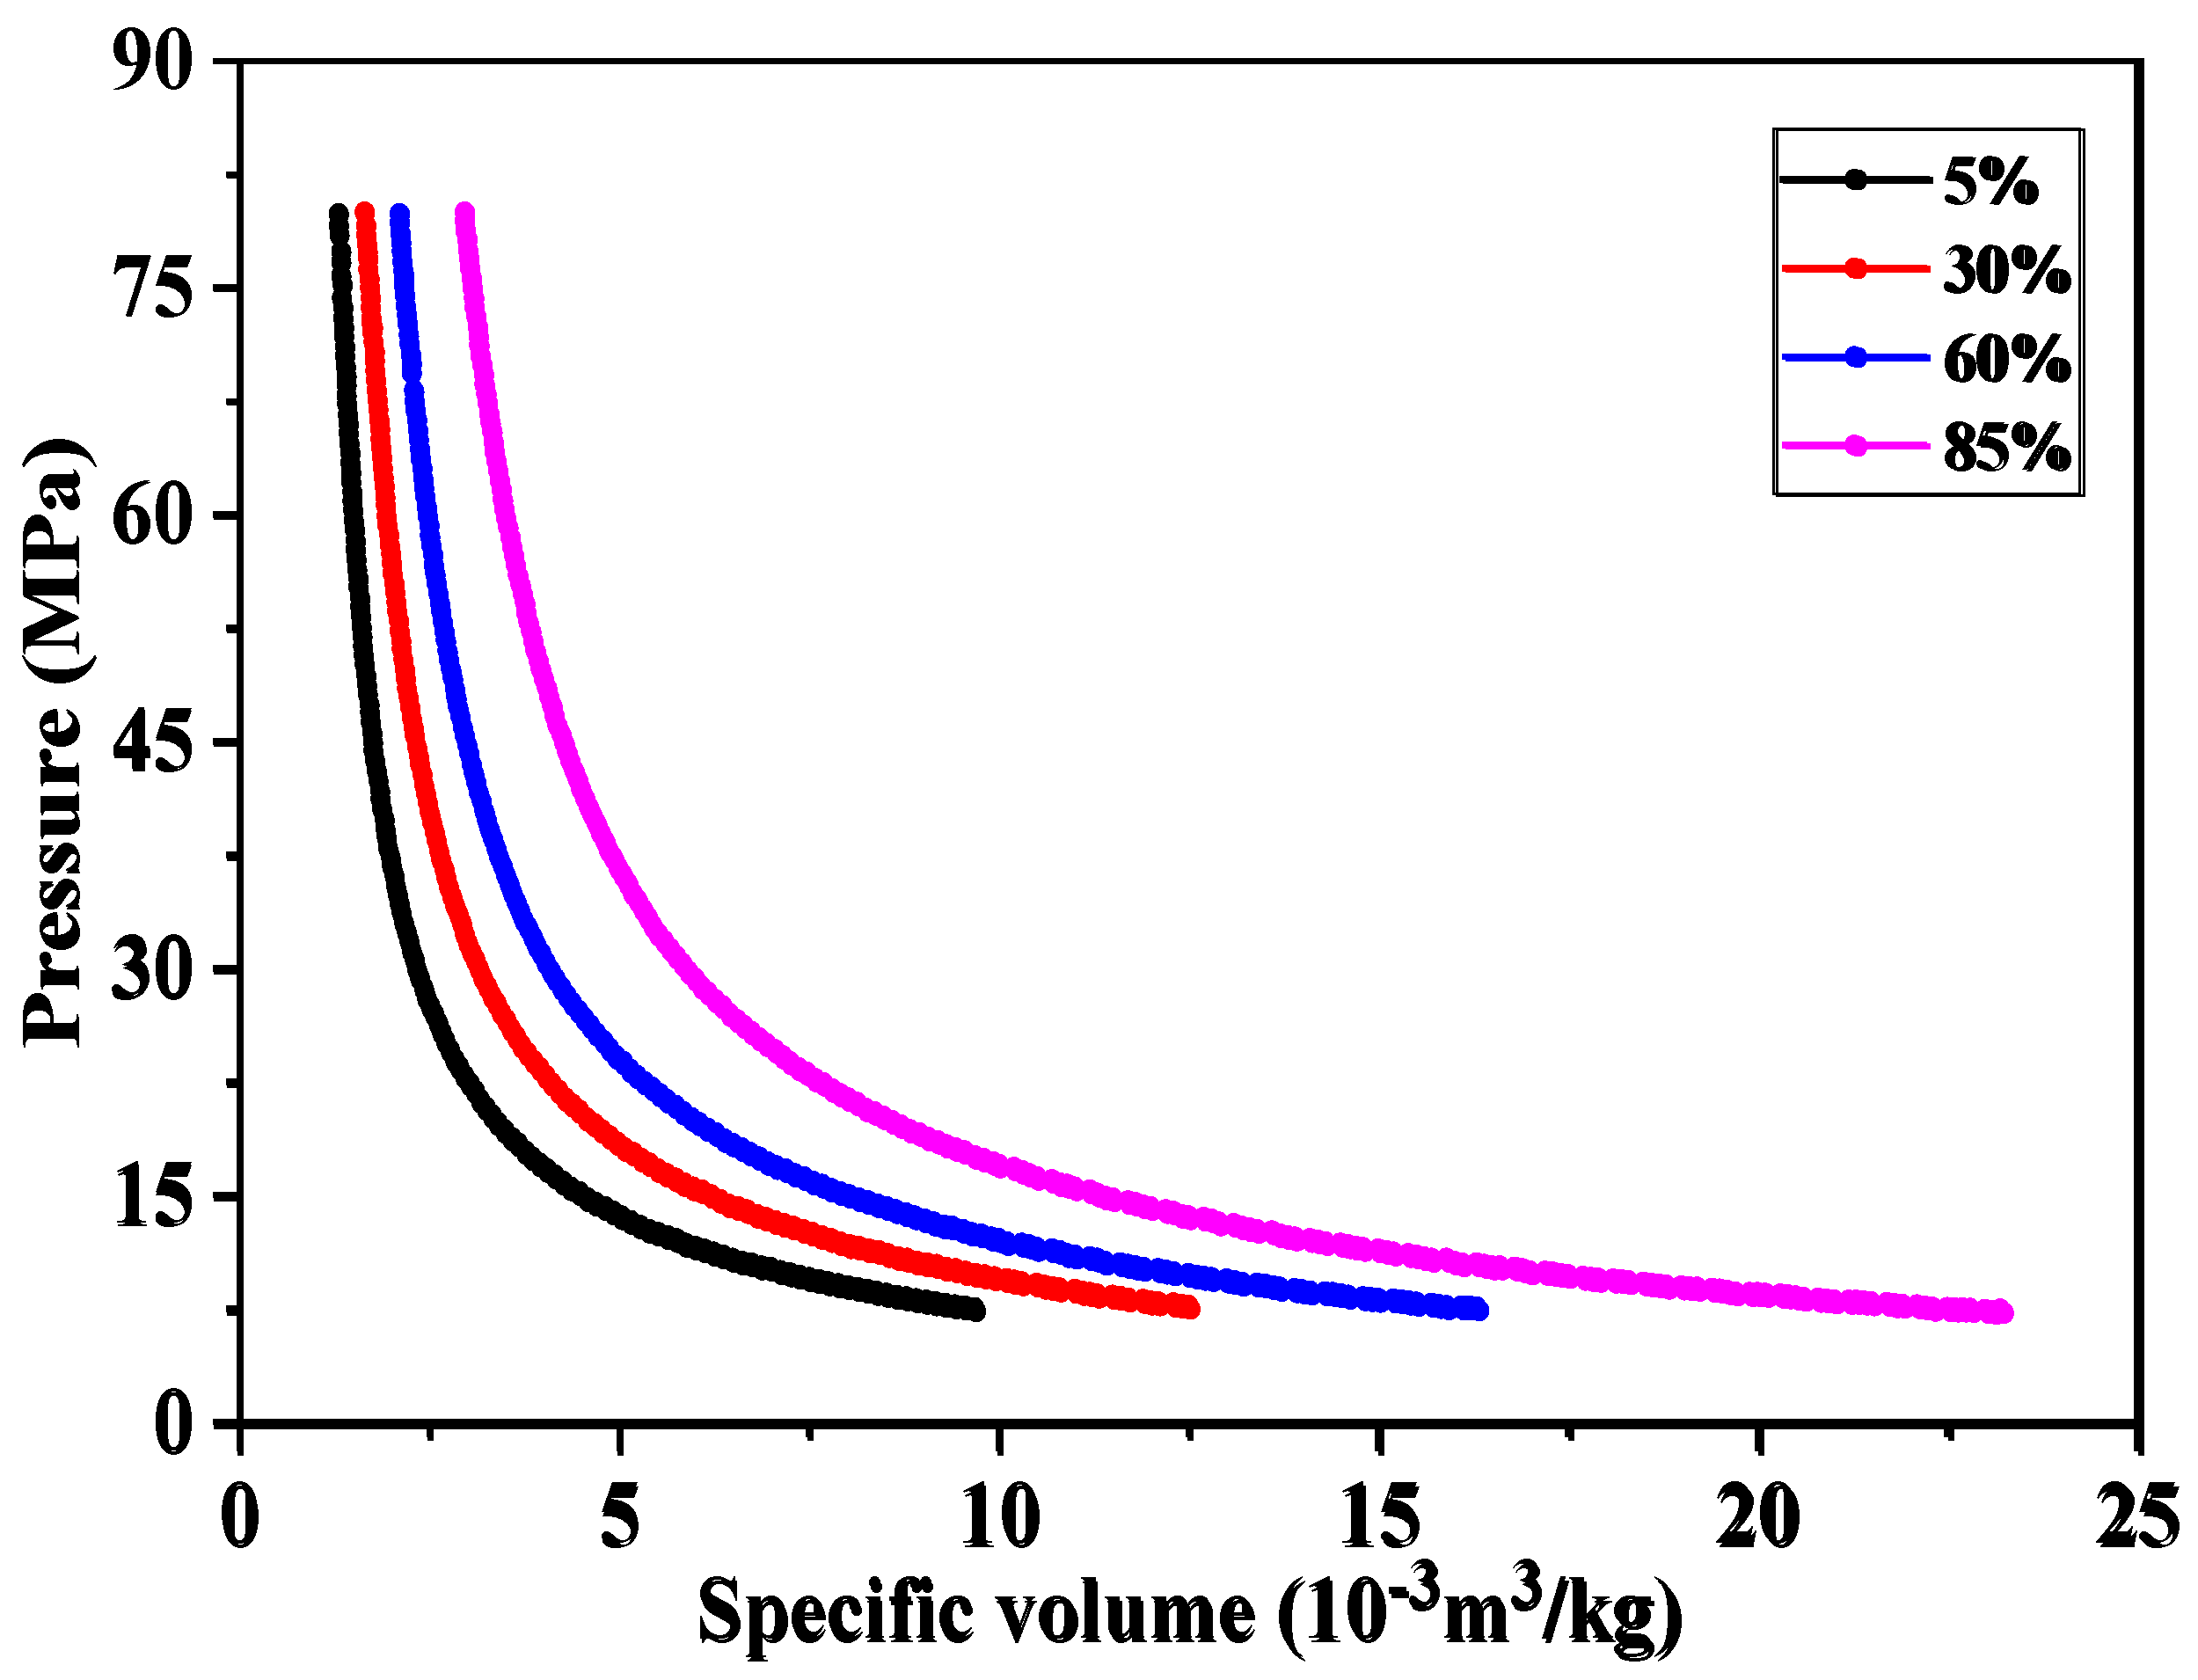
Within the temperature and pressure range of 20-210 °C and 0.1-100 MPa, CO2 exhibits distinct phases, including gas, liquid, and supercritical states [38,39], while CH4 primarily exists in gas and supercritical phases [40,41,42]. The basic physical properties of CO2 and CH4 fluids in different phase states will change significantly. The analysis of CO2 and CH4 fluid properties has confirmed that it is closely related to solubility. Therefore, the phase state of CO2 and CH4 significantly influences its solubility in formation water. The effects of varying component concentrations and temperature-pressure conditions on phase transitions were systematically investigated. In the CO2 and CH4 phase experiment, the fluids were configured according to the CH4 mole fraction of 5 %, 30 %, 60 % and 85 %. The P-T-V relationship under different mixing ratios was tested, and the specific volume-pressure curves under different miscible ratios were plotted (Fig 6). When the temperature and pressure are constant, the specific volume of CO2 and CH4 increases with the increase of CH4 mole fraction. In addition, the phase shifts to the gaseous state. The pure component CH4 changes from gas phase to liquid phase with the decrease of specific volume at 25 °C. The 'platform' was used as the phase transition marker on the P-V phase diagram (Fig 6). When CH4 was mixed with a small amount of CH4 (10%), the phase transition platform disappeared immediately. At low pressure, CO2 and CH4 exists in a gas state, with specific volume decreasing linearly as pressure increases. Under high-pressure conditions, CO2 and CH4 transitions into a liquid-supercritical or liquid-supercritical-gas phase. After the phase is completely changed into a liquid-supercritical phase, the specific volume decreases linearly with the increase of pressure. Therefore, the addition of CH4 at low temperature makes the phase transition marker in the mixed P-V phase diagram change from 'platform' to 'smooth curve'. CO2 and CH4 shows gas state at low pressure when the temperature is higher than the critical temperature of CH4 (Figs 7 and 8). With the increase of pressure, CO2 and CH4 successively enter the critical region, and CO2 and CH4 will in the gas-supercritical phase. Due to supercritical CH4 extraction, CH4 and CH4 form unstable 'polymeric macro-molecules' in the appropriate region with the increase of pressure and become a single phase. What’s more, both CO2 and CH4 enter the supercritical region and form a supercritical fluid in the high-pressure region.
Figure 6.
Pressure-specific volume relationship CO2 and CH4 at different CH4 mole fractions at 25 °C.
Figure 6.
Pressure-specific volume relationship CO2 and CH4 at different CH4 mole fractions at 25 °C.
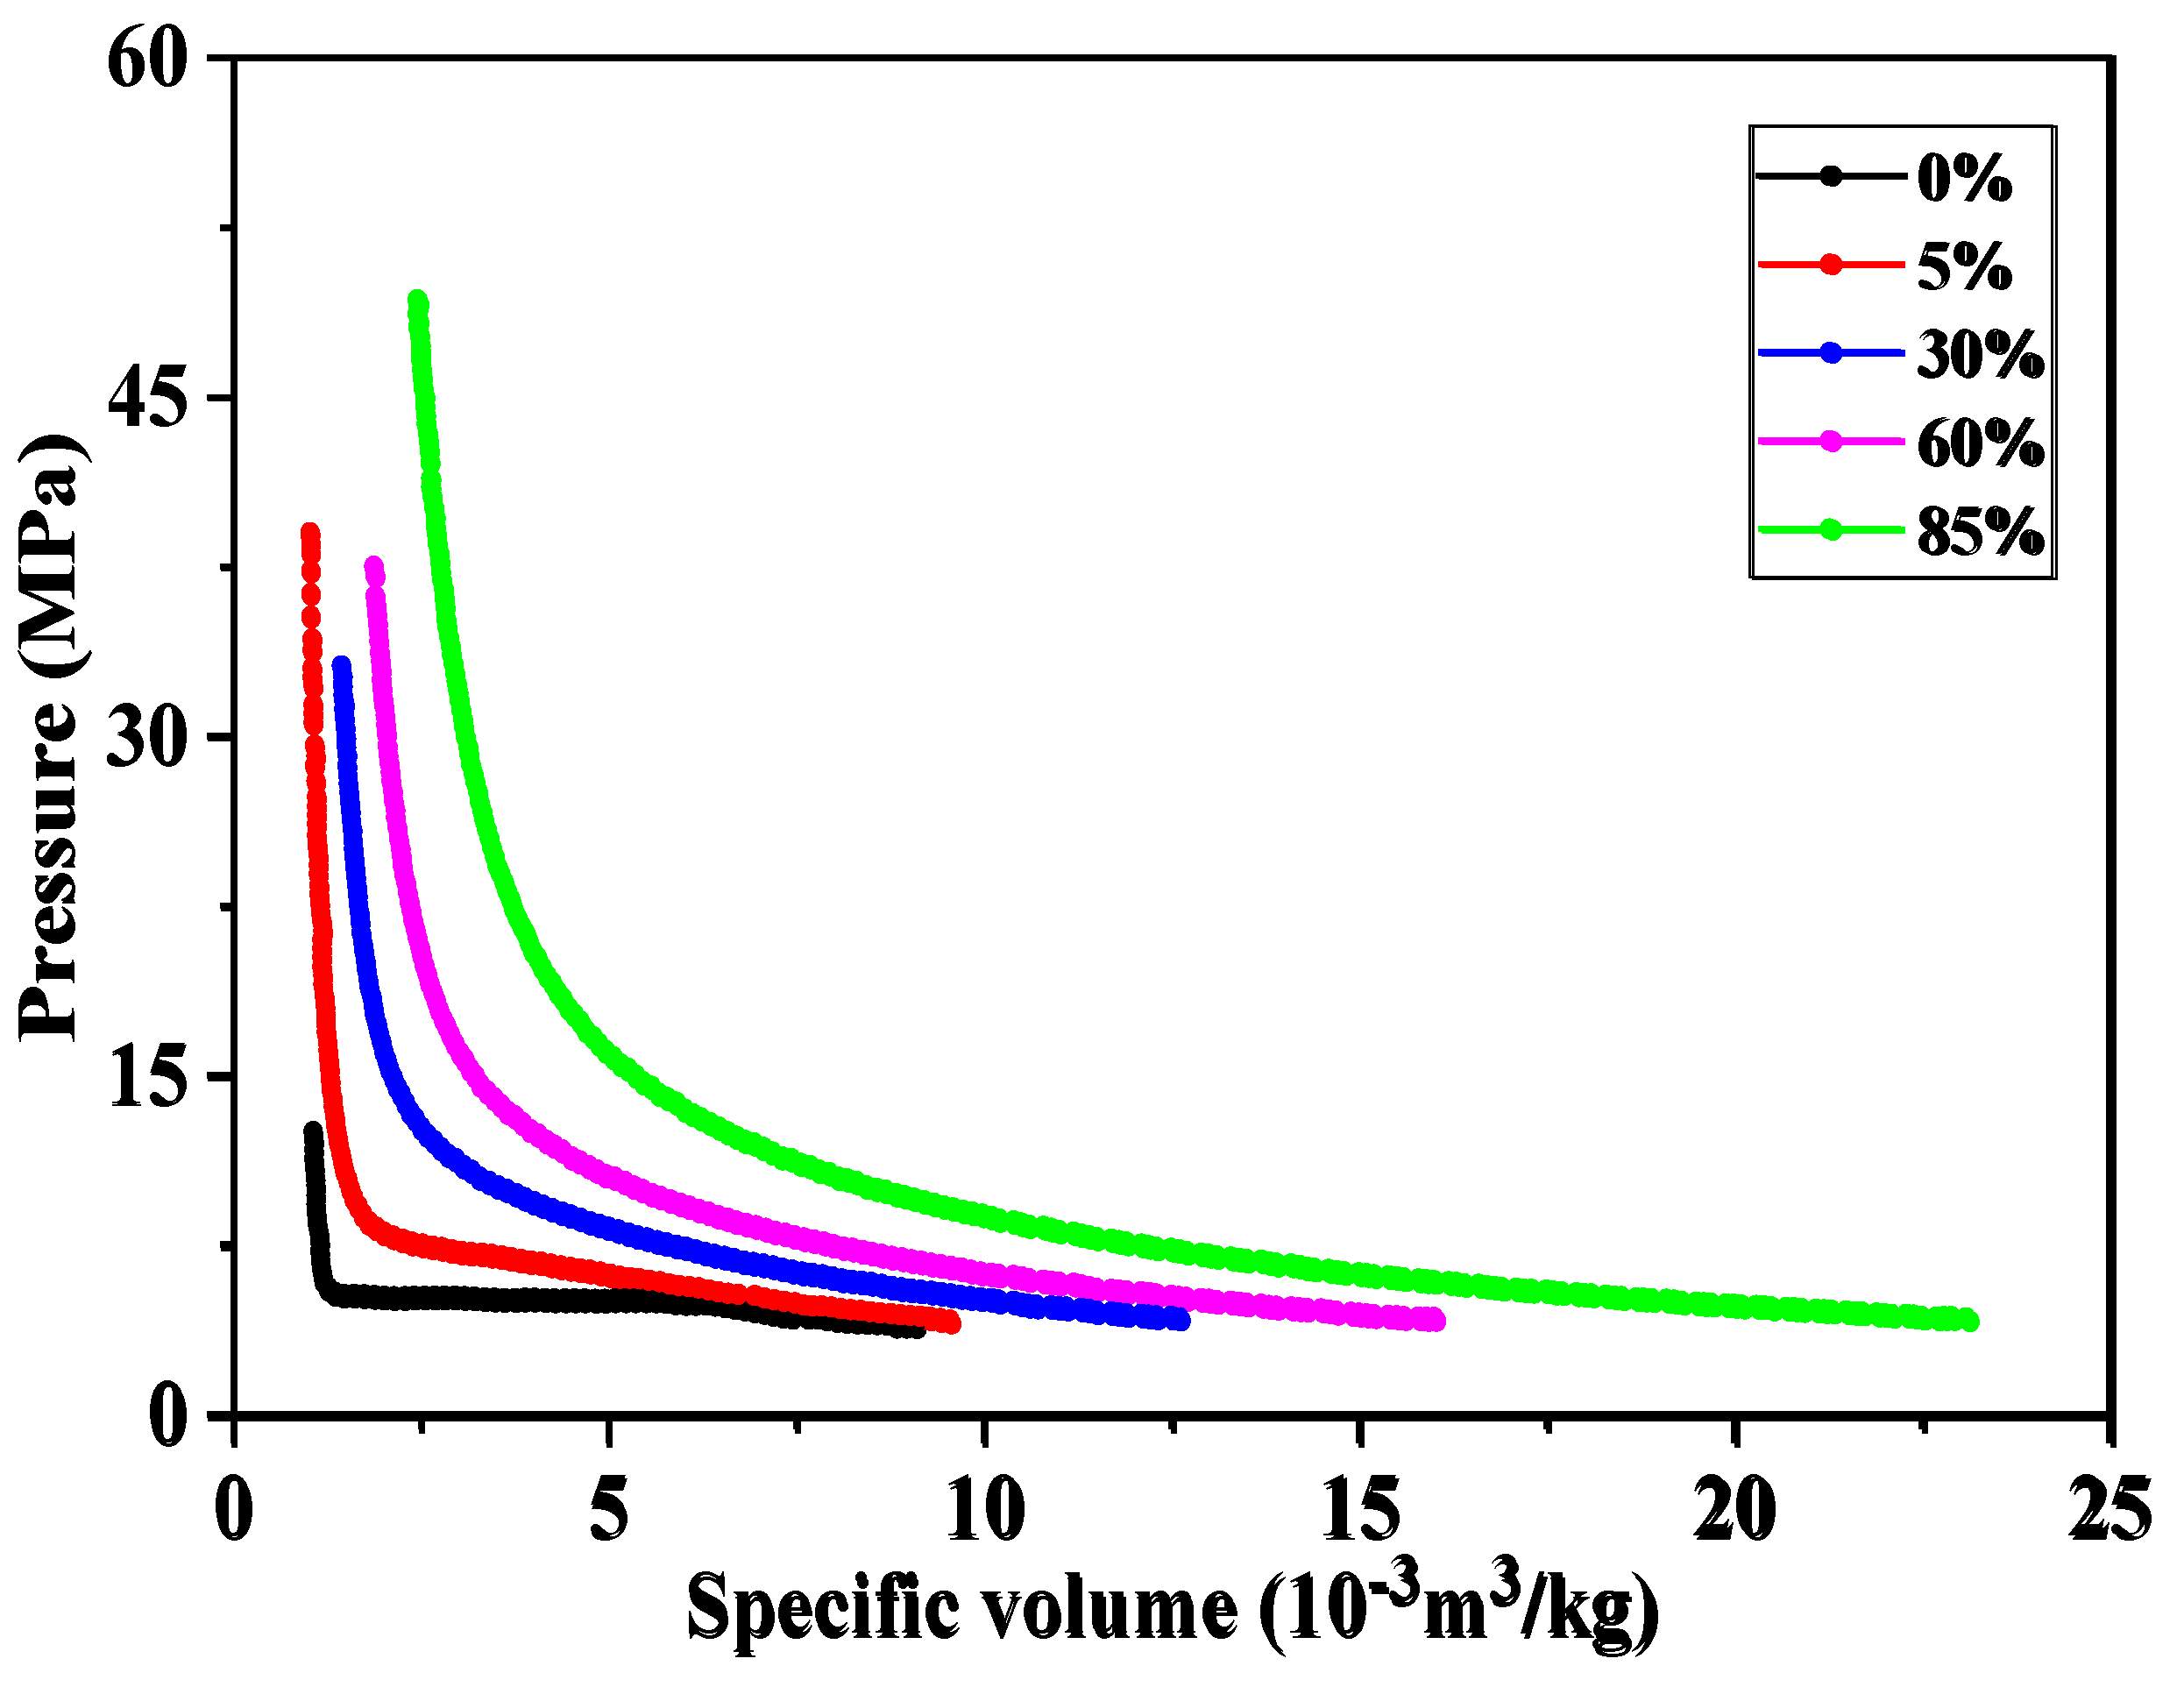
Figure 7.
Pressure-specific volume relationship CO2 and CH4 at different CH4 mole fractions at 80 °C.
Figure 7.
Pressure-specific volume relationship CO2 and CH4 at different CH4 mole fractions at 80 °C.
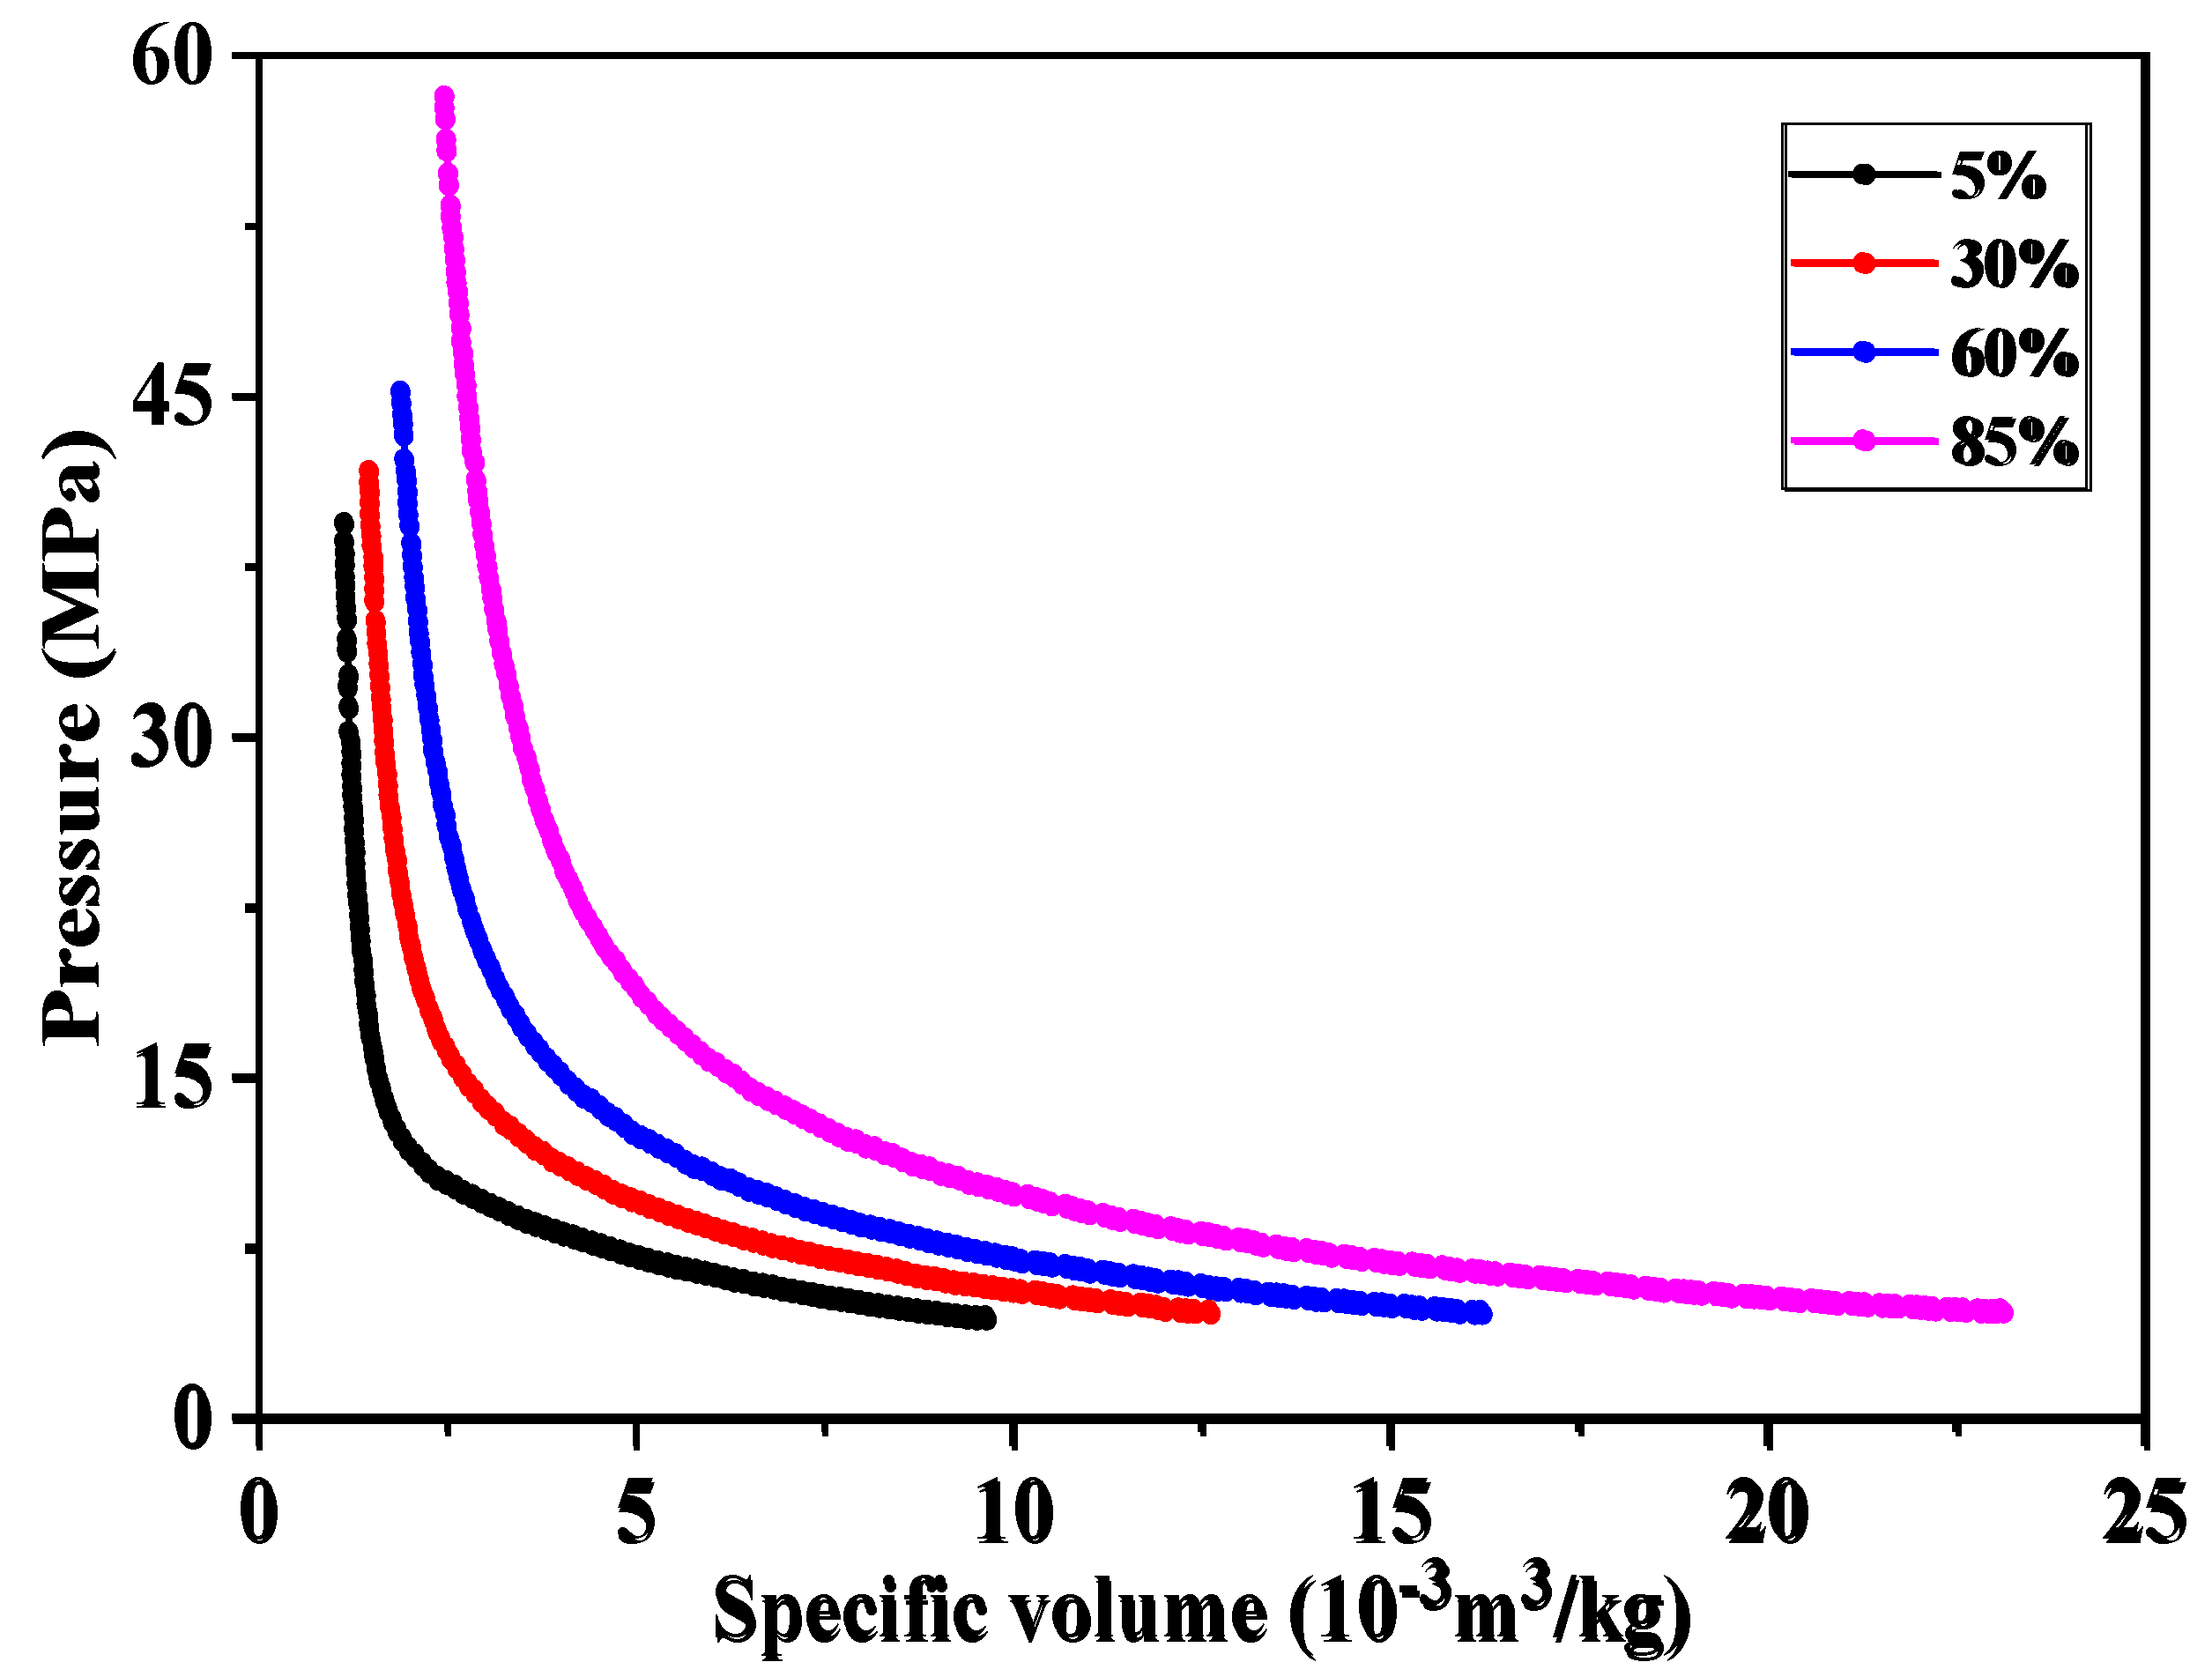
Figure 8.
Pressure-specific volume relationship of CO2 and CH4 at different CH4 mole fractions at 205 °C.
Figure 8.
Pressure-specific volume relationship of CO2 and CH4 at different CH4 mole fractions at 205 °C.
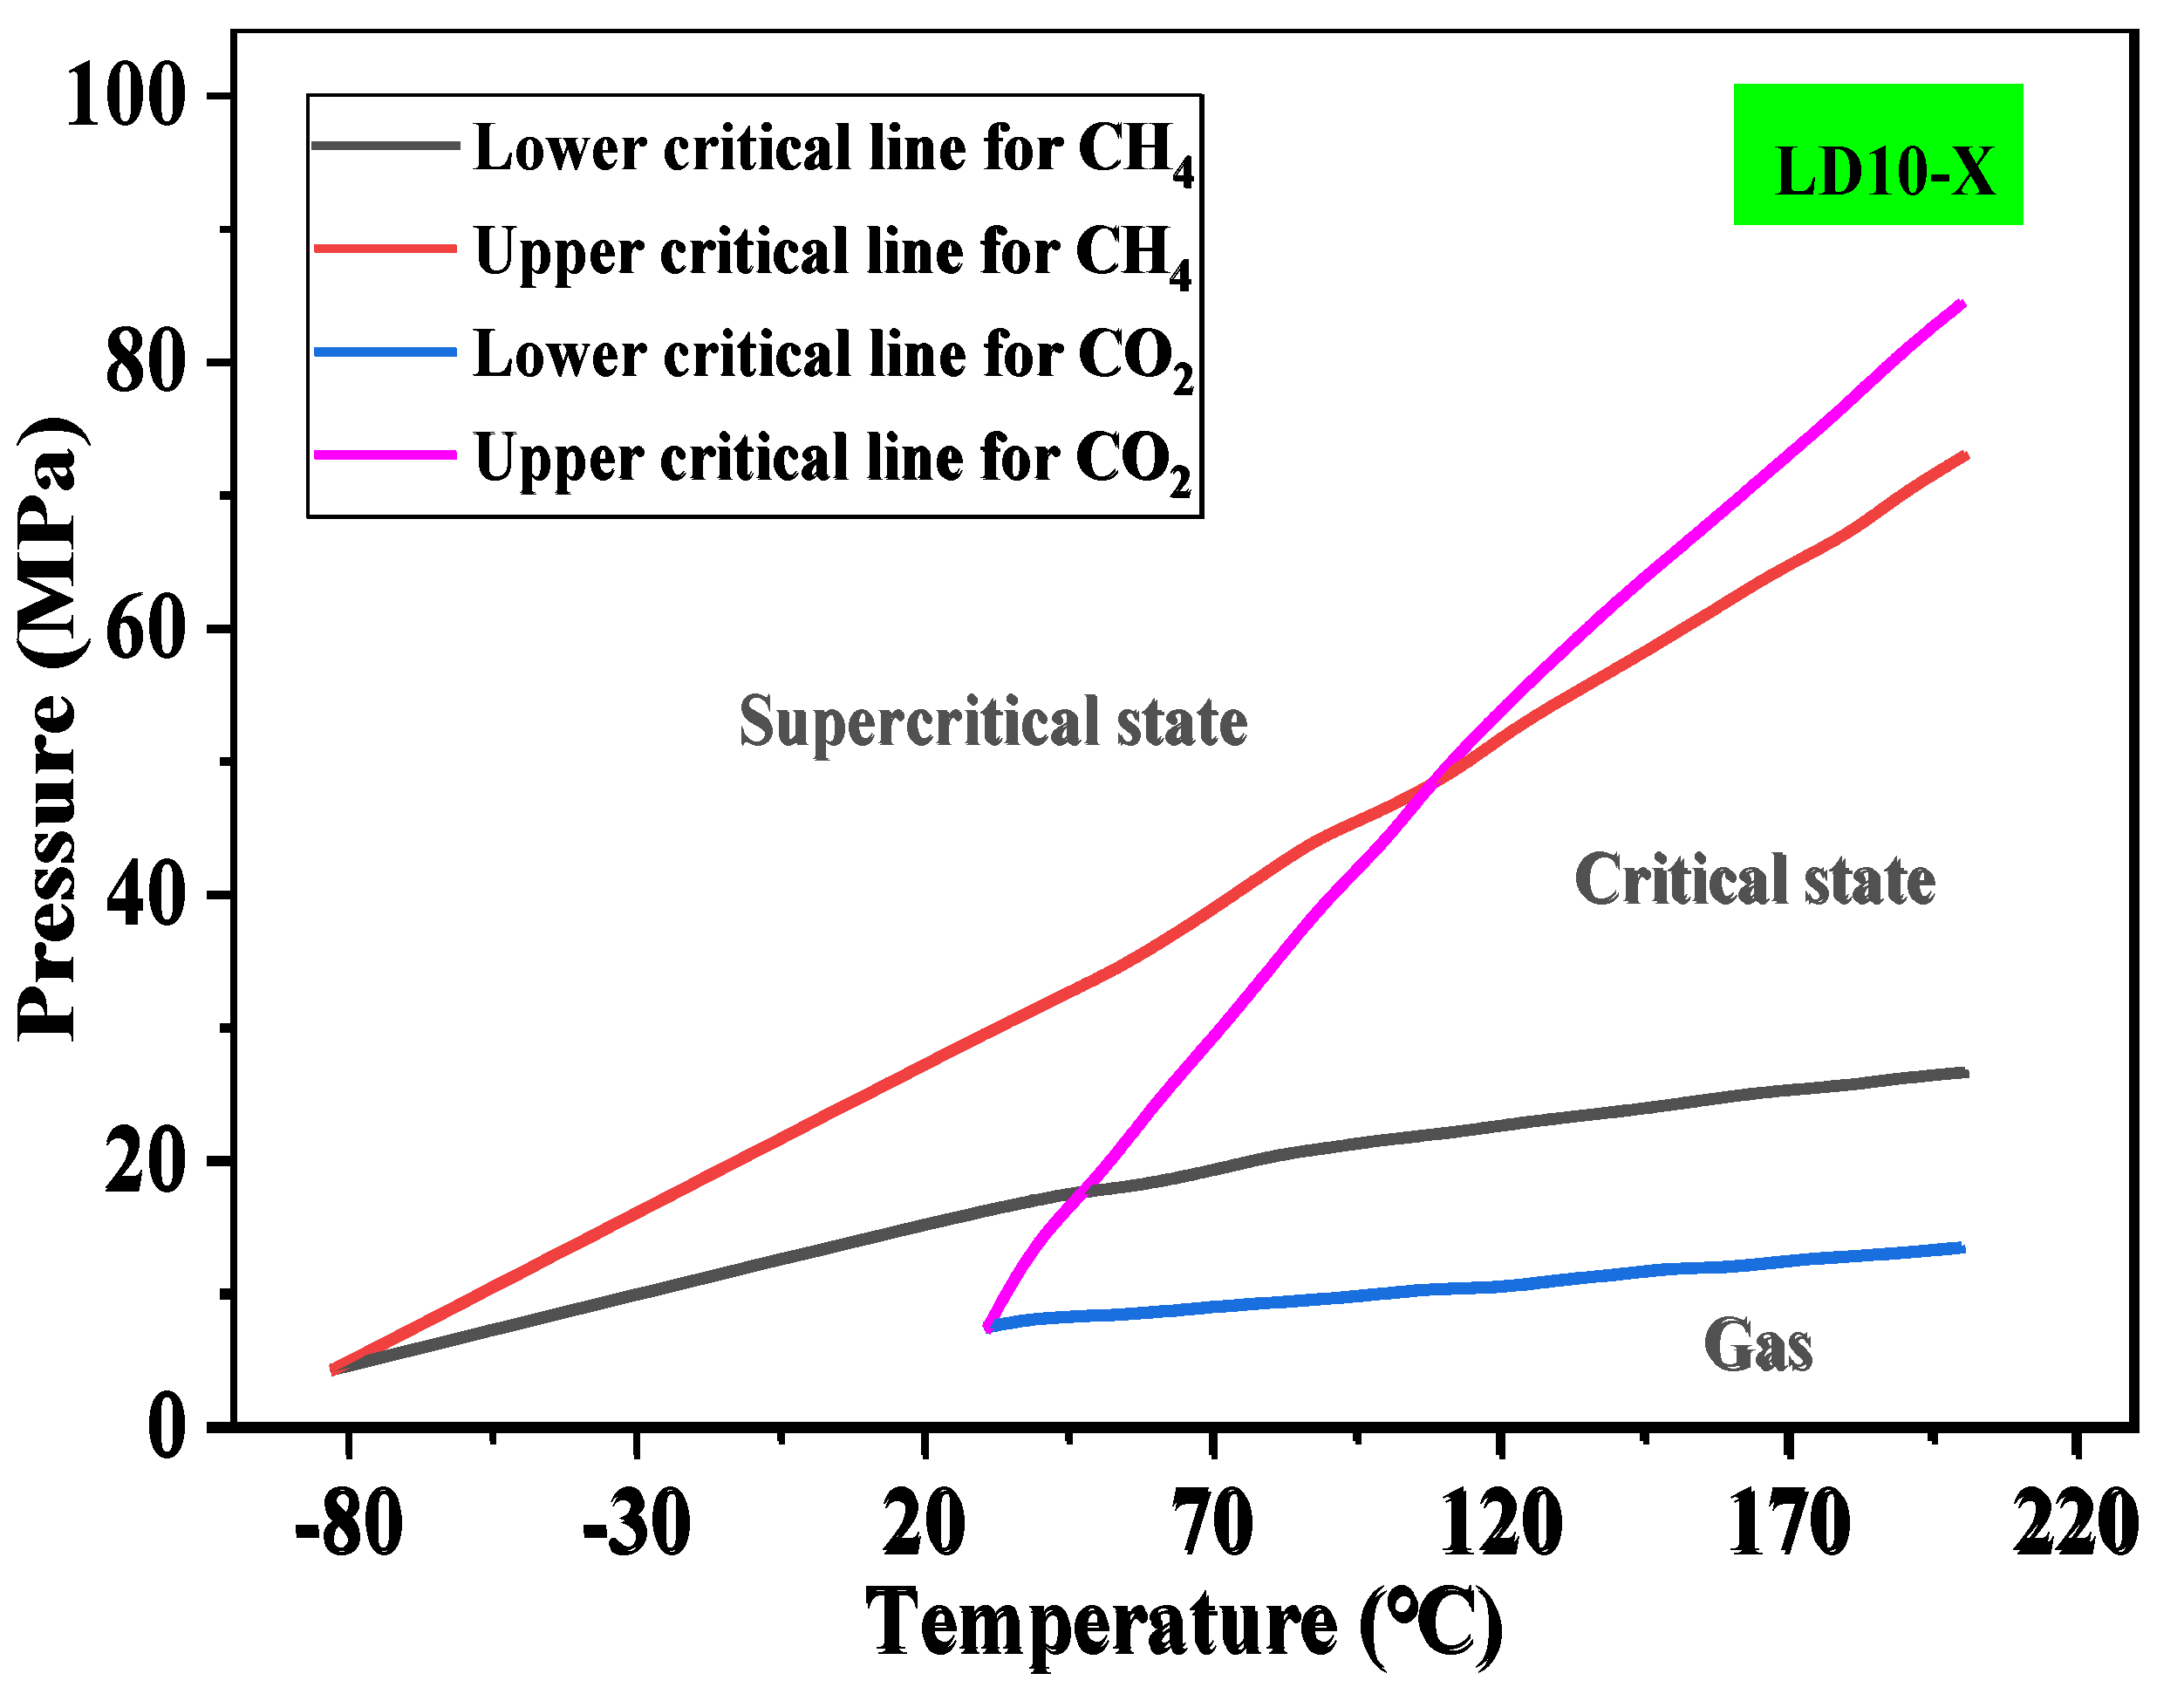
For the gas-supercritical phase transition process (Fig 9), the phase transition conditions of CO2 are lower than those of CH4 at temperatures below 110°C. However, at temperatures above 110 °C, the supercritical phase transition conditions of CO2 exceed those of CH4. Within the gas-critical region, CO2 consistently exhibits lower phase transition conditions compared to CH4 throughout the experimental temperature and pressure range. The results indicate that as the CH4 mole fraction increases, the critical phase transition point in the miscible system shifts toward higher pressures. For the H2IV gas group of LD10-X gas and deeper formations, both CH4 and CO2 enter the supercritical region, which is a supercritical miscible fluid.
Figure 9.
Comparison diagram of CH4 and CO2 gas-supercritical phase transition line.
4.2. Study on the Solubility Law of CH4 and CO2 in Formation Water
The coexistence of CH4 and CO2 in mixed gas reservoirs is commonly encountered under actual geological conditions. It is of great significance to study the solubility law of CH4 and CO2 to avoid the risk of CO2. The solubility of CH4 and CO2 under different mixing ratios and solubility sequences was studied. In addition, the change of the solubility of CH4 and CO2 phase with temperature and pressure was studied.
4.2.1. The Effect of CO2 and CH4 Mixing Ratio on Solubility
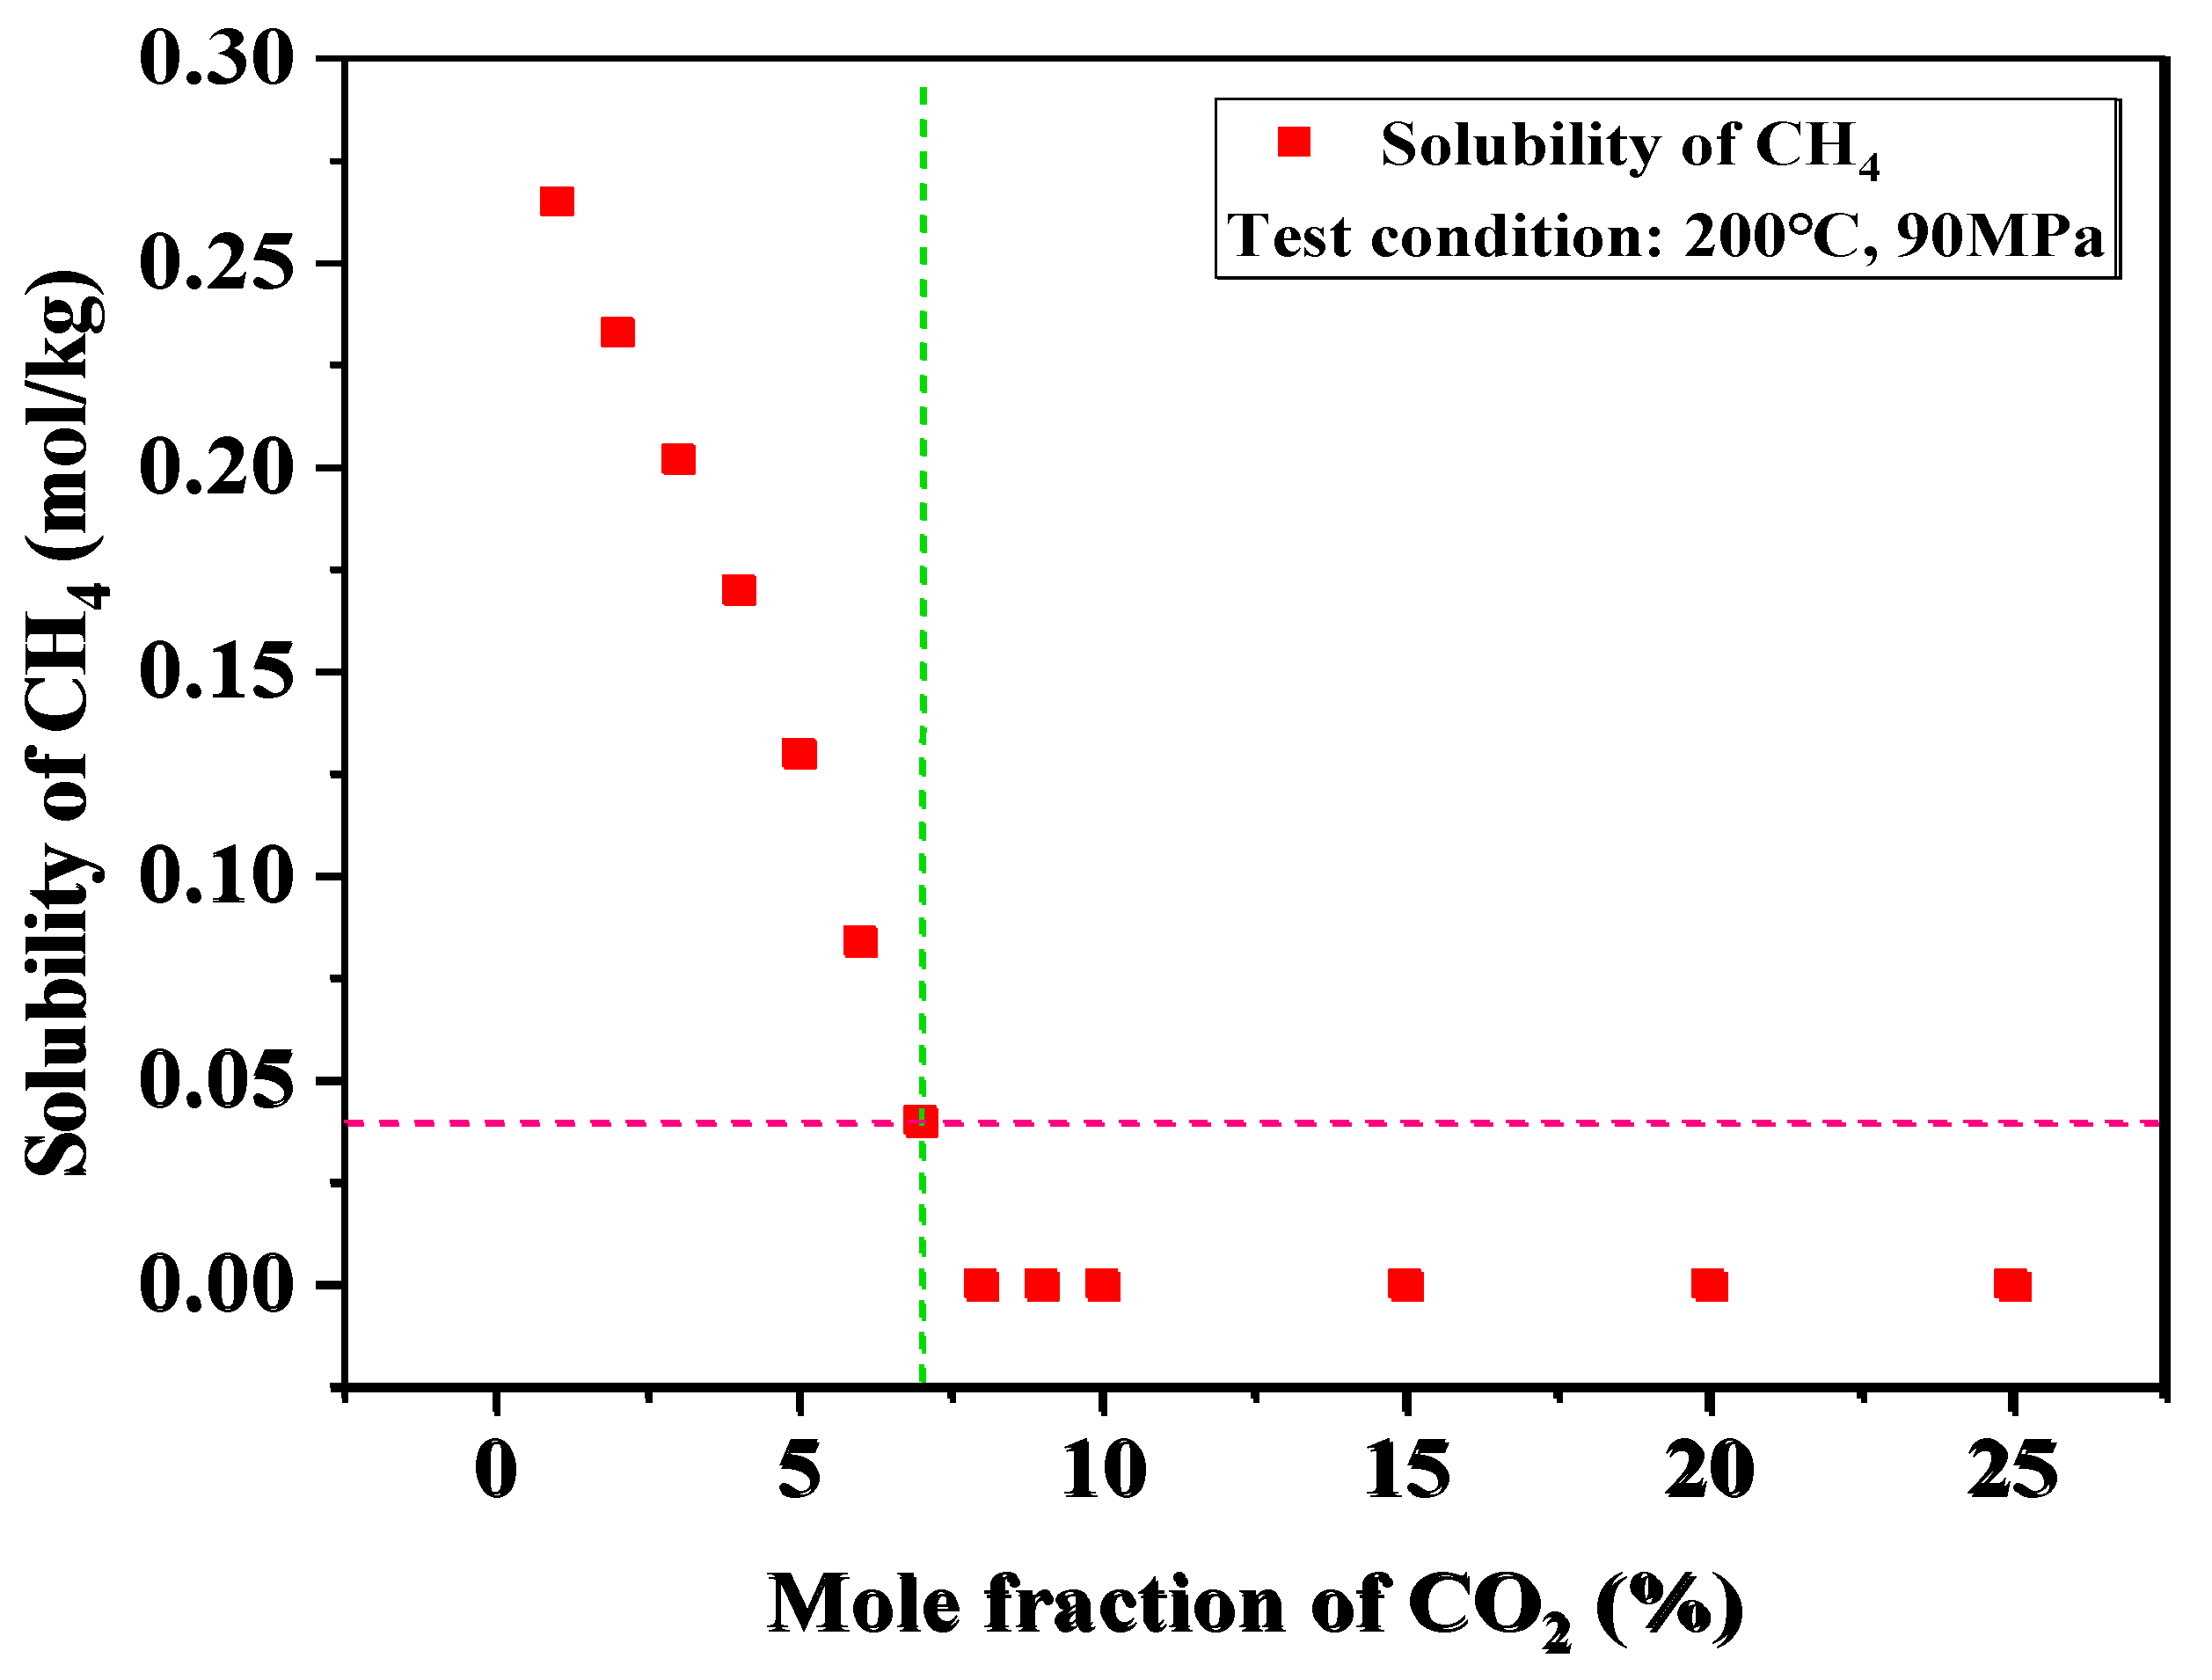
At 200 °C and 90 MPa, the mole fraction of CH4 in the mixed phase of CO2 and CH4 was set to 5 %, 30 %, 60 % and 85 %, respectively. The experimental results revealed that there was only CO2 in the solution and no CH4 was found. When the molar fraction of CO2 in the mixed phase was further reduced to less than 7 %, CH4 was detected in the solution after solubility equilibrium (Fig 10). The main reason is that CO2 is in the supercritical phase and in a multi-molecular aggregation state, which has a strong extraction ability for CH4. When the CO2 in the free phase is sufficient, CH4 is completely bound to supercritical CO2 and will no longer be dissolved in water. Conversely, there are free-moving CH4 molecules in addition to the part of CH4 extracted by CO2 when the CO2 in the free phase is insufficient, which can be dissolved in water. What’s more, some CO2 will be dissolved in pure water due to the chemical equilibrium of CO2 solubility will not constrain by its molecular morphology. The experimental results indicate that the extraction capacity of CO2 to CH4 is about 15 times at 200 °C and 90 MPa. In other words, 1mol CO2 will extract about 15mol CH4.
Figure 10.
Solubility of CH4 under different mixing ratios.
4.2.2. The Effect of CO2 and CH4 Solubility Sequence on Solubility
The effect of different solubility sequence of CO2 and CH4 on the solubility was studied. In formation water, the equilibrium CO2 is dissolved first and then CH4 is dissolved at 200 °C and 90MPa. CO2 was dissolved and balanced for 24 hours to keep the sampler stable. The free gas of CO2 was discharged and injected into CH4 to reach the same experimental conditions. The solubility equilibrium was performed twice for 24 h, and the sample was tested. The experimental results show that CH4 will no longer dissolved when CO2 reaches the solubility equilibrium. At this time, there is no excess space in the CO2 aqueous solution to accommodate CH4. However, when the equilibrium CH4 is dissolved first and then CO2 is dissolved in formation water at 200 °C and 90MPa. CO2 will continue to be dissolved when CH4 reaches the solubility equilibrium. There may be two reasons for this phenomenon. One is that the solubility equilibrium of CH4 is only phase equilibrium, while CO2 has chemical equilibrium in addition to phase equilibrium. Therefore, CO2 will continue to dissolve through chemical equilibrium after CH4 reaches the solubility equilibrium. On the other hand, the CO2 in the free phase is in the supercritical state, which has the ability to extract the dissolved CH4. At this time, the dissolved CH4 through the phase equilibrium part will be returned to the free phase again, but it will be captured by supercritical CO2 and cannot be returned to the liquid phase.
4.2.3. The Solubility of CO2 and CH4 with Temperature and Pressure
The solubility of CO2 and CH4 in LD10-X formation water was investigated under varying temperature and pressure conditions, with a fixed CO2 mole fraction of 5%. The experimental results revealed that the solubility of both CH4 and CO2 in formation water was significantly influenced by pressure and temperature. Specifically, the solubility of both CO2 and CH4 increased with rising pressure. Temperature also played a role in enhancing solubility, though its effect was minimal below 100 °C. Above this threshold, the impact of temperature on solubility became more pronounced. Fig.11 indicates that CH4 dissolves rapidly when the experimental pressure is lower than 40 MPa. When the pressure is higher than 40 MPa, the solubility of CH4 almost no longer increases. The higher the temperature, the earlier the solubility of CH4 reaches the inflection point. This phenomenon is mainly determined by the extraction of supercritical CO2 in the mixed phase. CO2 will dissolve quickly when the pressure is lower than 20 MPa. When the pressure is higher than 20MPa, the solubility of CO2 increases slowly with the increase of pressure. In addition, the solubility of CO2 increases with the increase of temperature (Fig.12).
Figure 11.
P-S-T diagram of CH4 in formation water.
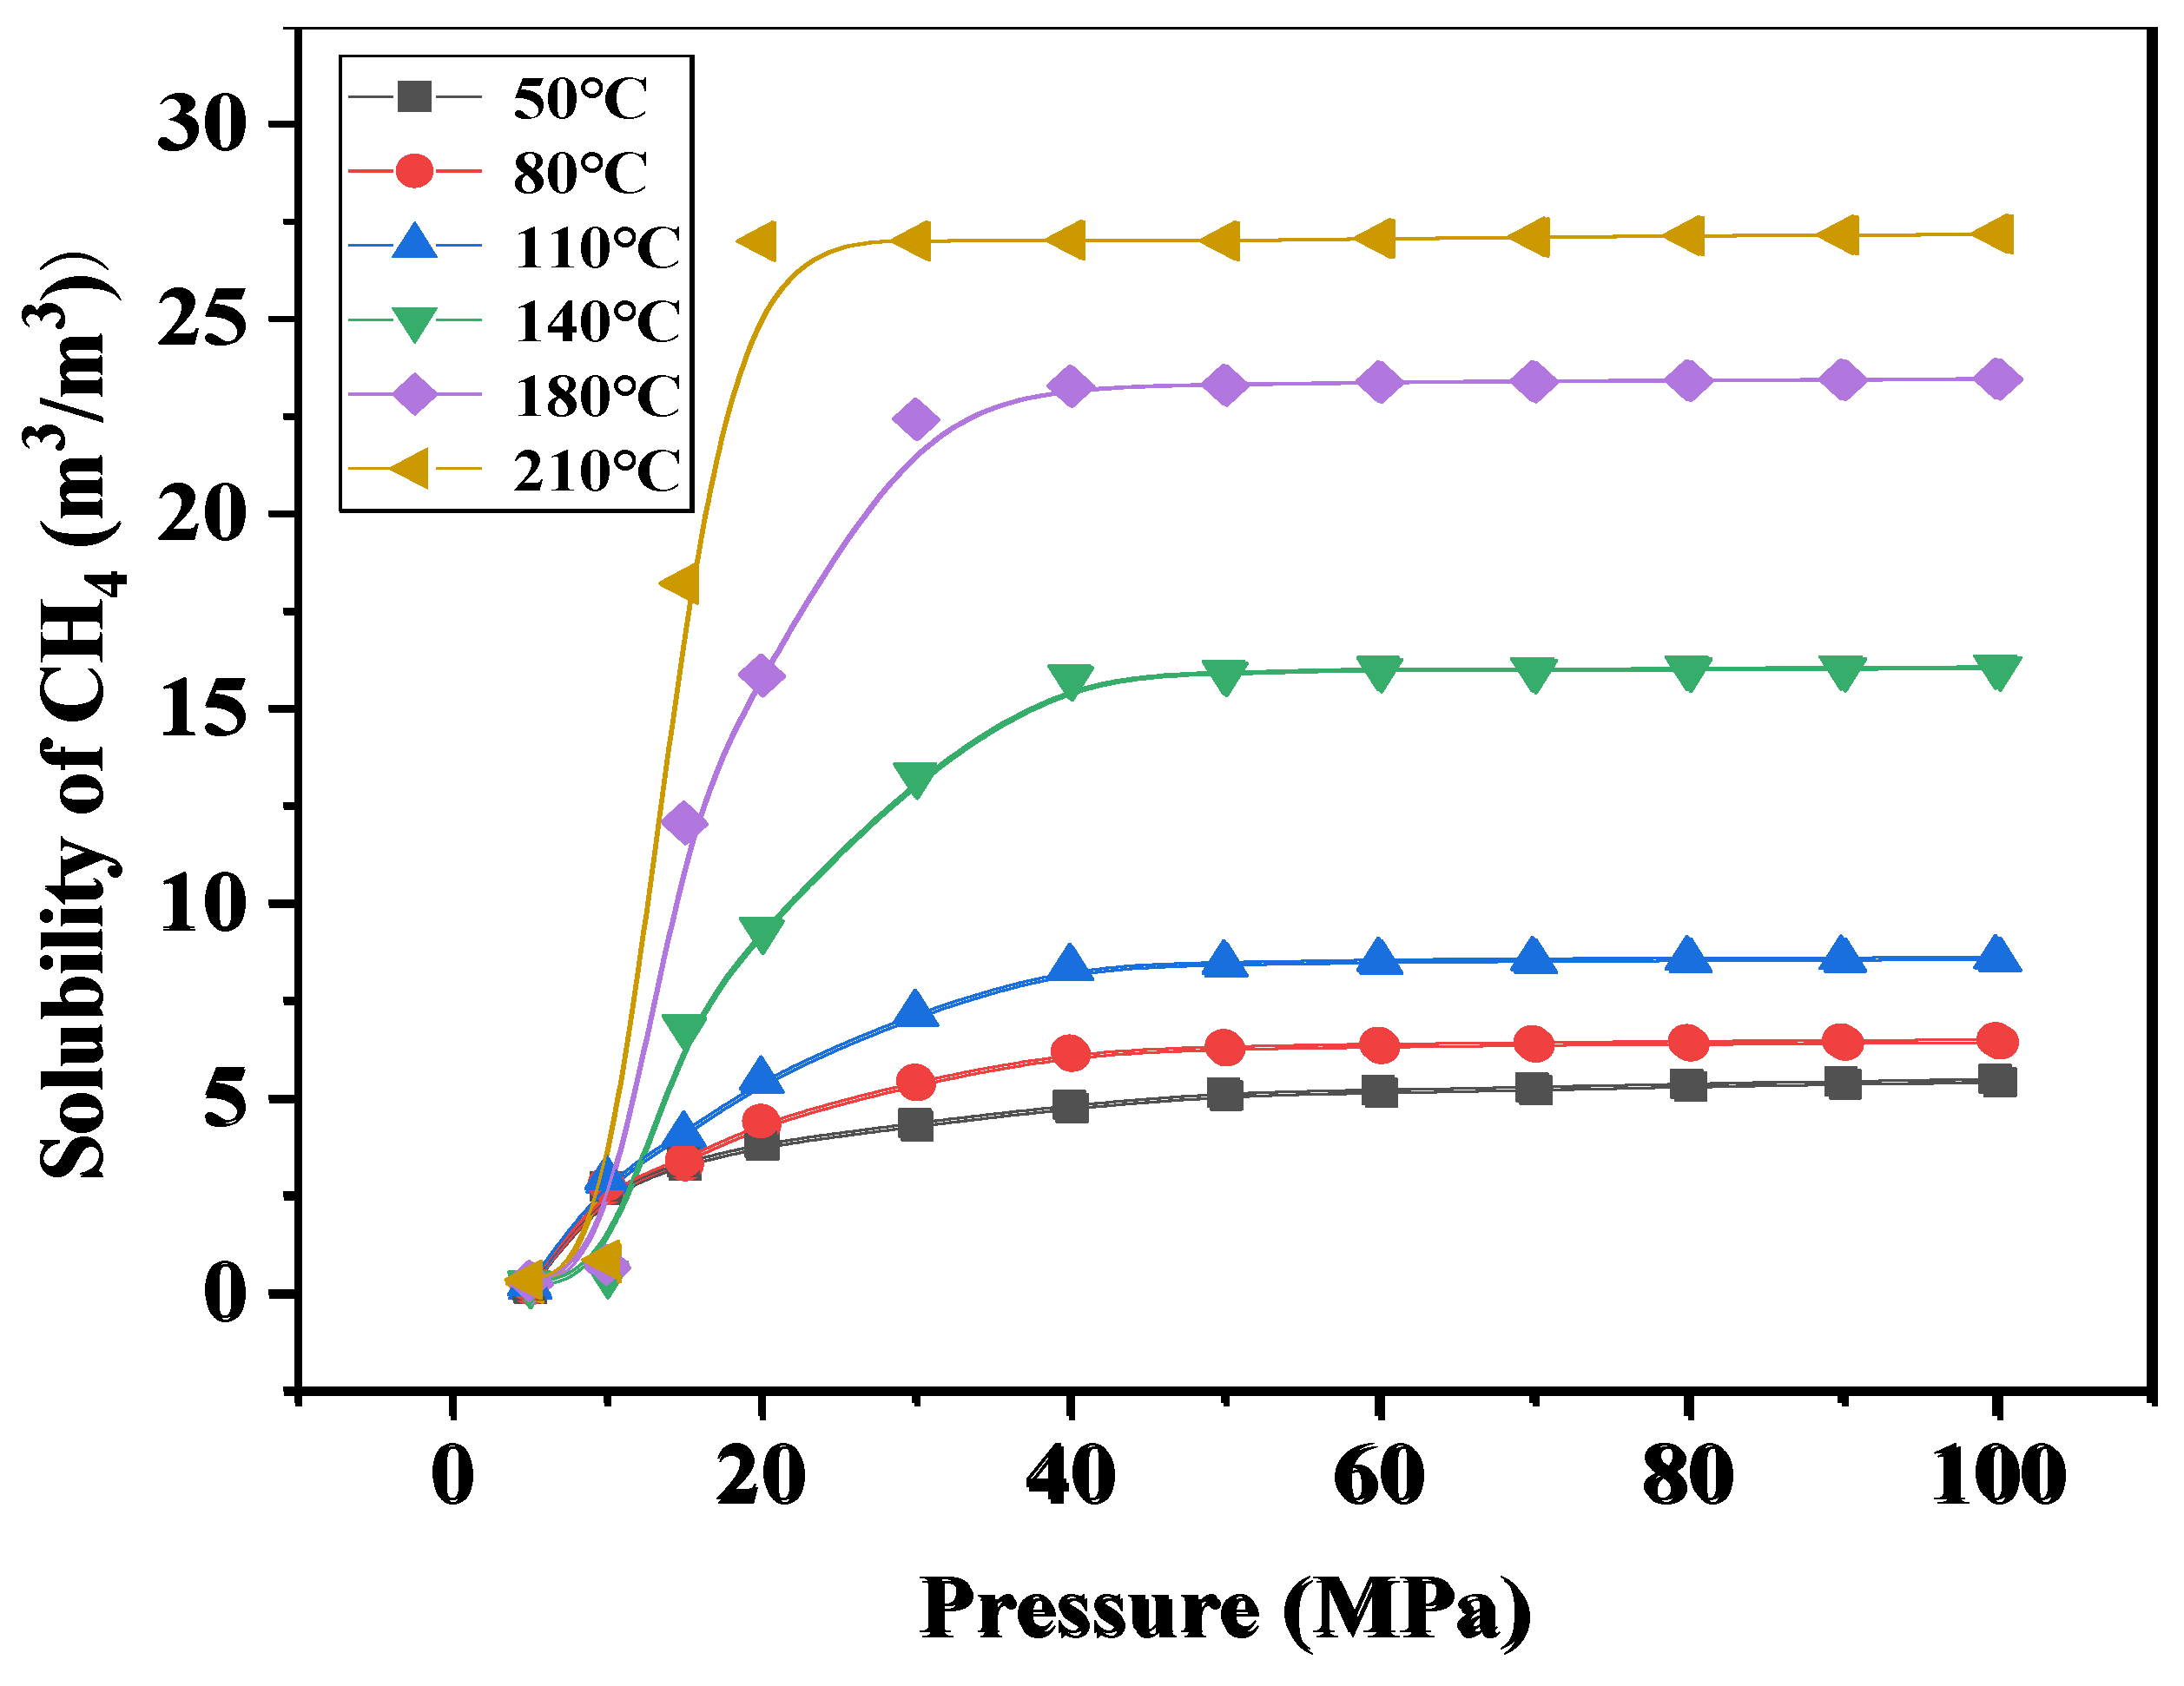
Figure 12.
P-S-T diagram of CO2 in formation water.

4.3. Study on the Exsolution Law of CO2 and CH4
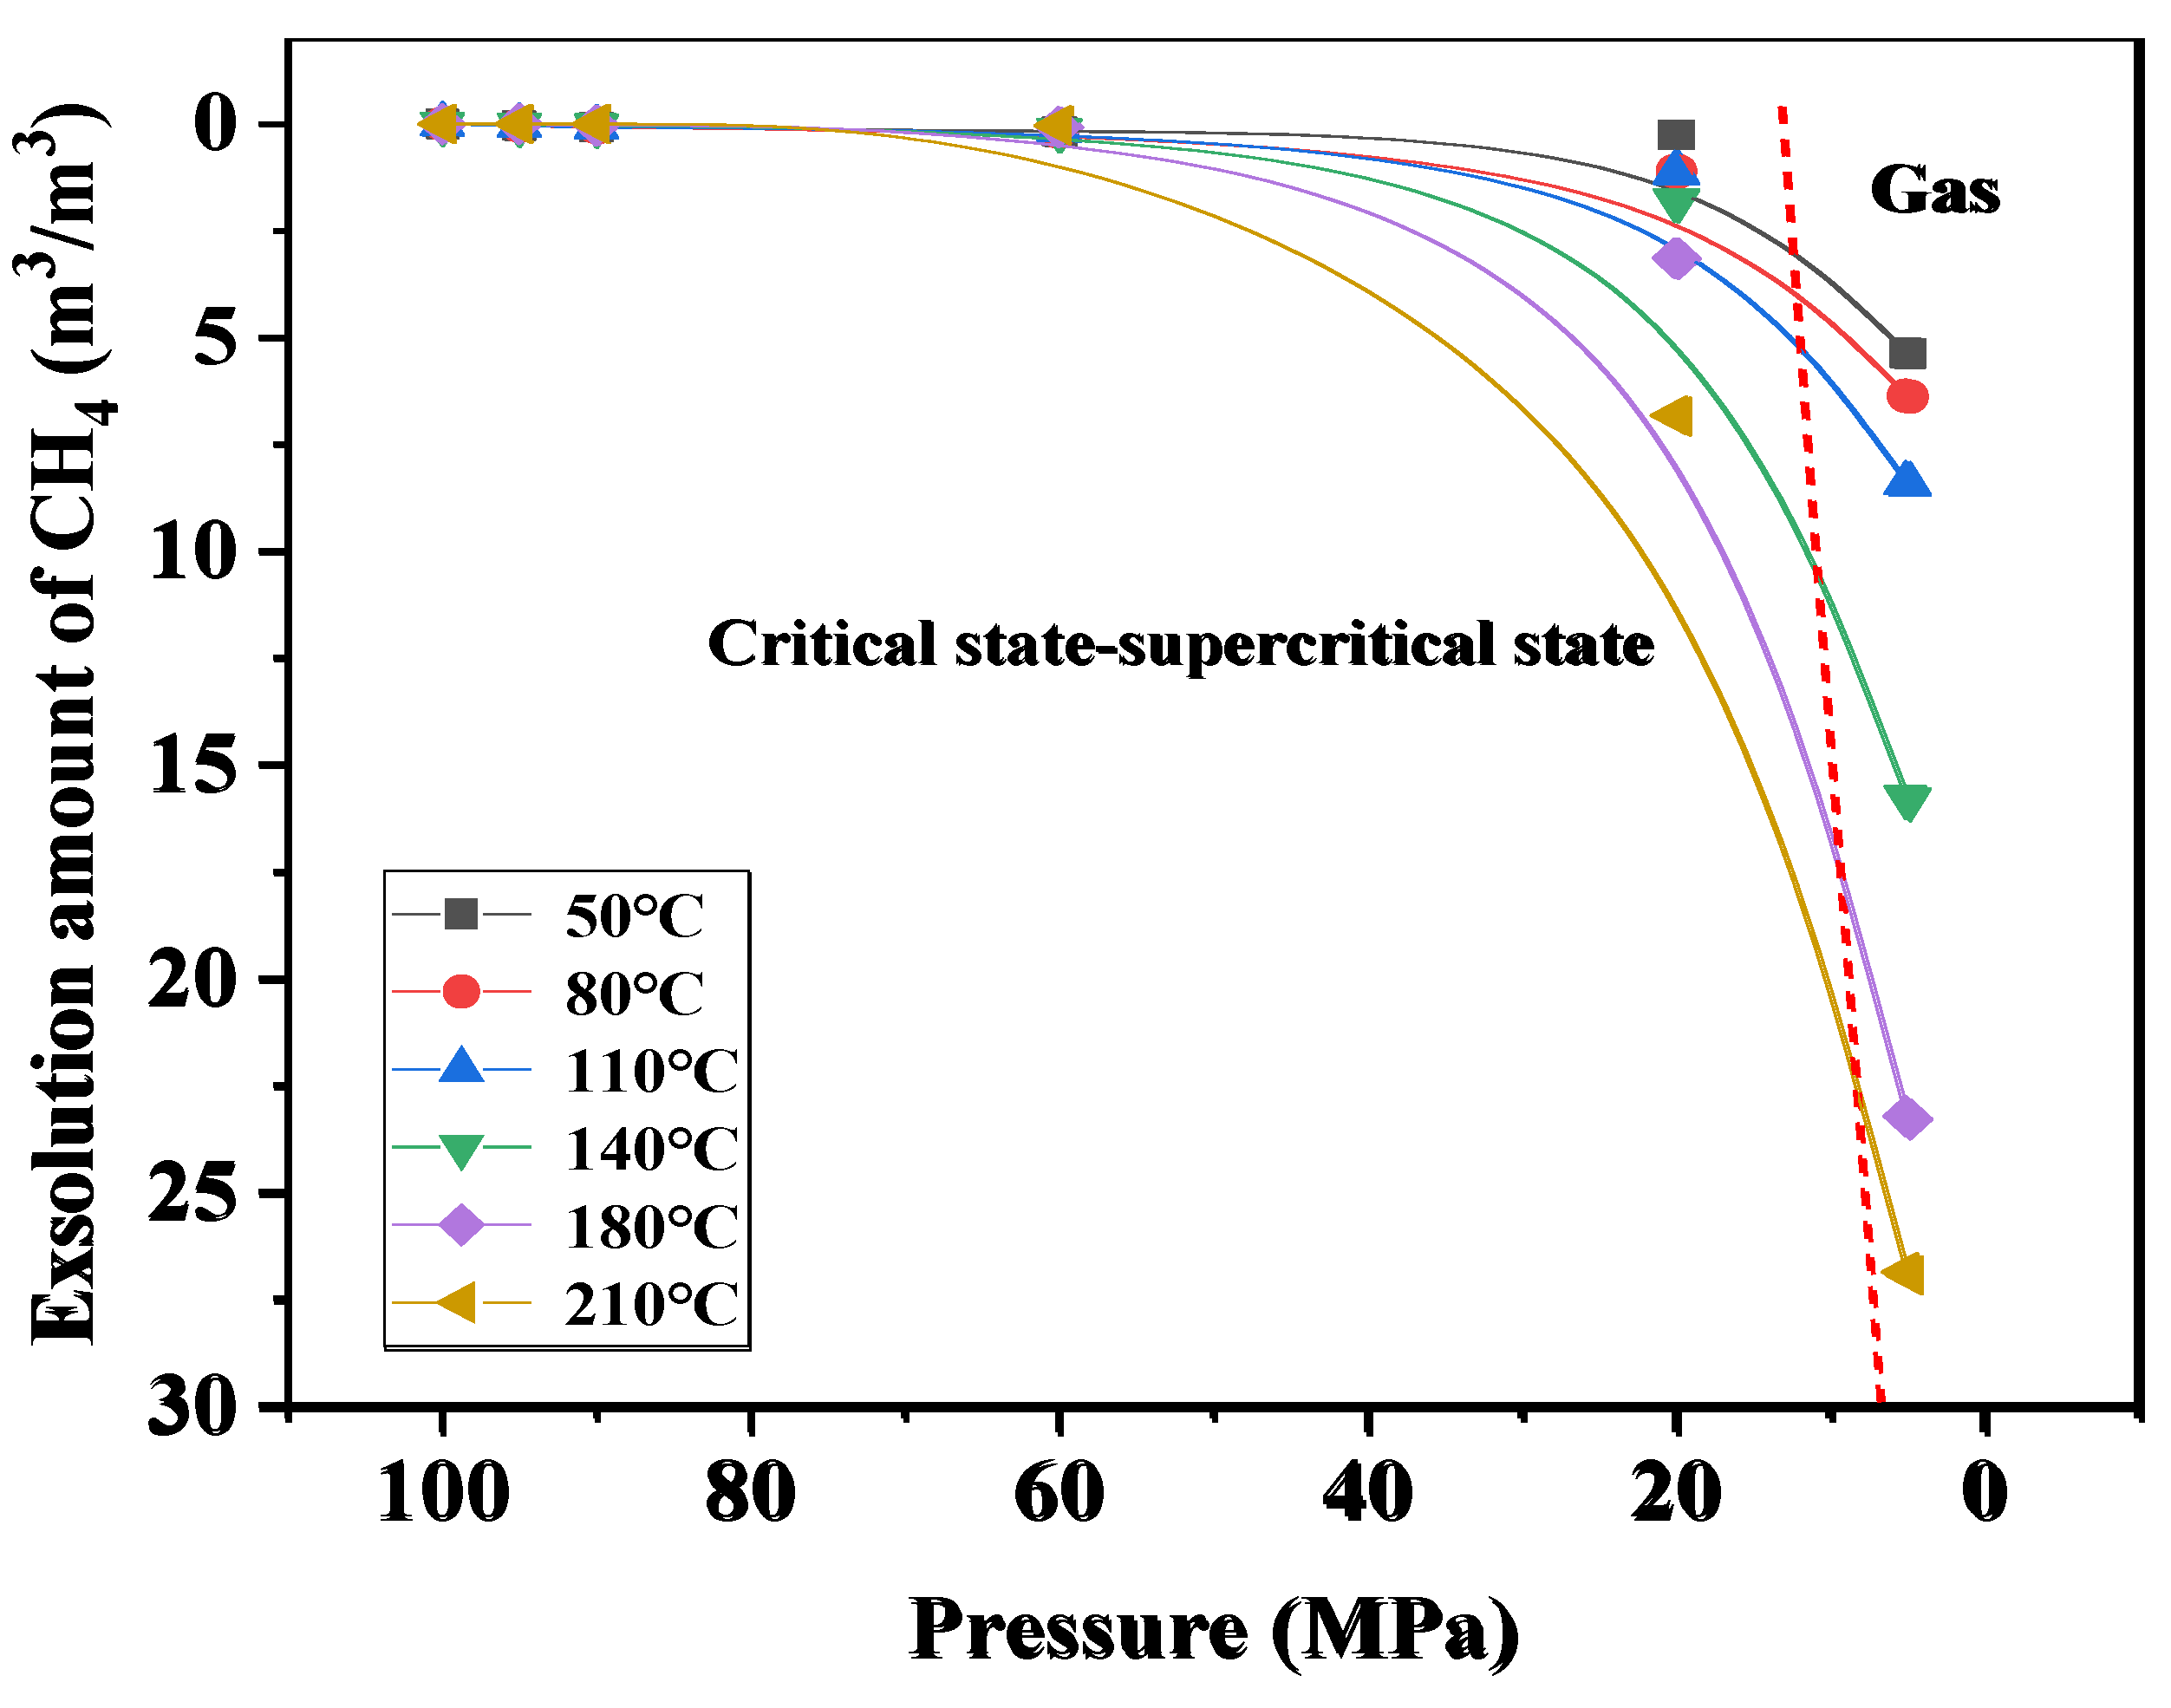
The exsolution law of CO2 and CH4 in formation water was systematically investigated under initial saturation equilibrium temperatures ranging from 50°C to 210°C at 90 MPa. The experimental results demonstrate that, under constant temperature conditions, the exsolution amounts of both CO2 and CH4 increase proportionally with the pressure difference. Furthermore, when the pressure difference remains constant, the exsolution amounts of both components exhibit a positive correlation with temperature. For the CO2 in the CO2 and CH4 phase, the exsolution amount increases slowly and then increases rapidly with the increase of the pressure difference. The inflection point of the exsolution law is near the pressure of 20 MPa (Fig 13). In contrast, the CH4 component in the phase of CO2 and CH4 is almost insoluble when the pressure is higher than 60 MPa. However, when the pressure is lower than 60 MPa, CH4 begins to exsolute rapidly (Fig 14).
Figure 13.
P-S-T diagram of CO2 exsolution in CO2 and CH4 miscible formation water.
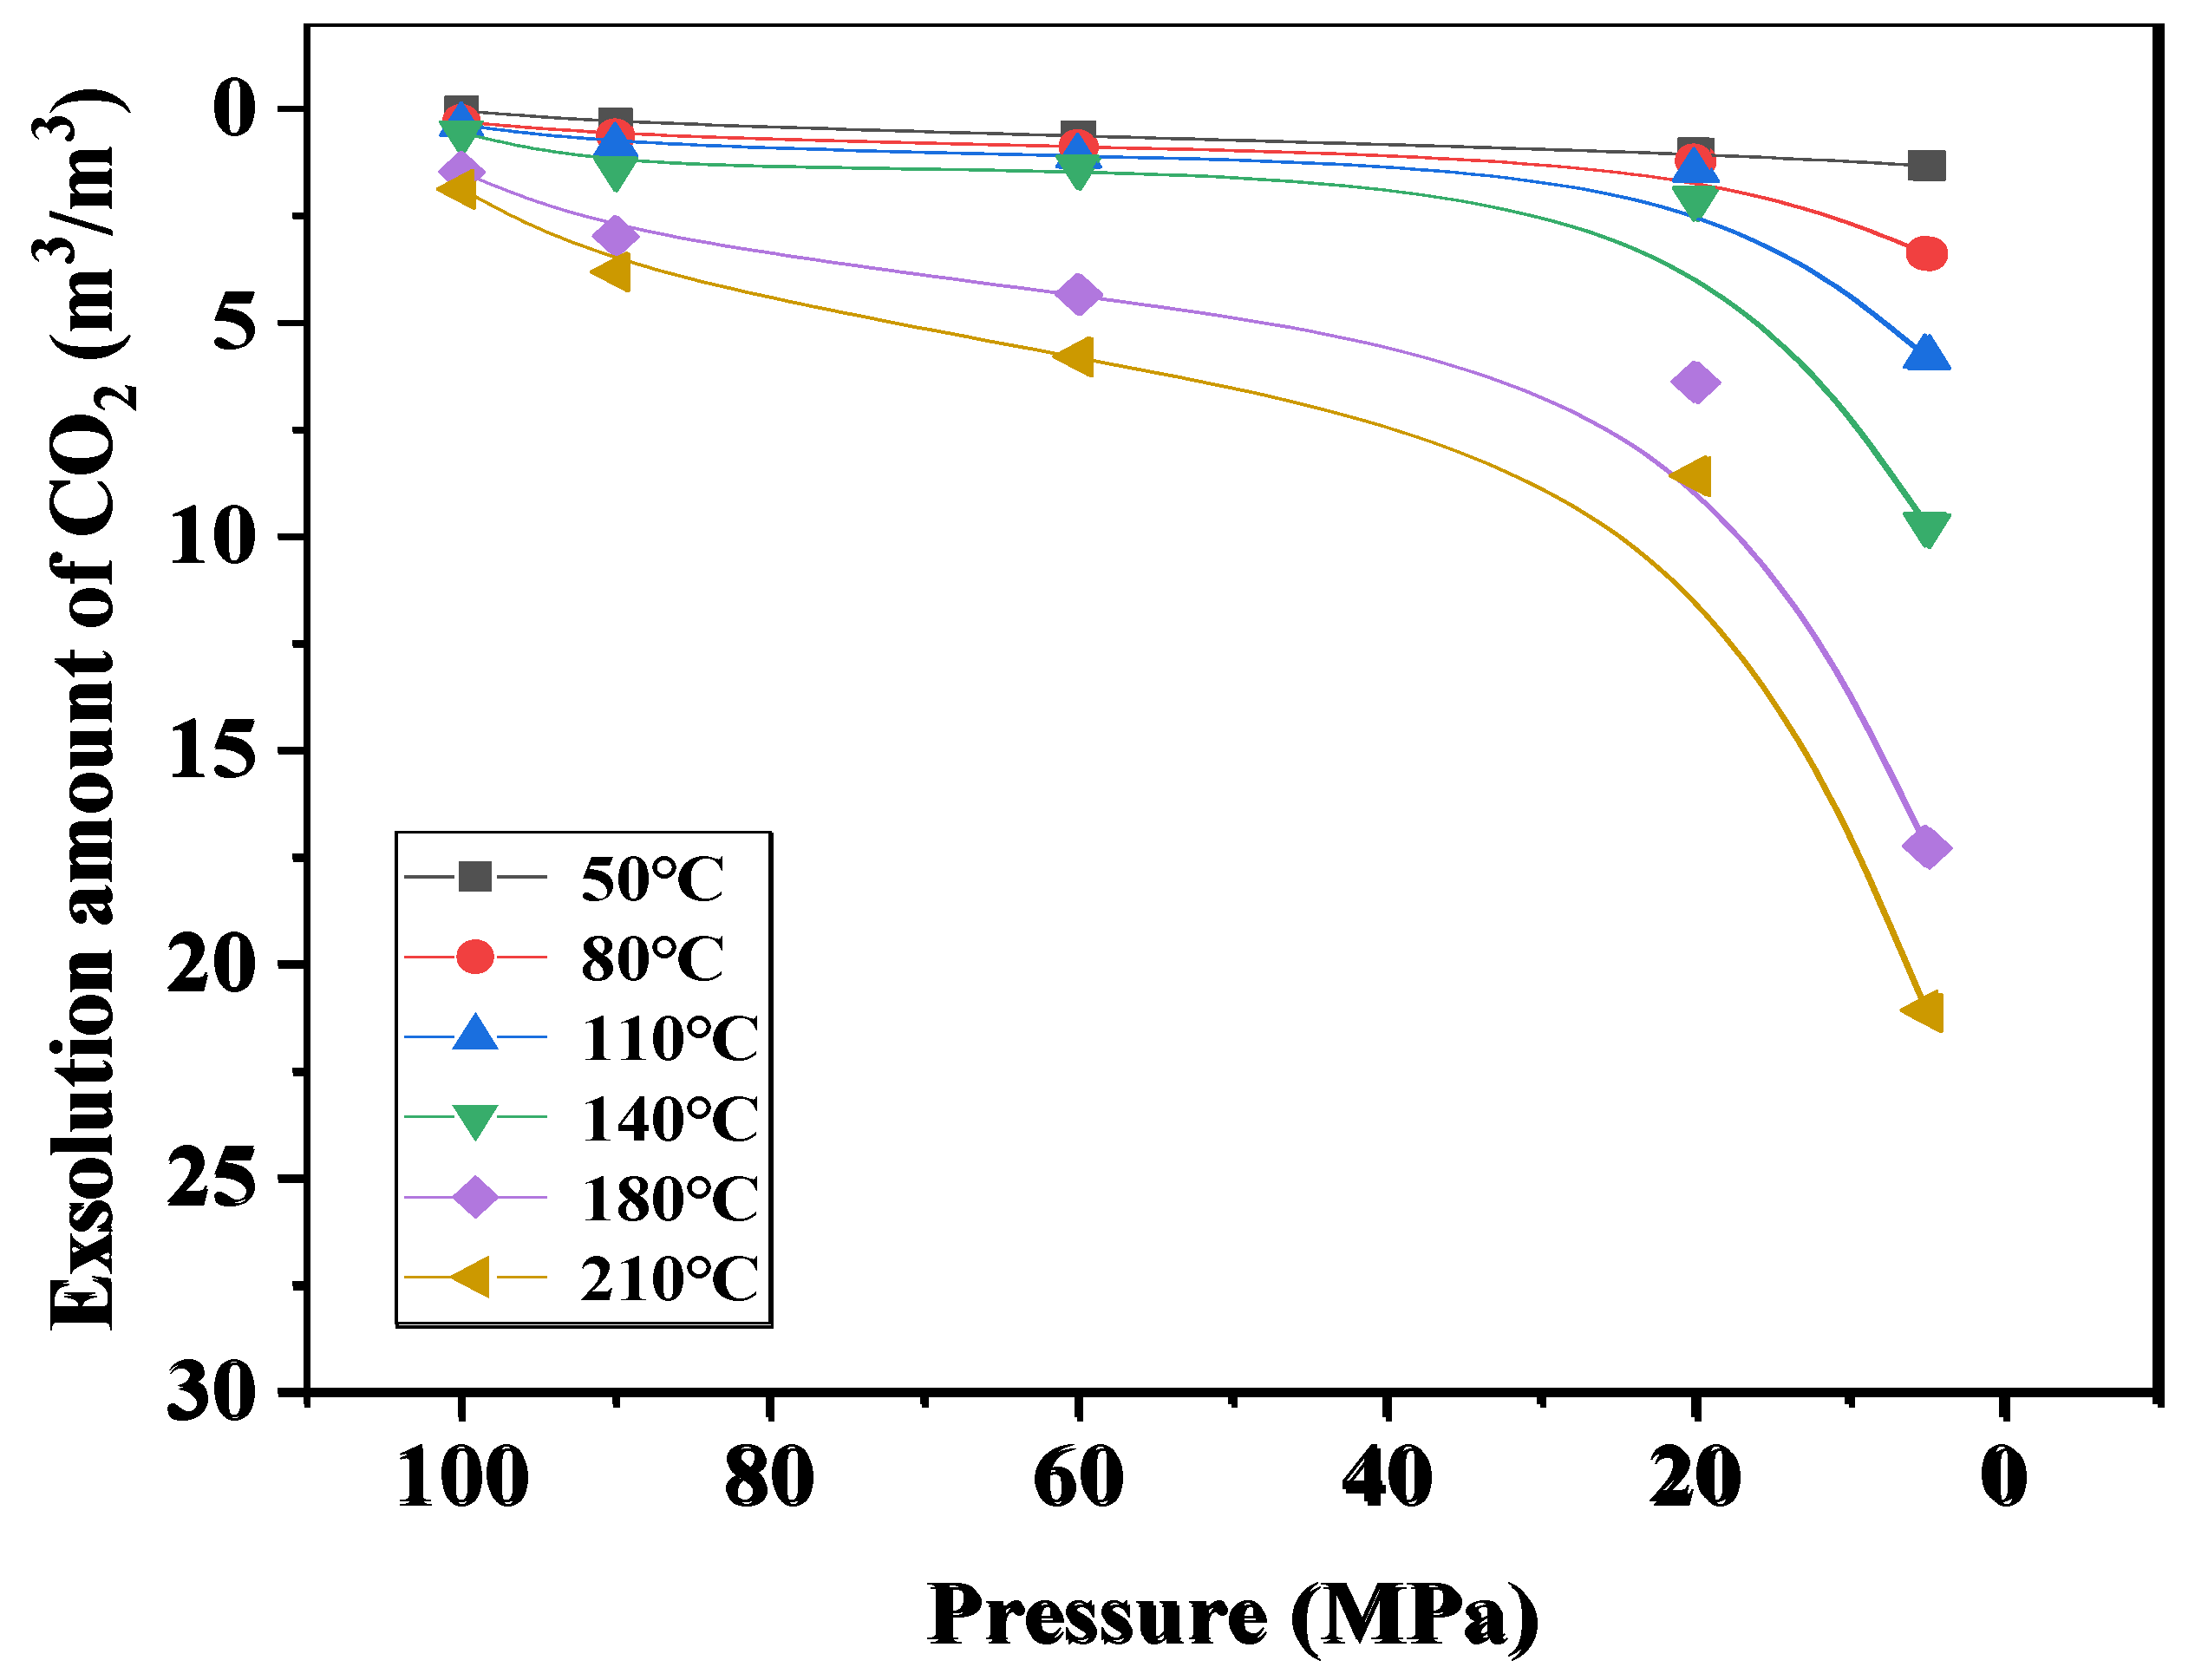
Figure 14.
P-S-T diagram of CH4 exsolution in CO2 and CH4 miscible formation water.
The difference in the exsolution of CO2 and CH4 in the phase of CO2 and CH4 is mainly caused by the extraction of CO2. Initially, under the equilibrium conditions, CO2 exists in a supercritical state while CH4 remains dissolved in the solution. As the pressure decreases, a portion of the dissolved CO2 is released into the free phase, which shifts the chemical equilibrium toward further CO2 generation. This process results in the continuous production of free CO2, which is subsequently removed from the system. Notably, CH4 remains in the dissolved state throughout this stage and does not undergo exsolution. Consequently, during the high-pressure exsolution process, CO2 exsolution dominates while CH4 exsolution is negligible. The extraction capacity of CO2 in the solution began to decrease when the pressure was further reduced, and the CO2 produced by the chemical equilibrium of CO2 and dissolved will extract the excess CH4 again. At this time, the exsolution amount of CH4 began to increase significantly. However, the exsolution law of CO2 has not changed obviously at this stage, mainly because it is from the chemical equilibrium movement. In the process of pressure reduction, the compression coefficients of CH4 and CO2 components become larger, and the free phase CO2 also begins to dissolve. At this time, the exsolution rate is higher than that under high pressure due to the change of CO2 concentration in the liquid phase system. CH4 and CO2 will exsolution simultaneously when the pressure is lower than the critical state phase transition pressure at this temperature. It has little influence on each other and mainly depends on the change law of compression coefficient.
4.4. Application Analysis
Natural gas is distributed in solution gas and free gas under the condition of high temperature and high pressure. As the reservoir pressure decays, the solution gas will gradually precipitate and migrate to higher parts. Table 2 depicts the characteristic parameters of different wells in LD10-X gas field.
Figure 15 illustrates the variations in CH4 and CO2 concentrations during the drill stem testing in the LD10-X-10 well. The results demonstrate that as water output increased, the CO2 concentration exhibited an upward trend, while the CH4 concentration decreased correspondingly. This phenomenon can be attributed to the higher solubility of CO2 in water under supercritical extraction conditions. Conversely, in the LD10-X-12 well, the trend was reversed (Figure 16). During the testing period, CO2 concentration decreased and CH4 concentration increased. The reason can be attributed to that the mixed gas exsolution from water, and the extraction capacity of CO2 in the solution decreases after the pressure is reduced. In addition, the CO2 produced by the chemical equilibrium movement of CO2 and exsolution will extract the excess CH4 again. CH4 exsolution leads to the increase of CH4 concentration.
5. Conclusions
A series of experimental investigations have been conducted to study solubility and exsolution law of CO2 and CH4 and its influence on the fluid composition in the ultra-high temperature and pressure gas field of LD10-X. The results are followed: Fluid phase characteristics experiments showed that the critical phase transition point in the miscible system shifts toward higher pressures with the increase of the CH4 mole fraction. For the H2IV gas group of LD10-X gas and deeper formations, both CH4 and CO2 enter the supercritical region, which is a supercritical miscible fluid. Mixing ratio experiments depicted that when the CO2 mole fraction exceed 7%, CH4 will not appear in the mixed solution due to the high extraction ability of supercritical CO2 for CH4, which was about 15 times greater. The solubility sequence demonstrated that CO2 continued to dissolve even after CH4 reached solubility equilibrium, while CH4 became insoluble when CO2 reached its solubility equilibrium. Both CO2 and CH4 solubility increased with rising temperature and pressure. The exsolution amount of CO2 in the CO2 and CH4 phase was increased slowly at first and then rapidly near the pressure of 20 MPa, whereas CH4 remained almost insoluble above 60 MPa.Drill stem testing of LD10-X-10 well showed an upward trend in CO2 concentration, while CH4 concentration decreased due to higher solubility of CO2 in water under supercritical conditions. In contrast, CO2 concentration decreased and CH4 concentration increased in LD10-X-12 well.
Author Contributions
Jin Liao: Conceptualization, Data curation, Formal Analysis, Investigation, Writing—original draft, Writing—review and editing. Hao Liang: Data curation, Investigation, Methodology, Writing—review and editing. Gang Li: Investigation, Methodology, Project administration, Supervision, Visualization, Writing—original. All authors have read and agreed to the published version of the manuscript.
Funding
This research was funded by the Chinese Academy of Engineering Technology Strategy Consultancy Project (2025-XZ-47).
Data Availability Statement
The original contributions presented in the study are included in the article. Further inquiries can be directed to the corresponding author.
Conflicts of Interest
The authors declare no conflicts of interest.
References
- Kurnia K A, How C J, Matheswaran P ,et al. Insight into the molecular mechanism that controls the solubility of CH4 in ionic liquids. The Royal Society of Chemistry, 44(2020) 354-360. [CrossRef]
- Li R, Jiang P X, He D ,et al. Experimental investigation on the behavior of supercritical CO2 during reservoir depressurization. Environmental Science & Technology, 15(2017) 8869-8876. [CrossRef]
- Oldenburg, C. M, C. Doughty, and N. Spycher. The role of CO2 in CH4 exsolution from deep brine: implications for geologic carbon sequestration. Greenhouse Gases Science & Technology, 3(2013) 359-377. [CrossRef]
- Xu R, Li R, Ma J ,et al. Effect of mineral dissolution/precipitation and CO2 exsolution on CO2 transport in geological carbon storage. Accounts of Chemical Research, 50(2017) 2056-2066. [CrossRef]
- Gao G, Huang Z L, Huang B J,et al. The solution and exsolution characteristics of natural gas components in water at high temperature and pressure and their geological meaning. Petroleum Science, 9(2012) 25-30. [CrossRef]
- Huang X, Guo X, Zhou X ,et al. Effects of water invasion law on gas wells in high temperature and high pressure gas reservoir with a large accumulation of water-soluble gas. Journal of Natural Gas Science and Engineering, 62(2019) 68-78. [CrossRef]
- Xie, Weidong, M. Wang, and H. Wang. Adsorption characteristics of CH4 and CO2 in shale at high pressure and temperature. ACS omega, 6(2021) 18527-18536. [CrossRef]
- Zhou G Z, Duan X G, Chang J ,et al. Investigation of CH4/CO2 competitive adsorption-desorption mechanisms for enhanced shale gas production and carbon sequestration using nuclear magnetic resonance. Energy, 278(2023) 127964. [CrossRef]
- Gao T, Shen T T, Lin W S, et al. Experimental determination of CO2 solubility in liquid CH4/N2 mixtures at cryogenic temperatures. Industrial & Engineering Chemistry Research, 51(2012) 9403-9408. [CrossRef]
- Bruusgaard H, Juan G. Beltran, Servio P. Solubility measurements for the CH4+CO2+H2O system under hydrate–liquid–vapor equilibrium. Fluid Phase Equilibria, 296(2010) 106-109. [CrossRef]
- Liu G F, He L Y, Fan Z Q ,et al. Investigation of gas solubility and its effects on natural gas reserve and production in tight formations. Fuel, 295(2021) 120507. [CrossRef]
- Kapoor U, and Shah J K.. Monte carlo simulations of pure and mixed gas solubilities of CO2 and CH4 in nonideal ionic liquid-ionic liquid mixtures. Industrial & Engineering Chemistry Research, 58(2020) 22569-22578. [CrossRef]
- Zhao Y, Yu J, Shi H ,et al. Study of methane solubility calculation based on modified Henry's law and BP neural network. Processes, 12(2024) 1091. [CrossRef]
- Zirrahi M, Azin R, Hassanzadeh H ,et al. Mutual solubility of CH4, CO2, H2S, and their mixtures in brine under subsurface disposal conditions. Fluid Phase Equilibria, 324(2012) 80-93. [CrossRef]
- Li L, Ye J, Li M ,et al. Investigation of the law of natural gas phase behavior during the migration and reservoir formation. Geofluids, 2022(2022) 13. [CrossRef]
- Kvam O, Sarkisov L. Solubility prediction in mixed solvents: a combined molecular simulation and experimental approach. Fluid Phase Equilibria, 484(2019) 26-37. [CrossRef]
- Liu F, Han C, Yu L ,et al. Solubility of H2S-CH4 mixtures in calcium chloride solution: Insight from molecular dynamics simulations. Journal of Molecular Liquids, 407(2024) 11. [CrossRef]
- Osullivan T D, Smith N O, and Nagy B.. Solubility of natural gases in aqueous salt solution nitrogen in aqueous NaCl at high pressures. Geochimica Et Cosmichimica Acta, 30(1966) 617. [CrossRef]
- Duffy J R, Smith N O, and Nagy B.. Solubility of natural gases in aqueous salt solutions.1. liquids surfaces in the system CH4-H2O-NaCl2-CaCl2 at room temperatures and at pressures below 1000 Psia. Geochimica Et Cosmichimica Acta, 24(1961) 23-31, https://doi.10.1016/0016-7037(61)90004-7.
- Smith N O, Kelemen S, and Nagy B.. Solubility of natural gases in aqueous salt solutions.2. nitrogen in aqueous NaCl, CaCl2, Na2SO4 and MgSO4 at room temperatures and at pressures below 1000 Psia. Geochimica Et Cosmichimica Acta, 26(1962) 921-926, https://doi.10.1016/0016-7037(62)90066-2.
- Yang K, Zhou J P, Xian X F ,et al. Gas adsorption characteristics changes in shale after supercritical CO2-water exposure at different pressures and temperatures. Fuel, 310(2022) 122260, https://doi.10.1016/j.fuel.2021.122260.
- Ma J, and Huang Z .. Experiments of methane gas solubility in formation water under high temperature and high pressure and their geological significance. Australian Journal of Earth Sciences, 64(2017) 335-342, https://doi.10.1080/08120099.2017.1294108.
- Gao J, Zheng D Q, Guo T M. Solubilities of methane, nitrogen, carbon dioxide, and a natural gas mixture in aqueous sodium bicarbonate solutions under high pressure and elevated temperature. Journal of Chemical & Engineering Data, 42(1997) 69-73, https://doi.10.1021/je960275n.
- He H K, Sun B J, Sun X H ,et al. Prediction method for methane solubility in high-temperature and high-pressure aqueous solutions in ultra-deep drilling. Geoenergy Science and Engineering, 223(2023) 211522, https://doi.10.1016/j.geoen.2023.211522.
- Huang X, Guo X, Zhou X,et al. Effects of water invasion law on gas wells in high temperature and high pressure gas reservoir with a large accumulation of water-soluble gas. Journal of Natural Gas Science and Engineering, 62(2019) 68-78, https://doi.10.1016/j.jngse.2018.11.
- Nabipour N, Qasem S N, Salwana E ,et al. Evolving LSSVM and ELM models to predict solubility of non-hydrocarbon gases in aqueous electrolyte systems. Measurement, 164(2020) 107999, https://doi.10.1016/j.measurement.2020.107999.
- Neisani Samani N, Miforughy S M, Safari H,et al. Solubility of hydrocarbon and non-hydrocarbon gases in aqueous electrolyte solutions: A reliable computational strategy. Fuel, 241(2019) 1026-1035, https://doi.10.1016/j.fuel.2018.11.
- Nakhaei-Kohani R, Taslimi-Renani E, Hadavimoghaddam F ,et al. Modeling solubility of CO2-N2 gas mixtures in aqueous electrolyte systems using artificial intelligence techniques and equations of state. Scientific Reports, 12(2022) 3625, https://doi.10.1038/s41598-022-07393-z.
- Zoghi A T, Feyzi F, Zarrinpashneh S,et al. Solubility of light reservoir gasses in water by the modified Peng-Robinson plus association equation of state using experimental critical properties for pure water. Journal of Petroleum Science and Engineering, 78(2011) 109-118, https://doi.10.1016/j.petrol.2011.05.
- Hemmati-Sarapardeh A, Amar M N, Soltanian M R,et al. Modeling CO2 solubility in water at high pressure and temperature conditions. Energy & Fuels, 34(2020) 4761-4776, https://doi.10.1021/acs.energyfuels.0c00114.
- Dhima A, De Hemptinne J C, Jose J. Solubility of hydrocarbons and CO2 mixtures in water under high pressure. Industrial & Engineering Chemistry Research, 38(1999) 3144-3161, https://doi.10.1021/IE980768G.
- Xie Y H, Huang B J. Characteristics and accumulation mechanisms of the Dongfang 13-1 high temperature and overpressured gas field in the Yinggehai Basin, the South China Sea. Science China-Earth Sciences, 57(2014) 2799-2807, https://doi.10.1007/s11430-014-4934-0.
- Taggart I. Extraction of dissolved methane in brines by CO2 injection: implication for CO2 sequestration. Spe Reservoir Evaluation & Engineering, 13(2010) 791-804, https://doi.10.2118/124630-PA.
- Wu Y, Li P. The potential of coupled carbon storage and geothermal extraction in a CO2-enhanced geothermal system: a review. Geothermal Energy, 8(2020) 19, https://doi.10.1186/s40517-020-00173-w.
- Caiwei F, Jiangjun C, Jinglan L ,et al. Heterogeneity and influencing factors of marine gravity flow tight sandstone under abnormally high pressure: a case study from the miocene Huangliu formation reservoirs in LD10 area, Yinggehai Basin, South China Sea. Petroleum Exploration and Development, 48(2021) 1048-1062, https://doi.10.1016/S1876-3804(21)60090-3.
- Yu J F, Song R Y, Pei J X ,et al. CO2 fluid flow patterns near major deep faults: geochemical and 3D seismic data from the Ying-Qiong basin of the south China sea. Geofluids, 2022(2022) 9962343, https://doi.10.1155/2022/9962343.
- Liu R, Heinemann N, Liu J,et al. CO2 sequestration by mineral trapping in natural analogues in the Yinggehai basin, south China sea. Marine & Petroleum Geology, 104(2019) 190-199, https://doi.10.1016/j.marpetgeo.2019.03.
- Sun Y, Lin R Y, Pan Y ,et al. Experimental analysis and numerical simulation of the stability of geological storage of CO2: a case study of transforming a depleted gas reservoir into a carbon sink carrier. Acs Omega, 6(2021) 34832-34841, https://doi.10.1021/acsomega.1c05475.
- Zhang X F, Song X H, Li X Y ,et al. Supercritical CO2 injection-induced fracturing in longmaxi shales: a laboratory study. Energies, 18(2025) 855, https://doi.10.3390/en18040855.
- Wang J, Wang Z S, Wang Y B ,et al. CO2 replacing CH4 behaviors and supercritical conditions. Energy & Fuels, 34(2020) 4353-4365. https://doi.10.1021/acs.energyfuels.0c00169.
- Li L L. Solubility and exsolution study of CO2 and CH4. Doctoral dissertation, 2018.
- Han S J, Sang S X, Duan P P ,et al. The effect of the density difference between supercritical CO2 and supercritical CH4 on their adsorption capacities: an experimental study on anthracite in the Qinshui Basin. Petroleum Science, 19(2022) 1516-1526, https://doi.10.1016/j.petsci.2022.03.003.
Figure 1.
Gas reservoir profile of LD10-X.
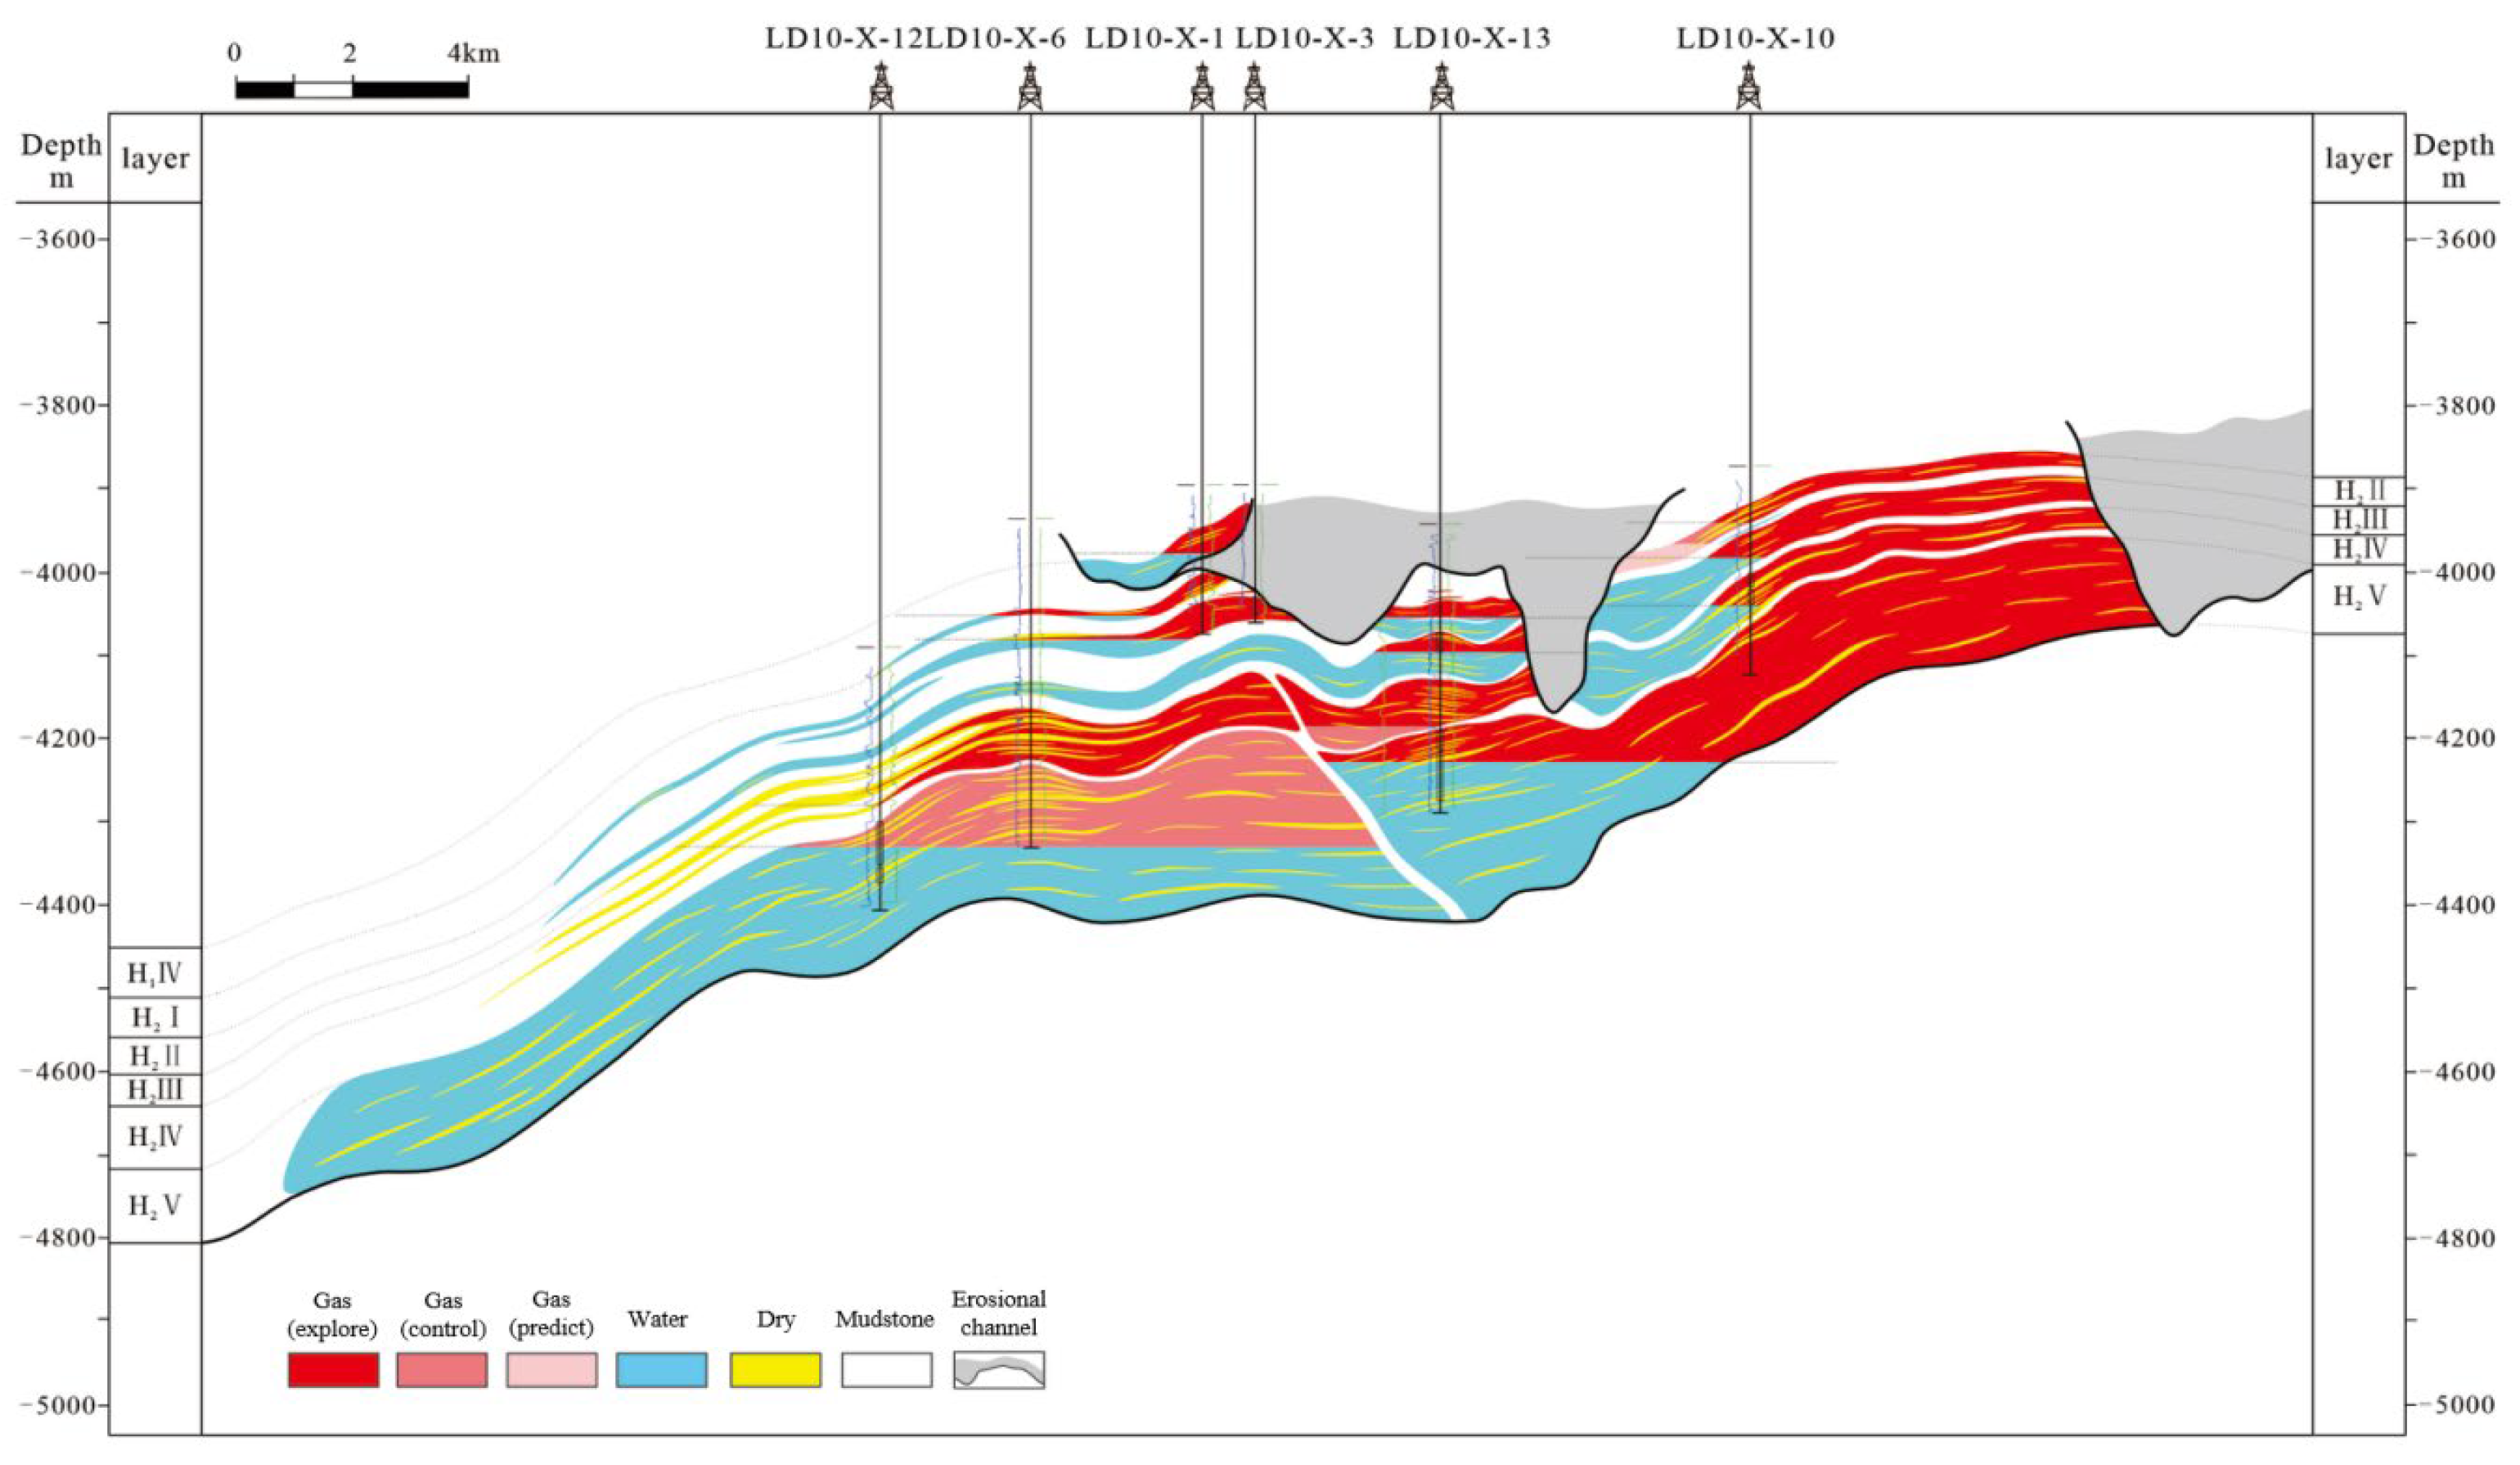
Figure 15.
CH4 and CO2 concentration changes during drill stem testing in LD10-X-10 well.
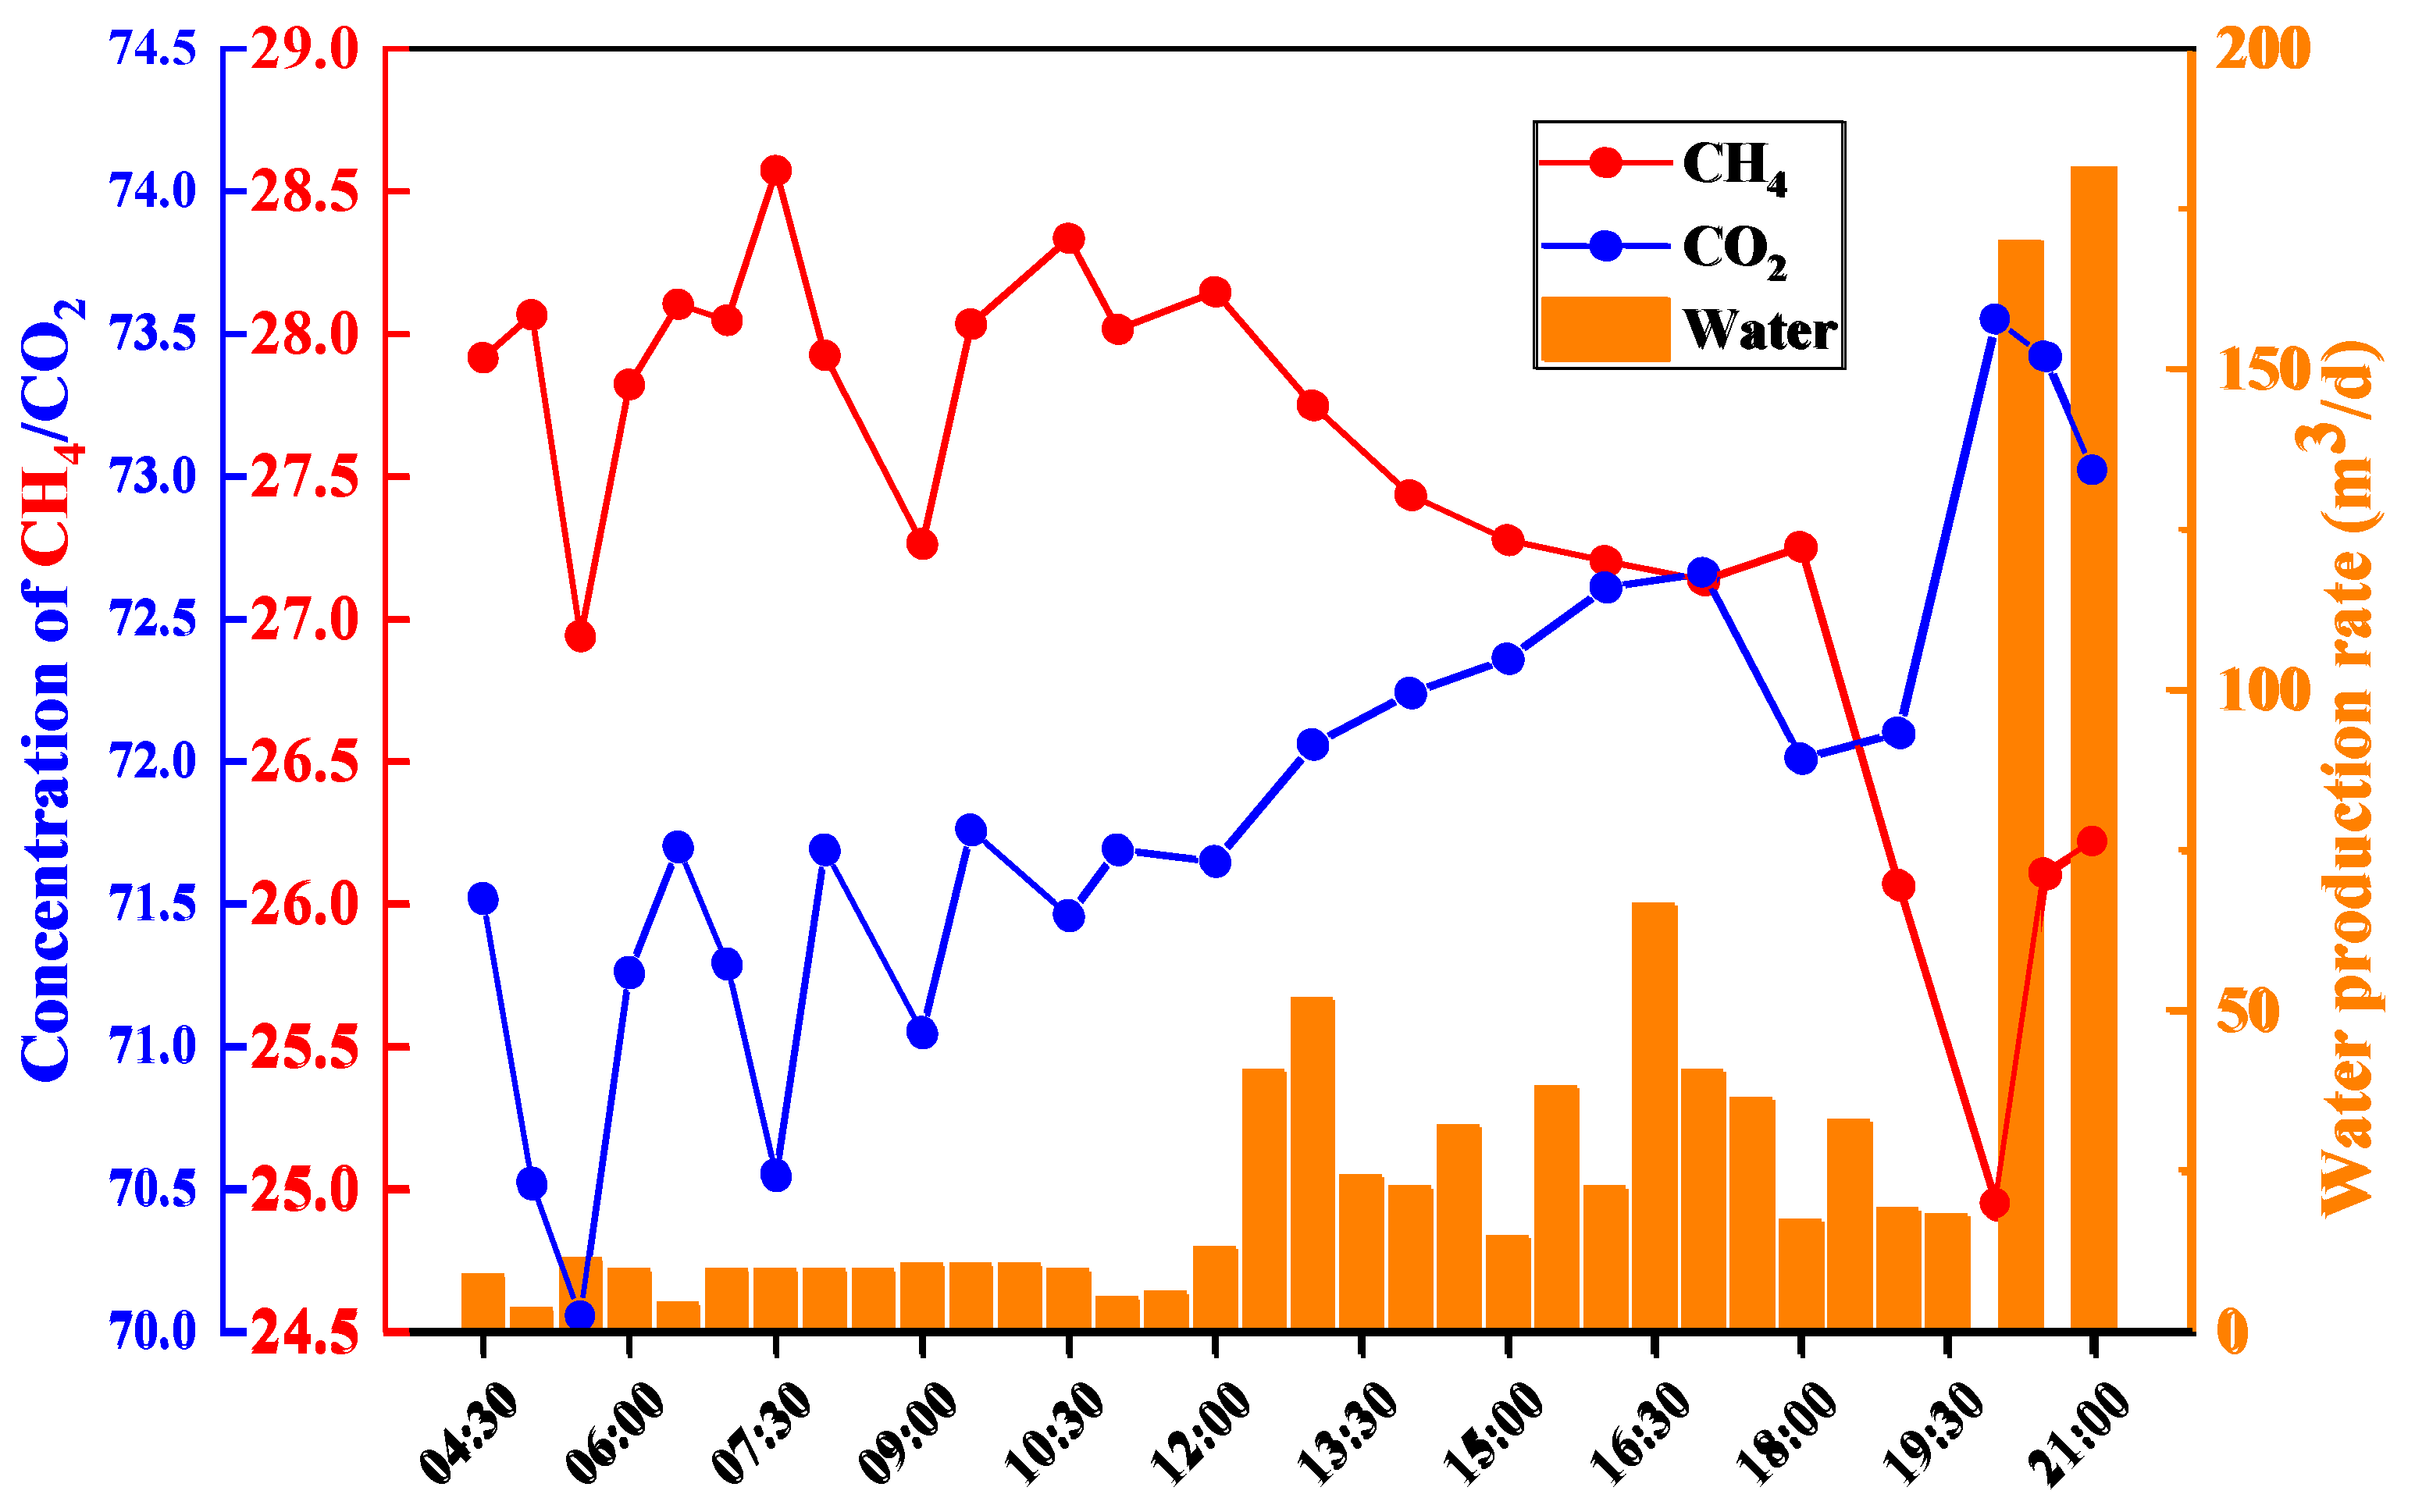
Figure 16.
CH4 and CO2 concentration changes during drill stem testing in LD10-X-12 well.
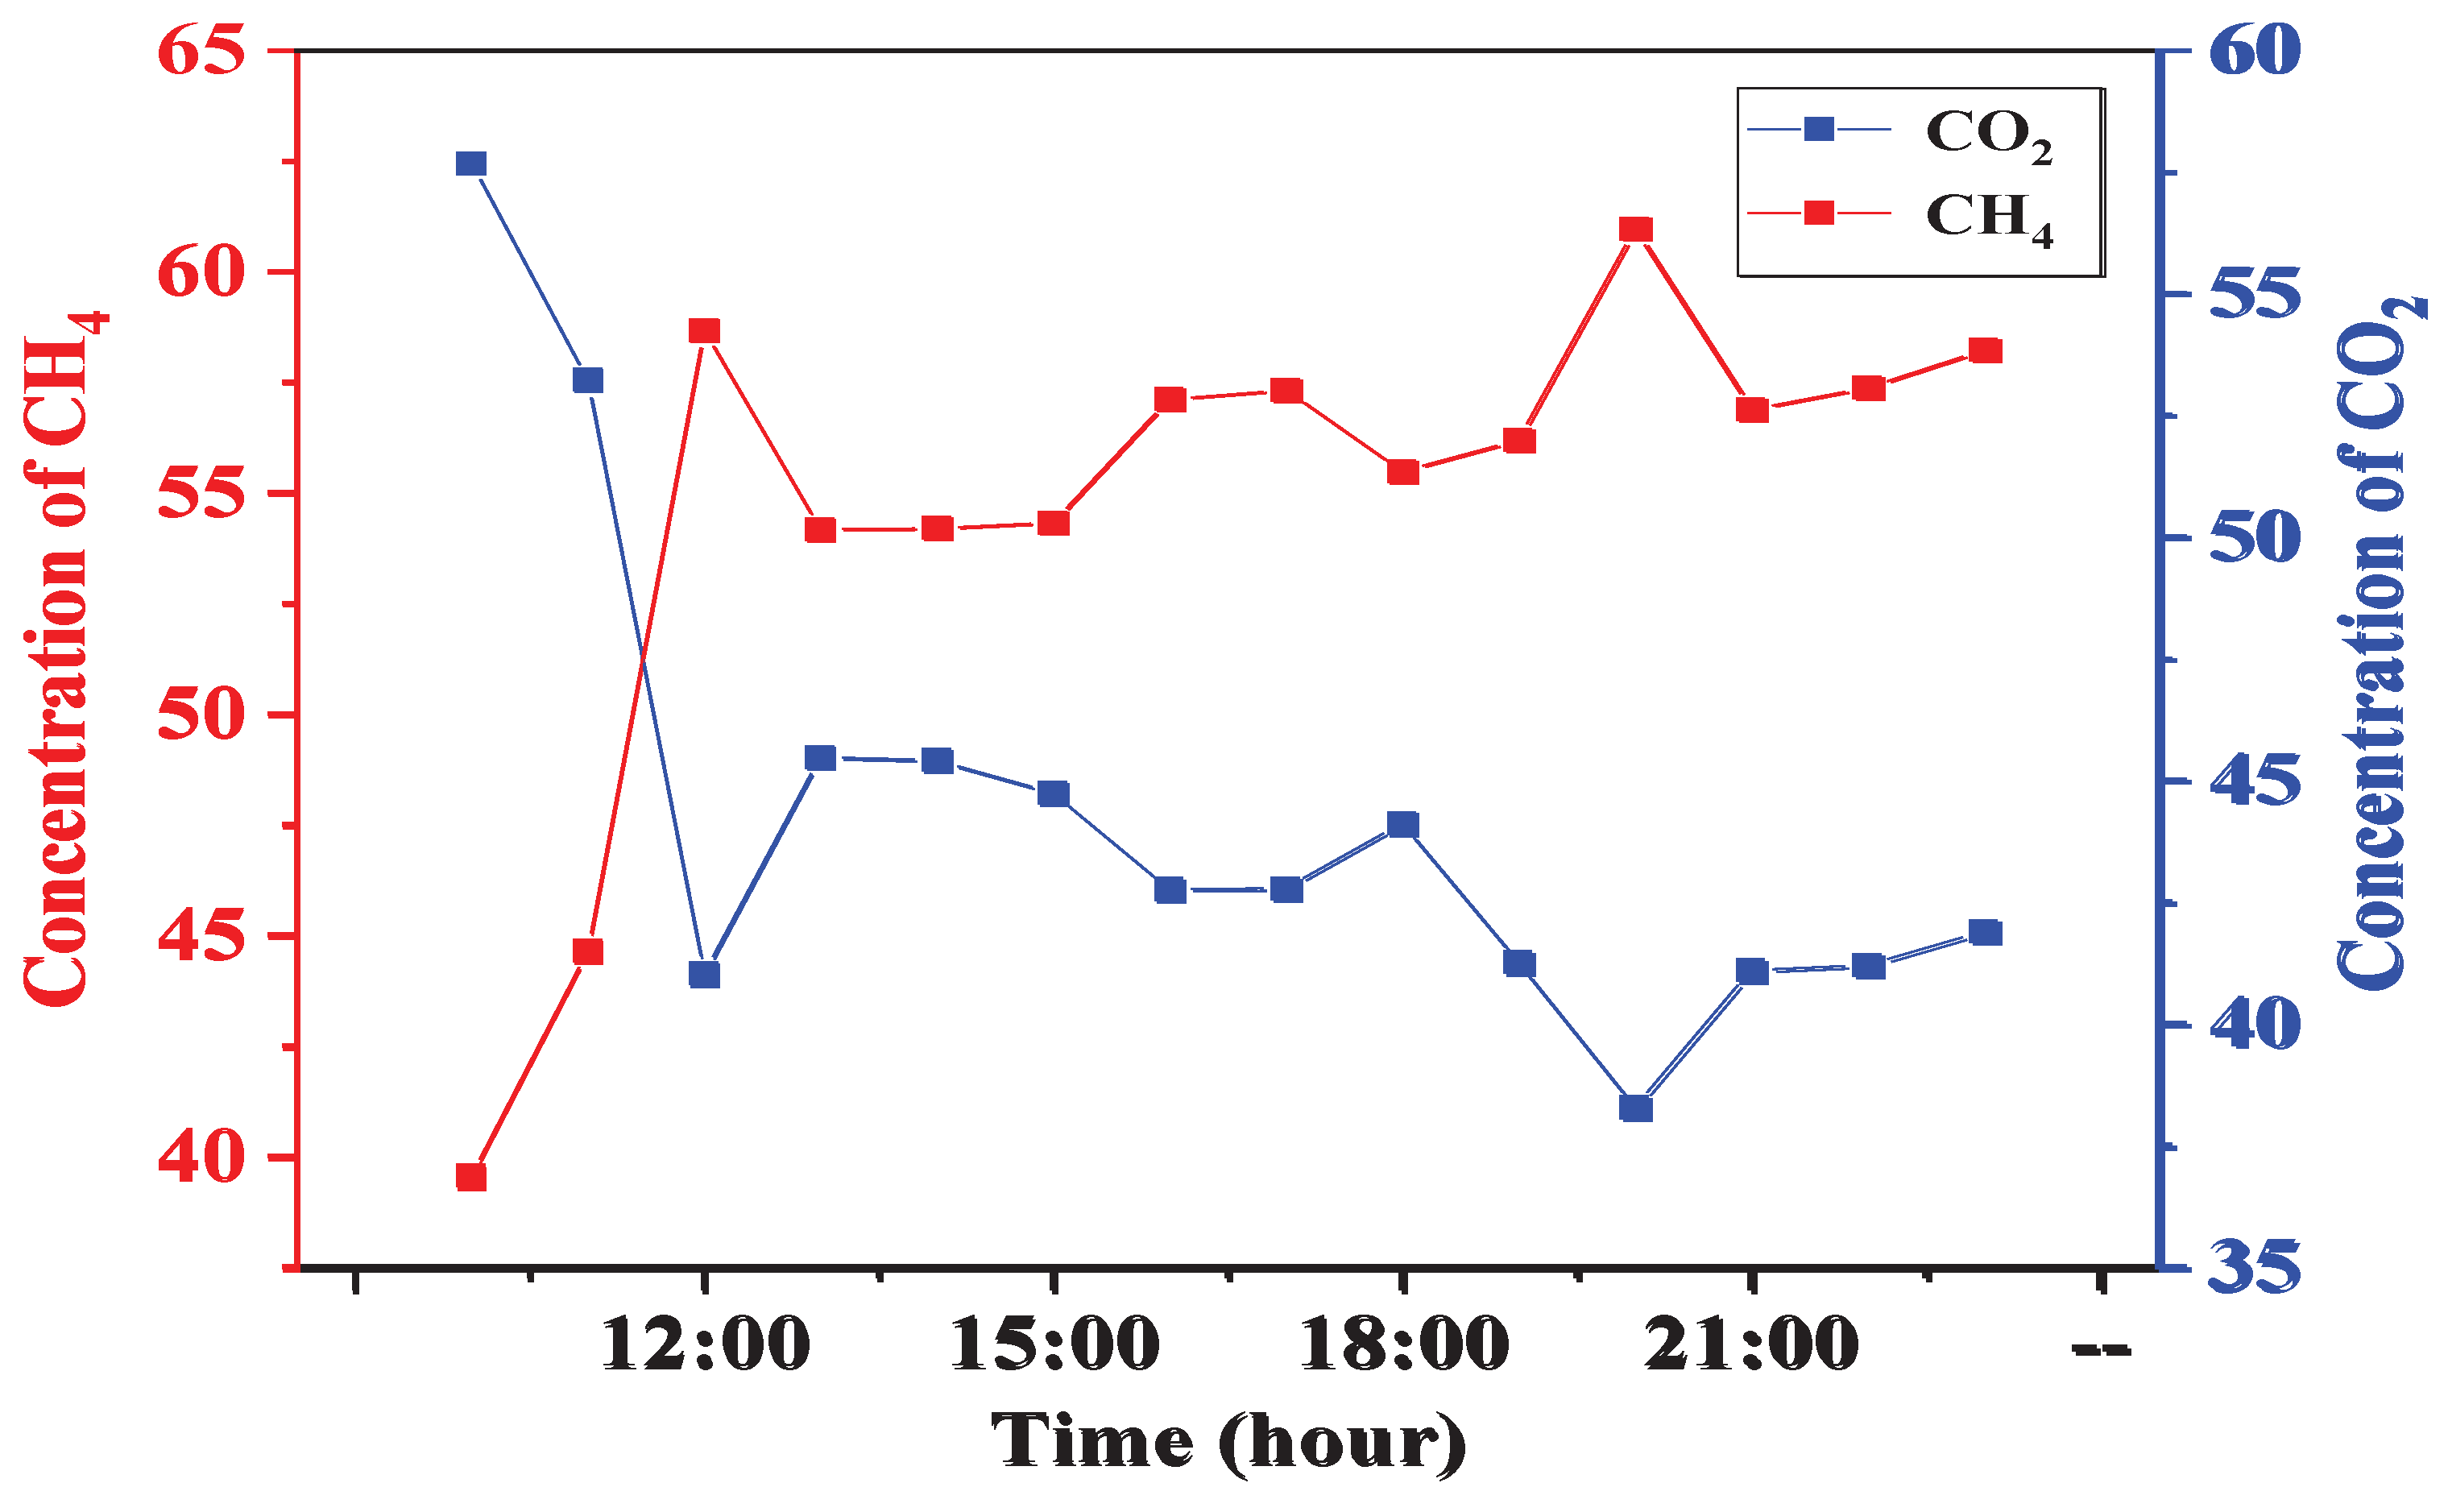

Table 1.
The ion composition of formation water from LD10-X gas field.
| Ion Type | Na++K+ | Mg2+ | Ca2+ | Cl- | SO42- | HCO3- | Total Salinity |
| Ion Content (mg/L) |
4884 | 6 | 3 | 2177 | 121 | 7100 | 14848 |
Table 2.
Characteristic parameters of different wells in LD10-X gas field.
| Well | Layer | Pressure (MPa) |
Temperature (K) |
CH4 | CO2 | Cl- (mg/L) | Solubility (m3/m3) | Proportion of solution gas (%) | Gas type |
| LD10-X-10 | H2Ⅳ | 87.079 | 468.42 | 27.05 | 70.98 | 5000 | 47.6 | 0.54 | free gas |
| LD10-X-12 | H2V | 93.985 | 488.35 | 53.01 | 42.93 | 5400 | 41.25 | 100 | solution gas |
Disclaimer/Publisher’s Note: The statements, opinions and data contained in all publications are solely those of the individual author(s) and contributor(s) and not of MDPI and/or the editor(s). MDPI and/or the editor(s) disclaim responsibility for any injury to people or property resulting from any ideas, methods, instructions or products referred to in the content. |
© 2025 by the authors. Licensee MDPI, Basel, Switzerland. This article is an open access article distributed under the terms and conditions of the Creative Commons Attribution (CC BY) license (http://creativecommons.org/licenses/by/4.0/).
Copyright: This open access article is published under a Creative Commons CC BY 4.0 license, which permit the free download, distribution, and reuse, provided that the author and preprint are cited in any reuse.


