Preprint
Article

This version is not peer-reviewed.

Comparative Effectiveness of a Social Cognitive Theory(SCT)-Socioecological Model(SEM)-Based Literacy-Board-Game(S-S-LIBOG) Versus Didactic Health Talk (HT) for Prostate Cancer Literacy in a Ghanaian Cohort: A Single-Camp Quasi-Experimental Interventional Study, Plus Introducing 17 other S-S-LIBOGs

A peer-reviewed article of this preprint also exists.

Submitted:

12 August 2025

Posted:

14 August 2025

You are already at the latest version

Abstract

Background: Prostate cancer is a global health concern, with varying epidemiological, disease severity, and treatment outcome patterns across populations. Studies on disparities suggest that up to 80% of prostate cancer in Ghana are reported late, translating into a case-fatality rate of 55.2%. Prostate cancer awareness is vital for early detection and management. Traditional methods like health talks and recorded educational audios are common, but their effectiveness compared to interactive approaches like board games remains underexplored. Objective: To evaluate the effectiveness of a social cognitive theory/socio-ecological model-based Snakes, Ladders, and Arrows board game (the S-S-LIBOG) versus traditional educational methods in enhancing prostate cancer knowledge, attitudes, and behavioral intentions. Methods: Using a single-camp pretest-post-test interventional approach, a quasi-experimental study with randomized assignment of interventions was done. A multi-stage sampling method (stage 1, purposive, and stage 2, systematic random sampling) was used. The study involved 197 participants, divided into two groups of (80 for game arm, 61 for talk arm after correction for attrition). The study group received an educational game (the LIBOG), while the control group attended a didactic prostate cancer talk. The Knowledge, Attitudes, and Perception (KAP) questionnaire, based on a 5-point Likert scale, was administered before and after the intervention. A Two-Proportion Z-test assessed statistical significance between the pre-and post-intervention results within each group, while the Wilcoxon Signed-Rank Test was used to compare KAP changes in the two groups, all at an alpha level of 0.05% (95% CI). Results: Among participants, 29.4% were female, 64.5% male, and 6.1% other. Tertiary education was reported by 81.7%, secondary 9.6%, postgraduate 5.6%, and primary 3.0%. Ethnicities: Ewe 41.6%, Akan 26.9%, Northern 13.7%, Ga 6.6%, Guan 1.5%, others 9.6%. Rural dwellers: 29.9%. LIBOG improved ‘good knowledge level’ from 35.0% at baseline to 60.0% post-intervention; compared to 35.0% to 62.3% by the Health Talk (HT). LIBOG also narrowed gender, education, and lifestyle disparities in KAP, with males showing higher odds of positive attitude (OR = 4.16, p = 0.004) and perception (OR = 2.79, p = 0.047), and rural residents having increased odds of good knowledge (OR = 4.39, p = 0.041) post - its intervention. HT similarly equalized disparities, except for perception, which remained linked to education. HT showed higher overall percentage gains in knowledge (35.48% vs. 23.47%), but the difference was not statistically significant (Z = 1.11, p = 0.267). Wilcoxon Signed-Rank Test confirmed no statistically significant difference in median (W = 102.0, p = 0.107), indicating comparable effectiveness. Both interventions significantly improved knowledge (LIBOG: z = 2.85, p = 0.004; HT: z = 3.10, p = 0.002). LIBOG had a notable advantage in attitude enhancement (z = -2.07, z = 3.85) and was highly accepted, with over 80% of users reporting satisfaction. Conclusion: This study does not denigrate health talks (HT), which, overall, outperformed LIBOG (but with no statistically significant difference). The LIBOG produced 71% of the overall impact of HT, trailing in Knowledge impact, but leading marginally in impacting positive attitudes and perceptions. It is not inferior, has high acceptability, and is potentially a good adjunct to existing methods. Further research should explore LIBOG’s long-term impacts and applicability in broader populations.

Keywords: 
;  ;  ;  ;  ;  ;  ;  ;  ;  ;  ;  ;  ;  

Introduction

Prostate cancer (PCa) exerts significant burden globally both in the health sector and economic sector. It is ranked top 5 in both incidence and mortality globally, in incidence after lung, breast and colorectal cancer and in mortality after lung, liver, stomach cancer [1,2,3,4,5]. Zhang et al. (2023) in their Systematic Analysis from the Global Burden of Disease Study concluded prostate cancer is the most common diagnosed cancer in men [3]. In Africa, statistics show that prostate cancer is as loud as it is globally but there are discrepancies [5,6,7,8] which is most likely due to poor cancer registration systems [3,4,5,6,7]. Evidence suggests that most new cases of cancers are now found in Africa and low-and middle-income countries (LMICs), increasing from 15% in 1970, to 56% in 2008, and projected to reach about 70% by 2030 [4].
Numerous epidemiologic studies have linked PCa risk to various factors, i.e. age, ethnicity, family history, insulin-like growth factors, lifestyle, diet, environmental and occupational exposure [9]. The unequal prevalence of PCa among Black men can be linked to various factors, including personal, provider, institutional, and health system influences. Factors related to black men that have been associated with disparities in prostate cancer (PCa) include limited knowledge about PCa, lack of awareness regarding PCa risks, and delays in detection efforts for PCa [10]. Therefore, interventions and strategies to reduce the PCa health problems are essential, especially those that aim to address community, family and personal factors through behavioral-change intervention programs.
Due to its global burden, many interventions have been implemented to help spread the information on the topic. Most commonly used method is the focused group talk which has sort of become the traditional method of educating the public not just on prostate cancer but almost everything [5,6,7,8,9,10]. Researchers like F. T. Odedina et al. (2004) used this method in their approach to educate their sample population and gained significant increase in their knowledge of prostate cancer in their result [5,6,7,8,9,10]. Other noticeable method is by Odedina et al. (2014) known as the Working through Outreach to Reduce Disparity (W.O.R.D) on Prostate Cancer which employed the use recorded video sketches as the mode of education [5,6,7,8,9,10,11]. They also adapted the use of a Consensus Working Group using the NCI-Grid-Enable Measures (GEM) platform with two Special Interest Groups to focus on behavioral and epidemiology topics [4,5,6,7,8,9,10,11,12]. To be more inclusive, Kaskowitz et al. (2006) in their article titled Bringing prostate cancer education to deaf men, used the American Sign Language (ASL) as their mode of communication [12]. Sadly, the improvement seen in most if not all these implementations are only modest in their early phases [13].
Keywords in prostate cancer management are screening, early detection, diagnosis, and curative treatments. However, these pillars of utopia are not readily available in most subcontinents in Africa for prostate cancer management. This, together with the rapid population growth, increasing life expectancy, urbanization with progressively westernized lifestyles [4] have contributed to the high frequency of advanced prostate cancer in Africa. Late or advanced stages of prostate cancer and almost every other cancer is difficult to treat and mostly the choices of management are palliative care . There also exist barriers to the treatment of advanced cases in low- and- middle- income countries (LMICs [4]).
Prostate cancer’s effect is felt globally, but quite disproportionately among Black men. According to studies, [1,2,3,4,5,6,7,8,9,10,11,12] the highest estimated mortality rates of this disease were found in the Caribbean (Barbados Trinidad and Tobago, and Cuba), sub-Saharan Africa (South Africa), parts of former Soviet Union (Lithuania, Estonia, and Latvia), whereas the lowest rates were found in Asia (Thailand and Turkmenistan). From available data, prostate cancer incidence and mortality rates have been on the decline or have stabilized recently in many countries, with decreases more pronounced in high-income countries [4,5,6,7,8,9,10,11]. But there is an increase in trend of prostate cancer incidence with advancing age [1,2,3,4,5,6,7,8,9,10,11,12].
In Nyakotey-Obu’s article titled Review of Prostate Cancer in Ghana in 2020 he compares the incidence of cervical, breast and prostate cancer using 2015 Data from the Ghana Health Service [13,14]. He found that prostate cancer, although had a lower incidence of 912 cases per-year, had a higher mortality rate of 75 percent as compared to 3052 cases per year of cervical cancer with 51 percent mortality and breast cancer 2260 cases with 45 percent mortality rate. He estimated the mortality rate of the prostate cancer in Ghana to be well above three times the global limit. In his article, he attributed this to the fact that there is fewer screening done for prostate cancer and also funding into prostate cancer is few and far between. A Similar article published in Ghana by (Osei Agyemang et al., 2024) to assess PCa awareness, knowledge, and screening practices considered 423 men aged at least 30 years. The result was that although majority of respondents (85.8%) were aware of PCa only 52.5% of the respondents interviewed had adequate knowledge of PCa based on their criterion. Highest educational level and occupation of respondents were found to be significantly associated with awareness and knowledge of PCa. Only, 10.2% of the respondents had ever screened for PCa. Additionally, lack of education on PCa and fear of the unknown were the most reported barriers to prostate cancer screening [13,14].
Focused group discussions, survey, personal interviews and consensus working groups as stated before are the methods of approach for most outreaches and public health promotion activities, and even though these methods are regularly at play there is still an increase in the incidence of PCa with increasing age in Africa [1,2,3,4,5,6,7,8,9,10,11,12,13,14,15,16,17,18,19,20,21,22].
There is therefore the need to adopt new more engaging and lasting methods which will target not just the individual, but his circle of influence as well [22,23,24,25,26,27,28,29]; as stipulated by frameworks like the social cognitive theory (SCT) and the socioecological model(SEM) of health [26,27,28,29]. This approach would make these men and their circles of influence well-equipped with requisite literacy about the disease and also make them new agents of carrying information about the topic far and wide. Essentially, this study seeks to introduce the PCa board game (LIBOG) which is an adaptation from the popular mosquito ludo game from the Boateng et al. (2021) in their interventional study “Co-creation and prototyping of an intervention focusing on health literacy in the management of malaria at the community-level in Ghana” [24]. The LIBOG has been modified further by basing it on the social cognitive theory (SCT) by Bandura et al., 1986 and the socioecological model (SEM) of health (McLeroy 1988 [27,28,29]). Similar board games have been tried by other researchers in other important conditions like HIV/AIDS with significantly positive results, and in the learning urogenital diseases in oddity (LUDO) study that used a parches ludo game to improve the knowledge of emergency physician residents in urologic emergencies by Mallick and Waheed, 2024 [20,21]. Participants and facilitators favored the board game over the health talk as an educational method, in these previous studies [18,19,20,21,22,23,24,27,28,29,30]). The PROCEE game designed by Cosma et al., 2016 as an innovative serious game aimed at providing prostate cancer information and risk evaluation to black African-Caribbean men (using a co-design approach) is another example of gamified approach to prostate cancer health literacy [20,21]. The aim of the index study therefore was to introduce and evaluate the effectiveness of a Snakes, Ladders, and Arrows Literacy board game (properly referred to as the SCT-SEM Prostate Cancer Literacy-Board- Game (S-S-LIBOG) versus traditional educational methods in enhancing prostate cancer knowledge, attitudes, and behavioral intentions amongst a Ghanaian cohort.
The primary objective of this comparative effectiveness study is to evaluate through pretest, intervention, and post- test assessments, the effectiveness of the traditional method (health talk) versus an interactive board game in improving Literacy, attitudes and intended behavior amongst participants towards prostate cancer. The secondary objective was to evaluate the usability of the board game amongst participants, in that arm of the study.
Hypothesis: The study’s null hypotheses were:
There is no difference in the proportion of participants with good knowledge of prostate cancer before and after a standard health talk intervention.
There is no difference in the proportion of participants with good knowledge of prostate cancer before and after the session of interaction with the LIBOG game.
There is no difference in the median percentage gains between LIBOG and Health Talk interventional groups in the study.
Previous Presentation: This work was presented as a Poster during the University of Health and Allied Sciences (Ho, Ghana) Research Conference held in October, 2024. It was also accepted as a conference abstract at the 2025 International Meeting on Simulation in Health Conference, held in January 2025 in Orlando USA, (the Authors could not attend this conference though). The primordial beginnings of the work was also posted as a pre-print on ResearchGate in July 2024, and is available on the following link [22]: https://www.researchgate.net/publication/382708683_Evaluating_the_Effectiveness_of_a_Socio-Ecological_Model-Based_Snake-and-Ladder_Board_Game_Versus_Traditional_Educational_Methods_in_Prostate_Cancer_Awareness_and_Education_A_study_in_Southeastern_Gha?

Materials & Methods

Conceptual Framework

Narrative on the Conceptual Framework Diagrams:
In this study, the Socio-Ecological Model (SEM) serves as a foundational framework for understanding the multifaceted influences on prostate cancer awareness and education. The SEM posits that health behaviors are shaped by a complex interplay of individual, interpersonal, community, and societal factors (McLeroy et al., 1988 [27,28]).
At the individual level, personal knowledge and attitudes toward prostate cancer significantly influence health-seeking behaviors. Interpersonal factors, such as family and peer support, are crucial in shaping beliefs and encouraging proactive health measures [27,28]. The community level includes local resources, health services, and cultural norms that either facilitate or hinder access to prostate cancer education.
Moreover, the broader societal context-including policies, legislation, and media representations-can greatly impact prostate cancer awareness initiatives [27,28] By integrating SEM with Social Cognitive Theory (SCT), this study highlights the importance of observational learning (vicarious learning, operant conditioning (rewards and punishments creating positive and negative reinforcements), environmental influences and self-efficacy, particularly within the educational board game intervention. This dual framework emphasizes the necessity of addressing both personal and contextual factors to enhance educational outcomes and improve health behaviors related to prostate cancer in South-Eastern Ghana [18,19,20,21,22,23,24,25,26,27,28,29,30].
This comprehensive approach not only facilitates a deeper understanding of the barriers to awareness but also informs the design of targeted interventions that leverage social dynamics and community engagement [27,28]. Thus, the SEM-SCT framework could be pivotal in evaluating the effectiveness of innovative educational strategies compared to traditional methods (See Figure 1 and Figure 2).
Why two conceptual frameworks: In this study, using two conceptual frameworks - the Socio-Ecological Model (SEM) and the Social Cognitive Theory (SCT) - is both justified and essential given the complexity of the educational intervention. SEM addresses the multi-level environmental factors (individual, interpersonal, community, societal) influencing prostate cancer awareness, while SCT focuses on individual learning processes, behavior change, and self-efficacy. Keeping them separate allows for a clear distinction between the broader contextual influences (SEM) and individual cognitive mechanisms (SCT), which both contribute uniquely to understanding the effectiveness of the board game.
The intervention also aligns with Intervention Mapping's social-ecological approach, which emphasizes the interplay between individual behaviors and environmental factors [29,30]. By integrating SEM and SCT, we gain a comprehensive understanding of both individual and contextual factors influencing health behavior change, ensuring a robust analysis of the board game's impact in South-Eastern Ghana.

Study Design and Participants

Study Design: The study was a Single-Camp Quasi-Experimental Interventional Study. A two-arm comparative effectiveness study employing pre-intervention and post-intervention tests to measure and compare the specific impacts of two different methods of public education on Prostate cancer. The two arms involved were: the study arm and a control arm.
Study arm: The study arm involved the use of the prostate cancer snakes-ladder-and-arrows ludo game as an educational tool (Pictured in Figure 3 below: and the link to its accompanying manuals, also before it): https://drive.google.com/drive/folders/1KMSfB9k4JNNjox9f92TC6Kaj09daVYdV?usp=sharing
The LIBOG uses an interactive and relaxed interface to create health literacy. It is a journey of life from step 1 to step 100, with points of challenge (or trial points where one could rise or fall). These points have been tied to rewards that could help keep one afloat or on course, once they are able to answer a standard simplified question on prostate cancer correctly. The questions (400) are set in the manuals, with the corresponding answers. These points on the board-game apply social learning concepts like positive reinforcement, negative reinforcement, operant conditioning and vicarious learning to create the learning experience. The game can be played by one to 4 active players at a time; and each player may have their supporters (passive players) backing them and joining to answer questions as well. Turns-taking is allowed as well. With all these, a socially engineered setting of learning which allows the tenets and pillars of the social cognitive theory and the socioecological model (like peer influence, family influence, community influence etc.) in modifying the individual person’s health behaviors come to play, to hopefully improve the outcomes of learning and behavioral change communication. The full manual of the game is provided at the link above. One neutral person may serve as the facilitator who moderates the game with the guidance of the LIBOG game manual. At the trial points, the question that a player may be asked is decided through random selection (the player mentions any unanswered question from 1 to 400, then the facilitator administers/reads out that question from the manual).
Control arm: The control arm employed a didactic prostate cancer talk (with a standard power-point slides) available on the following link: https://drive.google.com/file/d/1AufuUQsTqzOjaLxgy-m6gjwKNtGtCEfr/view?usp=sharing) as the mode of education. Participants were randomly assigned to the various arms through the toss of a dice.
Study Site: The study was conducted at three different prominent locations that were purposively selected within the Ho municipality to achieve heterogeneity. The three locations included the Ho Teaching Hospital (where patients attending the Urology clinic as a regular OPD visit were captured). The others were University of Health and Allied Sciences school of Nursing and Midwifery (sandwich students), and the Asogli hostel facility of the University of Health and Allied Sciences which houses some pre-clinical medical students. Administrative permission was sought from the respective authorities for each study site.
Study Population: The study population comprised of the all men and women (18 years and above), as well as adolescents (12 to 19) who could read, write and comprehend; within the Ho municipality. The study did not target only males because the study is on prostate cancer, which is a whole-family affair (refer back to the SEM and the SCT Frameworks under conceptual framework of this paper).
Inclusion Criteria: This study included all consenting groups or individuals who accept to partake in the study.
Exclusion criteria: medical doctors and full clinical year medical students were excluded from the study. Individuals or groups that refuse to consent will also be excluded.

Variables

Key variables extracted included: Demographics (age, education, occupation, residence, religion, ethnicity, family history of prostate, breast, ovarian or bladder cancer). Data bothering on participants’ knowledge of prostate cancer risks, presentation and common treatment choices as well as participants’ attitudes to screening practices were collected.

Inclusion and Exclusion Criteria

Eligibility Criteria: Participants were eligible if they were male and were planned for circumcision during the study period. Exclusion criteria included pre-existing urogenital anomalies, incomplete data or parental refusal to consent.
Data Sources/Measurement: Primary data collected from participants
Bias
To reduce selection and misclassification bias: A uniform questionnaire that was available both in printed hard copies as well as the electronic versions on a google link. Independent reviewers performed cross-checking to validate the collected data at the end of each day of data collection.
Sample Size and Sampling Technique: Sample Size Calculation for a Two-Arm comparative effectiveness study was approached as follows.
A 95% confidence level, Sample Size Determination Using Yamane’s Formula (1967), which states that,
\frac{N}{1 + N(e)^2}n=1+N(e)2N
where: n = required sample size, N = population size, e = 0.05 error margin.
A defined finite population of 320 individuals from our three purposively selected study sites would be used. This population included two classes of non-medical students on the main campus on the University of Health and Allied Sciences, (90 students each, totaling 180), patients from three urology clinics at the Ho Teaching Hospital (30 attendance per-clinic, totaling 90), and 50 student hostel residents.
So, given that the Population size (N) = 320, Margin of error (e) = 0.05 (i.e., 5%),
n = \frac{320}{1 + 320(0.05)^2} = \frac{320}{1 + 320(0.0025)} = \frac{320}{1 + 0.8} = \frac{320}{1.8}
n = \boxed{177.78} \approx \boxed{178}
So, we needed a sample size of 178 to adequately represent a population of 320, assuming a 5% margin of error. Adding a 10% attrition rate would mean the final sample size would be 178 +17.8 =195.8 = 196. So, 200 participants were finally targeted for the study.
Recruitment was as follows: For this study, a total of 200 participants were targeted using proportional representation from a defined finite population of 320 individuals from our three purposively selected study sites. From the breakdown of the finite population above,
Proportional allocation was applied using the formula:
n_i = \left( \frac{N_i}{N_{total}} \right) \times n_{target}ni=(NtotalNi)×ntarget
This yielded the following recruitment targets: 56 participants each from Class A and Class B (main campus students), which sums to 112. 19 participants each from the three urology clinics at Ho Teaching Hospital, which comes to 57 in total. 31 participants from the student’s hostel residents.
This approach ensured that recruitment was fairly distributed across all relevant subgroups based on their representation in the total population.
Data Collection Tool
A standardized questionnaire developed for the study, to ensure consistency and accuracy was used for data collection. It had four sections which included questions about participant’s demography and biodata, knowledge of prostate cancer and screening methods, attitude toward prostate cancer screening and the last sections were on practice of prostate cancer screening and knowledge on prostate cancer treatment and management. The questionnaire was a 5-point Likert scale-based format and closed ended with some categorical format.
The other instruments used for the study were the CaP board-game, well organized PowerPoint slides for the ‘prostate cancer health talk arm of the study, and a Post-Study System Usability Questionnaire (PSSUQ) for the game evaluation. The two questionnaires are presented under the appendix of this paper.
Data Collection Methods: Questionnaires were self-administered for those who could read and write. Interpreters were used for those who could not read or needed guidance. Special identification was assigned to each participant (same code for both pre- and post-test) to ensure the data matches.
Statistical Analysis: Data collected was entered into a Microsoft Excel 2016 spreadsheet and validated for entry errors. The collected data was then analyzed using Stata version-17. Descriptive statistics (frequencies and percentage distribution, measures of central tendency, and standard deviations). Cross-tabulations and chi-square analysis was identified associations and relationships between demographic variables and baseline. Bivariate and multivariate Regression analyses were also conducted. A Two-Proportion Z-test of statistical significance between proportions, for the KAPs in baseline versus post- intervention (in the two arms) was conducted to find statistical improvement in KAPs. The Wilcoxon Signed-Rank Test was used to compare KAP changes in the two groups. All analyses were an alpha level of 0.05% (95% CI).

Technical Information

Board Game Development: This prostate cancer snakes-ladder-and-arrows board game was developed and designed by the authors (of this paper) based on the similar work on a co-creational mosquitoes-board game for malaria education (in Ejisu, Ashanti Region Ghana) by Boateng M. A et al., 2021. The framework that formed the pillars for the development were the social cognitive theory and the socioecological model of health (Bandura et al., 1986 and McLeroy et al., 1988 respectively).
Development of the Digital Application Version of the Board Game: The board game was digitized using Python-based platforms as well as Flutter and UI/UX design tools. The link to this is at the Appendix of this paper.
Pilot Testing of the Board Game: This was done in June 2023 amongst a group of eleven Master of Public Health students of the Ensign Global College in Kpong, Eastern Region of Ghana. They provided important feedback that helped in upgrading the game using a co-creational approach.
Ethical Approval: This study was reviewed and approved by the Ho Teaching Hospital Research Ethics Committee (HOTH-REC) under the protocol number HTH-REC (40) FC_2024. Prior to data collection, written informed consent was obtained from all participants, ensuring that they fully understood the purpose, procedures, potential risks, and benefits of the study. Confidentiality was ensured by data deidentification and access control. All research activities were conducted in strict compliance with the ethical principles outlined in the Declaration of Helsinki regarding research involving human participants.

Results

Sociodemographic Characteristics of Study Participants (Pre-Intervention)

A total of 197 individuals participated in the pre-intervention phase of the study. The gender distribution showed a predominance of males, accounting for 127 participants (64.5%), followed by females at 58 (29.4%), and a small proportion identifying as other genders (12 participants, 6.1%).
The age ranged from 21 to 86 years, with a mean age of 34.3 years (±10.1). When categorized, the majority were in the middle age group (31-50 years), comprising 115 participants (58.4%). Young adults (≤30 years) accounted for 73 participants (37.1%), while the elderly (≥51 years) were 9 participants (4.6%).
With regard to educational attainment, the overwhelming majority had attained tertiary education (161 participants, 81.7%). Participants with secondary education constituted 9.6% (19 participants), while 3.0% (6 participants) and 5.6% (11 participants) had primary and postgraduate education respectively.
In terms of income level, 98 participants (49.7%) reported a medium income, 52 (26.4%) reported low income, and 13 (6.6%) were in the high-income bracket. Income data was not available for 34 participants (17.3%).
Ethnic distribution showed that Ewes formed the largest ethnic group, comprising 82 participants (41.6%), followed by Akan (26.9%), Northern Ghanaians (13.7%), Ga (6.6%), and Guan (1.5%), Others (9.6%).
Participants were fairly well distributed by place of residence: 91 (46.2%) lived in urban areas, 59 (29.9%) in rural areas, and 47 (23.9%) in suburban settings.
Tobacco use was very low, with only 1 current user (0.5%) and 13 former users (6.6%). A vast majority, 183 participants (92.9%), had never used tobacco. Alcohol use was slightly more common: 14 participants (6.6%) were current users, 46 (23.4%) were former users, and 137 (69.5%) had never consumed alcohol.
Family history of various cancers revealed that only 9 participants (4.6%) reported a family history of prostate cancer. Seventeen participants (8.6%) reported a family history of breast cancer, 5 (2.5%) had a family history of ovarian cancer, and 9 (4.6%) had relatives with bladder cancer. A family history of gastrointestinal tract (GIT) cancers was reported by 7 participants (3.0%).
Regarding exercise habits, the majority engaged in some physical activity. Light exercisers (1-2 times per week) accounted for 40.6% (80 participants), while 19.8% (39 participants) reported moderate activity (3-4 times/week). Only 10.7% (21 participants) were classified as active (≥5 times/week), and 28.9% (57 participants) led sedentary lifestyles.
Finally, dietary preferences were mostly mixed: 178 participants (90.4%) consumed a combination of fatty and vegetarian diets. Sixteen participants (8.1%) reported vegetarian diets exclusively, and only 3 participants (1.5%) consumed predominantly fatty foods.
Baseline Knowledge, Attitude and Perception (pretest results), and tests of associations at Baseline:
The baseline pretest dataset comprised a total of 197 participants categorized by various socio-demographic and behavioral characteristics, with knowledge, attitude, and perception (KAP) outcomes relating to prostate cancer awareness. These are shown in Table 1.
Following the above age categorization that 37.1% of participants were classified as “young” (n = 73), 58.4% as “middle-aged” (n = 115), and 4.6% as “old” (n = 9), an analysis of prostate cancer knowledge levels across these age groups showed that good knowledge level was present in 49.3% of the young, 54.8% of the middle-aged, and 33.3% of the old. Poor knowledge was more pronounced among the old (55.6%) and the young (45.2%) compared to the middle-aged (39.1%). However, the association between age and knowledge level category was not statistically significant (χ² = 2.0891, p = 0.719). In terms of attitude, the young demonstrated a higher proportion of positive attitudes (60.3%) compared to middle-aged (50.4%) and older participants (55.6%), with a non-significant association (χ² = 4.2741, p = 0.370). Similarly, perception categories did not differ significantly by age (χ² = 3.5696, p = 0.467), although neutral perceptions were more common in the middle-aged group (18.3%) than in the young (11.0%) and old (0%).
Knowledge scores showed significant variation across gender (χ² = 19.9202, p = 0.001). While 62.1% of females demonstrated good level of knowledge, this was lower among males (52.0%) and entirely absent among those identifying as “other,” all of whom exhibited poor knowledge. A slightly inversed (and still statistically significant) pattern was observed in attitude categories (χ² = 32.5956, p < 0.001), with positive attitudes highest among males (60.6%) and females (51.7%), but absent among the “other” gender group, all of whom had negative attitudes. Perception scores were also significantly associated with gender (χ² = 61.2492, p < 0.001), with the “other” gender group predominantly neutral (91.7%), while males and females were more evenly distributed across categories.
From above, educational level was heavily skewed toward tertiary education (81.7%), with only small proportions having primary (3.1%), secondary (9.6%), or postgraduate (5.6%) education. A statistically significant association was observed between education level and knowledge (χ² = 13.4968, p = 0.036). Good knowledge was most common among postgraduates (63.6%) and those with tertiary education (55.9%), but much lower among those with only primary (16.7%) or secondary (21.1%) education. Attitudes also varied significantly with education (χ² = 27.4030, p < 0.001), with positive attitudes seen in 58.4% of tertiary-educated respondents and 54.6% of postgraduates, compared to just 25.0% and 33.3% of secondary and primary-level participants, respectively. Perceptions followed a similar pattern (χ² = 43.7216, p < 0.001), with positive perceptions more prevalent among tertiary-educated respondents (45.9%).
No statistically significant association was observed between ethnicity and prostate knowledge levels (χ² = 7.4478, p = 0.683), although knowledge appeared highest among the Guan (66.7%) and Ga (61.5%). However, both attitude (χ² = 34.6644, p < 0.001) and perception concerning prostate cancer (χ² = 37.1847, p < 0.001) were strongly associated with ethnicity. Positive attitudes were most frequent among Guan (66.7%) and Northern Ghanaians (63.0%), while the “Other” ethnic group had a high concentration of negative attitudes (78.9%) and poor perception scores (only 10.5% with positive perception).
Urban residents showed the highest rate of good knowledge level on prostate cancer (65.9%), compared to suburban (38.3%) and rural (40.7%) participants. This association was statistically significant (χ² = 14.5797, p = 0.006). Positive attitudes also followed a similar trend (χ² = 15.6341, p = 0.004), being most prevalent among urban (60.4%) and rural (54.2%) residents. Perceptions differed significantly as well (χ² = 9.9496, p = 0.041), with urban and rural dwellers having similar positive perception levels (43.9% and 42.4%, respectively), while suburban residents showed a more neutral outlook (27.7%).
The tobacco user-grouping were significantly associated with good knowledge level on prostate cancer (χ² = 11.8984, p = 0.018), positive attitude (χ² = 29.2372, p < 0.001), and positive perception (χ² = 55.5389, p < 0.001). Good knowledge was least common among former and current users. Among former users, 84.6% had poor knowledge, and only 7.7% exhibited a positive attitude. Notably, all current users reported negative attitudes and perceptions.
Alcohol use was reported as never by 69.5% of respondents, formerly by 23.9%, and currently by 6.6%. Significant differences in knowledge levels (χ² = 19.8448, p = 0.001), attitude (χ² = 26.6195, p < 0.001), and perception (χ² = 56.0029, p < 0.001) were found. All current users (100%) had poor knowledge levels, with a vast majority expressing negative attitudes (92.3%) and perceptions (84.6% neutral) on prostate cancer. In contrast, good knowledge and positive attitudes were more frequent among teetotalers and former users.
Family history of prostate cancer (FMH) was present in 4.6% of participants but not significantly associated with disease knowledge levels (χ² = 0.5000, p = 0.779) or attitude (χ² = 1.0431, p = 0.594). However, there was a modest but statistically significant association with perception (χ² = 6.8469, p = 0.033), as those with FMH were more likely to express neutral perceptions about the disease (44.4%) compared to those without.
Family history of breast cancer (FHBca) was not significantly associated with knowledge levels of prostate cancer (χ² = 2.2079, p = 0.332) or attitude (χ² = 2.7175, p = 0.257) but showed a significant link with perception (χ² = 6.4487, p = 0.040), as neutral perceptions were more common among those with FHBca (35.3%).
A significant association was also found between family history of ovarian cancer (FHOca) and all three KAP outcomes. All respondents with such history had poor knowledge (χ² = 7.0463, p = 0.030), negative attitudes (χ² = 12.2948, p = 0.002), and neutral perceptions (100%) (χ² = 29.7198, p < 0.001) about prostate cancer. Similarly, a history of bladder cancer (FHBlca) was significantly associated with prostate cancer knowledge levels (χ² = 8.4802, p = 0.014), attitude (χ² = 22.6015, p < 0.001), and perception (χ² = 30.3669, p < 0.001), with very poor KAP outcomes among those with such family history.
Family history of gastrointestinal cancers (GITca) was relatively rare (3.0%) and not significantly associated with prostate knowledge levels (χ² = 4.2942, p = 0.117) or attitude (χ² = 4.4776, p = 0.107), though perception showed a modestly significant association (χ² = 6.2392, p = 0.044).
Exercise habits were mostly light (40.6%) or sedentary (28.9%), with fewer reporting moderate (19.8%) or active (10.7%) lifestyles. Knowledge levels differed significantly with exercise levels (χ² = 16.9078, p = 0.010), with good knowledge highest among those engaging in moderate (61.5%) or light (60.0%) activity. Positive attitudes were also more prevalent among those with light (61.3%) and moderate (48.7%) activity levels (χ² = 18.2742, p = 0.006). Perceptions varied significantly (χ² = 36.8740, p < 0.001), with high neutral perceptions reported among the most active group (57.1%).
Lastly, significant associations were observed between diet type and prostate cancer knowledge levels (χ² = 11.3794, p = 0.023), attitude (χ² = 19.0436, p = 0.001), and perception (χ² = 44.7034, p < 0.001). Poor knowledge levels and negative attitudes towards prostate cancer were most common among vegetarians, while those consuming mixed diets showed relatively higher levels of good knowledge (54.5%) and positive attitudes (56.7%). Notably, all respondents consuming only fatty foods had negative perceptions, while vegetarians were more neutral.
In summary, statistically significant associations were found between KAP outcomes and gender, education, residence, ethnicity, lifestyle factors (exercise, diet, tobacco and alcohol use), and selected family cancer histories. These baseline findings provide insight into how socio-demographic and behavioral factors influence prostate cancer awareness and dispositions and form the foundation for evaluating the subsequent interventions in this study.
Relationships between demographic parameters and knowledge, attitude, and perception
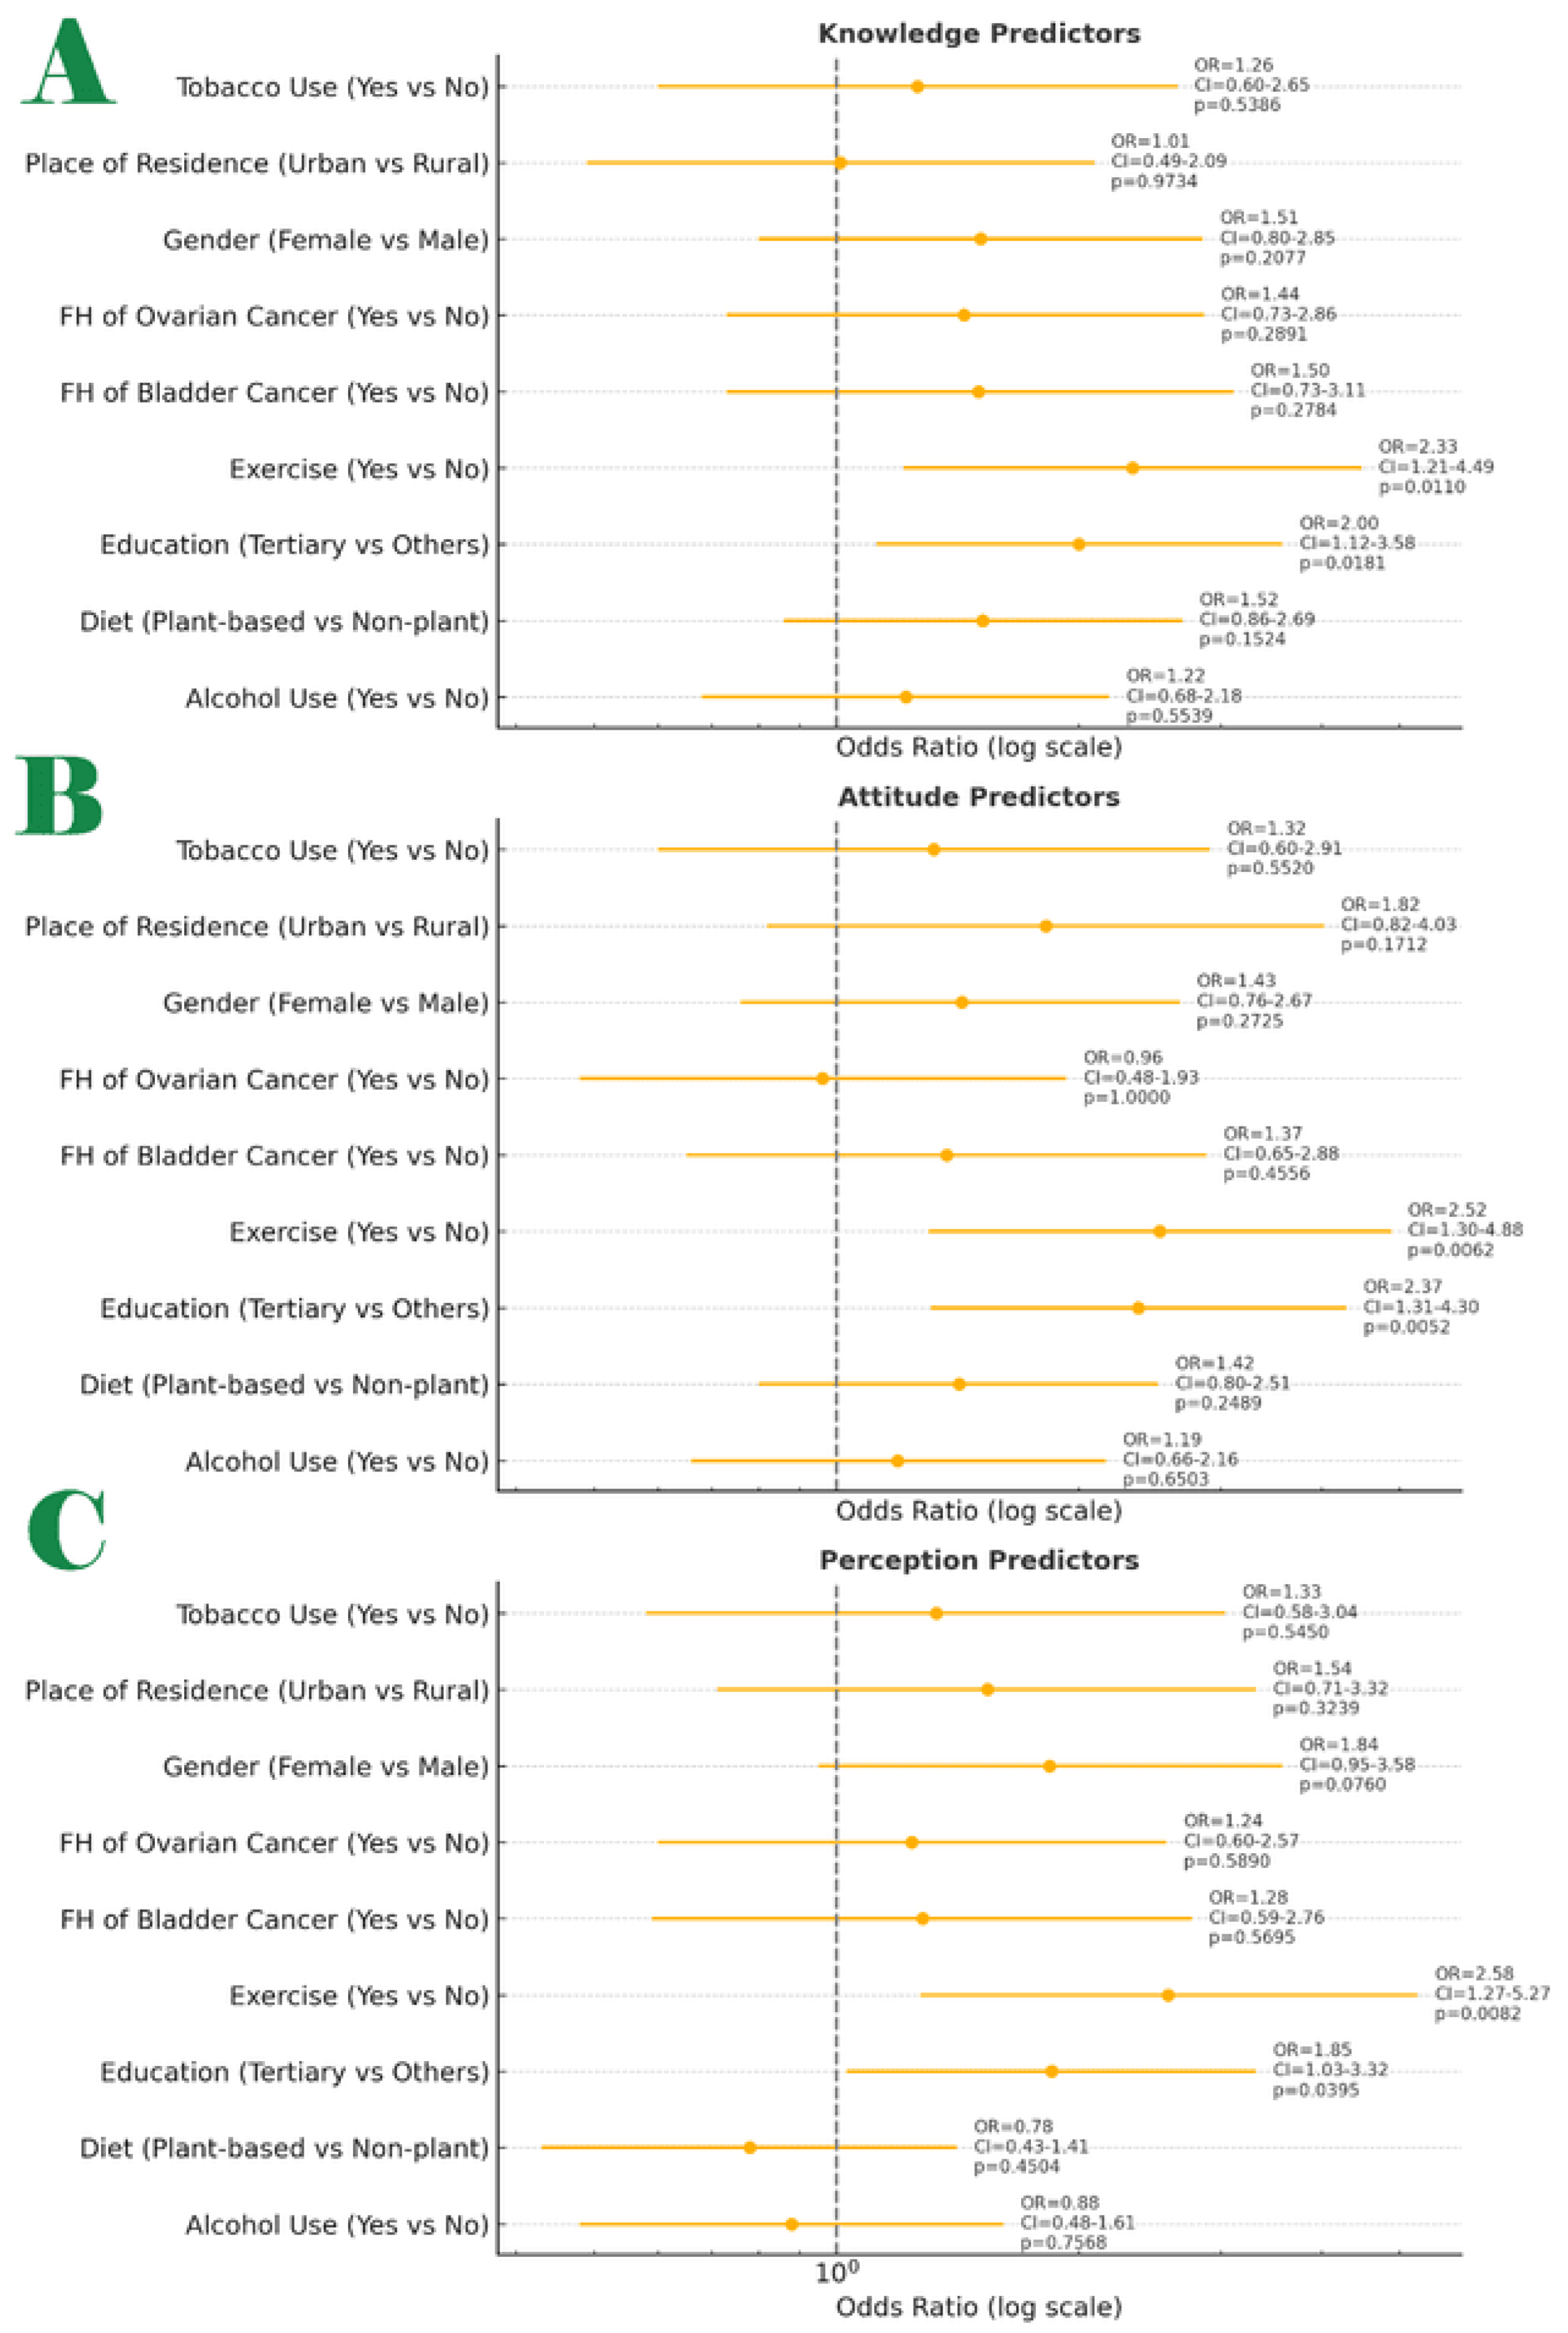
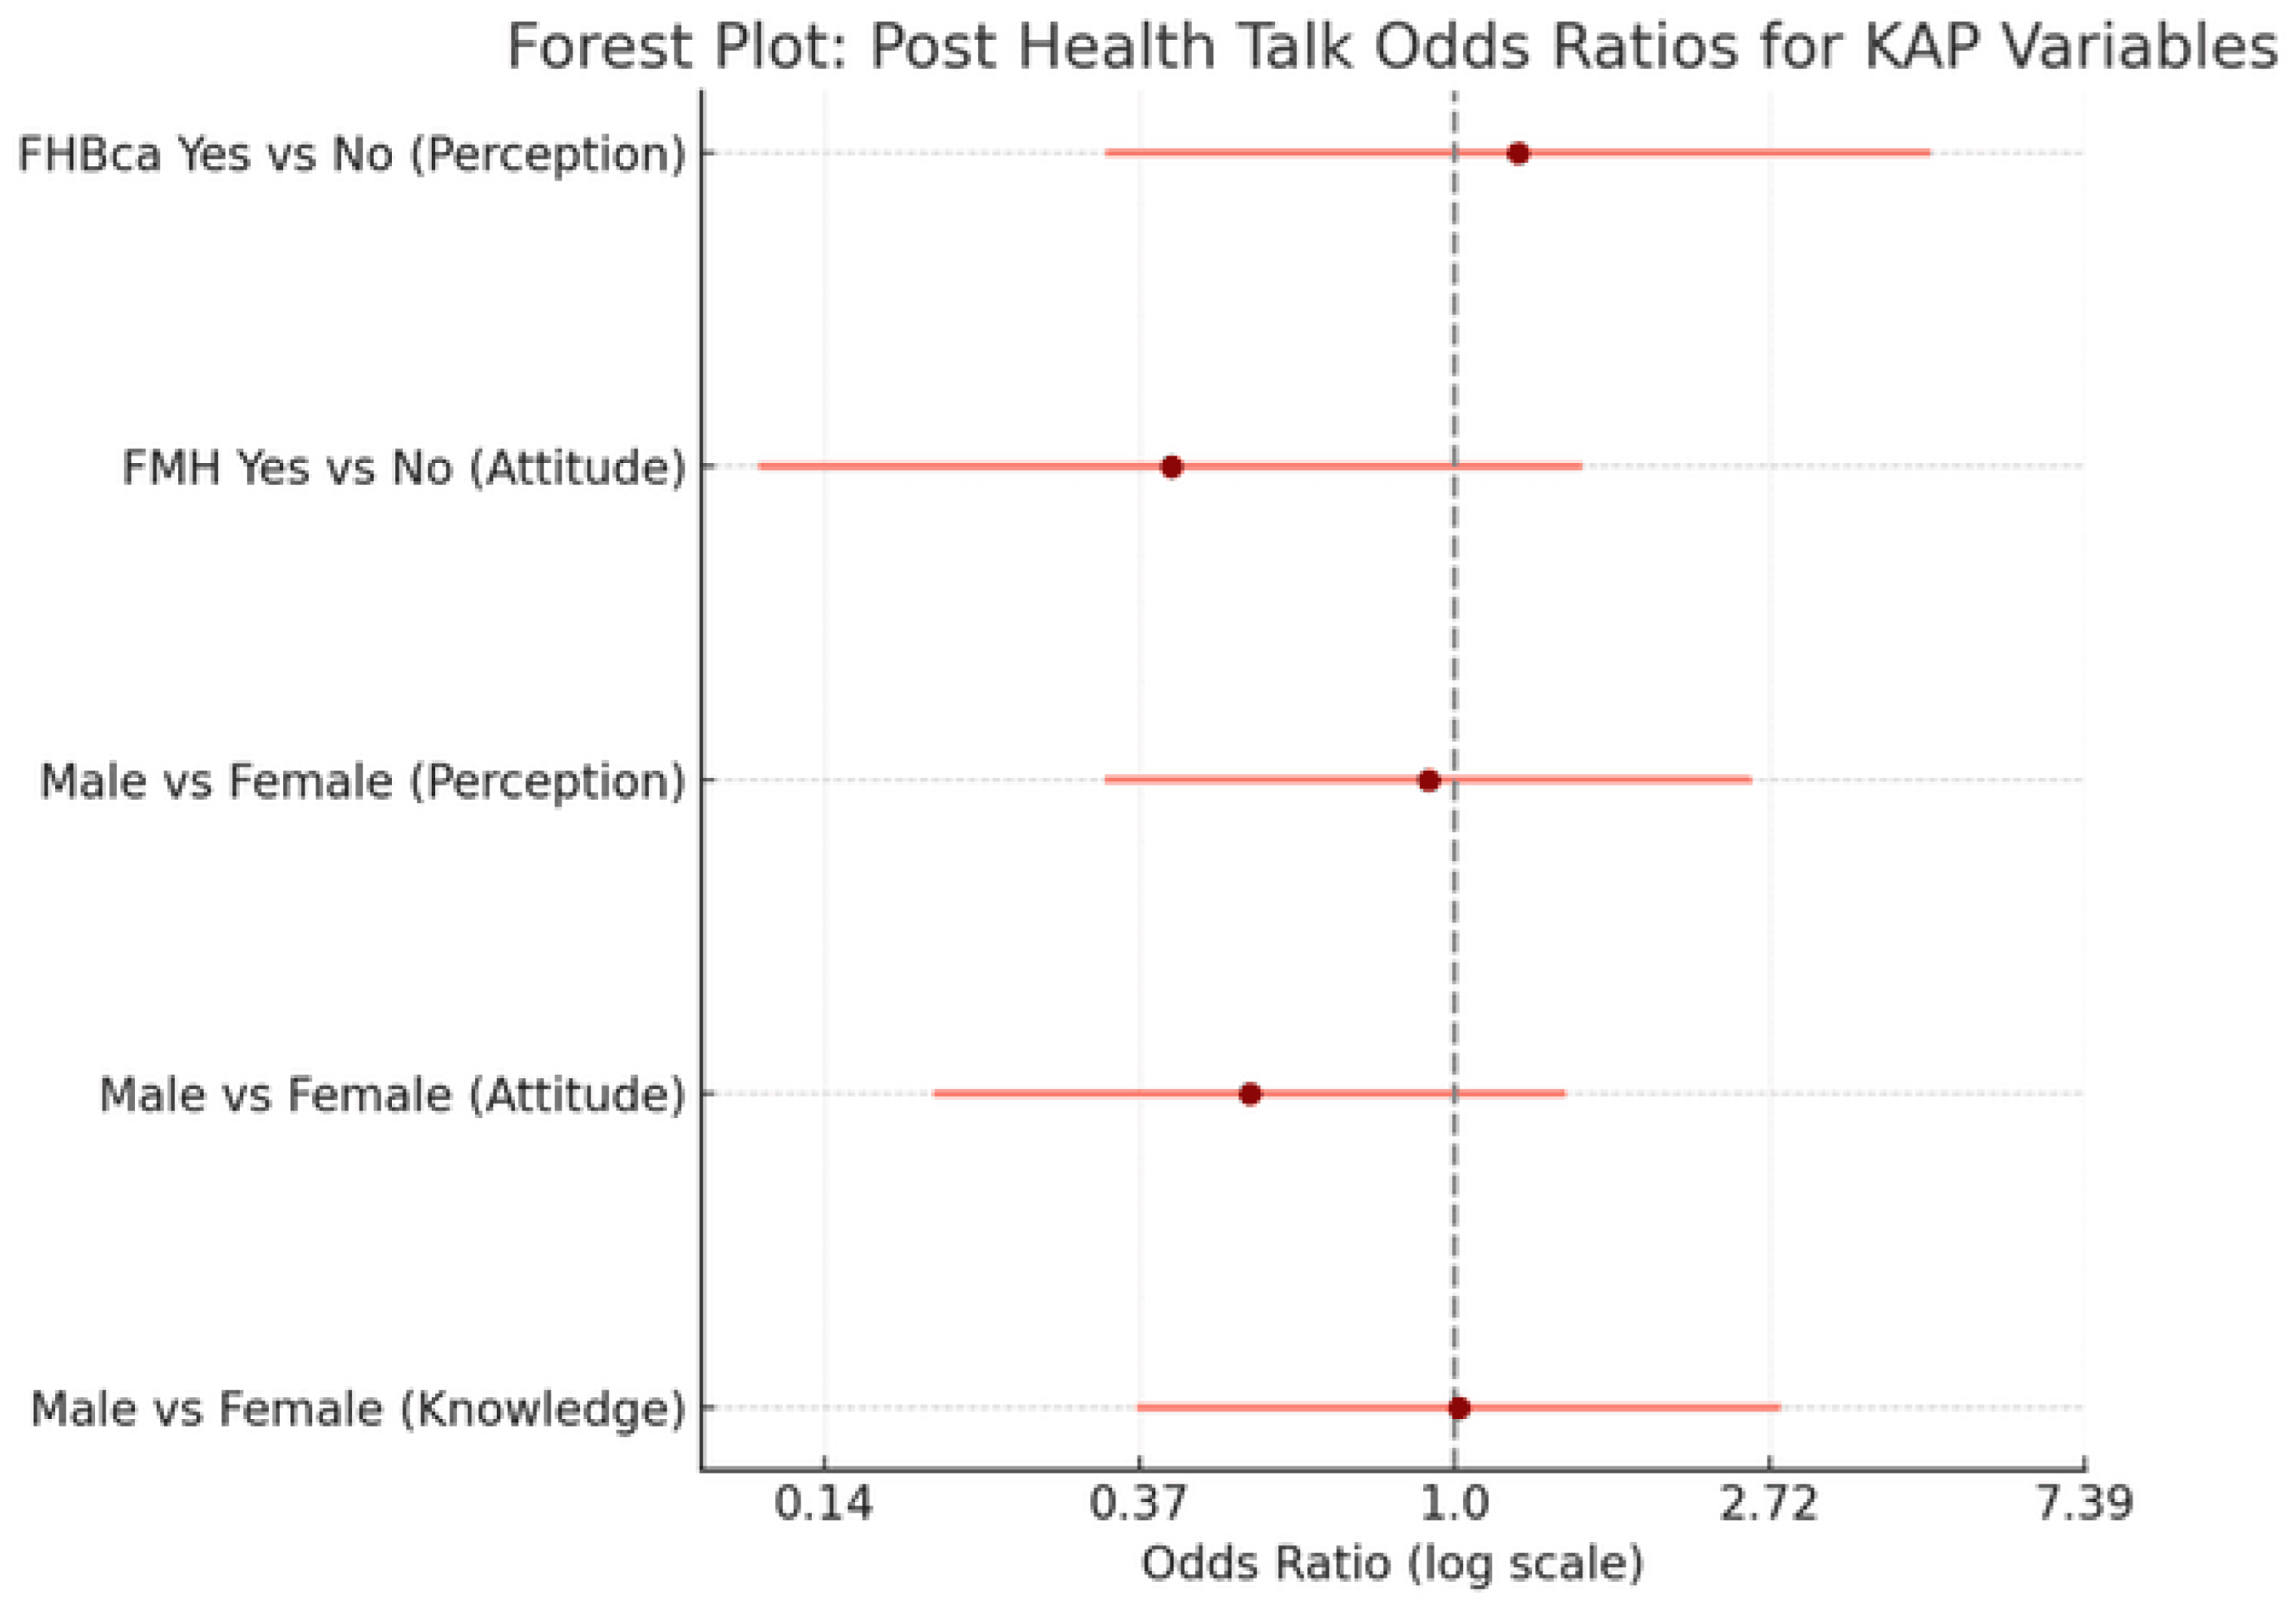
Knowledge: A forest plot was constructed to display the adjusted odds ratios (ORs), 95% confidence intervals (CIs), and p-values for the association between nine selected variables and each of the three KAP domains: Knowledge, Attitude, and Perception toward prostate cancer risk prevention and treatment methods (Figure 4).
OR value, Confidence interval range, Exact p-value. The Statistically significant predictors (p < 0.05) were Knowledge: Tertiary education, Exercise, Attitude: Tertiary education, Perception: Tertiary education, Exercise. The odds ratios were calculated from 2x2 contingency tables using Fisher’s Exact Test and are displayed on a logarithmic scale for interpretability.
In the Knowledge domain, two factors showed statistically significant positive associations:
Tertiary education (OR = 2.37; 95% CI: 1.29-4.35; p = 0.0052) and Regular exercise (OR = 2.14; 95% CI: 1.11-4.14; p = 0.0225)
In the Attitude domain, only tertiary education remained statistically significant (OR = 2.37; 95% CI: 1.29-4.35; p = 0.0052)
In the Perception domain, both tertiary education and exercise were again found to be significantly associated with correct perception (OR = 1.85; 95% CI: 1.03-3.32; p = 0.0395), Regular exercise (OR = 2.57; 95% CI: 1.22-5.41; p = 0.0132).
Other variables-such as gender, place of residence, dietary pattern, tobacco use, alcohol use, and family history of cancer-showed non-significant associations across the three domains.

Multivariate Analysis

Baseline knowledge, Attitude and Perception levels as a function of participants Socio-demographic features were used in multivariate logistic regression analyses. Table 2 shows the outputs.

Good Knowledge

After adjusting for socio-demographic and lifestyle variables, only exercise habits emerged as a significant predictor of good knowledge about prostate cancer. Respondents who exercised regularly had significantly higher odds of having good knowledge level compared to those who did not (AOR = 1.45, 95% CI: 1.06-1.98, p = 0.0207). Gender showed a borderline association, with males having higher odds of good knowledge than females (AOR = 1.81, 95% CI: 0.94-3.46, p = 0.0751), although this did not reach statistical significance. Educational level and income level were not significantly associated with knowledge in this model.

Positive Attitude

Significant predictors of a positive attitude toward prostate cancer screening included gender, income level, and exercise habits. Males were more than twice as likely as females to exhibit a positive attitude (AOR = 2.56, 95% CI: 1.30-5.01, p = 0.0062). Higher income levels were associated with greater odds of a positive attitude (AOR = 1.34, 95% CI: 1.01-1.77, p = 0.0395). Additionally, participants who exercised regularly were significantly more likely to have a positive attitude (AOR = 1.58, 95% CI: 1.15-2.17, p = 0.0047). Educational level was not significantly associated with the attitude towards the disease.

Correct Perception

Among the predictors examined, gender was the only variable significantly associated with correct perception. Males were substantially more likely to have correct perception scores than females (AOR = 16.84, 95% CI: 4.92-57.63, p < 0.0001). No significant associations were found between perception and educational level (AOR = 1.28, p = 0.5706), income (AOR = 0.85, p = 0.3179), or exercise habits (AOR = 1.14, p = 0.451).
Logistic Regression Equations (Logit Models): Let Y₁ = Good Knowledge, Y₂ = Positive Attitude, Y₃ = Correct Perception; then,
\log\left(\frac{P(Y=1)}{1 - P(Y=1)}\right) = \beta_0 + \beta_1X_1 + \beta_2X_2 + \dots + \beta_nX_nlog(1−P(Y=1)P(Y=1))=β0+β1X1+β2X2+…+βnXn
where:
P(Y=1)P(Y=1)P(Y=1) is the probability of the outcome (e.g., Good Knowledge)
β0\beta_0β0 is the intercept
βi\beta_iβi are the logit coefficients (ln(AOR)
XiX_iXi are the predictor variables
Model 1: Good Knowledge (with the variable codes in Table 3),
\log\left(\frac{P(\text{Good Knowledge})}{1 - P(\text{Good Knowledge})}\right) = -2.9591 + 0.5910(\text{Gender}) - 0.0114(\text{Educational Level}) + 0.1319(\text{Income Level}) + 0.3696(\text{Exercise Habits})log(1−P(Good Knowledge)P(Good Knowledge))=−2.9591+0.5910(Gender)−0.0114(Educational Level)+0.1319(Income Level)+0.3696(Exercise Habits)
Model 2: Positive Attitude
\log\left(\frac{P(\text{Positive Attitude})}{1 - P(\text{Positive Attitude})}\right) = -3.5066 + 0.9401(\text{Gender}) - 0.1748(\text{Educational Level}) + 0.2944(\text{Income Level}) + 0.4552(\text{Exercise Habits})log(1−P(Positive Attitude)P(Positive Attitude))=−3.5066+0.9401(Gender)−0.1748(Educational Level)+0.2944(Income Level)+0.4552(Exercise Habits)
Model 3: Correct Perception
\log\left(\frac{P(\text{Correct Perception})}{1 - P(\text{Correct Perception})}\right) = -6.3479 + 2.8234(\text{Gender}) + 0.2476(\text{Educational Level}) - 0.1626(\text{Income Level}) + 0.1316(\text{Exercise Habits})log(1−P(Correct Perception)P(Correct Perception))=−6.3479+2.8234(Gender)+0.2476(Educational Level)−0.1626(Income Level)+0.1316(Exercise Habits)
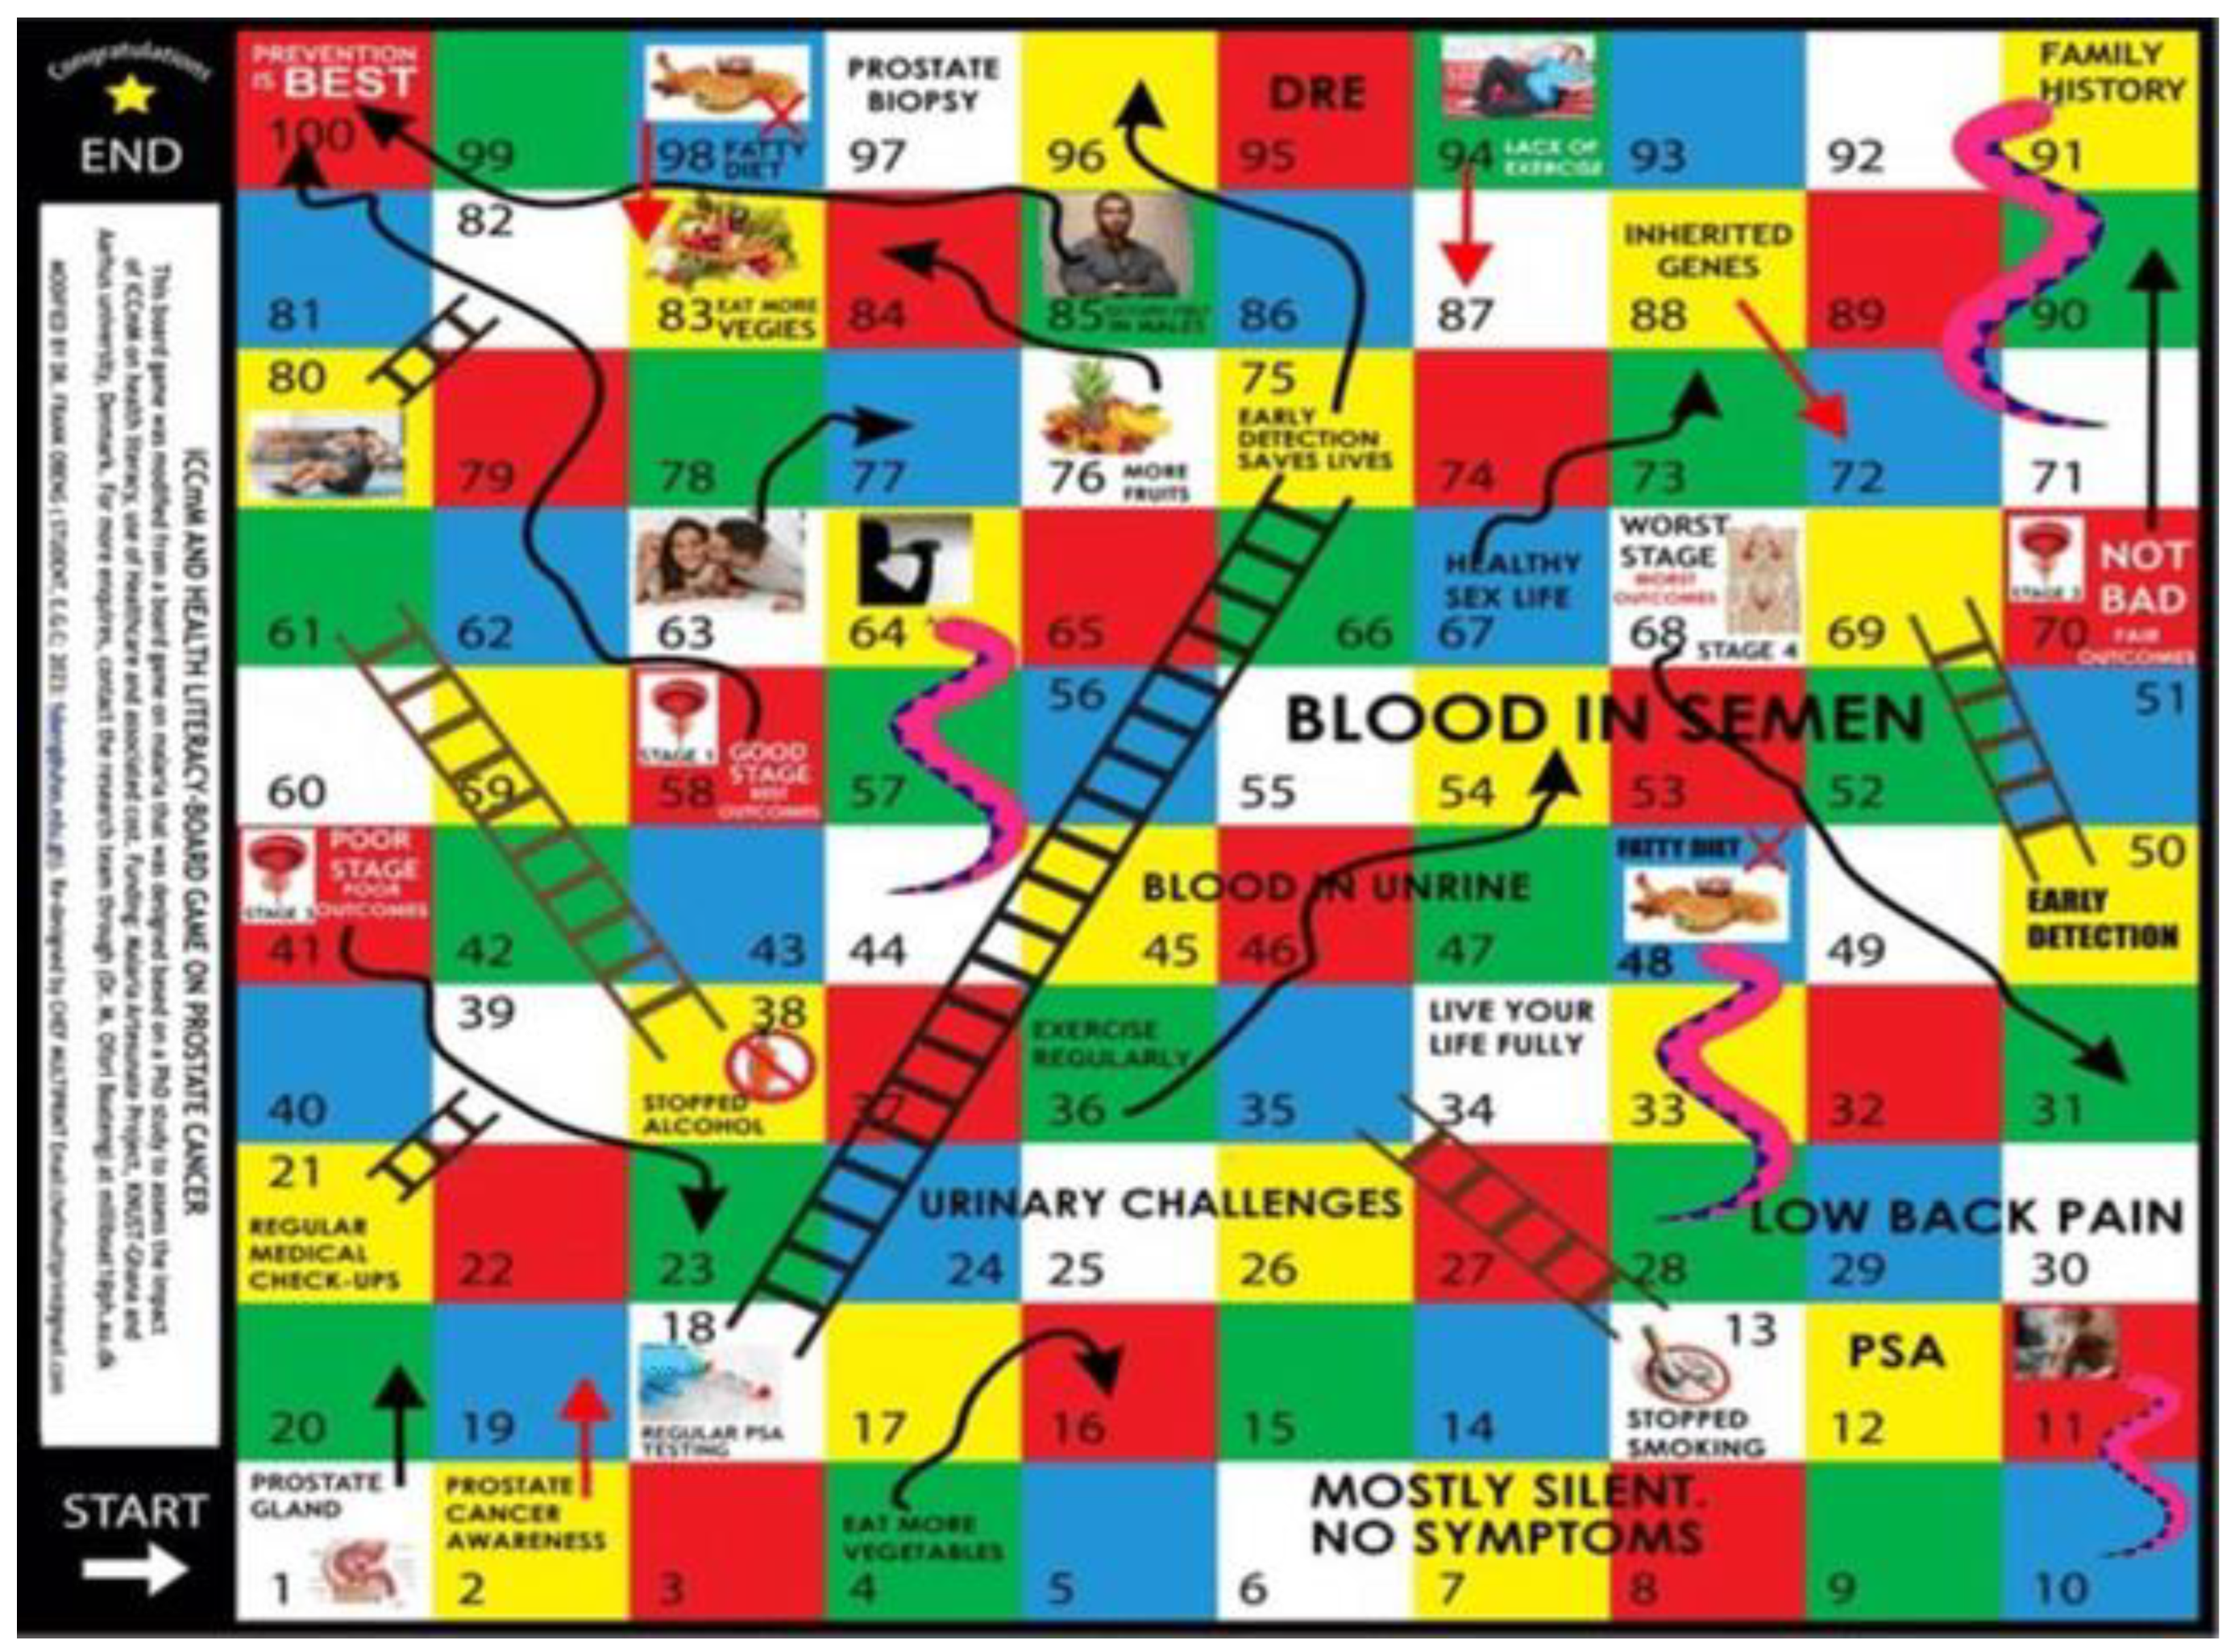
Intervention (Post-baseline): (1) Participants’ interaction with the Literacy Board Game (study arm). (2) Participants listened to a standardized PowerPoint Health Talk on Prostate Cancer (control Arm). Assignment of participants to the respective arm was determined by systematic random sampling of the baseline participants into two groups, and the toss of a dice to determine which group experiences which intervention. After editing and validating the filled post-test questionnaires and accounting for attrition (which unfortunately was quite extreme in the post-intervention phase of the study (28.4%), the LIBOG arm had 80 participants, whilst the HT arm had 61 participants.
Post-Intervention Summary of Knowledge, Attitude, and Perception Towards Prostate Cancer After playing/interacting with the LIBOG: Following the LIBOG game intervention (Figure 5), a comprehensive analysis was conducted across multiple demographic and behavioral variables to assess the KAP changes. The new associations/relationships between the sociodemographic/ lifestyle factors and knowledge, attitude, and perception (KAP) regarding prostate cancer screening were also studied.

Chi-Square Analysis Post-LIBOG: Gender and Knowledge, Attitude, and Perception

Among females, 43.14% had poor knowledge, 1.96% had moderate knowledge, and 54.9% had good knowledge. Among males, 20.69% had poor knowledge, 3.45% moderate, and 75.86% had good knowledge. Although males appeared to show a higher proportion of good knowledge, this difference remained statistically non-significant (χ²(2) = 4.12, p = 0.127). At baseline, there was statistical significance in this aspect. This suggested a bridge in knowledge level disparities after the intervention.
Attitude still showed a statistically significant difference (χ²(2) = 9.81, p = 0.007). 49.02% of females had a negative attitude, 19.61% neutral, and 31.37% positive attitude, whereas 16.67% of males had a negative attitude, 20.00% neutral, and 63.33% positive attitude.
Perception was no longer significantly associated with gender (χ²(2) = 3.56, p = 0.168). 45.10% of females had a negative perception, 1.96% neutral, and 52.94% positive perception. For males, 26.67% had a negative perception, none were neutral, and 73.33% had positive perception.

Education Level and Knowledge, Attitude, and Perception

Among postgraduates, 77.78% had poor knowledge, 0.00% moderate, and 22.22% good knowledge. Among primary school participants, 25% had poor knowledge, none were moderate, and 75% had good knowledge. The highest ‘good knowledge level’ was seen in primary school respondents. The association has now become statistically non-significant (χ²(6) = 8.51, p = 0.203) post-intervention.
Attitudes no longer showed significant differences (χ²(6) = 5.38, p = 0.496). Positive attitudes were most common among postgraduates (22.22%) and secondary school respondents (25.00%). Neutral attitudes remained unchanged, while negative attitudes ranged from 25% to 66.67%.
Perception after LIBOG intervention, also lacked significant association with education level (χ²(6) = 8.58, p = 0.199). The highest proportion of good perception (66.67%) was among tertiary and primary respondents. Neutral perceptions were very low or absent across all education levels.

Ethnicity and Knowledge, Attitude, and Perception

Knowledge remained not significantly associated with ethnicity (χ²(10) = 6.99, p = 0.726). Good knowledge was highest among Ga (80.00%) and Guan (100.00%), and lowest among Northern Ghanaians (55.56%).
Attitude now shifted and showed no statistically significant variation (χ²(10) = 3.90, p = 0.952). Positive attitudes were most prominent among Ga (60.00%) and Guan (100.00%), post LIBOG.
Perception persisted in showing a significant association with ethnicity (χ²(10) = 27.96, p = 0.002). The highest proportion of good perception was among Guan (100%), Ga (60.00%), and Northern Ghanaians (55.56%). The lowest positive perception was among Ewes (34.15%), post LIBOG.
Residence and Knowledge, Attitude, and Perception associations also evened out:
Knowledge levels did not differ significantly across residence (χ²(4) = 3.05, p = 0.549). Rural residents had 72.73% good knowledge, suburban 38.46%, and urban 37.78%.
Attitude and perception were also not significantly associated with residence (Attitude: χ²(4) = 0.70, p = 0.952; Perception: χ²(4) = 1.72, p = 0.786). Positive attitudes and perceptions were slightly more prevalent among suburban and rural residents post LIBOG. The LIBOG changes are shown in
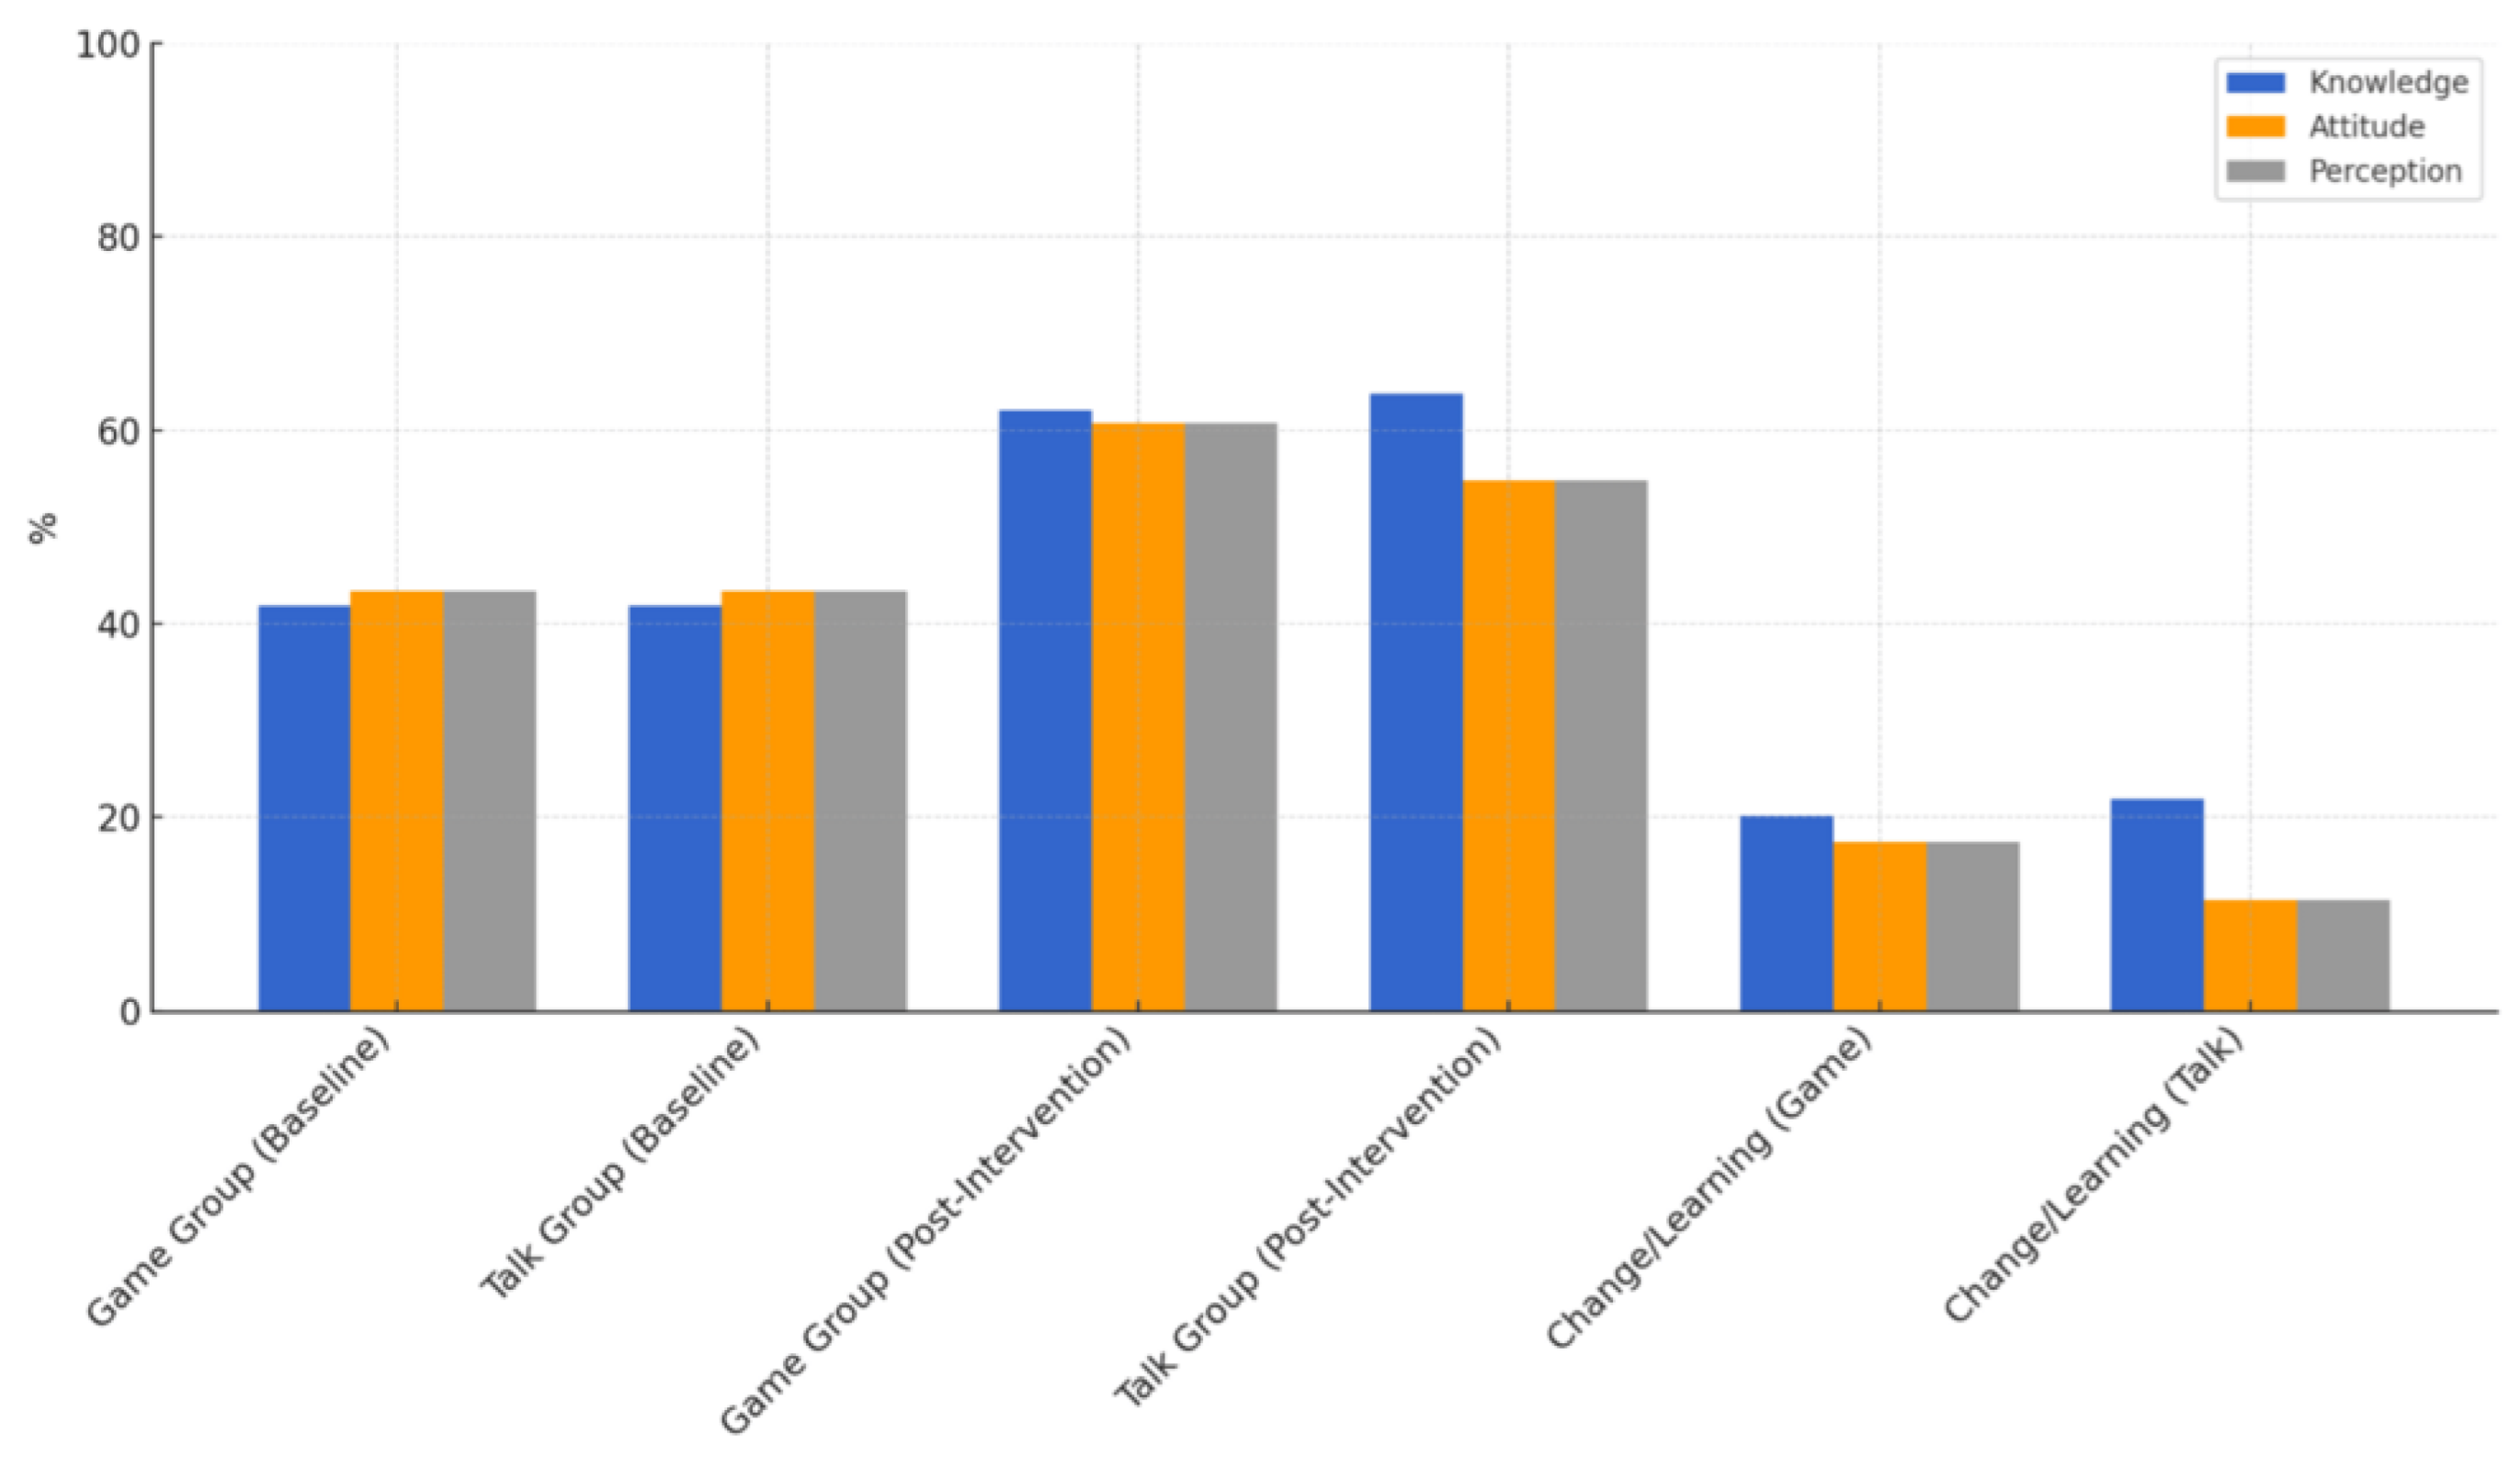
 Table 4 and Figure 6.
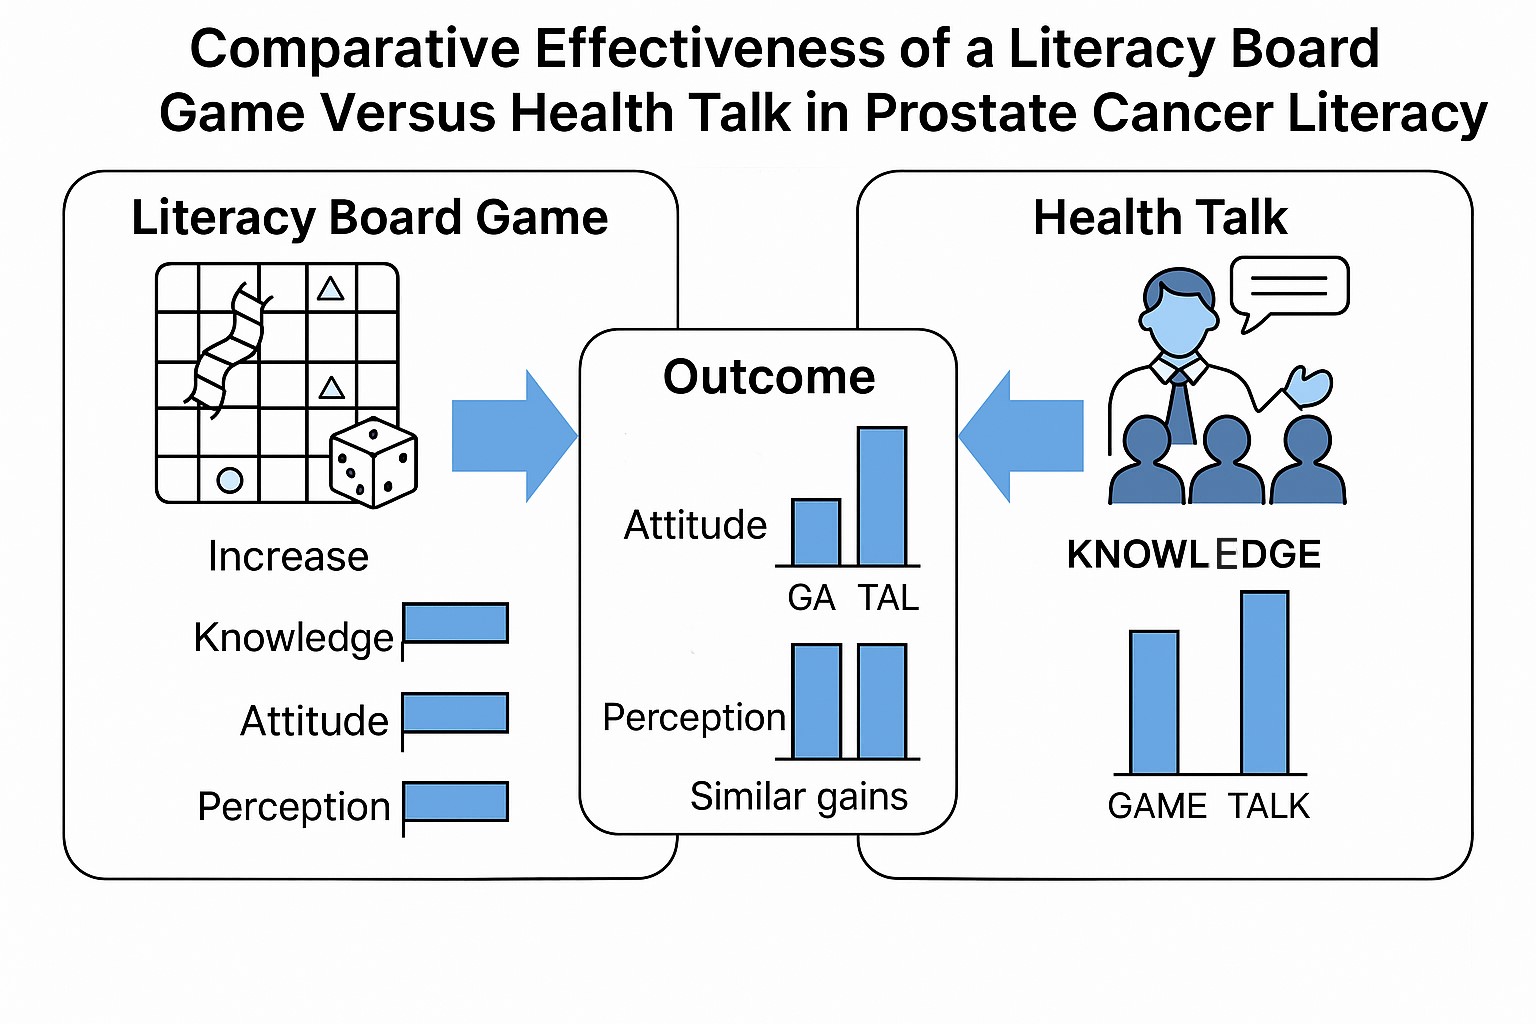
All values are expressed as percentages. The LIBOG group showed higher mean post-intervention scores in attitude and perception, and comparable gains in knowledge, while the health talk demonstrated slightly higher post-knowledge scores. The change bars (on the far right) illustrate the net gains from baseline, with the LIBOG game outperforming in affective domains (attitude and perception), indicating the potential effectiveness of interactive educational tools in shaping psychosocial learning outcomes.
Grid lines represent 10% increments to aid in visual comparison. All groupings reflect N = 80 for LIBOG, N = 61 for the Talk group, and N = 197 at baseline.

Family History of Prostate Cancer (FMH)

Knowledge became significantly associated with family history of prostate cancer (χ²(2) = 8.75, p = 0.013). 25% of those with family history had poor knowledge, 25% moderate, and 50% good knowledge, compared to 35.53% good knowledge among those without FMH.
Attitude was still not significantly associated (Attitude: χ²(2) = 1.07, p = 0.587; Perception however evened out after LIBOG: χ²(2) = 0.392, p = 0.822). 50% had a negative attitude and 25% a positive perception among those with FMH, compared to 38.96% positive perception in those without.
Family History of Breast Cancer (FHBca) attributes also evened out:
Knowledge (χ²(2) = 3.05, p = 0.217) and attitude (χ²(2) = 0.46, p = 0.793) were not statistically associated. However, perception was significantly associated (χ²(2) = 10.42, p = 0.005), with positive perception among those with FHBca at 77.78% compared to 42.25% among those without.
Family History of Ovarian Cancer (FHOca) attributes also evened out:
Knowledge remained highly significant (χ²(2) = 39.49, p = 0.000), with 100% good knowledge among the only positive case. Attitude and perception were not statistically significant, though 100% of those with FHOca had positive attitude and perception after the LIBOG intervention.

Family History of Bladder and Gastrointestinal (GIT) Cancer

Also, after the intervention, both bladder and GIT family history showed highly significant associations with knowledge (χ²(2) = 39.49 and 38.99 respectively, p < 0.001). Good knowledge among the positive case was 100%. Attitudes and perceptions did not differ significantly but shifted toward complete positivity.
After the LIBOG intervention, most of the Lifestyle Factors evened out, narrowing disparities:
Tobacco Use: No significant associations were observed (Knowledge: χ²(2) = 1.88, Attitude: χ²(2) = 1.33, Perception: χ²(2) = 0.66). The only current user had 100% good knowledge and positive attitude.
Alcohol Use: No significant associations. Good knowledge was highest among regular users (100%) and occasional drinkers (44.44%). Attitude showed 100% positivity in regular users.
Exercise Habits: Attitude approached significance but was not (χ²(6) = 11.34, p = 0.078). Positive attitude was most prominent in active exercisers (87.50%), while moderate exercisers had more negative views. Knowledge and perception showed no significant differences.
Diet Type: No significant associations were found, though higher good knowledge levels and positive attitudes were noted among vegetarians and those on fatty diets.
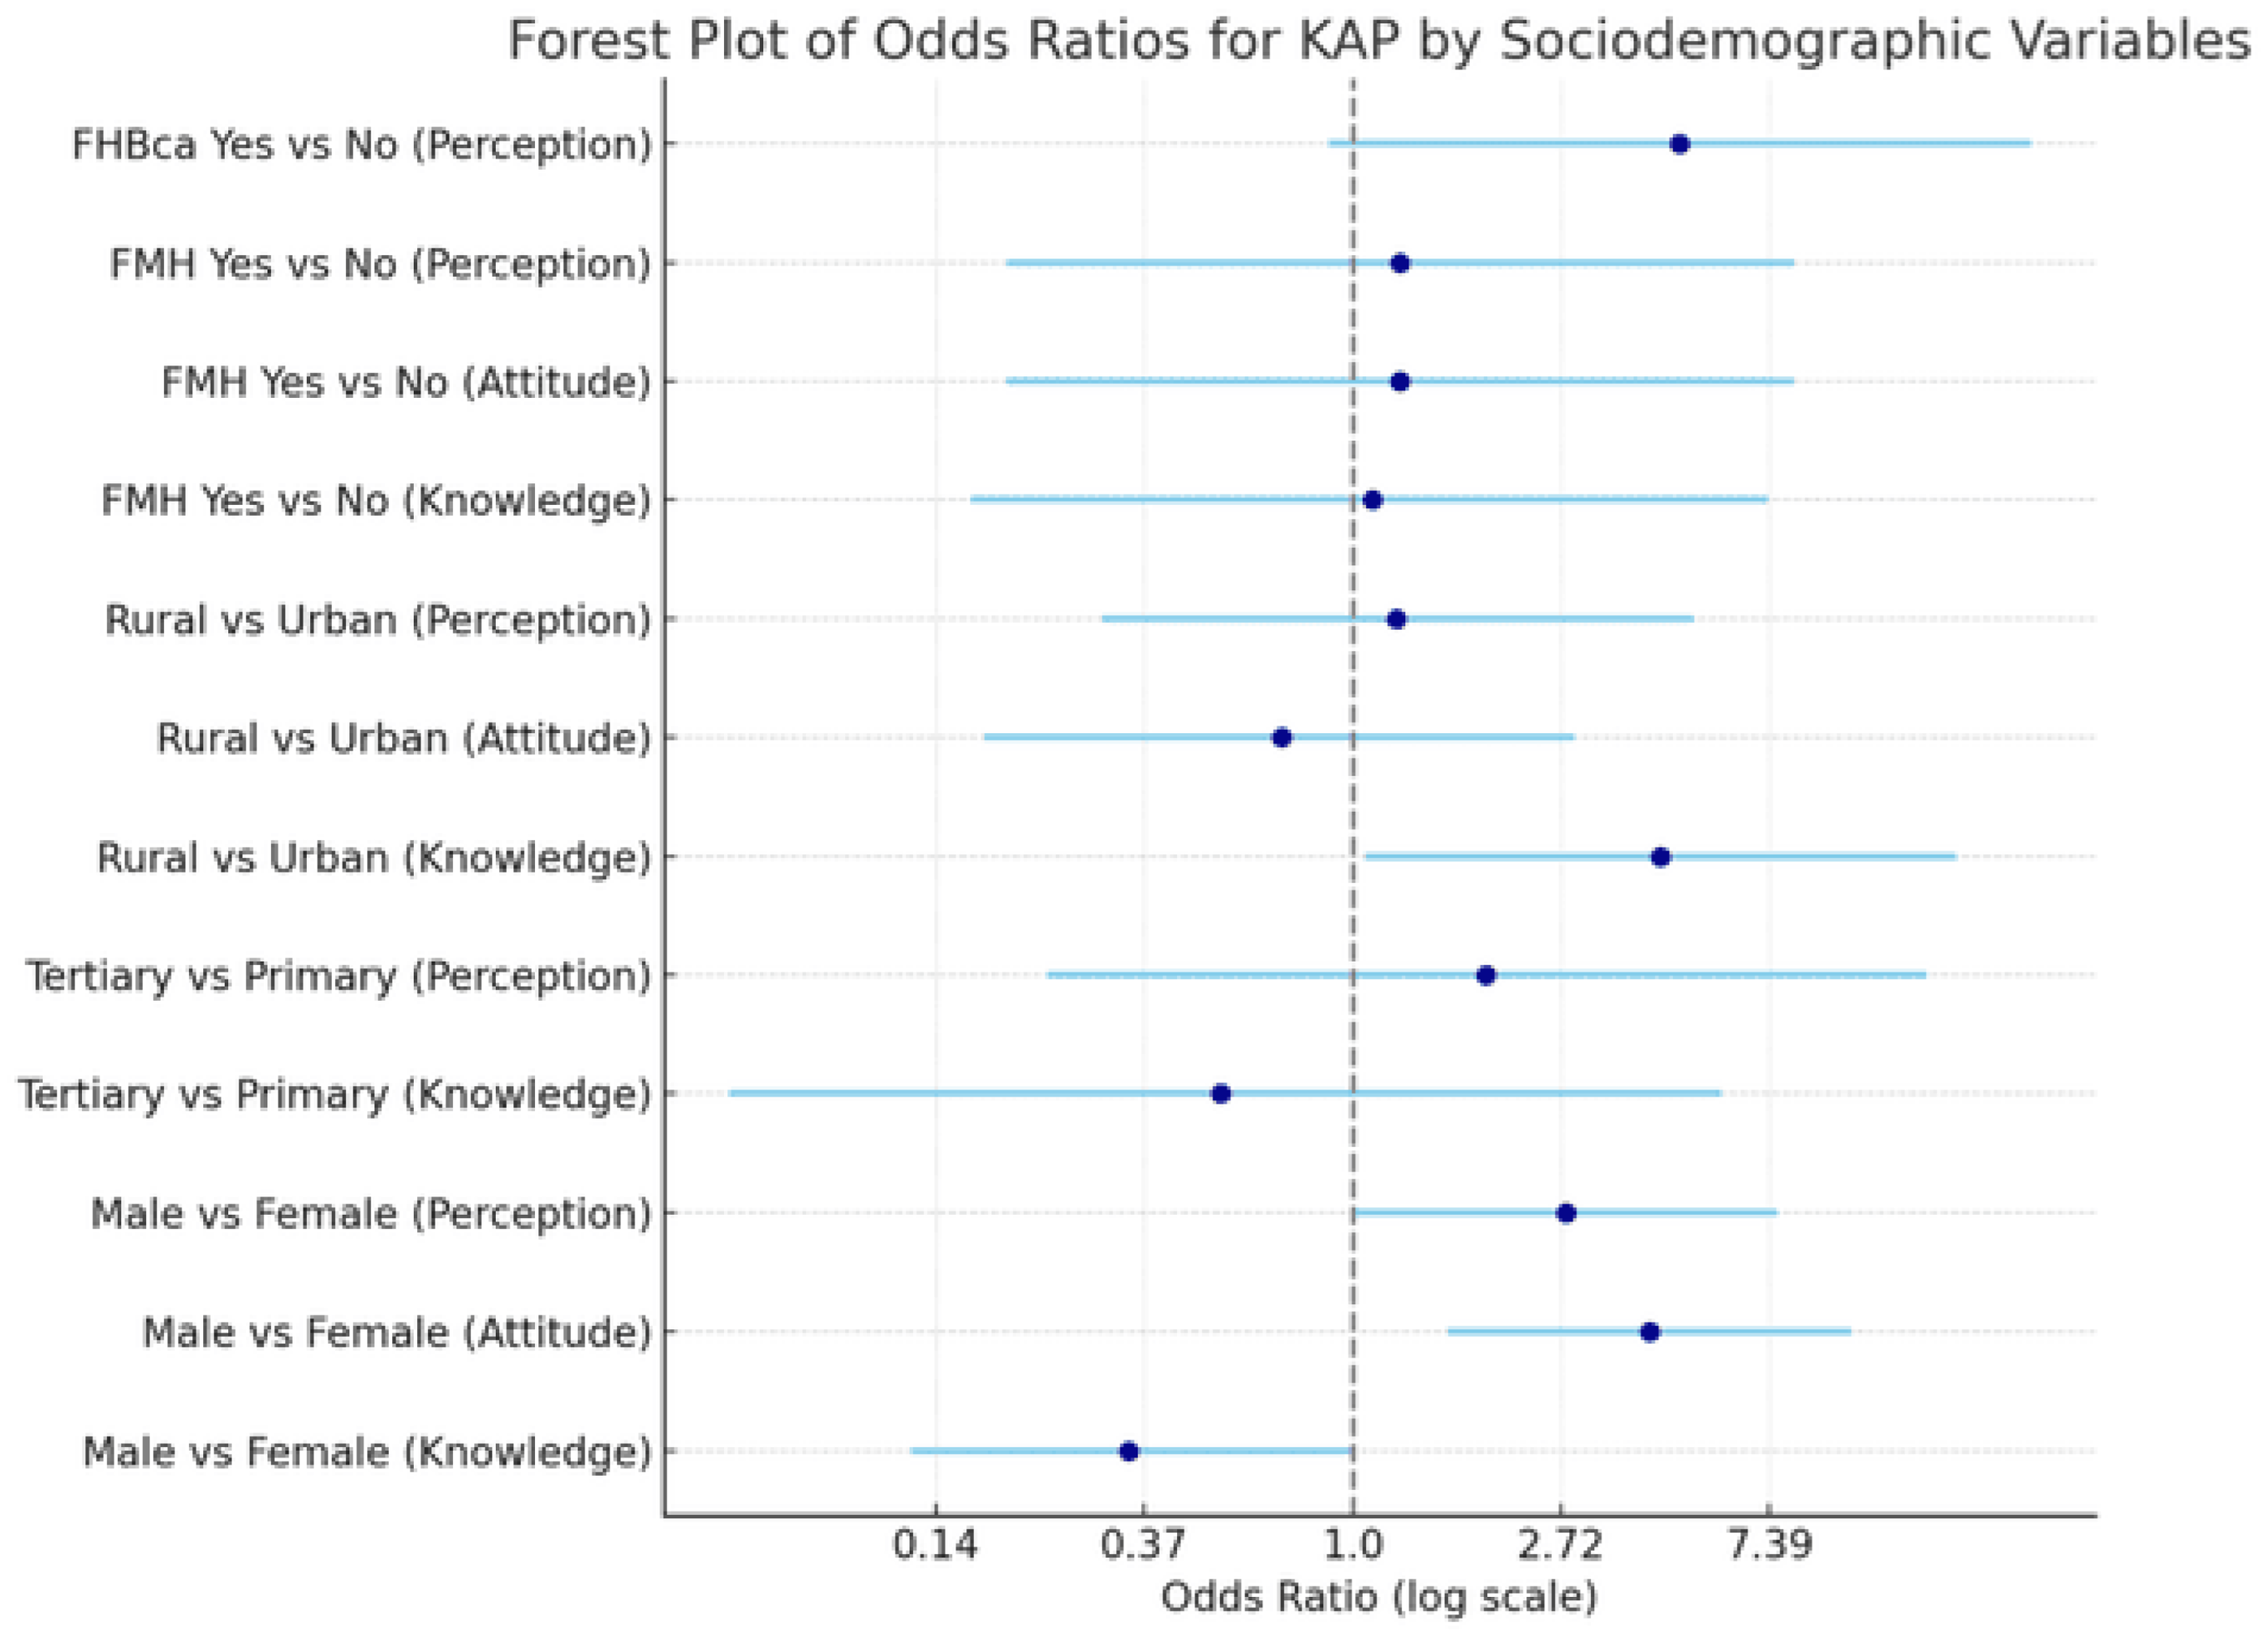
Regression analysis post-LIBOG: The valid odds ratios from the post-LIBOG game intervention show several statistically meaningful relationships between socio-demographic variables and the new knowledge, attitude, or perception (KAP) outcomes.
Males had significantly lower odds of demonstrating good knowledge compared to females, with an odds ratio of 0.34 (95% CI: 0.12-0.99, p = 0.047) after intervention with the LIBOG game. However, in contrast, males were significantly more likely to express a positive attitude than females, with an odds ratio of 4.16 (95% CI: 1.58-10.94, p = 0.004). Similarly, males also had significantly higher odds of having a positive perception than females, with an odds ratio of 2.79 (95% CI: 1.01-7.69, p = 0.047).
When educational background was examined, tertiary-educated participants had lower odds of good knowledge than those with only primary education (a finding that may also support a bridging of disparities by the intervention), though this difference was not statistically significant (OR = 0.53, 95% CI: 0.05-5.86, p = 0.607). Likewise, they were more likely to have a positive perception (OR = 1.89, 95% CI: 0.23-15.74, p = 0.557), though again not statistically significant.
In terms of residential setting, rural residents were more likely to demonstrate good knowledge compared to their urban counterparts, with an odds ratio of 4.39 (95% CI: 1.06-18.16, p = 0.041), a statistically significant finding. However, regarding attitude, rural residents were less likely to have a positive attitude than urban residents, with an odds ratio of 0.71 (95% CI: 0.17-2.89, p = 0.632), though this association was not statistically significant. Similarly, rural residents had slightly higher odds of a positive perception compared to urban dwellers, but the difference was not significant (OR = 1.23, 95% CI: 0.30-5.13, p = 0.776).
For family history of prostate cancer (FMH), participants with a positive family history had slightly higher odds of demonstrating good knowledge than those without (OR = 1.10, 95% CI: 0.16-7.34, p = 0.920), but the difference was not statistically significant. The same trend was seen for attitude (OR = 1.25, 95% CI: 0.19-8.33, p = 0.813) and perception (OR = 1.25, 95% CI: 0.19-8.33, p = 0.813), both showing no significant association between FMH and post-intervention improvements.
When examining family history of breast cancer (FHBca), participants with a positive history were more likely to demonstrate a positive perception, with an odds ratio of 4.80 (95% CI: 0.89-25.88), though the association approached but did not reach statistical significance (p = 0.068). This suggests a potential trend where family history of related cancers may influence perception positively after educational intervention.
Overall, the LIBOG game intervention appeared to reduce gender disparities in knowledge and significantly improve attitudes and perceptions among males. Residence and family cancer history showed varying degrees of influence, though only a few associations reached statistical significance. These findings highlight the importance of tailoring interventions to account for baseline demographic differences while demonstrating the utility of game-based education in enhancing prostate cancer screening awareness, and allied attributes, Figure 6, Figure 7 and Table 4.
Knowledge, Attitude and Perception After listening to the PowerPoint health talk(HT) on prostate cancer (Post-test results).
Chi-Square Analysis post-HT:
Gender and Knowledge, Attitude, and Perception (Post-HT intervention): After the educational talk, both female and male participants demonstrated high levels of knowledge regarding prostate cancer. Among females, 62.22% had good knowledge, 2.22% moderate, and 35.56% poor. Similarly, 62.50% of males had good knowledge and 37.50% poor, with none reporting moderate knowledge. The distribution was nearly identical between sexes, and this was confirmed by a non-significant association (χ²(2) = 0.3681, p = 0.832). Table 4 depicts the post-HT percentage changes in the KAP moieties as well.
Concerning attitude, females appeared to show stronger positivity, with 57.78% having a positive attitude compared to 43.75% of males. Negative attitudes were more prevalent in males (50%) than in females (26.67%). Despite these differences, the association between gender and attitude was not statistically significant (χ²(2) = 3.1687, p = 0.205).
Perceptions were also favorable across both genders. Positive perception was slightly higher in females (64.44%) than in males (62.50%), and the gender difference was not statistically significant (χ²(2) = 0.6066, p = 0.738). Considering the fact that the pre-interventional associations were significant, it means that the intervention had bridged the pre-exiting disparities in this aspect.

Education and Knowledge, Attitude, and Perception Post-HT

Participants with higher education levels exhibited generally better knowledge. Among those with postgraduate education, 100% had good knowledge. For tertiary-educated participants, 61.54% had good knowledge, and 36.54% had poor knowledge. The association between education and knowledge was not statistically significant (χ²(6) = 3.2371, p = 0.779). So, the talk intervention had evened out the initial disparities.
Attitudes were also largely positive across all education levels. Notably, 100% of participants with only primary education expressed a positive attitude. Tertiary-educated participants showed a balance, with 50% expressing positive attitudes, 15.38% neutral, and 34.62% negative. There was no statistically significant association (χ²(6) = 3.0481, p = 0.803). Meaning HT levelled up attitudes as well, from the baseline.
However, perception was still significantly associated with education level (χ²(6) = 13.5617, p = 0.035). All postgraduates had positive or neutral perceptions, while those with primary education had exclusively negative perceptions. The majority of tertiary-level participants (65.38%) held positive perceptions.
Ethnicity and Knowledge, Attitude, and Perception post-HT showed an evening out in the attitude and perception moieties.
Ewe participants exhibited the highest level of good knowledge (73.33%), followed by the Ga (66.67%) and Northern Ghanaian (60.00%) groups. Akan participants had a lower good knowledge rate (37.50%), and the overall association between ethnicity and knowledge remained not statistically significant (χ²(8) = 8.7651, p = 0.362).
Attitude and perception(unlike at baseline) did not differ significantly across ethnic groups (Attitude: χ²(8) = 2.5270, p = 0.960; Perception: χ²(8) = 2.1933, p = 0.975). Most groups reported a high proportion of positive attitudes and perceptions, especially among Ewe and Northern Ghanaian participants.
Residence and Knowledge, Attitude, and Perception post-HT, showed a levelling out in all the KAP components post-intervention.
Knowledge was high across all residence categories, with rural participants showing 65% good knowledge, followed by urban (59.26%) and suburban (58.33%). Unlike at baseline, no significant difference was observed (χ²(4) = 2.4627, p = 0.651).
Attitudes were most positive among suburban dwellers (66.67%), followed by urban (55.56%) and rural (40.00%) participants, although not statistically significant (χ²(4) = 4.3929, p = 0.355) unlike at baseline. Similarly, perception was highest in the suburban group (75.00%), followed by urban (62.96%) and rural (55.00%), with no significant association observed (χ²(4) = 1.5490, p = 0.818) unlike at baseline.
Family History of Prostate Cancer (FMH) post-HT showed mixed results.
There was still no significant association between FMH and knowledge (χ²(2) = 0.0679, p = 0.967), with 66.67% of those with FMH and 62.07% of those without FMH reporting good knowledge.
However, attitude and perception were significantly associated with PCa FMH. Among those with FMH, only 33.33% had a positive attitude compared to 55.17% of those without (χ²(2) = 8.1854, p = 0.017) similar to baseline. Additionally, 66.67% of those with FMH had a positive perception, compared to 63.79% of those without FMH (χ²(2) = 9.7307, p = 0.008), suggesting greater disparities in perception post-talk among participants with PCa FMH.
Lifestyle Factors (Tobacco, Alcohol, Exercise, and Diet) post-HT all experienced an evening out, suggesting a bridge in disparities by the HT across the various groups studied.
Tobacco use did not show any statistically significant relationship (unlike at baseline) with knowledge (χ²(2) = 0.6154, p = 0.735), attitude (χ²(2) = 0.8626, p = 0.650), or perception (χ²(2) = 2.0842, p = 0.353). Former users and never-users had comparable proportions of positive views.
Alcohol use also showed no significant association with knowledge (χ²(2) = 2.3787, p = 0.304), attitude (χ²(2) = 0.7925, p = 0.673), or perception (χ²(2) = 3.7983, p = 0.150) unlike at baseline. However, those who never drank were slightly more likely to exhibit good knowledge and positive perceptions.
Unlike at baseline, Exercise frequency was not significantly associated with any of the three outcome measures (Knowledge: χ²(6) = 3.6731, p = 0.721; Attitude: χ²(6) = 8.3929, p = 0.211; Perception: χ²(6) = 3.8248, p = 0.700). Positive attitudes were most common among participants engaging in light exercise (72.73%).
Diet type also showed no significant associations (Knowledge: χ²(4) = 0.2549, p = 0.993; Attitude: χ²(4) = 2.4807, p = 0.648; Perception: χ²(4) = 0.4167, p = 0.981) unlike at baseline, though vegetarians had consistently higher levels of good knowledge and positive attitudes.
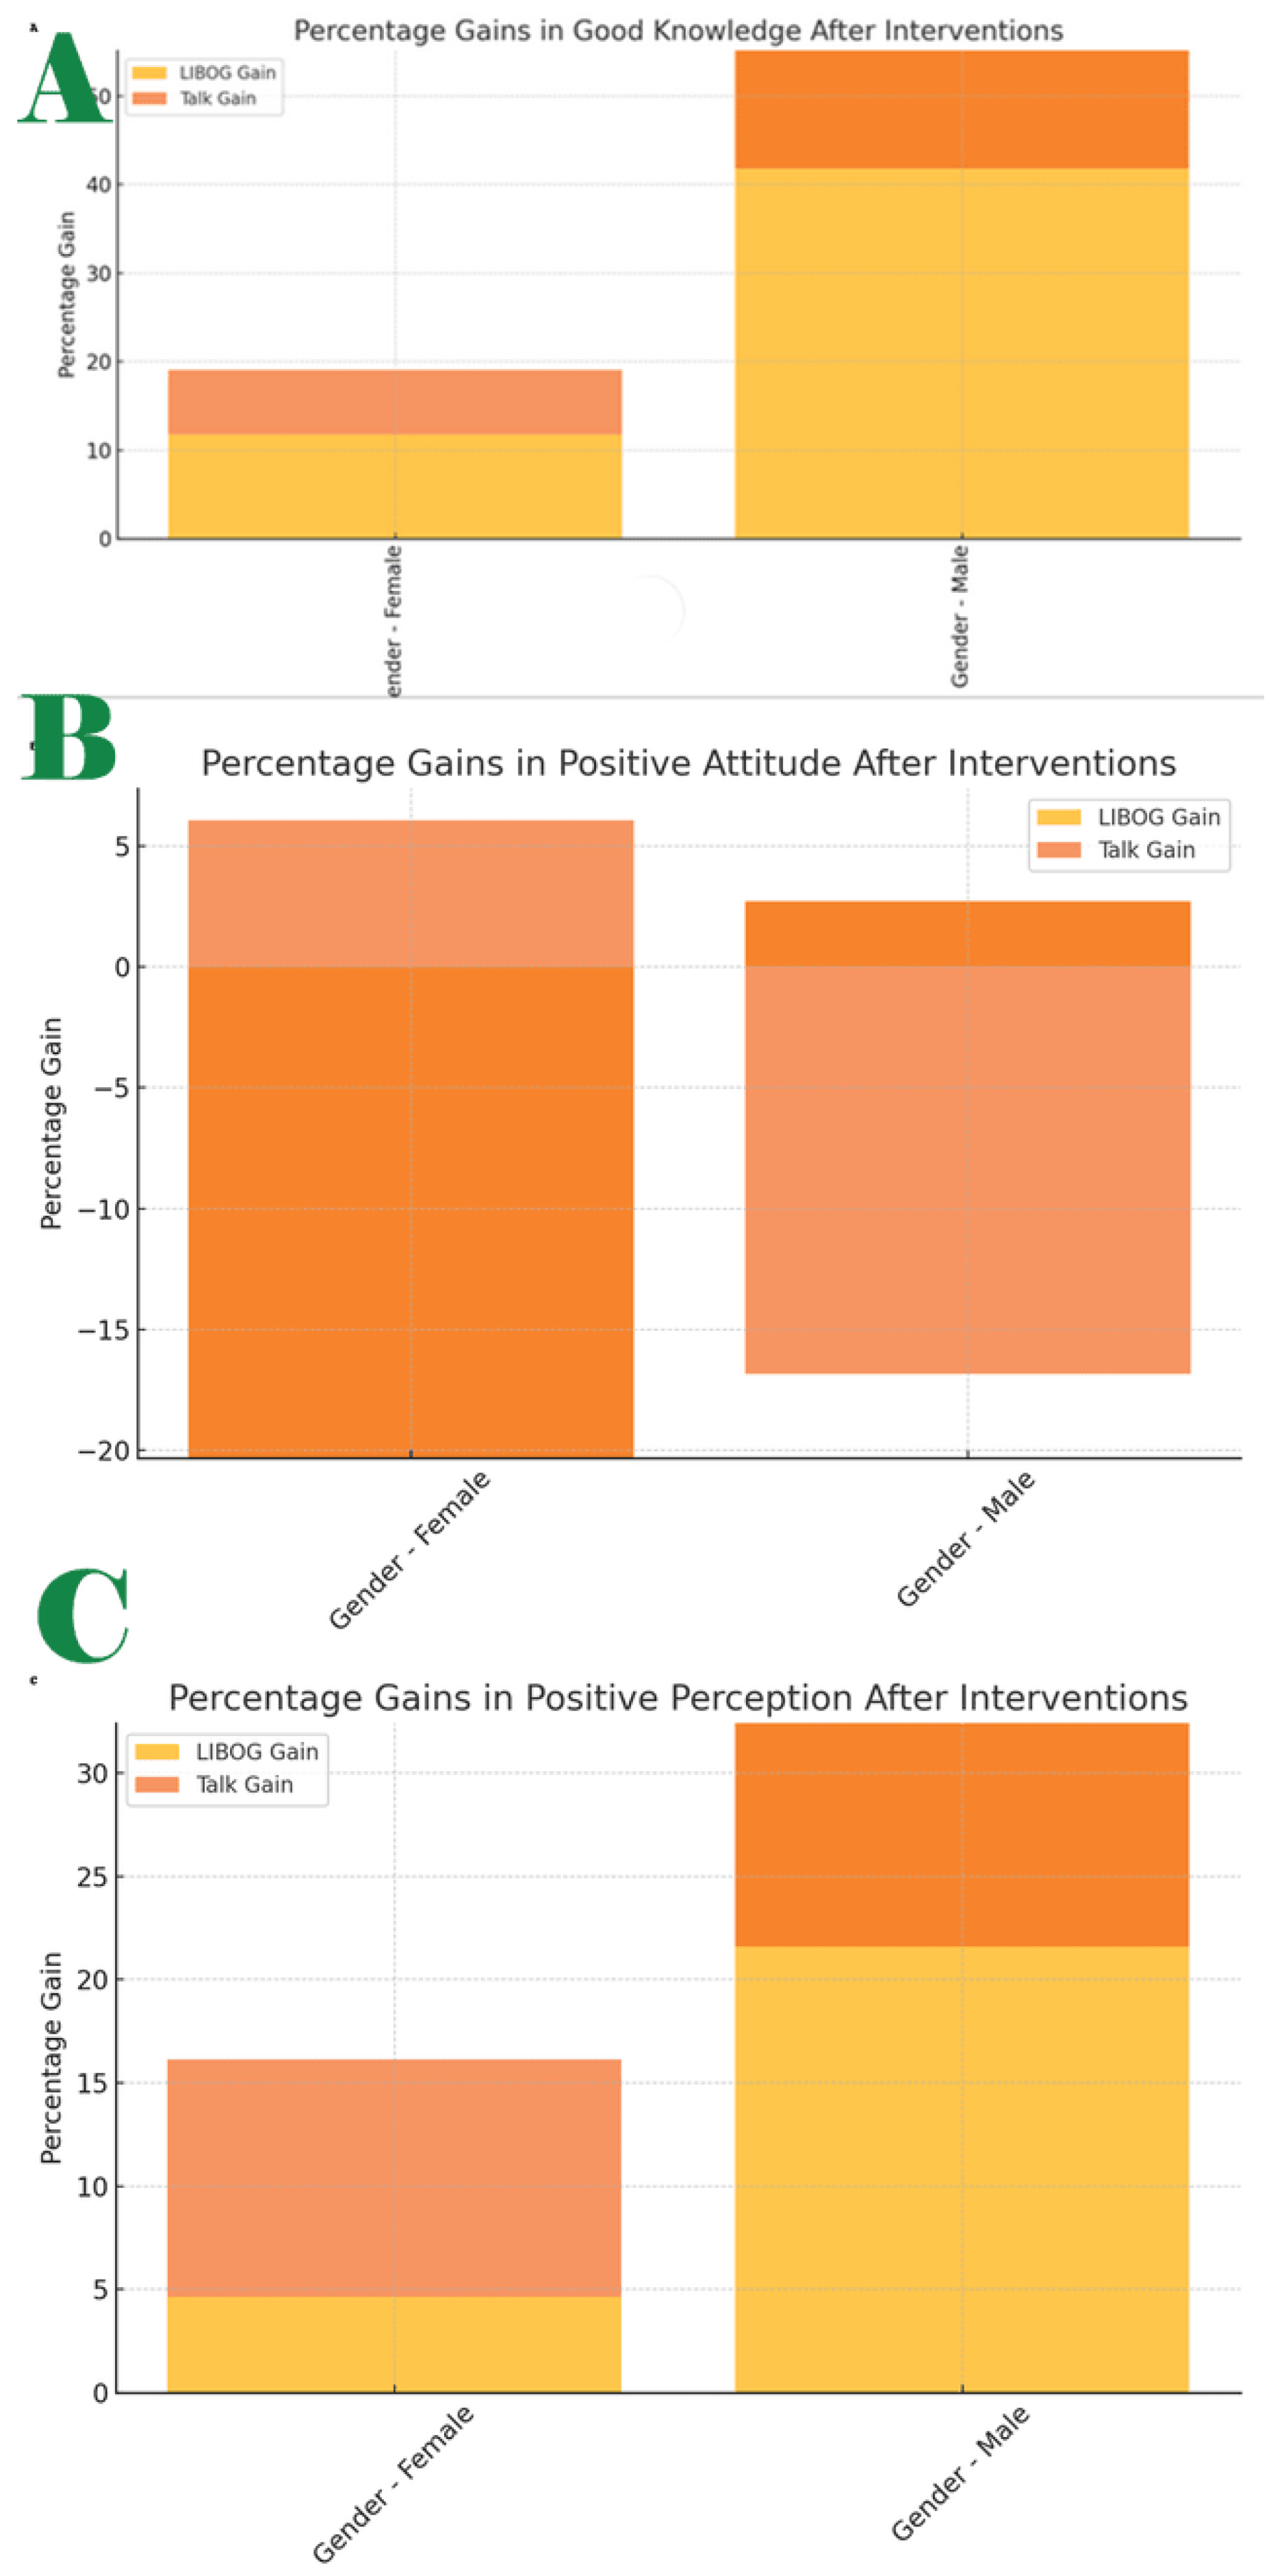
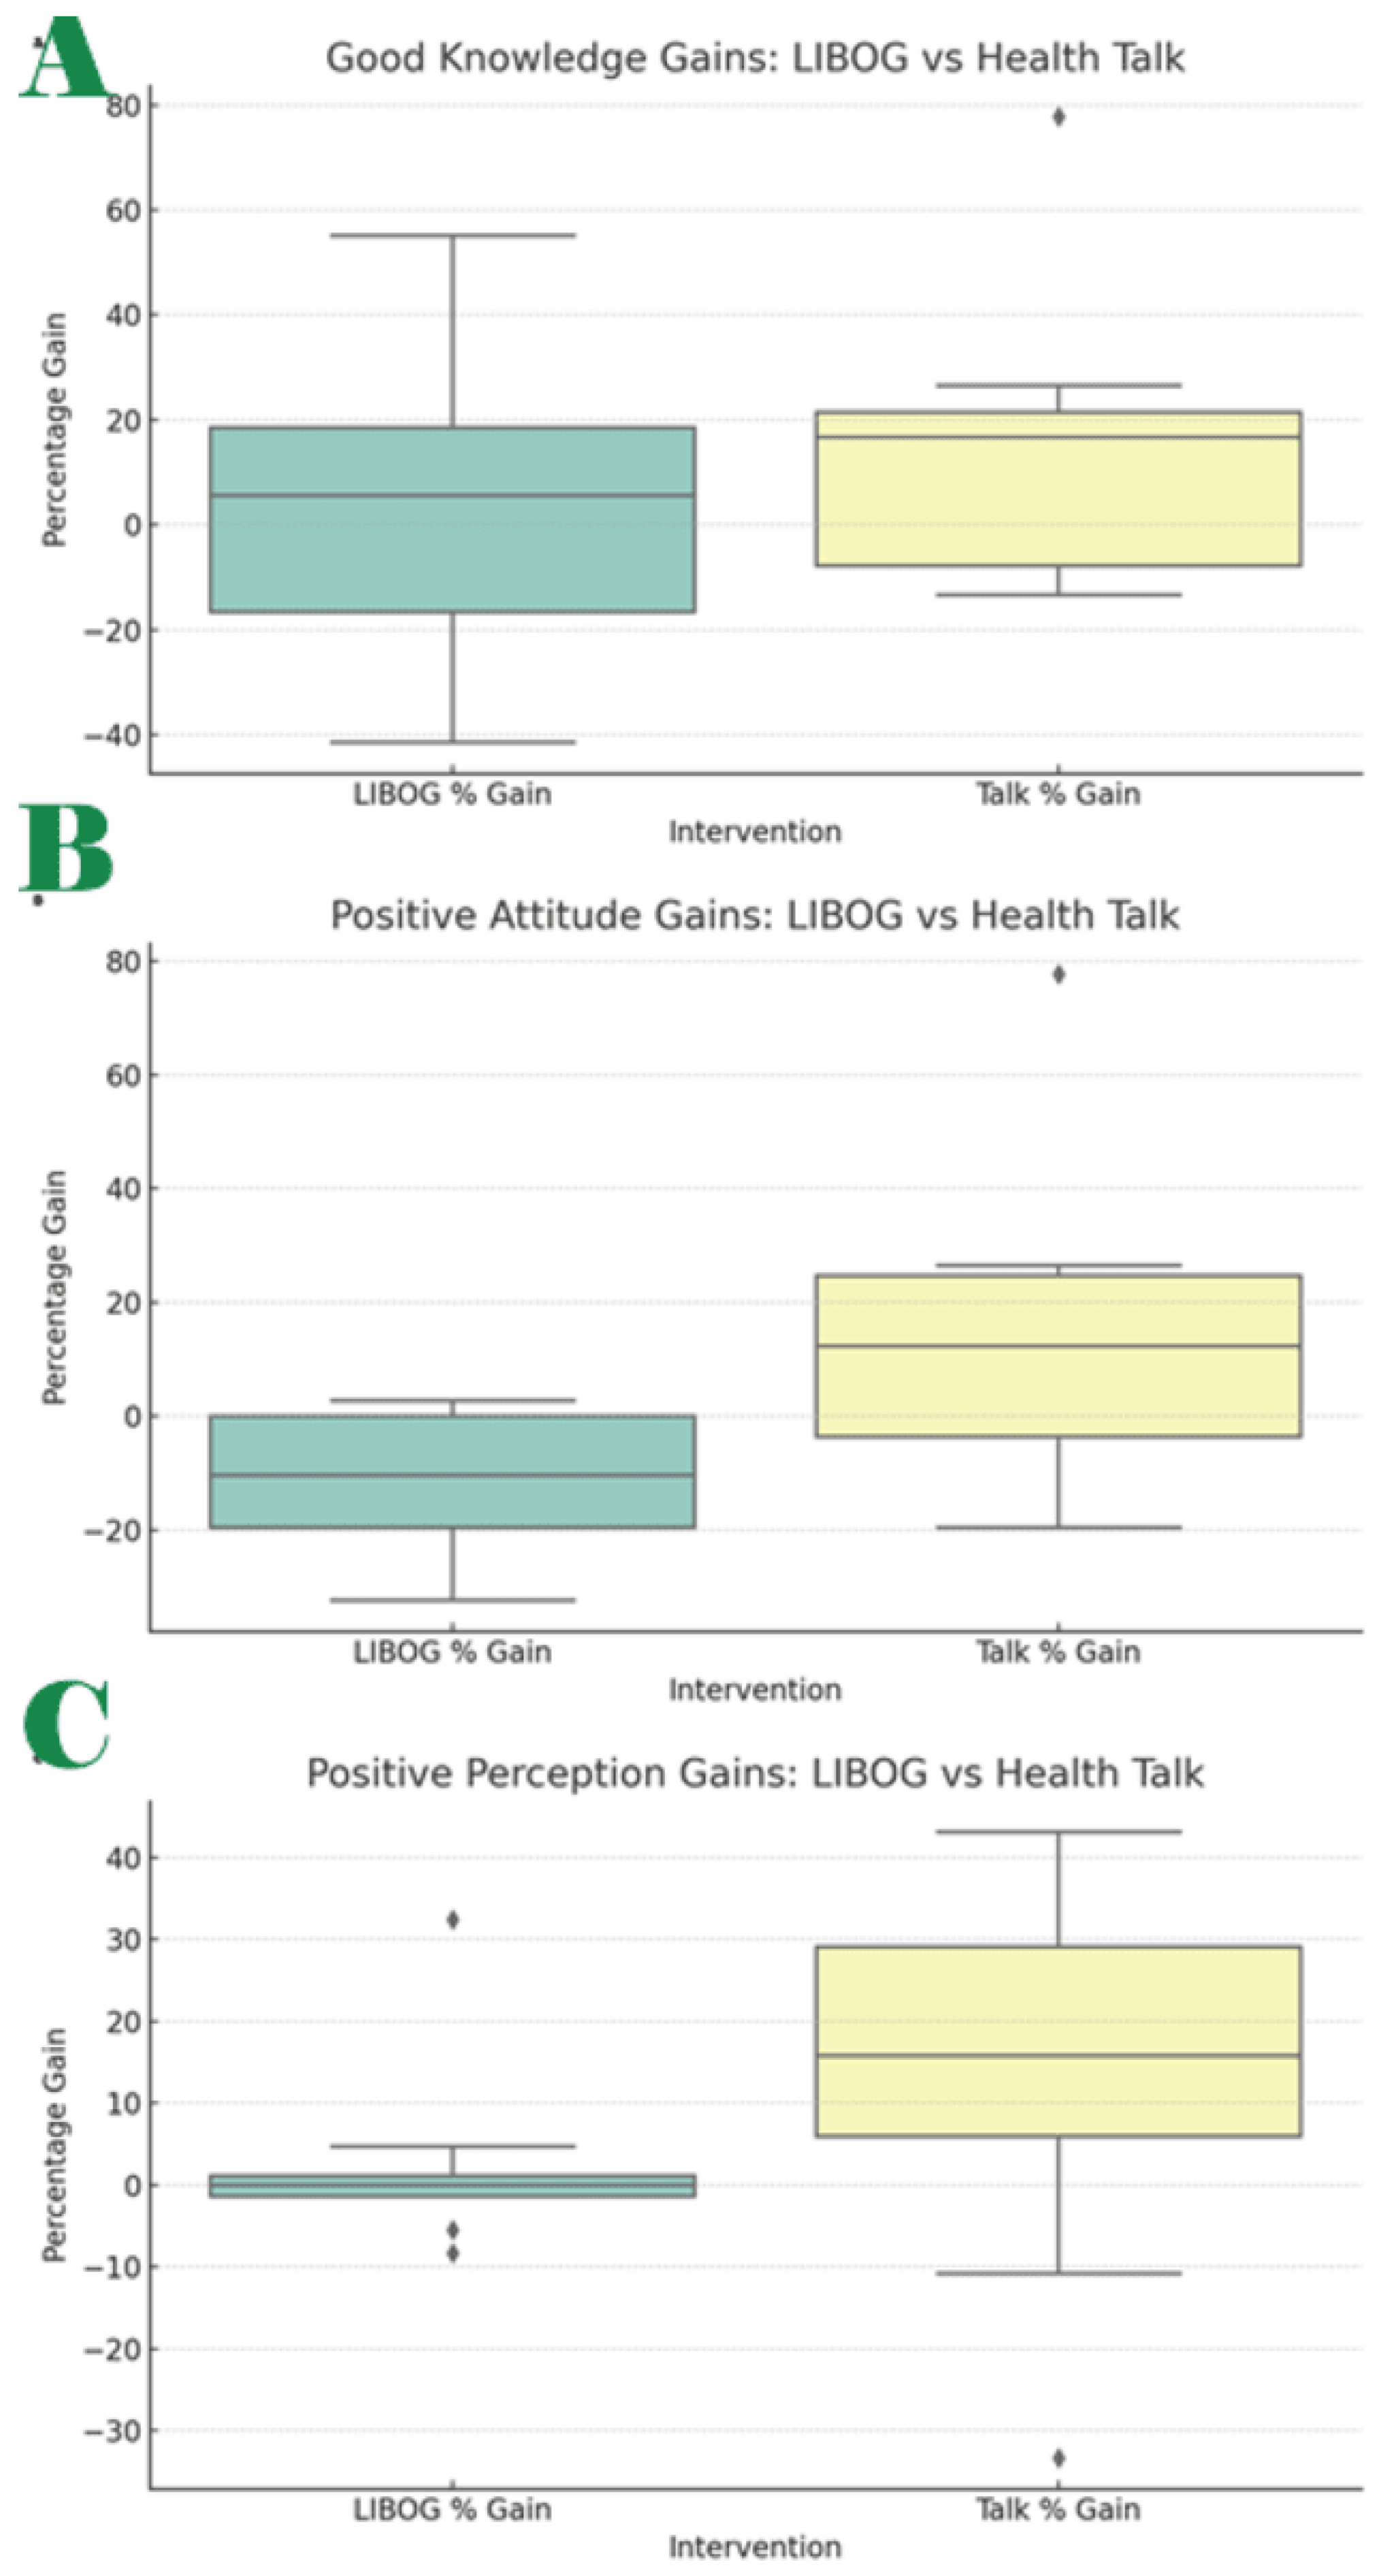
 Figure 8 A to C and Figure 9 showcase some of these post-interventional shifts.
Regression analysis post-HT: Following the prostate cancer health talk (intervention 2), several odds ratio analyses were conducted to examine relationships between key demographic and familial variables and the likelihood of demonstrating good knowledge, a positive attitude, or a positive perception post-HT.
In terms of knowledge, the odds of having good knowledge among males were virtually identical to those among females, with an odds ratio of 1.01 (95% CI: 0.36 to 2.81, p = 0.982). This indicates no significant gender-based difference in knowledge acquisition, and a levelling up after the intervention.
When examining attitude, males were less likely than females to have a positive attitude, with an odds ratio of 0.52 (95% CI: 0.19 to 1.42, p = 0.204). However, this difference was not statistically significant. Similarly, the odds of having a positive perception were slightly lower among males compared to females, with an odds ratio of 0.92 (95% CI: 0.33 to 2.57, p = 0.873), again showing no significant difference (bridged disparities after HT exposure).
Turning to family history of prostate cancer, participants with such a history had lower odds of expressing a positive attitude than those without, with an odds ratio of 0.41 (95% CI: 0.11 to 1.50, p = 0.177). While suggestive of a trend, this finding did not reach statistical significance. For perception, individuals with a family history of prostate cancer had marginally higher odds of expressing a positive perception compared to those without such history, with an odds ratio of 1.22 (95% CI: 0.33 to 4.54, p = 0.764), but this too was not statistically significant.
Overall, these results suggest that the educational intervention had a broadly equalizing effect across gender and family history subgroups, with no significant disparities observed in knowledge, attitude, or perception outcomes.
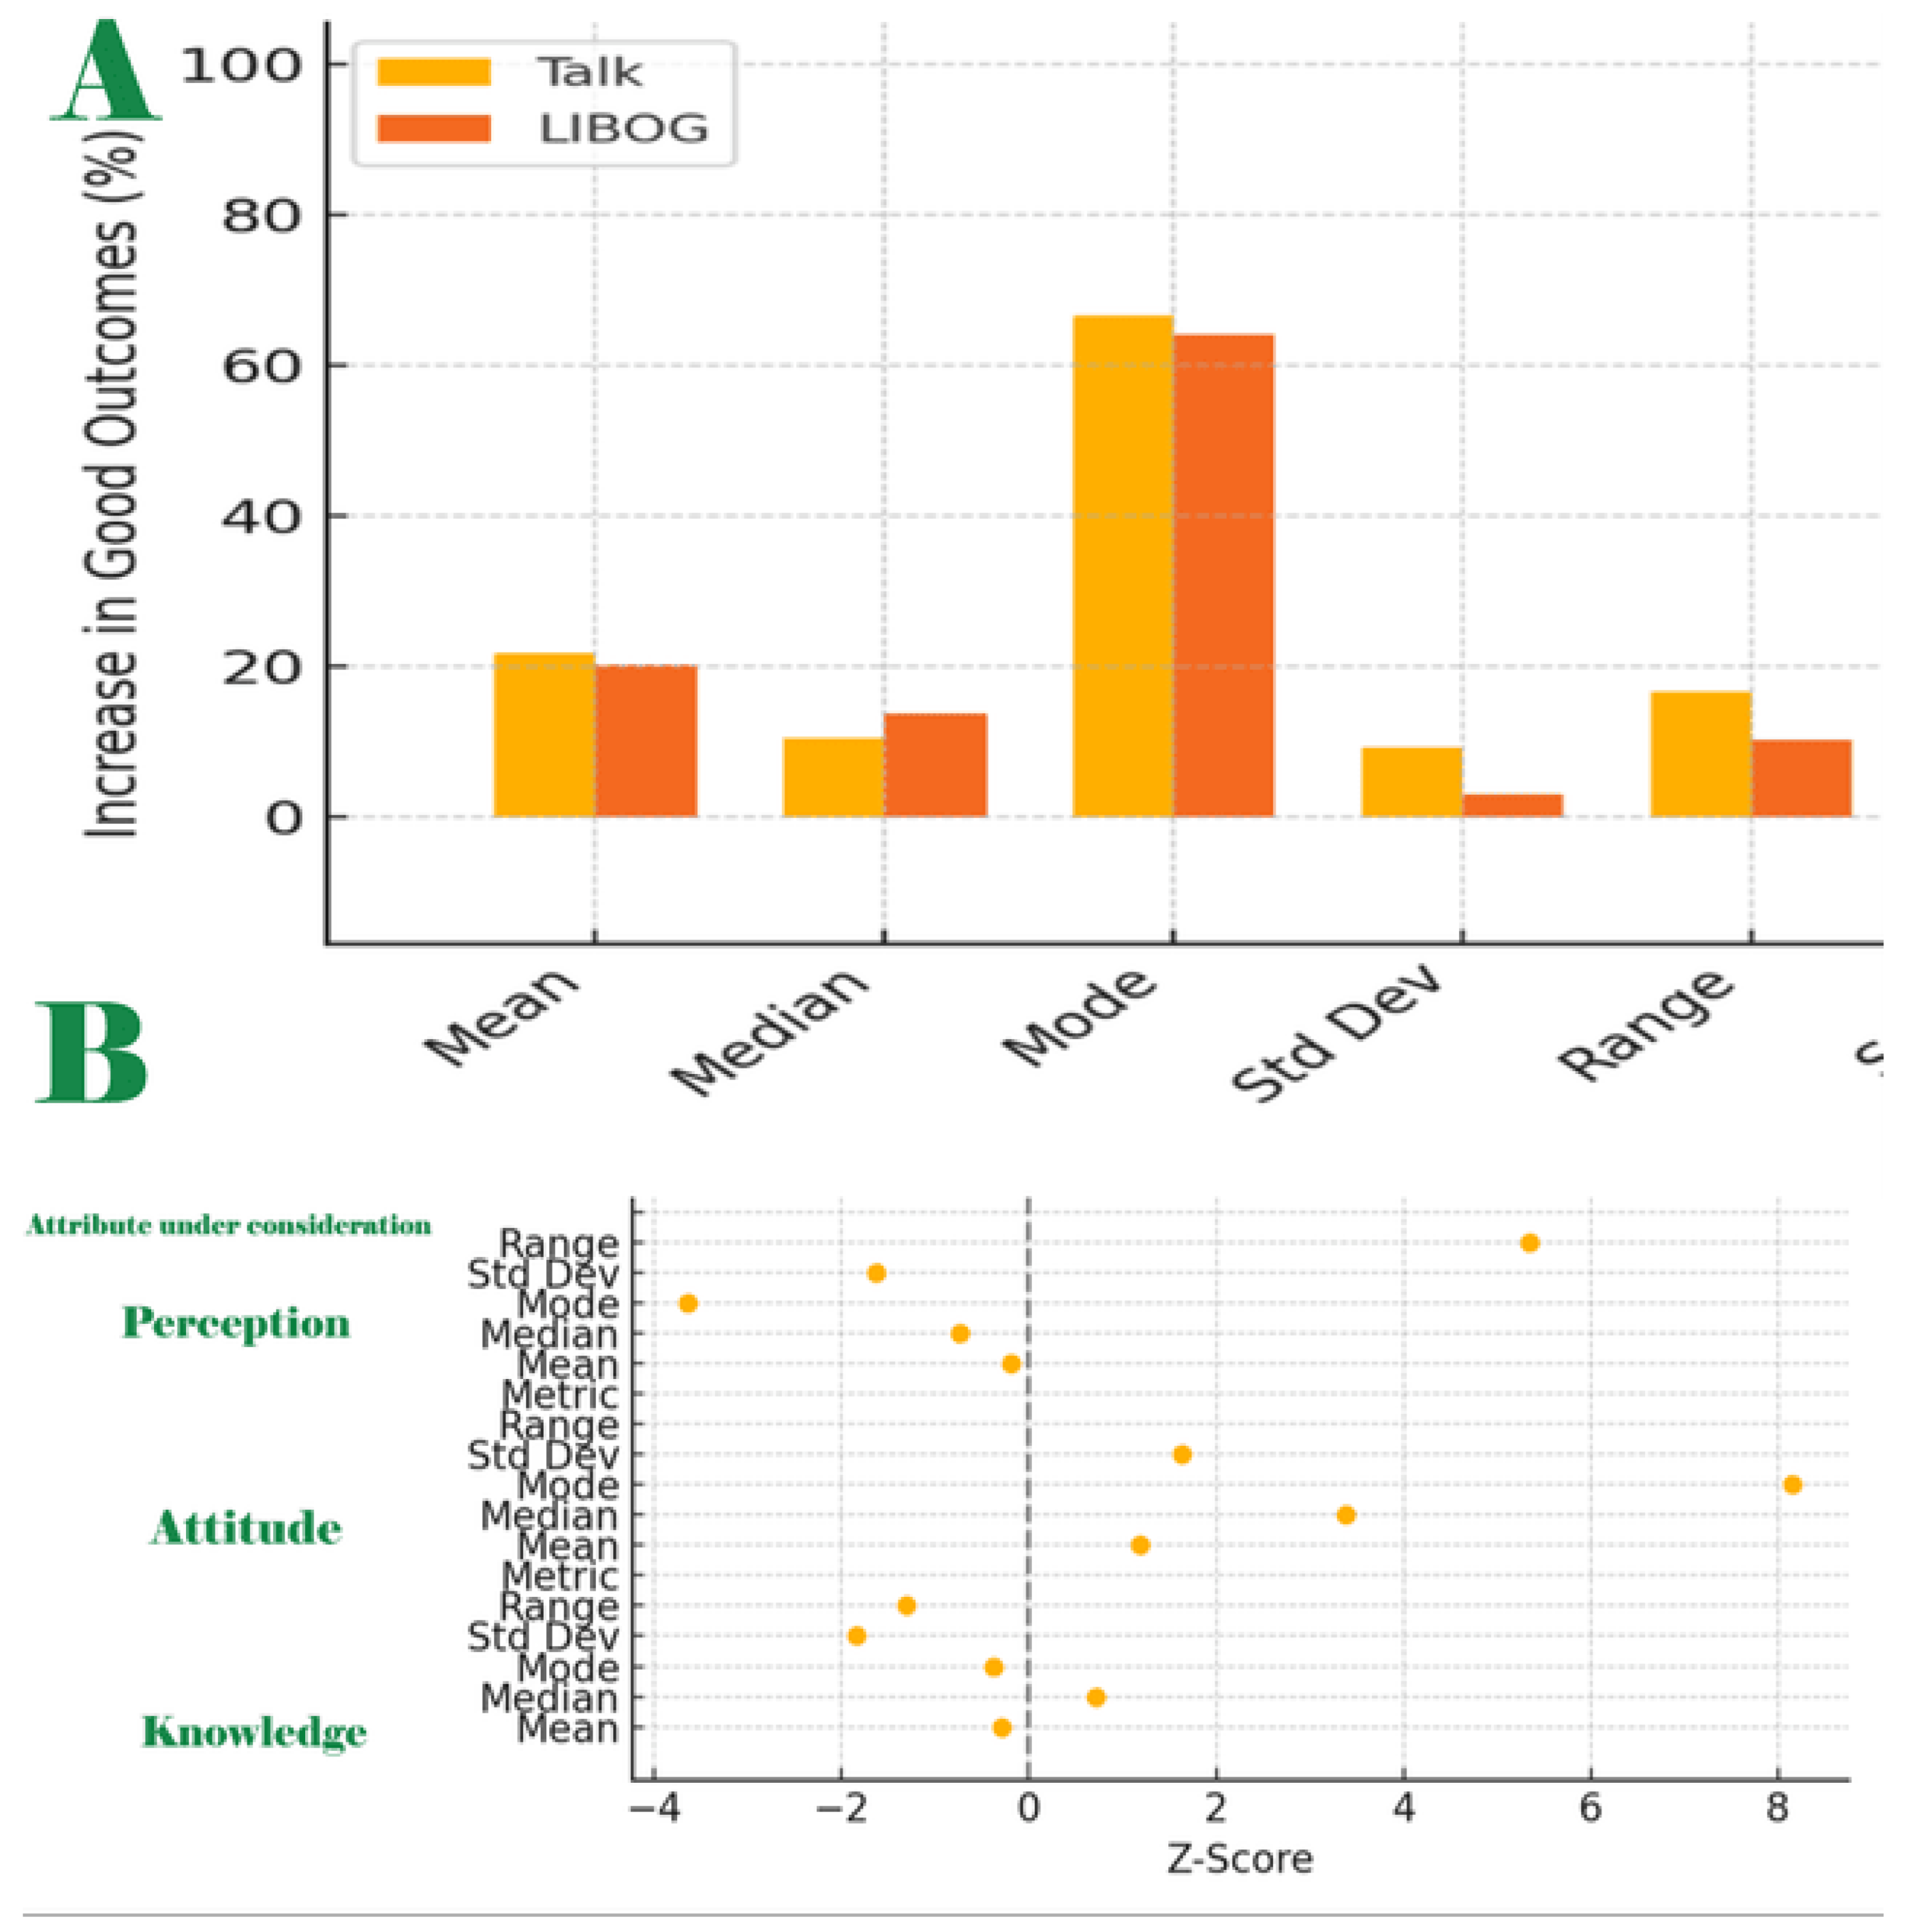
Differences in Knowledge Attitude and Perception between Baseline and Final for Both LIBOG and Health Talk:
The final output table presents a comparative analysis of baseline and post-intervention performances across three outcome domains: Knowledge, Attitude, and Perception, following two different educational interventions: a standard health talk (HT), and an interactive LIBOG game. It organizes the metrics into statistical descriptors (mean, median, mode, standard deviation, range) and tracks the percentage of participants with good and poor outcomes before and after interventions. It further includes absolute changes from baseline (improvements), Relative performance of LIBOG vs Talk, and Tests of statistical significance (Z-tests and p-values). See Table 5, Table 6, Table 7 and Table 8; Figure 10A and B.
Key Insight: Both interventions significantly improved good knowledge outcomes (Table 5 and Table 6). LIBOG and Talk showed comparable effectiveness overall, with health talk slightly edging LIBOG in mean gain but LIBOG showing a steadier median and smaller variability. However, no statistically significant difference was found between the LIBOG and Talk improvements (all p > 0.05). The two are comparable. LIBOG compared favorably with HT in the knowledge moiety.
Key Insight: The LIBOG game led to larger gains in attitude (Table 5 and Table 7), especially in mode and mean values, with a statistically significant difference observed for the modal value (z = 3.85, p < 0.001). The range analysis suggests LIBOG also reached more individuals at the extremes (better outcomes for some), despite slightly higher variability. LIBOG may be superior in modifying the attitude moiety.
Perception Domain: baseline, post-LIBOG and post-HT; mean, median, mode, range, standard deviation and statistically significant differences.
Perception metrics were also analyzed separately. The LIBOG intervention demonstrated positive perception shifts that outperformed the Talk intervention (Table 5).

Comparison by Aggregates

Aggregates of HT gains: The health talk intervention yielded notable improvements in both positive and negative KAP attributes across all three domains:
Knowledge: Improvement in good knowledge levels : Total improvement was 125.11%, averaging 25.02% across the five statistical measures.
Reduction in poor knowledge level: An even more substantial improvement was observed here, with a total of 229.72%, averaging 45.94%.
Overall (Final) Aggregate Score: 354.83%, translating to an average of 35.48% improvement in the knowledge domain.
Attitude:
Improvement in Positive Attitude: Total = 69.51%, Average = 13.90%
Reduction in Negative Attitude: Total = 226.97%, Average = 45.39%
Final Aggregate: 296.48%, Average = 29.64%
Perception:
Improvement in Positive perception: Total = 100.45%, Average = 20.09%
Reduction in Negative perception: Total = 75.01%, Average = 15.00%
Final Aggregate: 175.46%, Average = 17.55%
Overall (Grand Totals) for Health Talk
Positive Improvements Total: 295.07% (Average: 19.67%)
Negative Reductions Total: 531.70% (Average: 35.45%)
Combined Grand Total: 826.79%, yielding a grand average of 27.56% across all KAP domains and demographic strata (Table 9).
Aggregates for LIBOG Game Intervention:
The LIBOG board game intervention, which emphasizes interactivity and participation, also demonstrated strong gains, especially in attitude and perception:
Knowledge:
Improvement in Positive knowledge: Total = 111.52%, Average = 22.30%
Reduction in Negative knowledge: Total = 122.65%, Average = 24.53%
Final Aggregate: 234.17%, Average = 23.47%
Attitude:
Improvement in Positive Attitude: Total = 122.43%, Average = 24.49%
Reduction in Negative Attitude: Total = 116.91%, Average = 23.38%
Final Aggregate: 239.34%, Average = 23.93% (Table 10)
Perception:
Improvement in Positive perception: Total = 91.66%, Average = 18.33%
Reduction in Negative perception: Total = 26.04%, Average = 5.21%
Final Aggregate: 117.0%, Average = 11.77%
Overall (Grand Totals) for LIBOG Game
Positive Improvements Total: 325.61%, Average = 21.70%
Negative Reductions Total: 262.94%, Average = 17.53%
Combined Grand Total: 588.56%, with a grand average of 19.61% across all domains and parameters.
Table 11. Comparative Insights LIBOG vs HT.
Dimension Health Talk Avg. (%) LIBOG Avg. (%) Difference
Knowledge 35.48 23.47 HT leads by 12.01 pts
Attitude 29.64 23.93 HT leads by 5.71 pts
Perception 17.55 11.77 HT leads by 5.78 pts
Grand Avg. 27.56 19.61(71% of HT’s) HT leads by 7.95 pts
TABLE LEGEND: HT = health talk. LIBOG = Literacy board game.
While both interventions were effective, the health talk consistently produced higher percentage improvements and reductions, especially in knowledge and attitude domains. However, the LIBOG game still showed appreciable gains, particularly in affective and perceptual areas, and may offer benefits in engagement and longer-term behavioral reinforcement.
in the final analysis, HT leads by 7.95% points overall ahead of LIBOG: is the difference statistically significant?

Statistical Test: Difference Between Proportions

To assess whether the observed difference in overall grand average performance between the Health Talk (HT) group and the LIBOG group is statistically significant, a Z-test for two proportions was performed.
Input Values:
Health Talk Mean (p₁): 27.56% → 0.2756
LIBOG Mean (p₂): 19.61% → 0.1961
Sample Size (HT): 61
Sample Size (LIBOG): 80
Difference in Means: 7.95 percentage points
Test Output: Z-score = 1.11, p-value = 0.267
Interpretation:
The observed advantage of the Health Talk group (+7.95%) over the LIBOG group is not statistically significant at the conventional 5% threshold (p = 0.267). While numerically higher, the difference in average overall gains could plausibly be due to random variation given the sample sizes involved.
Finally, to cross-check, the Wilcoxon Signed-Rank Test with the Objective of determining whether there is a statistically significant difference (in medians) between the effectiveness (in percentage gain) of two paired educational interventions: LIBOG Game and Standard Health Talk, was conducted.
The test was conducted on the assumptions that each pair of values represents the percentage gain in knowledge, attitude, or perception for the same subgroup across both interventions. It was based on the assumptions that:
The data are paired and come from the same population. The paired differences are continuous and symmetrically distributed around the median. The dependent variable (here, percentage gain) is ordinal or continuous and The observations are mutually independent.
The Null Hypothesis (H₀) that the test was based on stated that:
There is no difference in median percentage gains between LIBOG and Health Talk.
H₀: median (LIBOG - Talk) = 0
The test was conducted to involve all 14 sociodemographic parameters, over both sets of:
Good and Poor Knowledge Gains, Good and Poor Attitude Gains, Good and Poor Perception Gains; across 25 subgroup comparisons, the test results were:
Test Statistic (W) = 102.0, p-value = 0.107.
Interpretation: Since p = 0.107 > 0.05, we failed to reject the null hypothesis.
There is no statistically significant difference in the overall effectiveness of the LIBOG Game vs the Health Talk when combining all domains and subgroup improvements (Table 12 and Figure 11).
Evaluation of the three hypotheses we started with: The study’s null hypotheses were:-
Hypothesis 1:There is no difference in the proportion of participants with good knowledge of prostate cancer before and after a standard health talk intervention. We reject this hypothesis, as baseline versus post - HT differences between mean-proportions of those with a ‘good knowledge level’ had a test statistic of (z = 3.10, p = 0.002). This suggests that there was an improvement that was statistically significant (and indeed this statistically significant difference was observed in a total of 16 out of the 24 measures of central tendency and dispersion for baseline versus post-HT metrics).
Hypothesis 2:There is no difference in the proportion of participants with good knowledge of prostate cancer before and after the session of interaction with the LIBOG game. We reject this hypothesis, as baseline versus post - LIBOG differences between mean-proportions of those with a ‘good knowledge level’ had a test statistic of (z = 2.85, p = 0.004). This suggests that there was an improvement that was statistically significant (and indeed this statistically significant difference was observed in a total of 14 out of the 24 measures of central tendency and dispersion for baseline versus post-LIBOG metrics).
Hypothesis 3:There is no difference in the median percentage gains between LIBOG and Health Talk interventional groups in the study. We fail to reject this statement as the Test Statistic across all the KAP domains (over all the 14 sociodemographic and lifestyle characteristics), the Wilcoxon Signed-Rank Statistic (W) was 102.0, p-value = 0.107. It means that the two interventions are comparable in effectiveness. LIBOG compares favorably with HT. Since it actually offers us at least 71% of the grand gains attributable to HT in this study, it is not an inferior modality for health literacy.
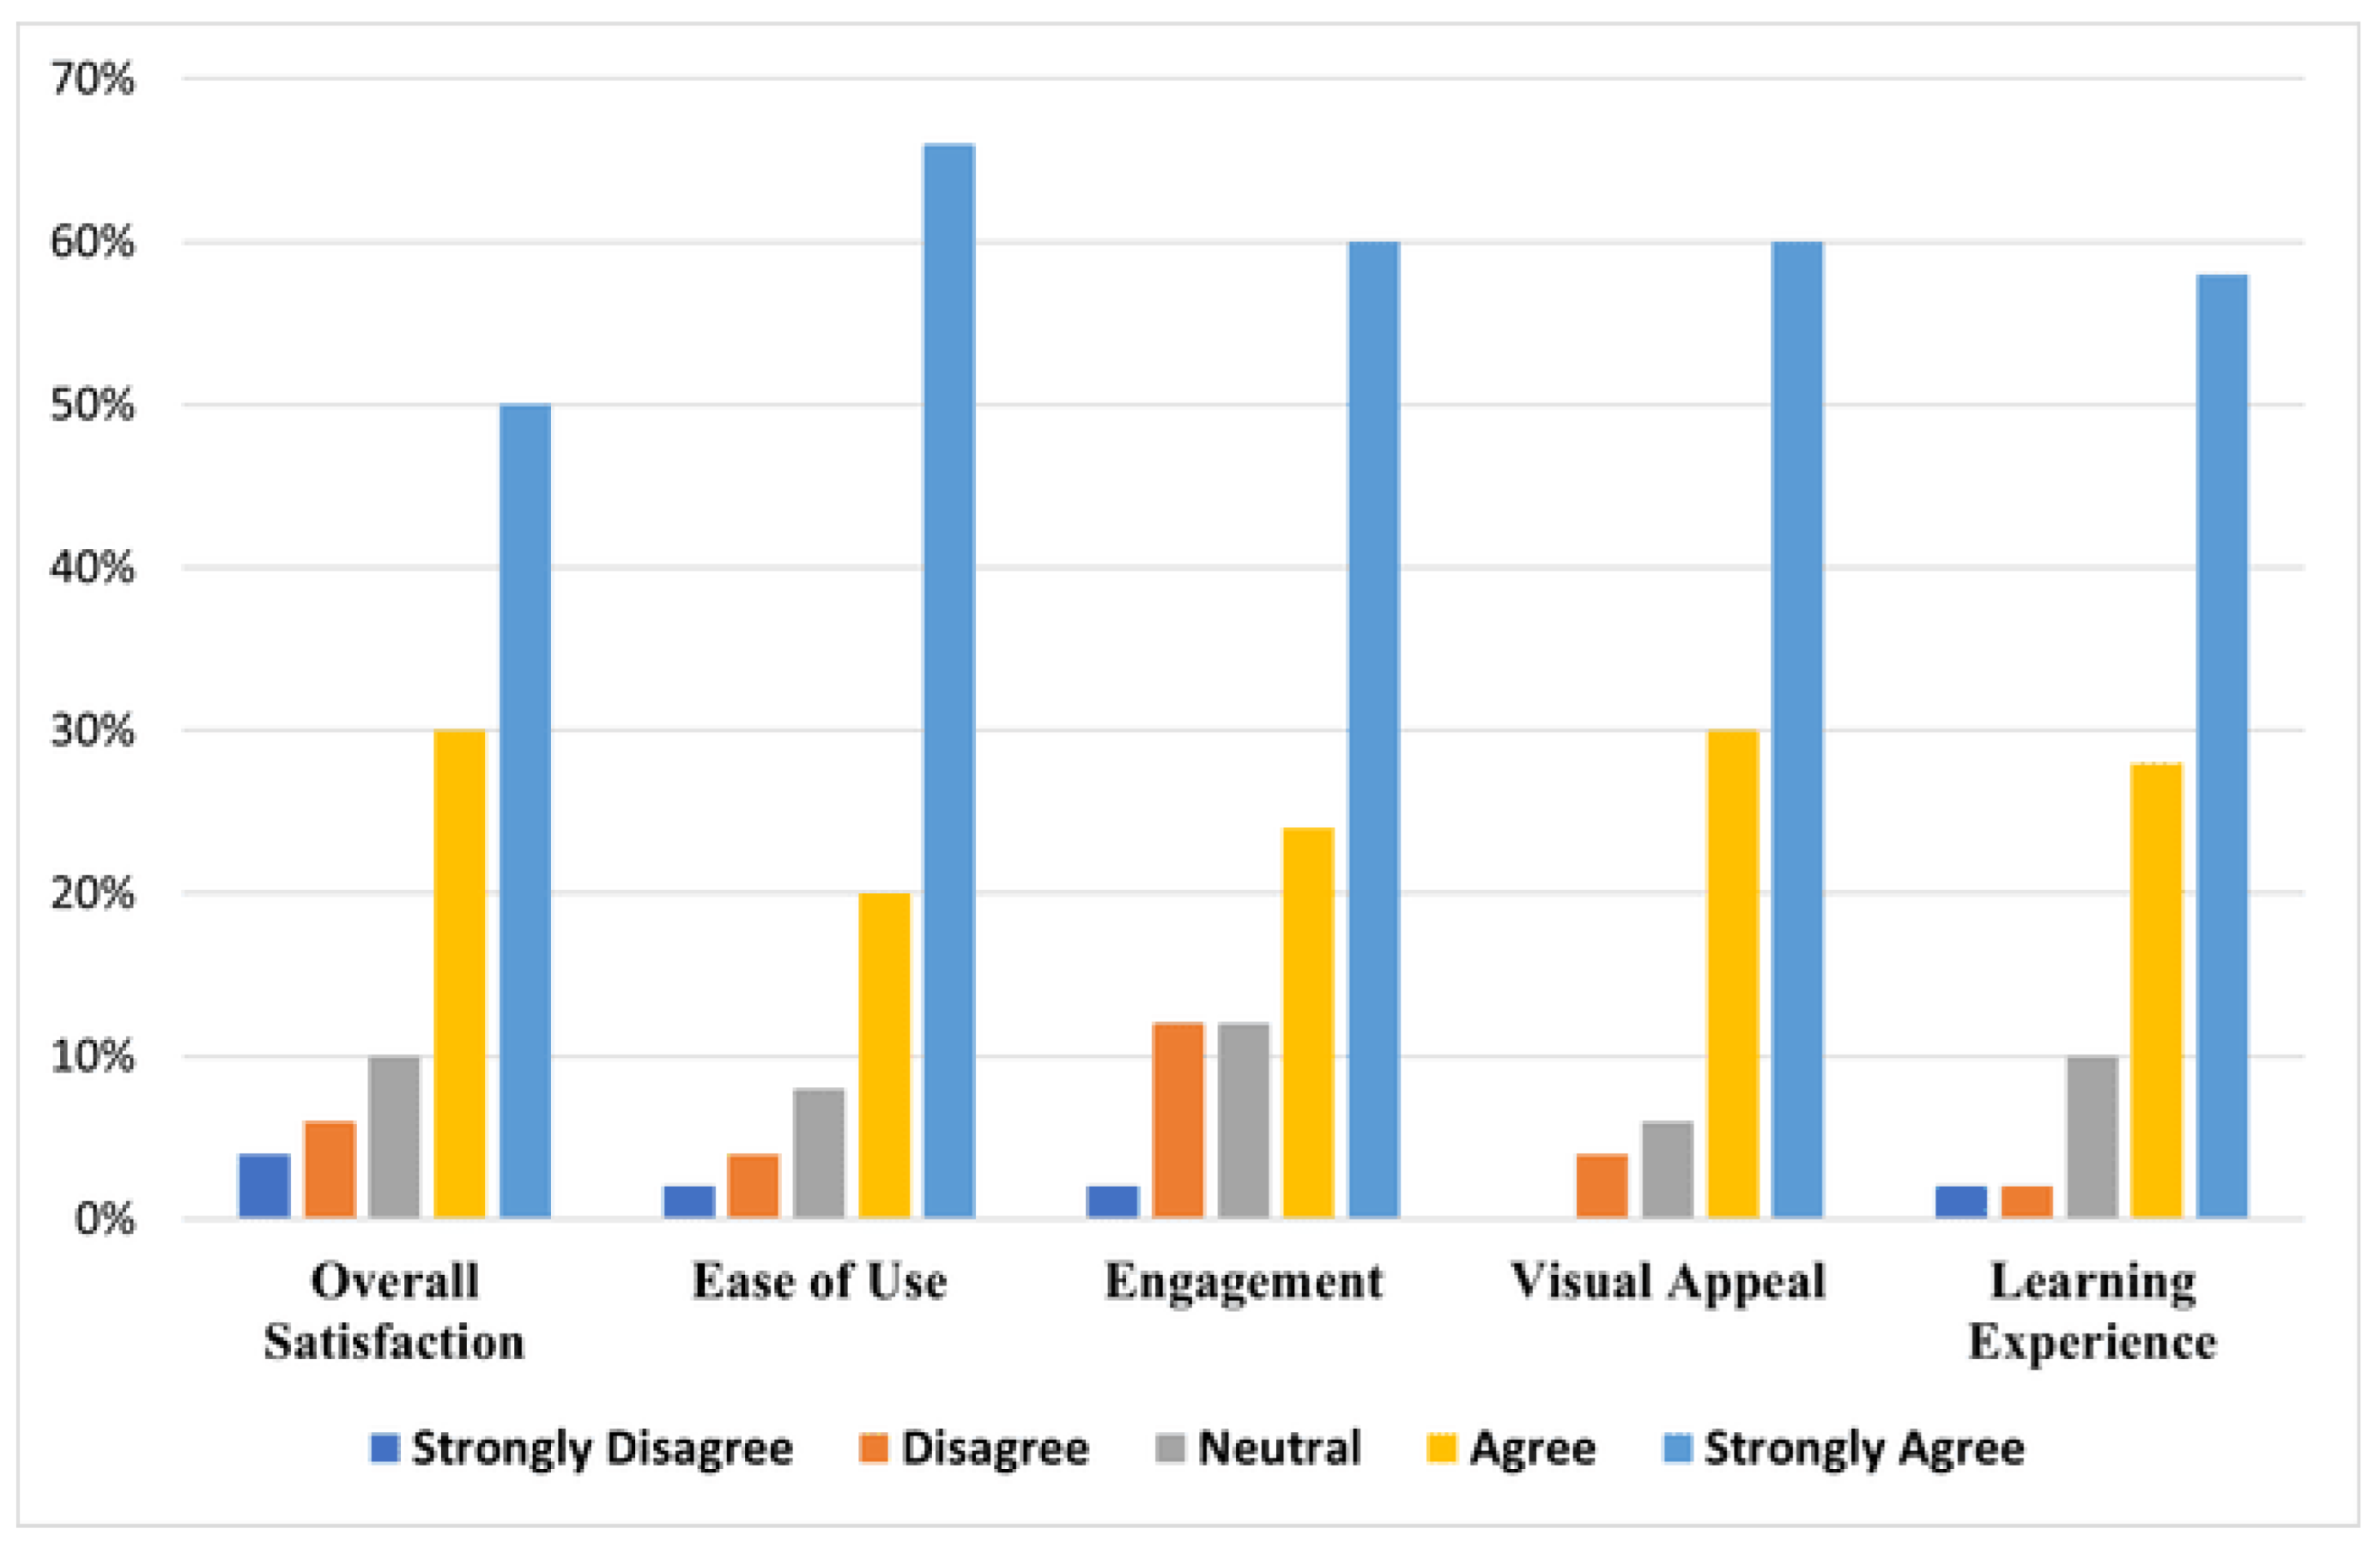
Literacy Game Usability Testing: The usability testing also showed that at least a total of 80% of all users of the LIBOG game agreed or strongly agreed that it was easy to use, engaging, had a good visual appeal, and gave them good satisfaction and learning experience (Figure 12).
The Likert Scale-based questionnaires for the main study and the Post Usability Testing for the LIBOG is presented in Table 13 under the Appendix Section of this paper.
Important Resources:
1. The drive to the prostate cancer S-S-LIBOG and its manuals are on the following links:
THE 18 LIBOGS(jpegs)
THE 18 LIBOGS (PDF): These includes S-S-LIBOGs on Adolescent Sexual and Reproductive Health, Asthma, Antimicrobial Resistance, Breast cancer, Breastfeeding/Breastfeeding Hospital Initiative, Cervical cancer, Diabetes Mellitus, Hypertension, Family Planning, Hematuria and Bladder cancer, Kidney diseases, Male Circumcision Complications, Malnutrition (in children), Mental health, Menstrual Health, Prostate cancer, Sickle Cell Disease.
THE MANUALS FOR THE 18 LIBOGS
2. The prototype digital version of the LIBOG is available on the following link:
3. The standard PowerPoint slides used for the HT are available on the following link:
4. Health Talk Guides for the other 16 diseases.

Discussion

Brief Summary of Results

This study assessed the baseline and post-intervention knowledge, attitude, and perception (KAP) of 197 participants regarding prostate cancer, exploring the influence of socio-demographic and behavioral factors, and evaluating two educational interventions: a standard PowerPoint health talk (HT) and a Literacy Board Game (LIBOG). Baseline data revealed that males predominated (64.5%), with a mean age of 34.3 years, and most participants were tertiary-educated urban residents. While 51.8% demonstrated good knowledge, disparities were evident across gender, education, residence, lifestyle, and family cancer histories, with statistically significant associations between KAP and several parameters, including gender, education, ethnicity, tobacco/alcohol use, exercise, diet, and family history of bladder or ovarian cancer. Multivariable analysis showed that regular exercise and tertiary education were strong predictors of good knowledge and correct perception, with males significantly more likely to show positive attitudes. Following intervention, 80 participants experienced LIBOG and 61 underwent the HT. Post-intervention, LIBOG improved ‘good knowledge level’ from 35.0% at baseline to 60.0% post-intervention; compared to 35.0% to 62.3% by the Health Talk (HT). LIBOG also reduced baseline disparities in knowledge, attitude, and perception, equalizing differences by gender, education, and lifestyle. Notably, the gender gap in knowledge narrowed, though males had significantly greater odds of positive attitude (OR = 4.16, p=0.004) and perception (OR = 2.79, p=0.047). Rural residents showed significantly higher odds of good knowledge post-LIBOG (OR = 4.39, p=0.041), suggesting improved equity. Similarly, HT bridged pre-existing disparities across nearly all socio-demographic strata, producing no significant gender, education, or ethnic differences post-intervention, except for perception, which remained significantly associated with educational level. In terms of post-interventional gains/impact, the HT group outperformed LIBOG in overall percentage gains across all KAP domains, especially knowledge (35.48% vs. 23.47%), with a mean difference of 7.95 percentage points overall. However, a Z-test revealed that this difference was not statistically significant (p = 0.267). A paired Wilcoxon Signed-Rank Test across all 14 sociodemographic subgroups confirmed no significant median difference in gains (W = 102.0, p = 0.107), establishing that the two interventions were comparable in effectiveness. The null hypotheses testing confirmed statistically significant improvements in knowledge following both LIBOG (z = 2.85, p = 0.004) and HT (z = 3.10, p = 0.002), while their comparative effectiveness did not differ significantly. Moreover, the LIBOG game demonstrated a particular advantage in enhancing attitudes, with statistically significant gains in attitudinal range and mode (z = -2.07 and z = 3.85, respectively), suggesting its potential for affective engagement. Usability testing confirmed the LIBOG’s high acceptance, with over 80% of users finding it easy to use, visually appealing, and educationally satisfactory. Collectively, the findings affirm that both interventions significantly improve prostate cancer literacy, with the interactive LIBOG game emerging as a viable, engaging alternative to conventional educational modalities.
In summary, the LIBOG game intervention resulted in significant improvements in attitude and perception among males and enhanced knowledge among rural residents. While most other associations did not reach statistical significance, the trends observed, particularly for family cancer history and educational level, underscore the value of inclusive, gamified public health education tools that transcend demographic boundaries.
Comparison of results/findings with existing literature in a prose discussion citing all pertinent literature in the process:
The findings of this study offer significant insight into the evolving discourse on prostate cancer education in Africa, where late-stage presentations remain common despite global advances in screening and awareness strategies [1,2,3]. Baseline assessments revealed key disparities in knowledge, attitude, and perception (KAP) levels, particularly among males, rural dwellers, and those with limited education. These align with previously documented sociocultural and structural barriers to prostate cancer literacy among African populations, including stigma, limited access to health information, and cultural misbeliefs [4,5,6]. The significant associations observed between KAP and factors such as gender, education, and family history at baseline underscore the persistent health inequities noted in previous African studies [7,8,9].
In this study, both interventions-an interactive Literacy Board Game (LIBOG) and a conventional PowerPoint health talk-produced significant improvements in participants’ knowledge of prostate cancer, corroborating earlier findings that structured educational models are effective in shifting awareness and belief systems [10,11,12]. Interestingly, although the health talk demonstrated higher overall percentage gains in knowledge and attitude domains, the statistical equivalence revealed by the Wilcoxon Signed-Rank Test (p = 0.107) affirms that gamification, as seen in the LIBOG model, offers an equally impactful alternative to didactic methods [13,14,15]. This supports emerging evidence suggesting that participatory, interactive tools may facilitate not only cognitive but also affective learning outcomes, especially in low-resource or culturally nuanced settings [16,17,18,19]. The LIBOG game, by emphasizing visual engagement and participatory learning, reflects principles from social learning theory and ecological behavior models, which posit that behavior change is optimized when educational content is both context-specific and experientially immersive [20,21,22].
Moreover, the LIBOG game was particularly effective in improving positive attitudes (z = 3.85, p < 0.001) and narrowing gaps in perception, especially among rural and male participants, further supporting the assertion that contextually tailored interventions may bridge inequities among underserved populations [23,24]. These outcomes echo the findings from Wanyama et al. [25], who reported improved HIV knowledge retention in Uganda through board-game interventions. Similarly, in Ghana, interactive community-based education has previously yielded improvements in malaria and HIV literacy [26,27,28], confirming the potential of culturally embedded games to improve health communication across various domains.
Post-intervention regression models further highlighted the role of gender and residence, with males showing greater attitudinal and perceptual gains post-LIBOG, while rural residents experienced a significant uptick in knowledge (OR = 4.39, p = 0.041). These findings contrast slightly with prior evidence that typically place urban residents at a higher advantage in health literacy [29,30], suggesting that gamified interventions may offer compensatory benefits in rural or under-informed settings. The near-universal acceptability of LIBOG (over 80% user satisfaction) aligns with existing gamification literature indicating that enjoyment, usability, and visualization significantly predict engagement and learning success [5,6,7,10,11,20,21,27,28].
Importantly, the LIBOG game succeeded in flattening pre-existing demographic disparities-such as those related to education, gender, tobacco use, and family history-which have previously limited the effectiveness of one-size-fits-all public health strategies [5,6,7,10,11,20,21,27,28]. The absence of significant differences in KAP scores between groups post-intervention further supports the argument for inclusive, learner-centered tools grounded in community context [5,6,7,10,11,20,21,27,28].
In summary, while both interventions yielded substantial and statistically significant improvements in prostate cancer literacy, the comparable effectiveness of LIBOG-despite lower percentage gains-coupled with its favorable usability profile and capacity to equalize disparities, establishes it as a promising health promotion tool in Sub-Saharan Africa. These findings contribute to the growing advocacy for gamified health interventions in low- and middle-income countries, particularly for conditions like prostate cancer where awareness gaps continue to impede early detection and survival outcomes [5,6,7,10,11,20,21,22,27,28].
The 17 Other LIBOGs: In addition to the prostate cancer LIBOG, seventeen other S-S-LIBOGs (Social Cognitive Theory and Socio-Ecological Model-based LIBOGs) have been developed, targeting a wide range of public health concerns. These include adolescent sexual and reproductive health, asthma, antimicrobial resistance, breast cancer, breastfeeding and the Baby-Friendly Hospital Initiative, cervical cancer, diabetes mellitus, hypertension, family planning, hematuria and bladder cancer, kidney diseases, male circumcision complications, child malnutrition, mental health, menstrual health, prostate cancer, and sickle cell disease.
Each of these was modeled after the original LIBOG designed for prostate cancer [22] and adapted for the respective disease focus. They are all underpinned by the theoretical foundations of Social Cognitive Theory (SCT) [27] and the Socio-Ecological Model (SEM) [28].
In this paper, these LIBOGs are being introduced for the first time. Links to access all the games and their accompanying manuals are provided in the final section of the Results. While the authors are currently evaluating each LIBOG in a stepwise manner, all researchers are welcome and encouraged to download, adapt, and test these tools in their own settings and among their target populations. Findings from such adaptations can be reported and published independently. The entire LIBOG suite is intended as an open-access resource for shared learning, collaboration, and improved public health outcomes
Limitations of the study:
This study had several limitations. First, there was a relatively high attrition rate (28.4%) in the post-intervention phase, which may have introduced selection bias or affected power. Second, the sample was drawn from a semi-urban population with high tertiary education representation, which may limit generalizability to rural, less educated, or more socioeconomically disadvantaged populations. Third, the short follow-up period did not allow for evaluation of long-term retention or actual screening behavior change. Also, while efforts were made to match baseline and post-intervention cohorts, complete blinding and randomization were not feasible due to the community-based nature of the interventions. Lastly, social desirability bias may have influenced participants' responses, particularly in self-reported attitudes and perceptions.
What is known about this topic
Prostate cancer is one of the leading malignancies among men globally and disproportionately affects African and African-descended populations, with higher mortality and later-stage diagnosis due to limited awareness and screening uptake [1,2,3]. Socio-demographic factors such as gender, education, income, residence, and family history are known to influence knowledge, attitude, and perception (KAP) regarding prostate cancer screening [4,5,6,7,8,9,10,11]. Health education interventions, including community talks and multimedia approaches, have shown moderate success in raising awareness; however, their ability to bridge disparities remains mixed [7,8,9]. Gamification and participatory learning models are gaining traction in health promotion, especially for hard-to-reach populations, but evidence comparing their effectiveness with traditional health education approaches remains limited, particularly in Sub-Saharan Africa [5,6,7,10,11,27,28].
What this study adds
This study is one of the first in Ghana to rigorously compare an interactive Literacy Board Game (LIBOG) to a conventional health talk in improving KAP toward prostate cancer screening across multiple socio-demographic strata. The findings demonstrate that both interventions led to statistically significant improvements in knowledge, with the LIBOG model showing particular advantages in modifying attitudes and perceptions, especially among male and rural populations. Furthermore, the LIBOG game helped bridge several baseline disparities, including those related to gender, education, and lifestyle behaviors, thereby affirming its potential for equitable impact. Although the standard health talk demonstrated numerically greater percentage gains across domains, the differences were not statistically significant, indicating the comparability of both modalities. The study also contributes methodologically by incorporating robust quasi-experimental analysis and combining both parametric and non-parametric tests to validate effectiveness.

Conclusions

The baseline factors that determine the KAPs of a Ghanaian population concerning prostate cancer includes gender, educational level, income levels, ethnicity, rural or urban residence, lifestyle factors (smoking alcohol use, exercise habits and dietary mix) as well as a family history of ovarian, breast, GIT or prostate cancer. However, the enduring ones after adjusted Odds Ratios were gender, income levels and exercise habits.
Both Literacy Board Game (LIBOG) and the standard didactic PowerPoint health talk significantly improved knowledge, attitude, and perception toward prostate cancer in this study. Even though the health talk showed greater overall improvements in KAPs, the LIBOG game compared closely (not inferior) and was particularly valuable in addressing baseline disparities related to gender, educational level, rural residence, and lifestyle behaviors, particularly in the attitude and perceptive domains of the KAPs. This affirms its potential for equitable impact. During its usability testing, LIBOG was highly accepted, with over 80% of users reporting satisfaction. The findings support the use of interactive, gamified educational tools as viable and culturally adaptable adjunct/main strategies for improving prostate cancer literacy in Sub-Saharan African settings. Future studies should explore longer-term outcomes, behavior change, and the integration of such tools into national cancer educational frameworks. Schools may use the LIBOGs as semi-formal teaching aids/tools, and societies, families, and health clubs may use it to enhance greater health literacy amongst their members and patrons. Finally, the study does not condemn nor denigrate health talks as a tool for health literacy.

Author Contributions

Conceptualization, Frank Obeng, Daniel Dadee-Seshie, Sylvester Boakye, Banabas Kpankyaano, Joyce Okai and Millicent Boateng; Data curation, Frank Obeng, Fadil Mohammed, Aishah Adamu, Daniel Dadee-Seshie, Eric Okai, Godson Agbeteti, Sylvester Boakye, Banabas Kpankyaano, Evans Zikpi, Appiateng Boadu and Joyce Okai; Formal analysis, Frank Obeng, Fadil Mohammed, Evans Zikpi and Appiateng Boadu; Investigation, Frank Obeng, Fadil Mohammed, Daniel Dadee-Seshie, Eric Okai, Godson Agbeteti, Sylvester Boakye, Banabas Kpankyaano, Evans Zikpi, Appiateng Boadu, Joyce Okai, Selasie Owiafe and Millicent Boateng; Methodology, Frank Obeng, Fadil Mohammed, Aishah Adamu, Daniel Dadee-Seshie, Eric Okai, Godson Agbeteti, Sylvester Boakye, Banabas Kpankyaano, Evans Zikpi, Appiateng Boadu, Joyce Okai, Selasie Owiafe and Millicent Boateng; Project administration, Fadil Mohammed, Sylvester Boakye, Banabas Kpankyaano, Evans Zikpi, Appiateng Boadu, Joyce Okai and Millicent Boateng; Resources, Frank Obeng, Fadil Mohammed, Aishah Adamu, Daniel Dadee-Seshie, Eric Okai, Godson Agbeteti, Sylvester Boakye, Banabas Kpankyaano, Evans Zikpi, Appiateng Boadu, Joyce Okai and Selasie Owiafe; Software, Fadil Mohammed, Daniel Dadee-Seshie and Evans Zikpi; Supervision, Frank Obeng, Fadil Mohammed, Aishah Adamu, Godson Agbeteti, Sylvester Boakye, Evans Zikpi and Millicent Boateng; Validation, Frank Obeng, Fadil Mohammed, Aishah Adamu, Eric Okai, Godson Agbeteti, Sylvester Boakye, Banabas Kpankyaano, Evans Zikpi, Appiateng Boadu, Joyce Okai, Selasie Owiafe and Millicent Boateng; Visualization, Daniel Dadee-Seshie, Eric Okai, Godson Agbeteti, Evans Zikpi, Appiateng Boadu and Millicent Boateng; Writing – original draft, Frank Obeng and Sylvester Boakye; Writing – review & editing, Frank Obeng, Fadil Mohammed, Aishah Adamu, Daniel Dadee-Seshie, Eric Okai, Godson Agbeteti, Banabas Kpankyaano, Evans Zikpi, Appiateng Boadu, Joyce Okai, Selasie Owiafe and Millicent Boateng. All authors have read and agreed to the submitted version of the manuscript.

Funding

This research received no external funding. The study was self-funded by the authors, with in-kind institutional support from the University of Health and Allied Sciences, Ho, Ghana.

Institutional Review Board Statement

The study was conducted according to the guidelines of the Declaration of Helsinki and approved by the Research Ethics Committee of the University of Health and Allied Sciences, Ho, Ghana (UHAS-REC A.5[79] 23–24, approved 12 October 2023).

Informed Consent Statement

Informed consent was obtained from all subjects involved in the study.

Data Availability Statement

The data that support the findings of this study are available from the corresponding author upon reasonable request.

Acknowledgments

The authors express their sincere gratitude to all study participants, community leaders, and health facility staff who supported data collection. Special thanks to the Urology Unit, Department of Surgery, University of Health and Allied Sciences, for technical guidance, and to the community volunteers who helped with participant mobilization. We also acknowledge the assistance of research assistants and data entry personnel whose work contributed to the success of this study.

Conflicts of Interest

The authors declare no conflict of interest. The funders had no role in the design of the study; in the collection, analyses, or interpretation of data; in the writing of the manuscript; or in the decision to publish the results.

Appendix

Table 13. Study Questionnaires.
DEMOGRAPHY AND BIODATA
Age (years)
Gender (Male / Female)
Ethnicity
Height (cm)
Weight (kg)
Body Mass Index (BMI) (auto-calculated)
Residence (Urban / Suburban / Rural)
Tobacco Use (Never / Former / Current)
Alcohol Use (Never / Occasionally / Regularly)
Family History of Prostate Cancer (Yes / No)
Family History of Breast Cancer (Yes / No)
Family History of Ovarian Cancer (Yes / No)
Family History of Bladder Cancer (Yes / No)
Family History of GIT Cancer (Yes / No)
Exercise Habits (Sedentary / Light / Moderate / Active)
Diet Type (Fatty / Vegetarian / Mixed)
Educational Level (Primary / Secondary / Tertiary / Postgraduate)
Occupation
Residence Description
Income Level (Low / Medium / High / Not Applicable)
KNOWLEDGE & ATTITUDE QUESTIONS (Likert 1–5)
Prostate cancer is a common health issue among men.
Regular screening can help in the early detection of prostate cancer.
Prostate-Specific Antigen (PSA) is a blood test used to screen for prostate cancer.
Individuals with a relative diagnosed as prostate cancer have a higher risk of contracting prostate cancer
Most prostate cancer patients may show no signs/symptoms early, so screening is advisable
Most prostate cancer patients would show clear signs/symptoms early, so screening is not advisable
Some men with prostate cancer may have urinary challenges
Prostate cancer affects young men rather than elderly
Prostate cancer affects mostly men 50 years and above
Prostate cancer is more common in Africans and African Americans than Whites
Prostate cancer is more common amongst Whites than Blacks
Frequently recurring low back pain might indicate prostate cancer
Older people over 80 years don’t need prostate cancer screening tests
Some prostate cancer treatments complicate urinary continence in men
Some prostate cancer treatments affect sexual abilities in men
Some prostate cancer treatments restrict driving ability
Some men might die from prostate cancer, while others would not
An abnormal PSA test result absolutely indicates prostate cancer
Prostate cancer might be detected despite normal PSA
Prostate cancer might progress slowly in some men
Prostate cancer is best treated when diagnosed early
There is hope for prevention, control and treatment of prostate cancer if detected early
PSSUQ: Post-Study System Usability Questionnaire (Likert 1–5)
The game was easy to play.
I felt comfortable navigating the game controls.
I could complete my objectives quickly in the game.
The game was engaging and kept my interest.
I am satisfied with my overall experience in the game.
I would recommend this game to others.
The game's tutorials or instructions were helpful.
I didn’t need help to progress in the game.
The game provided clear feedback on my performance.
I found the game's storyline engaging and clear.
The graphics and visuals enhanced my gaming experience.
I felt the game mechanics were intuitive.
The game met my expectations for entertainment.
The game was educative.
Overall, I have a positive impression of the game.
I would play this game again in the future.
Suggestions for Improvement (open-ended)
PUSQ: Source: Adapted and modified from uiuxtrend.com.

References

  1. Laryea DO, Awuah B, Amoako YA, et al.: Cancer incidence in Ghana, 2012: Evidence from a population-based cancer registry. BMC Cancer. 2014, 14:362. [CrossRef]
  2. Ferlay J, Soerjomataram I, Dikshit R, et al.: Cancer incidence and mortality worldwide: Sources, methods and major patterns in GLOBOCAN 2012. International Journal of Cancer. 2015, 136(5):220323. [CrossRef]
  3. Zhang W, Cao G, Wu F, et al.: Global Burden of Prostate Cancer and Association with Socioeconomic Status, 1990-2019: A Systematic Analysis from the Global Burden of Disease Study. J Epidemiol Glob Health. 2023, 13:407-421. [CrossRef]
  4. Adeloye D, David R A, Aderemi A V, et al.: An Estimate of the Incidence of Prostate Cancer in Africa: A Systematic Review and Meta-Analysis. . PLOS ONE, 11(4), e0153496. https://doi.org/10.1371/journal.pone.0153496. 2016, 11(4)e:0153496. [CrossRef]
  5. Odedina FT, Ogunbiyi JO, Ukoli FAM: Roots of prostate cancer in African-American men. J Natl Med Assoc. 2006 April, 98(4):539-543.
  6. Odedina FT, Dagne G, LaRose-Pierre M, et al.: Within-Group Differences Between SNative-Born and Foreign-Born Black Men on Prostate Cancer Risk Reduction and Early Detection Practices. J Immigr Minor Health. 2011, 13:996-1004. [CrossRef]
  7. Odedina FT, Scrivens J, Emanuel A, et al.: A focus group study of factors influencing African-American men’s prostate cancer screening behavior. J Natl Med Assoc. 2004, 96:780-8.
  8. Necku JG, Anaba EA, Abuosi AA: Prostate cancer awareness and attitude among male soldiers in Ghana. Afr J Urol. 2019, 25:5. [CrossRef]
  9. Perdana N R, Mochtar C A, Umbas R, et al.: The Risk Factors of Prostate Cancer and Its Prevention: A Literature Review. Acta Medica Indonesiana. 2016, 48:228-238.
  10. Walsh-Childers K, Odedina F, Poitier A, et al.: Choosing Channels, Sources, and Content for Communicating Prostate Cancer Information to Black Men: A Systematic Review of the Literature. American Journal of Men’s Health. 2018, 12:1728-1745. [CrossRef]
  11. Odedina F, Oluwayemisi AO, Pressey S, et al.: Development and assessment of an evidence-based prostate cancer intervention programme for black men: the W.O.R.D. on prostate cancer video. Ecancermedicalscience. 2014288, 460:10. [CrossRef]
  12. M. Boafo, I., M. Tetteh, P., & A. Hiadzi, R. : Exploring prostate cancer screening among men in Accra using the health belief model. . Ghana Medical Journal. 2023, 57(3):226-233. [CrossRef]
  13. Osei Agyemang R, Bannor R, Osei-Yeboah R, et al.: A call to intensify prostate cancer education and screening in Africa: a case study of Ghana. International Journal of Health Promotion and Education. 2024, 62(5):367-380. [CrossRef]
  14. Nyakotey-Obu, R. (2020: Review of Prostate Cancer in Ghana. East African Scholars Journal of Medical Sciences. 2020, 3:6-10. [CrossRef]
  15. Farazi PA, Siahpush M, Maloney S, et al.: Awareness and Attitudes of Nigerian Men on Prostate Cancer. J Cancer Educ. 2019, 34:1107-1111. [CrossRef]
  16. Oladimeji O, Bidemi YO, Olufisayo J-AY, et al.: Prostate Cancer Awareness among Older Men in Oyo State, Nigeria. Int Q Community. International Quarterly of Community Health Education. 2010, 30:271-286. [CrossRef]
  17. Wray RJ, Vijaykumar S, Jupka K, et al.: Addressing the Challenge of Informed Decision Making in Prostate Cancer Community Outreach to African American Men. American Journal of Men’s Health . 2011, 5(6):508-516. [CrossRef]
  18. Jackson DD, Owens OL, Friedman DB, et al.: An Intergenerational Approach to Prostate Cancer Education: Findings from a Pilot Project in the Southeastern USA. Journal of Cancer Education. 2014, 29(4):649-656. [CrossRef]
  19. Kaskowitz SR, Nakaji MC, Clark KL, et al.: Bringing prostate cancer education to deaf men. . Cancer Detection and Prevention . 2006, 30(5):439-448. [CrossRef]
  20. Cosma G, Brown DJ, Shopland N, et al.: PROCEE: A serious game for African Caribbean men. J Assist Technol. 2016, 10:199-210. [CrossRef]
  21. Mallick A, Waheed S: Learning Urogenital Diseases in Oddity (LUDO). Int J Emerg Med. 2024, 17:8. [CrossRef]
  22. Obeng F, & Boateng M O, (July 2024: Evaluating the effectiveness of a socio-ecological model-based snake-and-ladder board game versus traditional educational methods in prostate cancer awareness. Researchgate (ed): Researchgate, Researchgate.
  23. Wanyama JN, Castelnuovo B, Robertson G, et al.: Board Game for HIV/STD Knowledge Uptake. JAIDS. 2012, 59:253-258. [CrossRef]
  24. Boateng MA, Agyei-Baffour E, Angel S, et al.: Health literacy intervention for malaria in Ghana. Res Involv Engagem. 2021, 7:55. [CrossRef]
  25. Yeboah-Asiamah Asare, B., & Mawufenya Ackumey, M.: Awareness and knowledge about prostate cancer among male teachers in the Sunyani Municipality, Ghana. . African Health Sciences. 2021, 21(2) :655-662. [CrossRef]
  26. Hu H, Lai X, Yan L: Improving Nursing Students’ COVID-19 Knowledge Using a Serious Game. Computers, Informatics, Nursing : CIN, . 2021, 40(5):285-289. [CrossRef]
  27. Bandura A: Social-learning theory of identificatory processes. In: Handbook of Socialization. In D. A. Goslin (Ed.) (ed): Rand McNally & Company. , Bandura, A. (1969). Social-Learning Theory of IdentifHandbook of Socialization Theory and Research (pp. 213-262). Chicago; 1969.
  28. McLeroy K R, Bibeau D, Steckler A, et al.: An ecological perspective on health promotion programs. Health Education Quarterly. 1988:351-377.
  29. Sallis JF, Owen N, Fisher EB: Ecological models of health behavior. Jossey-Bass Sallis, J. F., Owen, N., & Fisher, E. B. (2006). Ecological models of health behavior. 2006, In K. Glanz, B. K. Rimer, & K. Viswanath (Eds.), Health Behavior and Health Education: Theory, Research, and Practice. Jossey-Bass.:pp. 462-484).
  30. Culp MB, Soerjomataram I, Efstathiou JA, et al.: Recent Global Patterns in Prostate Cancer Incidence. Eur Urol. 2020, 77:38-45. [CrossRef]
Figure 1. The Socio-Ecological Model of Health (Adapted from McLeroy et al, 1988). Source: McLeroy, K. R., Bibeau, D., Steckler, A., & Glanz, K. (1988). An ecological perspective on health promotion programs. Health Education Quarterly, 15(4), Pages 351–377 [28].
Preprints 172270 g001
Figure 2. The Social Cognitive Theory. Source: Bandura, A., (1986). Social Foundations of Thought and Action: A Social Cognitive Theory. Prentice-Hall. P. 24. Key constructs of social cognitive theory that are relevant to health behavior change interventions include: Observational learning, Reinforcement, Self-control, Self-efficacy.
Preprints 172270 g002
Figure 3. An Attached image the Innovated SEM-SCT-Based Prostate Cancer Literacy Board Game (S-S-LiBoG). A snakes- ladder-and-arrows board game. Source: Authors Design, Adaptation and Creation, 2023 to 2025: Obeng et al., 2024 [22]. (Note: The game is protected by a Copyright License (under the Republic of Ghana Copyright License Law: number xx0004726xx, x00-469/2024x).
Preprints 172270 g003
Figure 4. Combined annotated Forest Plot showing the odds ratios (ORs) with 95% confidence intervals (CIs) and p-values for predictors of Knowledge Attitudes and Perceptions (KAPS) of Study participants as it relates to their sociodemographic and lifestyle characteristics. FIGURE LEGEND: A. Good Knowledge (top panel), B. Positive Attitude (middle panel), C. Positive Perception (bottom panel). Each horizontal line represents a 95% confidence interval around the OR for a given predictor. The vertical dashed line at OR = 1 indicates no association. Markers to the right of the line (OR > 1) indicate increased odds of the outcome for the reference group. Annotated labels include:
Preprints 172270 g004
Figure 5. On-Field Education of Participants with the Prostate Cancer LiBoG; and Testing, Ongoing (original Picture). Source: Original on-field picture.
Preprints 172270 g005
Figure 6. Comparative Performance of the LIBOG Game and Health Talk Interventions on Knowledge, Attitude, and Perception Scores. FIGURE LEGEND: This bar chart displays the comparative performance of two educational interventions—the LIBOG game and a standard health talk—across three domains: Knowledge, Attitude, and Perception. The chart is structured into six grouped categories: Baseline scores for both the LIBOG and Talk groups (shared, since all participants began from the same baseline), Post-intervention scores separately for the LIBOG group and the Talk group, Computed improvements ("Change/Learning") in each domain for each group. Each group contains three vertically stacked bars: Blue: Knowledge, Orange: Attitude, Gray: Perception.
Preprints 172270 g006
Figure 7. Post LIBOG Intervention Forest Plots For KAP Odds Ratios.
Preprints 172270 g007
Figure 8. Percentage changes in Good Knowledge, Positive Attitude, and Positive Perceptions after interventions with LIBOG or Health Talk (HT), disaggregated by gender. FIGURE LEGEND: Figure 8A shows the percentage gains in good knowledge among males and females following interventions. Both the LIBOG game and the standard health talk led to knowledge improvement, with higher gains seen in males. Figure 8B displays changes in positive attitude. Overall, the talk led to a slight positive shift in females, but a reduction in attitude scores was observed following the LIBOG intervention, especially among males. Figure 8C illustrates percentage gains in positive perception, where males again showed a stronger improvement, particularly following the LIBOG intervention. Abbreviations: LIBOG – Literacy Board Game (a participatory health education tool); HT – Health Talk (standard didactic health education session).
Preprints 172270 g008
Figure 9. Post Health-Talk Intervention Forest Plots For KAP Odds Ratios. FIGURE LEGEND: None of the Odds Ratios shown remained statistically significant post-talk intervention.
Preprints 172270 g009
Figure 10. Bar Chart: Comparative Gains in Knowledge, Attitude, and Perception (altogether) – LIBOG vs Health Talk and Forest Plot: Statistical Significance of Improvement Differences Between LIBOG and Talk. FIGURE LEGEND: A: The bar chart displays the percentage increase in good outcomes from baseline for each health literacy domain—knowledge, attitude, and perception (altogether)—stratified by statistical metrics (mean, median, mode, range, standard deviation.). For each metric, the LIBOG and Talk interventions are plotted. B: The forest plot represents Z-test statistics comparing the gains made by LIBOG vs the Talk intervention across all metrics. Each dot corresponds to a Z-score for a metric, indicating whether the LIBOG game was significantly more effective (positive values) or not. The vertical dashed line (Z = 0) represents equivalence. Statistically significant points (Z > ±1.96) occur for modal attitude (z = 3.85, p < 0.001) and attitudinal range (z = –2.07, p = 0.038), demonstrating superiority of LIBOG in these domains.
Preprints 172270 g010
Figure 11. Box Plots for the Wilcoxon Signed Rank Test analysis: LIBOG vs HT. FIGURE LEGEND: Good Knowledge: Number of Paired Comparisons: 9, Wilcoxon Signed-Rank Statistic (W): 18.0, p-value: 0.6523. Result: No statistically significant difference(Figure 11). Positive Attitude: Number of Paired Comparisons: 8, Wilcoxon Signed-Rank Statistic (W): 5.0, p-value: 0.0781. Result: No statistically significant difference. Positive Perception: Number of Paired Comparisons: 8, Wilcoxon Signed-Rank Statistic (W): 12.0, p-value: 0.4609. Result: No statistically significant difference.
Preprints 172270 g011
Figure 12. A bar chart showing Participants’ usability testing results for the LIBOG game.
Preprints 172270 g012
Table 1. Baseline Knowledge Attitude and Perception about prostate cancer amongst the participants of the study, and Associations with socio-demographic and lifestyle factors.
Variable Subgroup Good Knowledge % Poor Knowledge % Good Attitude % Poor Attitude % Good Perception % Poor Perception %
Age Young 49.32 45.21 60.27 23.29 42.47 46.58
Age Middle 54.78 39.13 50.43 32.17 39.13 42.61
Age Old 33.33 55.56 55.56 44.44 44.44 55.56
Gender Female 62.07 34.48 51.72 25.86 48.28 43.1
Gender Male 51.97 40.16 60.63 24.41 40.94 48.82
Gender Other 0 100 0 100 0 8.33
Education Primary 16.67 66.67 33.33 66.67 33.33 66.67
Education Secondary 21.05 73.68 26.32 73.68 5.26 31.58
Education Tertiary 55.9 38.51 58.39 22.36 45.96 44.1
Education Postgraduate 63.64 27.27 54.55 36.36 27.27 63.64
Ethnicity Akan 58.49 35.85 64.15 18.87 41.51 49.06
Ethnicity Ga 61.54 38.46 38.46 23.08 38.46 53.85
Ethnicity Ewe 47.56 45.12 57.32 30.49 43.9 46.34
Ethnicity Northern Ghanaian 59.26 33.33 62.96 18.52 44.44 40.74
Ethnicity Guan 66.67 33.33 66.67 0 100 0
Ethnicity Other 31.58 63.16 10.53 78.95 10.53 31.58
Residence Urban 65.93 30.77 60.44 20.88 43.96 42.86
Residence Suburban 38.3 51.06 42.55 51.06 31.91 40.43
Residence Rural 40.68 52.54 54.24 25.42 42.37 50.85
Tobacco Never 54.64 38.8 57.92 24.59 42.62 47.54
Tobacco Former User 15.38 84.62 7.69 92.31 7.69 7.69
Tobacco Current User 0 100 0 100 100 0
Alcohol Never 56.93 37.23 56.93 25.55 40.15 48.91
Alcohol Former User 51.06 40.43 59.57 23.4 51.06 42.55
Alcohol Current User 0 100 7.69 92.31 7.69 7.69
Family History Pca Yes 44.44 44.44 44.44 44.44 33.33 22.22
Family History Pca No 52.13 42.02 54.79 28.72 40.96 45.74
Family History Brca Yes 35.29 58.82 35.29 41.18 35.29 29.41
Family History Brca No 53.33 40.56 56.11 28.33 41.11 46.11
Family History Ovca Yes 0 100 0 100 0 0
Family History Ovca No 53.13 40.63 55.73 27.6 41.67 45.83
Family History Blca Yes 11.11 88.89 0 100 0 22.22
Family History Blca No 53.72 39.89 56.91 26.06 42.55 45.74
Family History GIT Ca Yes 16.67 83.33 16.67 66.67 16.67 33.33
Family History GIT Ca No 52.63 41.05 55.26 28.42 41.58 44.74
Exercise Sedentary 43.86 47.37 56.14 33.33 36.84 49.12
Exercise Light 60 32.5 61.25 18.75 45 45
Exercise Moderate 61.54 35.9 48.72 28.21 46.15 51.28
Exercise Active 23.81 76.19 33.33 61.9 23.81 19.05
Diet Fatty 66.67 33.33 66.67 0 0 100
Diet Vegetarian 18.75 81.25 25 75 25 6.25
Diet Mixed 54.49 38.76 56.74 25.84 42.7 47.19
TABLE LEGEND: Bladder cancer =BL Ca, Breast cancer =BR Ca, prostate cancer =PCa, ovarian cancer = OV Ca, gastrointestinal tract cancer = GIT Ca.
Table 2. Multivariate Logistic Regression Results.
AOR CI Lower CI Upper P-value Model
Intercept 0.05 0.01 0.38 0.0037 Good_Knowledge
Gender 1.81 0.94 3.46 0.0751 Good_Knowledge
Educational_Level 0.99 0.54 1.82 0.9709 Good_Knowledge
Income_Level 1.14 0.87 1.5 0.3484 Good_Knowledge
Exercise_Habits 1.45 1.06 1.98 0.0207 Good_Knowledge
Intercept 0.03 0 0.22 0.0006 Positive_Attitude
Gender 2.56 1.3 5.01 0.0062 Positive_Attitude
Educational_Level 0.84 0.46 1.56 0.5864 Positive_Attitude
Income_Level 1.34 1.01 1.77 0.0395 Positive_Attitude
Exercise_Habits 1.58 1.15 2.17 0.0047 Positive_Attitude
Intercept 0 0 0.03 0 Correct_Perception
Gender 16.84 4.92 57.63 0 Correct_Perception
Educational_Level 1.28 0.54 3.02 0.5706 Correct_Perception
Income_Level 0.85 0.61 1.18 0.3179 Correct_Perception
Exercise_Habits 1.14 0.81 1.62 0.451 Correct_Perception
Table 3. Variable Coding for the models.
Predictor Coding Interpretation
Gender 1 = Male, 2 = Female (or binary: 0 = F, 1 = M)
Educational Level Ordinal (e.g., 0 = None, 1 = Primary, etc.)
Income Level Ordinal (e.g., 1 = Low, 2 = Medium, 3 = High)
Exercise Habits Ordinal (e.g., 0 = Never, 1 = Sometimes, etc.)
Table 4. Percentage gains post interventions (LIBOG and Talk).
Domain Group KAP LIBOG % Gain Talk % Gain
Gender Female Good Knowledge 11.76 7.32
Gender Male Good Knowledge 55.17 -13.36
Education Postgrad Good Knowledge -41.38 77.78
Education Primary Good Knowledge 58.3
Ethnicity Ga Good Knowledge 18.5 -13.33
Ethnicity Guan Good Knowledge 33.3
Residence Urban Good Knowledge -28.12 21.48
Residence Suburban Good Knowledge 0.16 19.87
Residence Rural Good Knowledge 32.03 -7.73
FMH Yes Good Knowledge 5.6 16.67
FMH No Good Knowledge -16.57 26.54
Gender Female Positive Attitude -20.33 26.41
Gender Male Positive Attitude 2.73 -19.58
Education Postgrad Positive Attitude -32.38 77.78
Education Primary Positive Attitude 66.7
Ethnicity Guan Positive Attitude 33.3
Ethnicity Northern Ghanaian Positive Attitude
Residence Urban Positive Attitude -4.84 0
Residence Suburban Positive Attitude 0 24.07
Residence Rural Positive Attitude 0 -14.2
FMH Yes Positive Attitude -19.4 8.33
FMH No Positive Attitude -15.84 16.21
Gender Female Positive Perception 4.64 11.5
Gender Male Positive Perception 32.43 -10.83
Education Postgrad Positive Perception 0
Education Primary Positive Perception 0 -33.3
Ethnicity Guan Positive Perception 0
Ethnicity Northern Ghanaian Positive Perception
Residence Urban Positive Perception 0 18.96
Residence Suburban Positive Perception 0 43.1
Residence Rural Positive Perception 0 12.6
FMH Yes Positive Perception -8.3 41.67
FMH No Positive Perception -5.44 24.83
Education Postgrad Negative Attitude -48.47 66.67
Education Primary Negative Attitude 33.3
FMH No Negative Attitude -6.66 7.93
FMH Yes Negative Attitude -5.6 0
Residence Rural Negative Attitude 0 -4.2
Residence Suburban Negative Attitude 0 40.73
Residence Urban Negative Attitude -3.63 0
Education Postgrad Negative Perception 0
Education Primary Negative Perception -33.4 -33.3
FMH No Negative Perception 11.5 7.89
FMH Yes Negative Perception 16.7 16.67
Residence Rural Negative Perception 0 12.6
Residence Suburban Negative Perception 0 43.1
Residence Urban Negative Perception 12 6.96
Education Postgrad Poor Knowledge -50.48 77.78
Education Primary Poor Knowledge 41.7
FMH No Poor Knowledge -21.9 12.07
FMH Yes Poor Knowledge 19.4 -8.33
Residence Rural Poor Knowledge 32.03 -7.73
Residence Suburban Poor Knowledge 23.24 -3.21
Residence Urban Poor Knowledge -8.28 -2.96
TABLE LEGEND: FMH = family history, HT = health talk. LIBOG = Literacy board game.
Table 5. Comparatives for the measures of central tendencies (mean, median, mode) and measures of dispersion (range and standard deviation) for all KAP baseline values and KAP changes across all the 14 sociodemographic and lifestyle factors studied after LIBOG and HT interventions.
Metric --- KNOWLEDGE --- Mean Median Mode Std Dev Range
Baseline_Good knowledge% 41.86 51.52 0 20.75 66.67
Baseline_Poor knowledge% 53.1 41.54 100 22.29 72.73
PostTalk_Good knowledge% 63.75 62.07 66.67 11.41 50
PostTalk_Poor knowledge% 7.31 0 0 15.13 37.5
Increase_Good knowledge levels_Talk 21.88 10.55 66.67 9.34 16.67
Decrease_Poor knowledge levels_Talk 45.79 41.54 100 7.16 35.23
Significant_Increase_Good knowledge levels_Talk z=3.10, p=0.002 z=1.51, p=0.132 z=10.00, p=0.000 z=-1.80, p=0.072 z=-2.39, p=0.017
Significant_Decrease_Poor knowledge levels_Talk z=7.05, p=0.000 z=7.24, p=0.000 z=14.14, p=0.000 z=1.30, p=0.194 z=5.01, p=0.000
Post-LIBOG_Good knowledge% 62 65.38 64.1 17.51 56.35
Post-LIBOG_Poor knowledge% 38 34.62 35.9 17.51 56.35
Increase_Good knowledge level_LIBOG 20.2 13.86 64.1 3.04 10.32
Decrease_Poor knowledge levels_LIBOG 15.1 7.12 64.1 19.95 16.38
Significant_Increase_Good knowledge_LIBOG z=2.85, p=0.004 z=1.99, p=0.047 z=9.71, p=0.000 z=-0.58, p=0.560 z=-1.50, p=0.134
Significant_Decrease_Poor knowledge_LIBOG z=2.14, p=0.032 z=1.01, p=0.314 z=9.71, p=0.000 z=0.85, p=0.397 z=2.42, p=0.015
Relative_Improvements; LIBOG/TALK 0.3 0.23 0.62 0.91 0.29
Significant_Difference in Improvements; LIBOG vs TALK z=-0.29, p=0.771 z=0.72, p=0.475 z=-0.38, p=0.702 z=-1.85, p=0.065 z=-1.31, p=0.189
Metric --- ATTITUDE --- Mean Median Mode Std Dev Range
Baseline_Good Attitude% 43.37 54.67 0 21.3 66.67
Baseline_Poor Attitude% 43.07 28.57 100 28.75 100
PostTalk_Good Attitude% 54.83 53.33 50 16.67 71.43
PostTalk_Poor Attitude% 7.42 0 0 16 50
Increase_Good Attitude levels_Talk 11.46 -1.34 50 4.63 4.76
Decrease_Poor Attitude levels_Talk 35.65 28.57 100 12.75 50
Significant_Increase_Good Attitude levels_Talk z=1.62, p=0.105 z=-0.19, p=0.849 z=8.16, p=0.000 z=-0.83, p=0.404 z=0.73, p=0.467
Significant_Decrease_Poor Attitude levels_Talk z=5.80, p=0.000 z=5.77, p=0.000 z=14.14, p=0.000 z=2.16, p=0.031 z=8.16, p=0.000
Post-LIBOG_Good Attitude% 60.75 60 100 32.09 77.78
Post-LIBOG_Poor Attitude% 39.25 40 0 32.09 77.78
Increase_Good Attitude level_LIBOG 17.38 5.37 100 10.79 -11.11
Decrease_Poor Attitude levels_LIBOG 3.82 -12.43 100 3.3 22.22
Significant_Increase_Good Attitude_LIBOG z=2.46, p=0.014 z=0.76, p=0.446 z=14.14, p=0.000 z=1.72, p=0.085 z=1.75, p=0.079
Significant_Decrease_Poor Attitude_LIBOG z=0.55, p=0.583 z=-1.70, p=0.089 z=14.14, p=0.000 z=-0.51, p=0.608 z=5.00, p=0.000
Relative_Improvements; LIBOG/TALK 0.16 1.74 2 0.6 -1.04
Significant_Difference in Improvements; LIBOG vs TALK z=1.19, p=0.233 z=3.38, p=0.001 z=8.16, p=0.000 z=1.63, p=0.102
Metric --- PERCEPTION --- Mean Median Mode Std Dev Range
Baseline_Good Perception% 35.38 40.95 0 21.33 100
Baseline_Poor Perception% 38.44 44.42 0 20.12 100
PostTalk_Good Perception% 58.59 64.29 50 17.43 71.43
PostTalk_Poor Perception% 13.15 0 0 27.47 28.57
Increase_Good Perception levels_Talk 23.21 23.34 50 3.9 0
Decrease_Poor Perception levels_Talk 25.29 44.42 0 5.35 0
Significant_Increase_Good Perception levels_Talk z=3.29, p=0.001 z=3.31, p=0.001 z=8.16, p=0.000 z=-0.70, p=0.485 z=-5.77, p=0.000
Significant_Decrease_Poor Perception levels_Talk z=4.09, p=0.000 z=7.56, p=0.000 z=0.00, p=1.000 z=-1.22, p=0.222 z=10.54, p=0.000
Post-LIBOG_Good Perception% 57.48 60 25 21.84 75
Post-LIBOG_Poor Perception% 42.52 40 0 21.84 75
Increase_Good Perception level_LIBOG 22.1 19.05 25 0.51 25
Decrease_Poor Perception levels_LIBOG 7.18 -4.42 0 -1.72 25
Significant_Increase_Good Perception_LIBOG z=3.13, p=0.002 z=2.69, p=0.007 z=5.35, p=0.000 z=0.09, p=0.930 z=-5.35, p=0.000
Significant_Decrease_Poor Perception_LIBOG z=-0.59, p=0.557 z=0.63, p=0.527 z=0.00, p=1.000 z=-0.30, p=0.765 z=5.35, p=0.000
Relative_Improvements; LIBOG/TALK 0.27 -0.08 -0.04
Significant_Difference in Improvements; LIBOG vs TALK z=-0.19, p=0.851 z=-0.74, p=0.458 z=-3.65, p=0.000 z=-1.63, p=0.103 z=5.35, p=0.000
TABLE LEGEND: HT = health talk. LIBOG = Literacy board game.
Table 6. Knowledge Domain: baseline, post-LIBOG and post-HT; mean, median, mode, range, standard deviation – and statistically significant differences.
Knowledge aggregate Metric Baseline Good (%) Post-Talk Good (%) Post-LIBOG Good (%) LIBOG Gain (%) Talk Gain (%) Relative Improvement LIBOG/HT LIBOG vs Talk Z-test
Mean 41.86 63.75 62.00 20.2 21.88 0.92 z = –0.29, p = 0.771
Median 51.52 62.07 65.38 13.86 10.55 1.31 z = 0.72, p = 0.475
Mode 0.00 66.67 64.10 64.1 66.67 0.96 z = –0.38, p = 0.702
Std Dev 20.75 11.41 17.51 3.04 9.34 0.33 z = –1.85, p = 0.065
Range 66.67 50.00 56.35 10.32 16.67 0.62 z = –1.31, p = 0.189
TABLE LEGEND: HT = health talk. LIBOG = Literacy board game.
Table 7. Attitude Domain: baseline, post-LIBOG and post-HT; mean, median, mode, range, standard deviation and statistically significant differences.
Attitude aggregate Metric Baseline Good (%) Post-Talk Good (%) Post-LIBOG Good (%) LIBOG Gain (%) Talk Gain (%) Relative Improvement LIBOG vs Talk Z-test
Mean 43.37 54.83 60.75 17.38 11.46 0.53 z = 1.28, p = 0.199
Median 54.67 53.33 60.00 5.37 –1.34 Undefined z = 1.57, p = 0.115
Mode 0.00 50.00 100.00 100.0 50.0 2.0 z = 3.85, p = 0.000
Std Dev 21.30 16.67 32.09 10.79 4.63 2.33 z = 0.95, p = 0.343
Range 66.67 71.43 77.78 –11.11 4.76 Negative z = –2.07, p = 0.038
TABLE LEGEND: HT = health talk. LIBOG = Literacy board game.
Table 8. Perception Domain: baseline, post-LIBOG and post-HT; mean, median, mode, range, standard deviation and statistically significant differences.
Perception aggregate Metric Baseline Good (%) Post-Talk Good (%) Post-LIBOG Good (%) LIBOG Gain (%) Talk Gain (%) Relative Improvement LIBOG vs Talk Z-test
Mean 35.38 57.48 58.59 25.29 7.18 0.53 z = -0.19, p = 0.851
Median 40.95 60 64.29 44.42 19.05 0.57 z = -0.74, p = 0.458
Mode 0 25 50 50 25 1 z = -3.65, p = 0.000
Standard Deviation 21.33 21.84 17.43 -3.9 0.51 -7.65 z = -1.63, p = 0.103
Range 100 75 71.43 -28.57 -25 -0.14 z = 5.35, p = 0.000
TABLE LEGEND: HT = health talk. LIBOG = Literacy board game.
Table 9. Table for intervention by Health Talk; aggregation of percentage improvements across 5 measures of central tendency and dispersion (mean, median, mode, range, standard deviation), across all three KAPS over the 14 socio-demographic parameters studied.
Attribute under consideration Improvement in positive attributes % Reduction in negative attributes % Final Totals and Averages%
Knowledge Total = 125.11, Average= 25.02% Total = 229.72, Average=45.94% (354.83; 35.48%)
Attitude Total = 69.51, Average= 13.90% Total = 226.97, Average= 45.39% (296.48; 29.64%)
Perception Total = 100.45, Average= 20.09% Total = 75.01, Average= 15.00% 175.46; 17.55%
Grand Total and Grand Average (295.07; 19.67%) (531.70; 35.45%) (826.79; 27.56%)
Table 10. Table for intervention by LIBOG aggregation of percentage improvements across 5 measures of central tendency and dispersion (mean, median, mode, range, standard deviation) , across all three KAPS, over the 14 socio-demographic parameters studied.
Attribute under Consideration Improvement in Positive Attributes % Reduction in Negative Attributes % Final Totals, and Averages%
Knowledge Total = 111.52, Average= 22.30% Total = 122.65, Average= 24.53% (234.17; 23.47%)
Attitude Total = 122.43, Average= 24.49% Total = 116.91, Average= 23.38% (239.34; 23.93%)
Perception Total = 91.66, Average= 18.33 Total = 26.04, Average= 5.21% (117.0; 11.77%)
Grand Total and Grand Average (325.61; 21.70%) (262.94; 17.53%) (588.56; 19.61%)
Table 12. The sub-domain statistics were as shown.
KAP Domain Wilcoxon W p-value n (pairs) Conclusion
Good Knowledge 18.0 0.6523 9 Not significant
Positive Attitude 5.0 0.0781 8 Not significant
Positive Perception 12.0 0.4609 8 Not significant
Disclaimer/Publisher’s Note: The statements, opinions and data contained in all publications are solely those of the individual author(s) and contributor(s) and not of MDPI and/or the editor(s). MDPI and/or the editor(s) disclaim responsibility for any injury to people or property resulting from any ideas, methods, instructions or products referred to in the content.
Copyright: This open access article is published under a Creative Commons CC BY 4.0 license, which permit the free download, distribution, and reuse, provided that the author and preprint are cited in any reuse.
Prerpints.org logo

Preprints.org is a free preprint server supported by MDPI in Basel, Switzerland.

Subscribe

Disclaimer

Terms of Use

Privacy Policy

Privacy Settings

© 2026 MDPI (Basel, Switzerland) unless otherwise stated