Submitted:
12 August 2025
Posted:
14 August 2025
You are already at the latest version
Abstract
Purpose: We describe the development and the new features available in an open-source electronic system to record patient-reported outcomes (PRO). Methods After a careful review of the existing software featureset and the requirements, we developed a new application from scratch using the Django Framework. This application can be hosted on any standard web server in a hospital and allows patients and providers to use electronic PROs in routine clinical practice as well as research setting.Results: The CHAVI PROM application uses a database model which follows the way PRO questionnaires are designed. Unlike the previous application, where questionnaires were defined first, the CHAVI PROM application starts with the specification of the constructs. Each construct can have multiple items, and each item can be a part of various questionnaires. This allows the application to build up an item bank. Complex equations can be used to calculate the scores for the constructs as the patients respond to questionnaires. A new patient portal and a dedicated PRO review page have been developed. These display the responses provided by the user along with a highly flexible and longitudinal overview of the patients’ responses over time. A unique system for displaying aggregated responses is also made available in addition to textual summaries of why a change is considered as a deterioration. Conclusion: This open-source application will encourage the adoption of routine assessment of PROM in diverse healthcare systems.
Keywords:
patient reported outcomes
; electronic patient reported outcomes
; open source
; Python
; Django
Introduction
In 2022, we described the development and user experience testing of an open-source system for the collection and use of electronic patient-reported outcomes (PRO) [1]. This open-source system was built using Drupal - https://drupal.org. The system focused on providing users with an easy-to-use interface for adding PRO measures (usually in the form of questionnaires), add relevant translations and responding to these questionnaires on any electronic device. Additionally, the system allowed healthcare providers with an interface to see these responses. The said system has been deployed at our centre since 2022 and has been under continuous operation over the last 3 years. As of 12th August 2025, the system has been used to administer 2442 unique electronic PRO assessments for 305 patients across four different cancer sites (head and neck, lung, cervix, and endometrium).
However, several important shortcomings were identified during this period. The system for designing the dashboard for reviewing the PRO results was manual and required an experienced user to set up views and then place these views on the pages. Although it was possible to do this using a GUI, it still required an intimate knowledge of Drupal’s views and page to set up the dashboard. Given the limitation of the database design of the Webform module it was difficult to perform aggregation across multiple questionnaires. Most importantly, the plots generated were quite limited in functionality, and it was difficult to provide additional information on the plots like normative scores, threshold scores, etc, as well as statistical summaries. Integration with advances like computerised adaptive testing was also tricky. In light of these modifications, we planned a complete rewrite of the system. The present communication details the key features incorporated in the new PRO system, which we call CHAVI PROM.
Methods
We reassessed the software stack required for the features and outlined a dedicated database model for the application. Given the limitations of the Drupal based application, we decided to develop the application using Django [2]. One of the key reasons behind this choice was that this Python framework would allow us to integrate advanced aggregation and modelling systems using Python in the future. Additionally, Django provides an integrated object relationship mapping (ORM) system and a full-fledged administrative interface, which simplifies backend design significantly. A new codebase was created, and a development plan was outlined with the required feature list for the application. To keep the application modular, separate modules for handling patients, providers and PRO were developed. The new features in the system are summarised in the results.
Results
Database Design
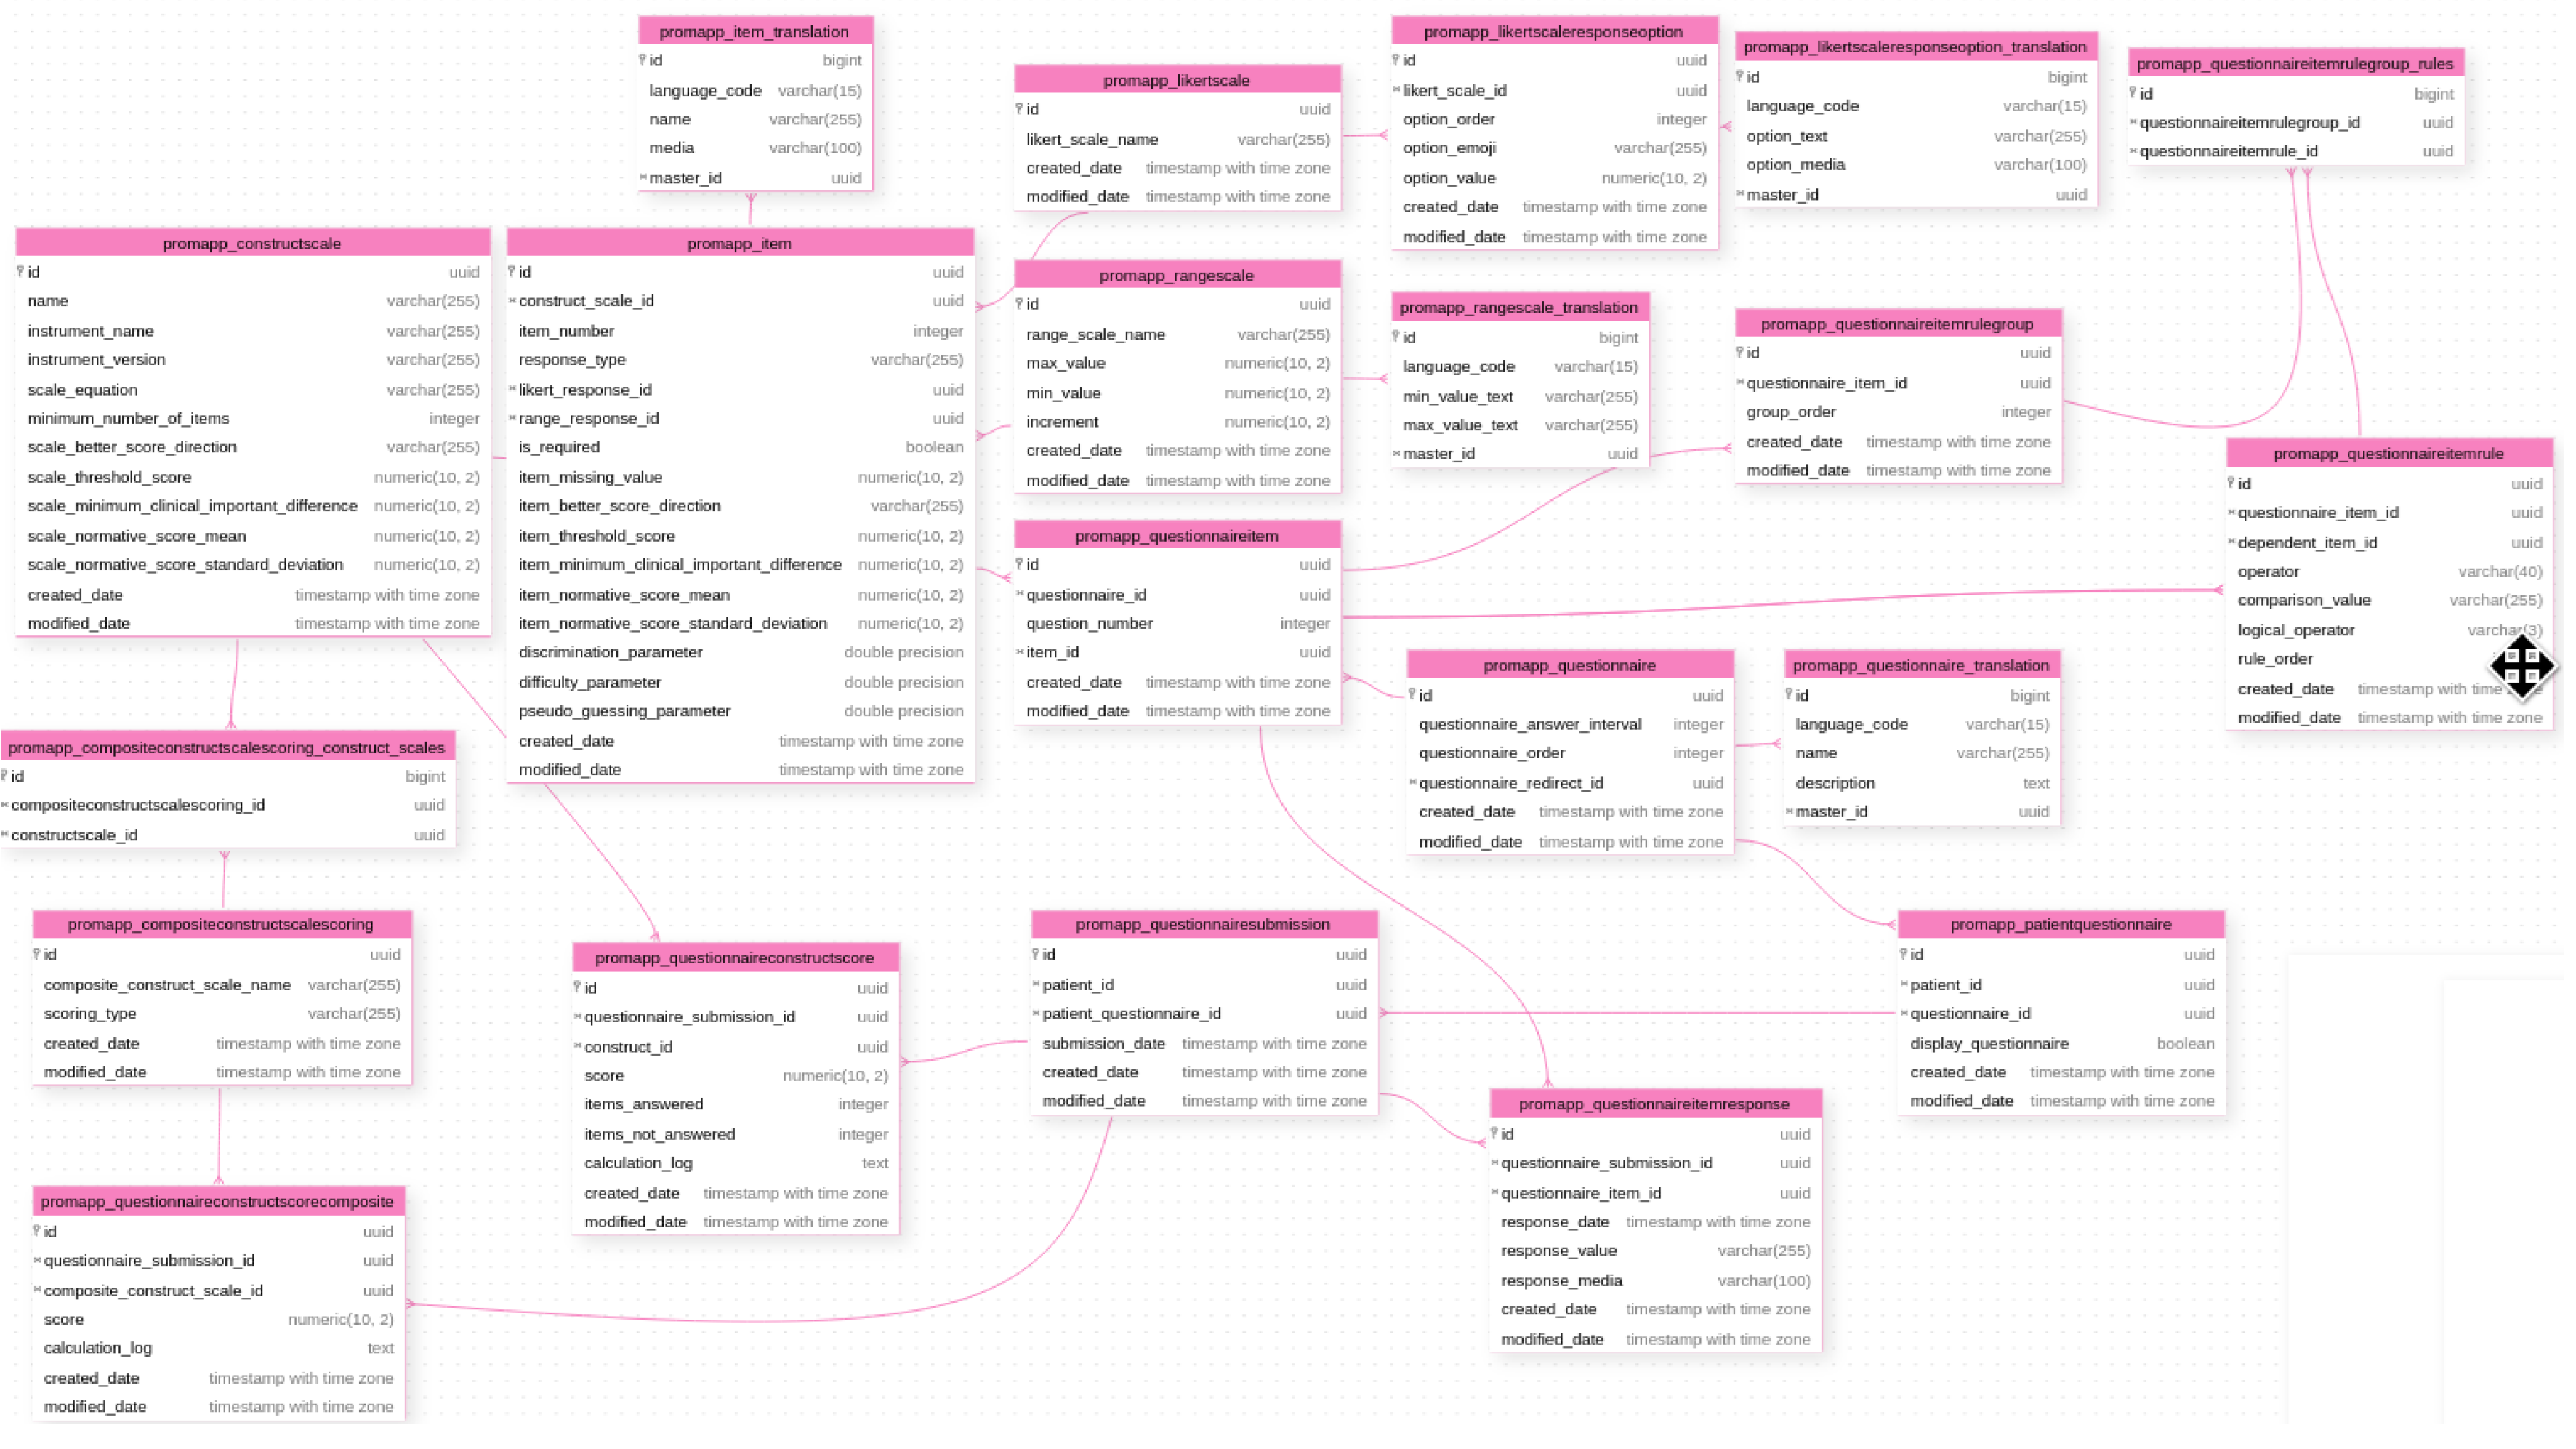
The underlying principles behind the development of quality of life questionnaires were kept in mind while designing the database. Unlike the previous system, where the users specified questionnaires first and then added items (questions) to the questionnaire, in the CHAVI PROM application, the user starts out by defining the Construct which measures the latent trait. Each construct is related to one or many items and each item in turn can be used in one or many questionnaires. As the system is envisaged as a separate system from the hospital medical records, we have ensured that patient information, such as name, unique ID, date of registration, and other important dates, is encrypted at storage in the database. The complete ERD diagram for the database design of the application is provided in Figure 1. PostgreSQL (https://www.postgresql.org/) is the recommended database for the application given its flexibility, stability and rich feature list.
Figure 1.
Entity Relationship Diagram of the CHAVI PROM application for the PROM Application. Relationships with other models can be visualized in the application.
Figure 1.
Entity Relationship Diagram of the CHAVI PROM application for the PROM Application. Relationships with other models can be visualized in the application.
Frontend Design
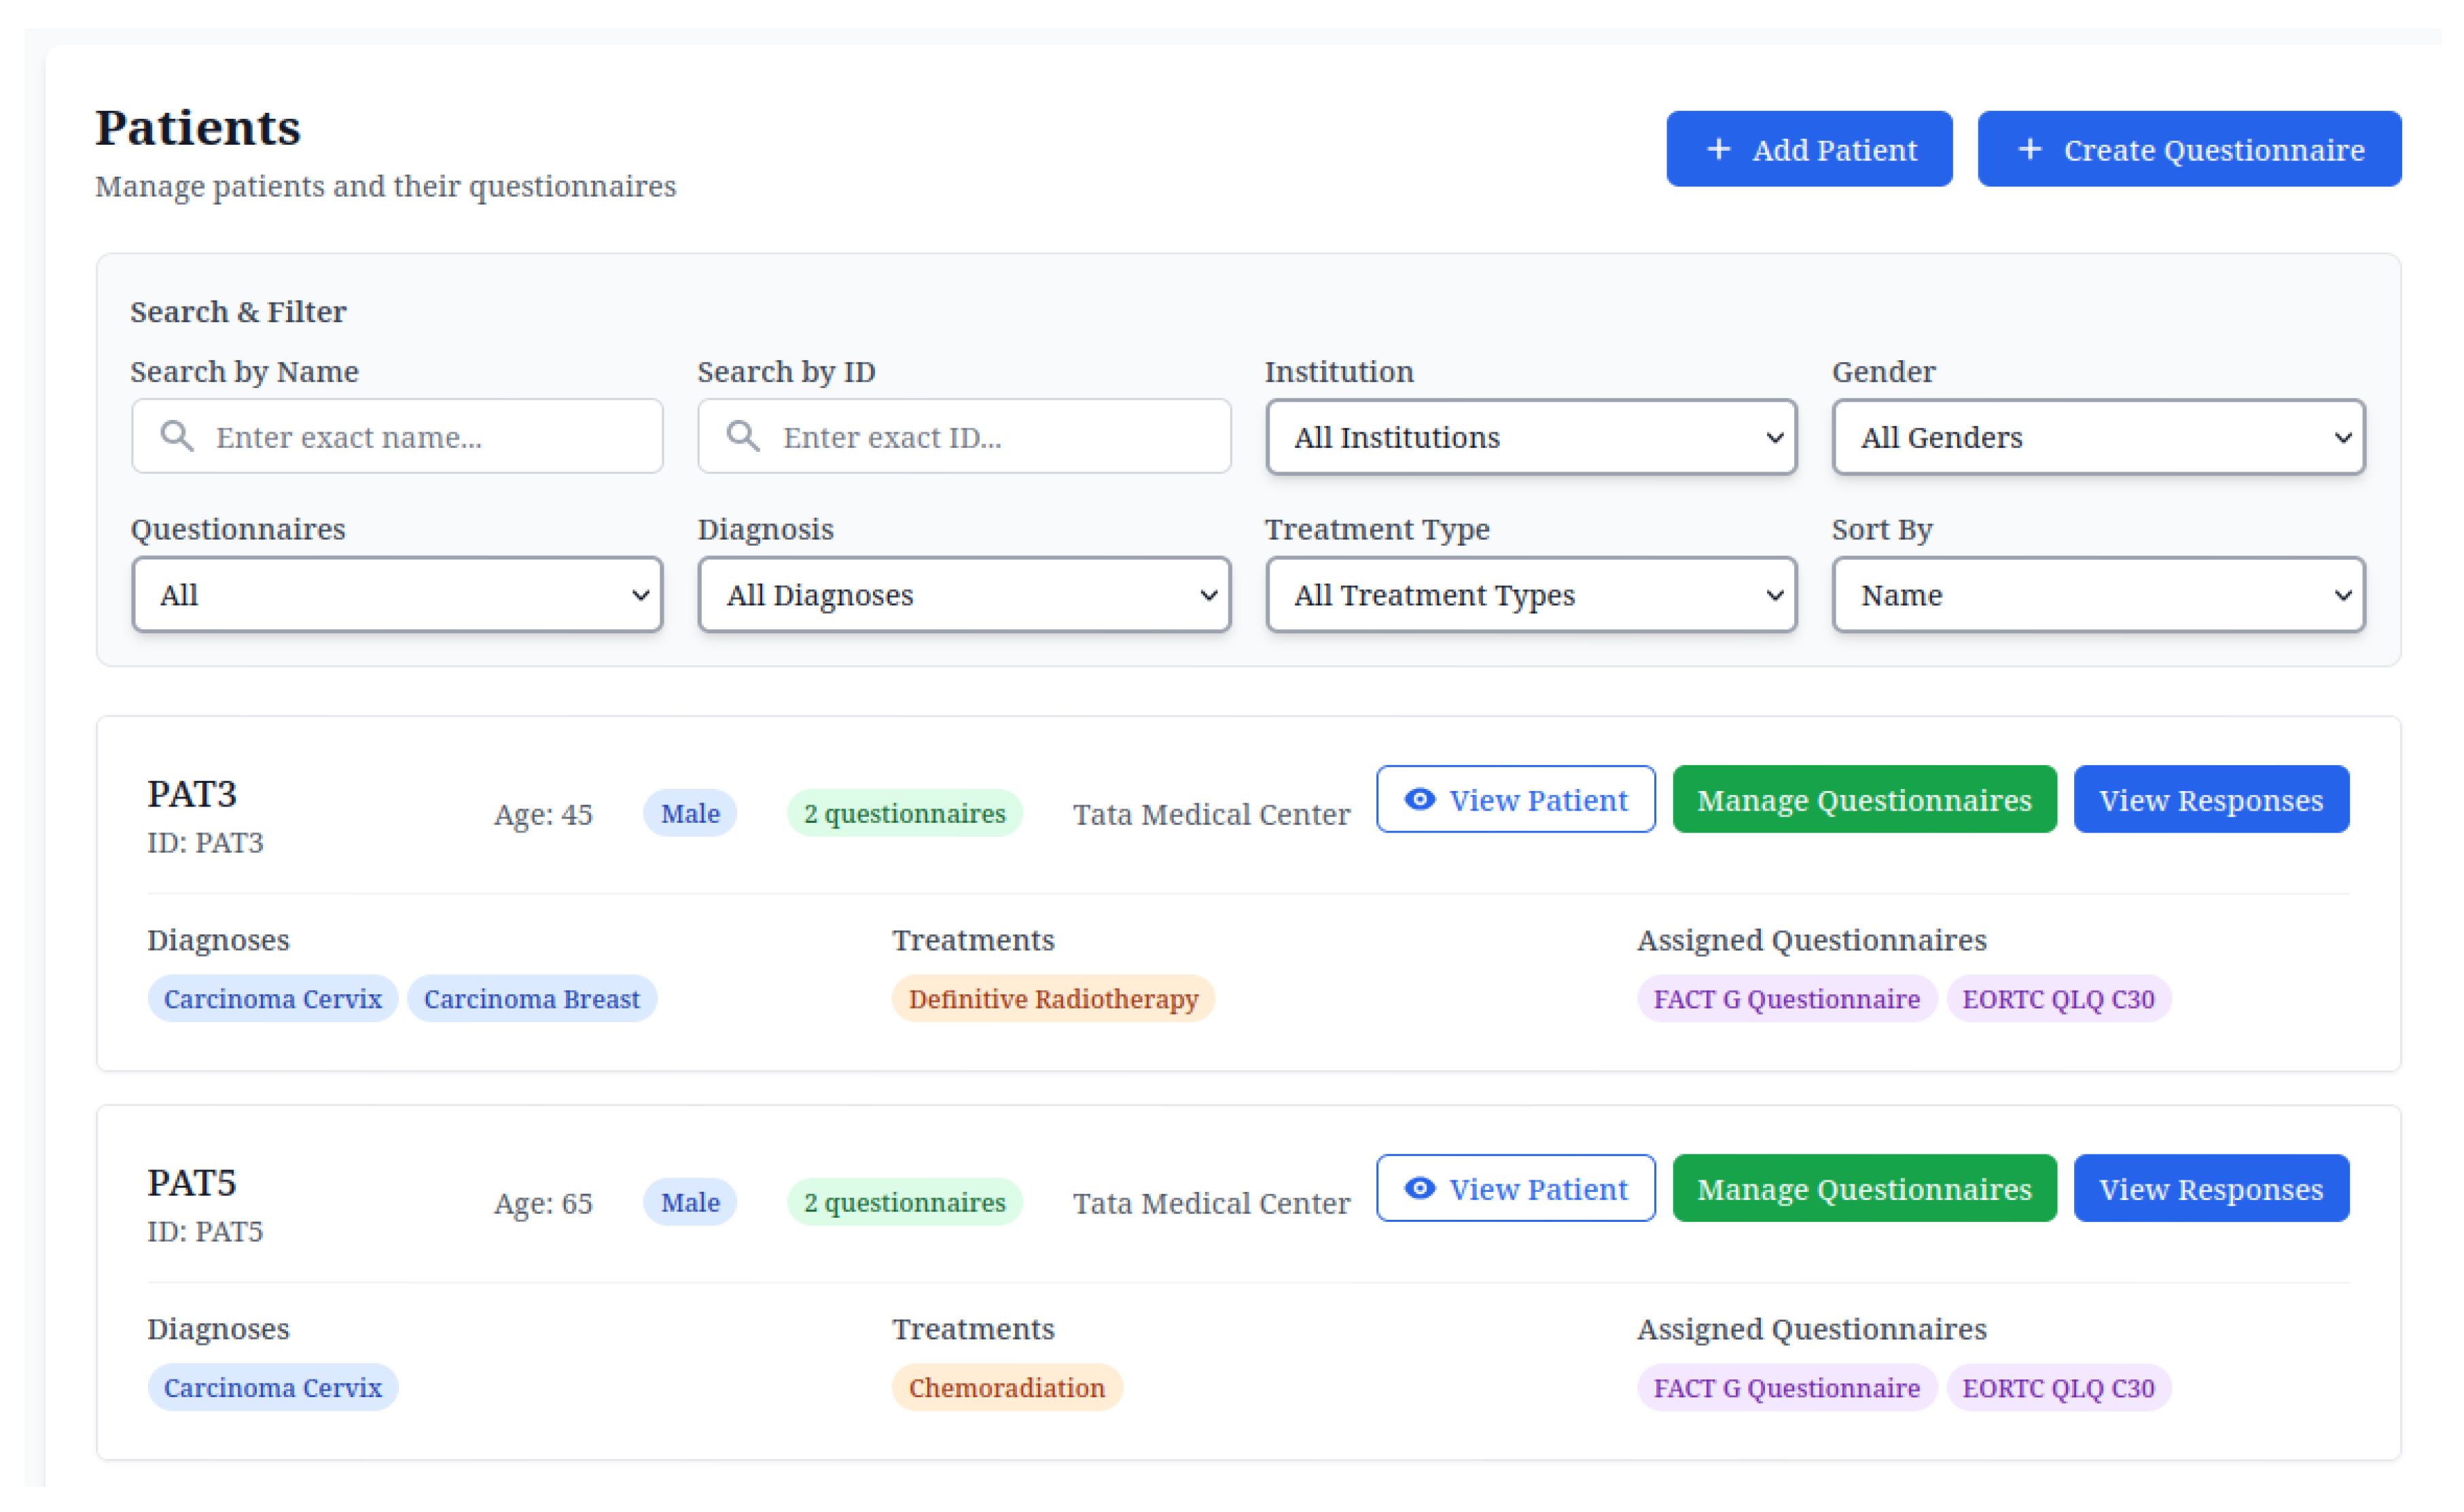
The entire frontend was designed using Django templates. We have used Tailwind CSS for consistent styling and HTMX for providing interactivity. Django Cotton was used for developing front-end components like buttons, dropdowns etc, giving a consistent look and feel for the entire application. A neutral cool blue colour scheme was chosen (Figure 2). A completely new item type called media was added, which allows patients to record their voice and video.
Figure 2.
Example of application frontend showing the patient list view and the unified styling used in the application.
Figure 2.
Example of application frontend showing the patient list view and the unified styling used in the application.
Detailed Construct and Item Definition
Users can now specify the direction which indicates an improvement when creating the construct and item. Additionally, it is possible to define threshold scores, mean normative scores, standard deviation of the normative score and minimum significant difference when new constructs and items are added. Once specified, these values are used to provide guidance when reviewing the responses. For each item, response types can be selected. Currently, the system provides the user to choose the following types of reactions: Text, Numeric, Likert, Range, and Media.
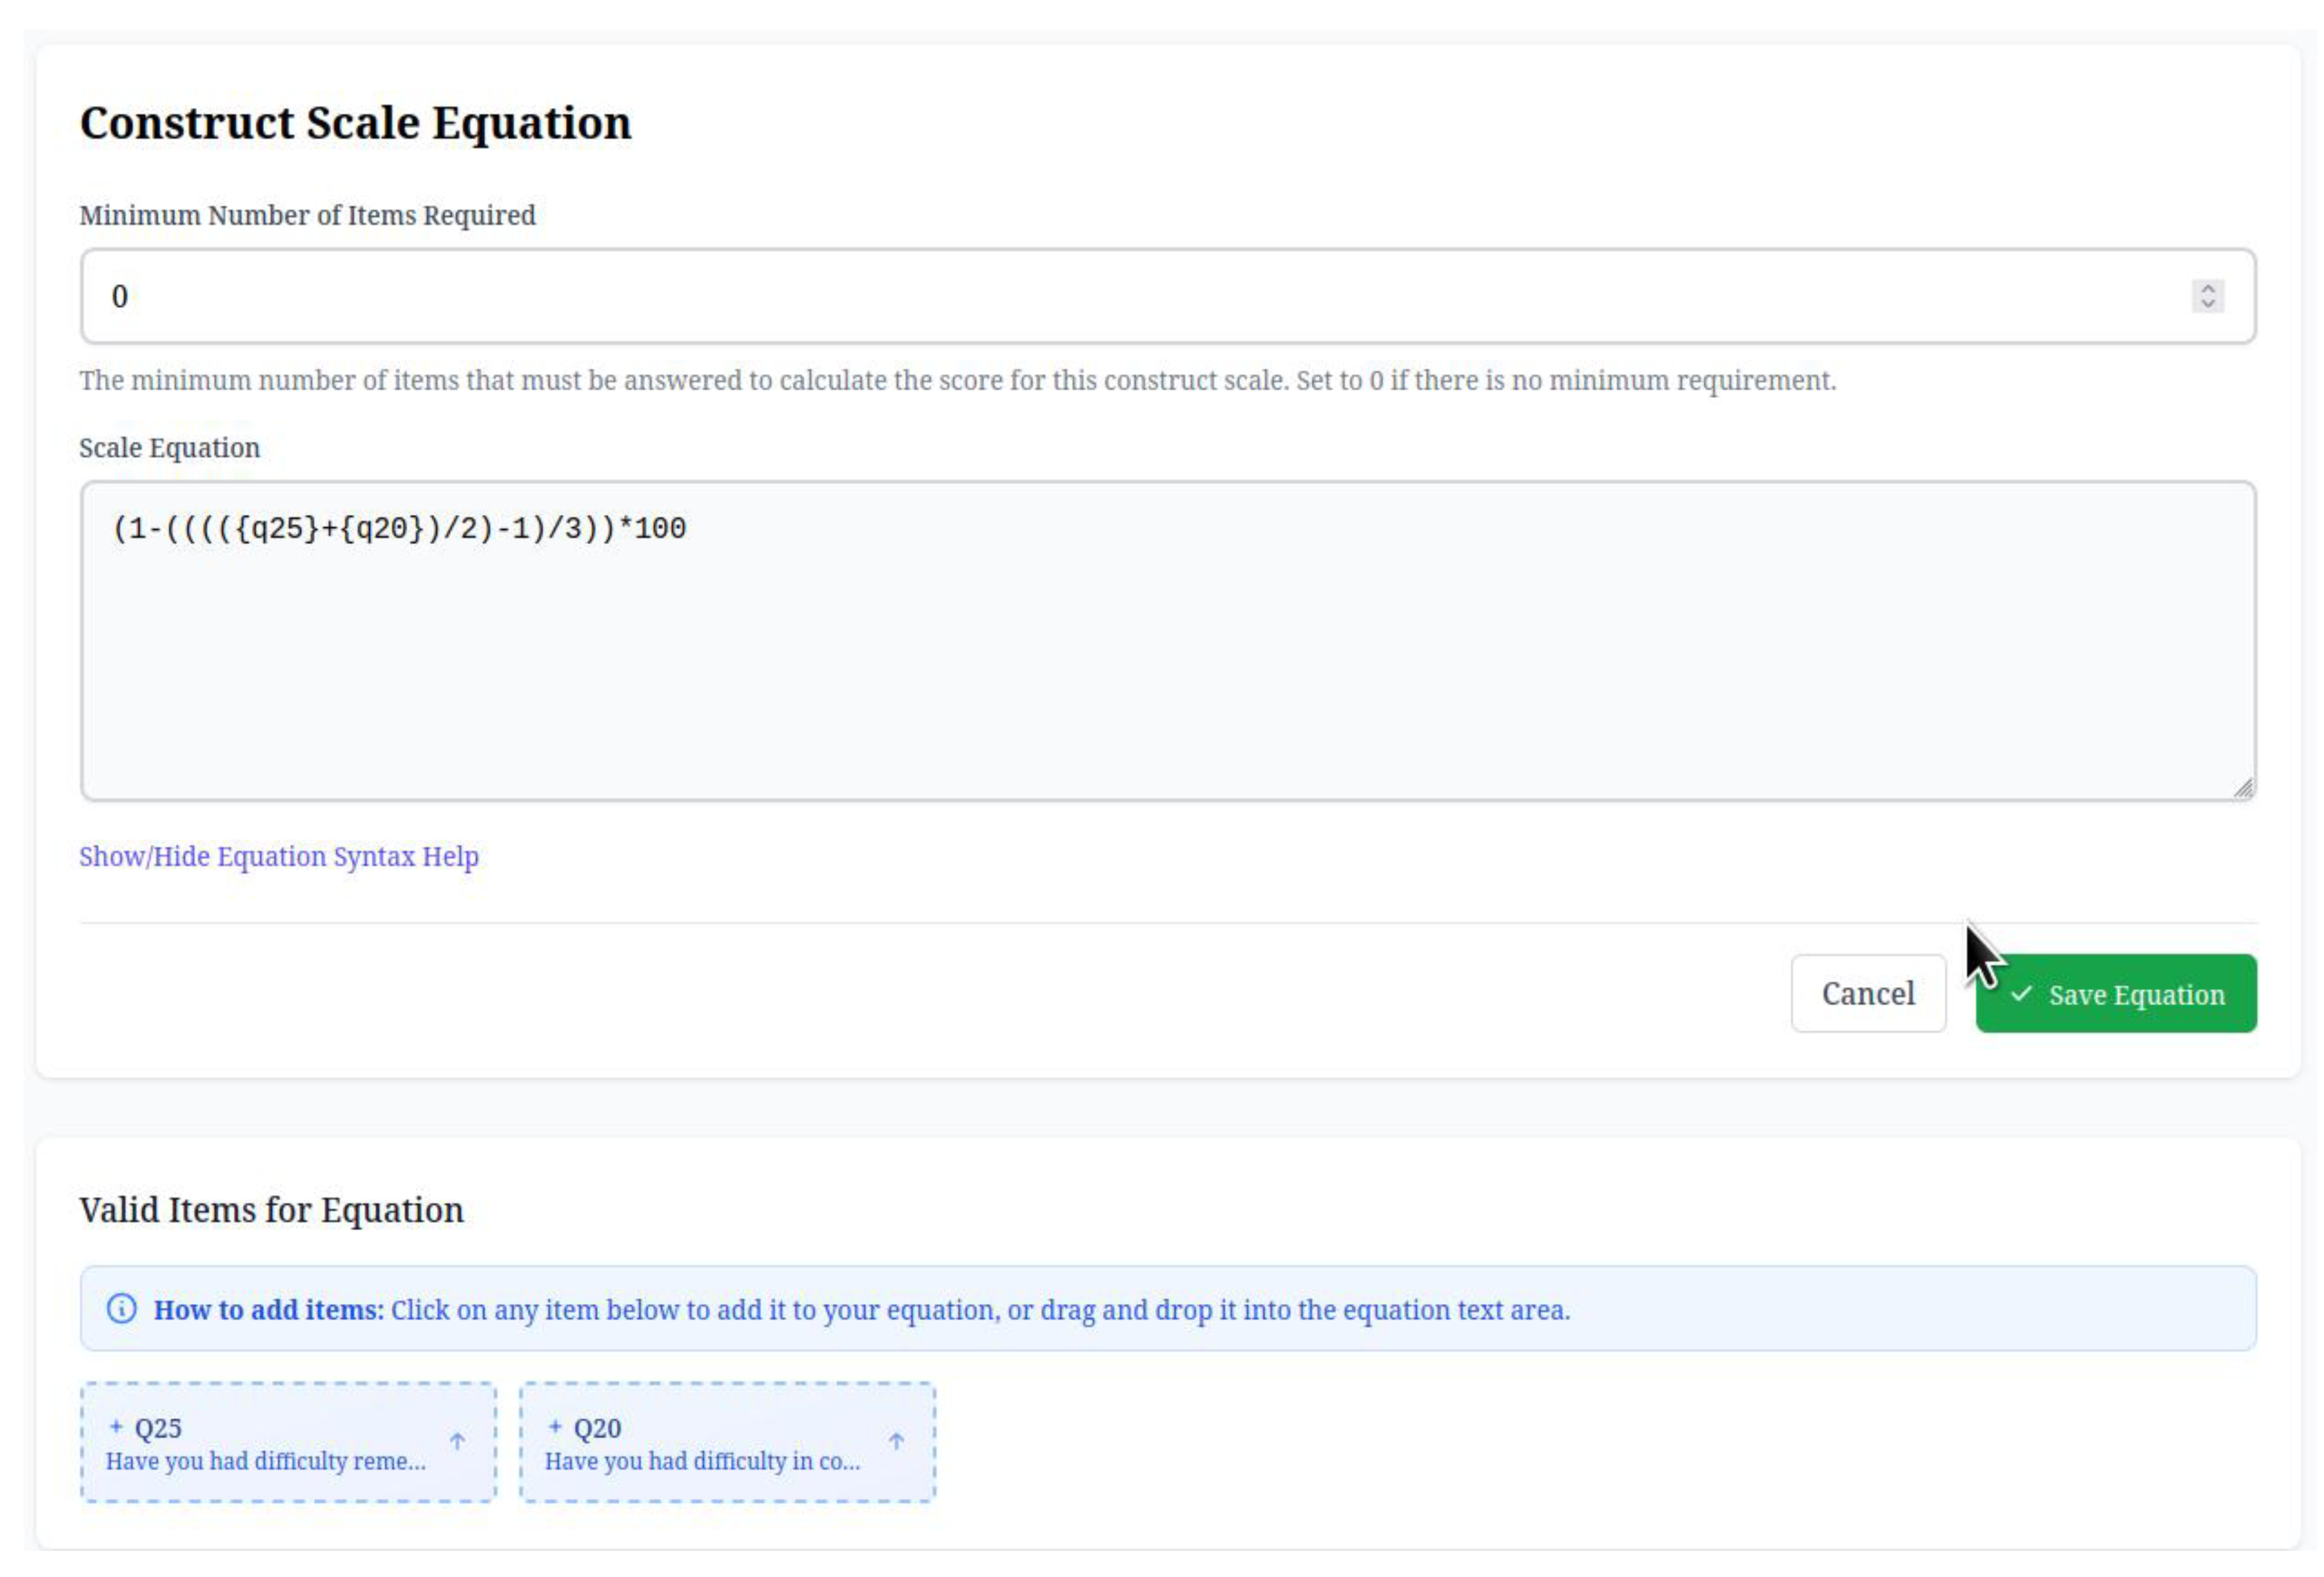
Equation Editor for Constructs
Instruments used for the evaluation of PRO have complex scoring methods for constructs. Hence, a dedicated module for parsing and validating equations was developed using the Lark parser. The equation editor (Figure 3) allows users to specify arithmetic and logical operators for determining the equation. Multiline equations can be selected along with if-else statements. A test script is also created to validate the equation editor results. The user interface automatically displays all the available items for a given construct and allows only the use of valid items with response types like Likert, numeric or range responses. Text or media type responses are not evaluated using the equation editor.
Figure 3.
Equation Editor for construct scores. The equation parser parses the provided equation and ensures that the end user is able to enter a valid equation only. The said equation is used for computing the construct scores when the patient submits a response to a questionnaire.
Figure 3.
Equation Editor for construct scores. The equation parser parses the provided equation and ensures that the end user is able to enter a valid equation only. The said equation is used for computing the construct scores when the patient submits a response to a questionnaire.
Composite Construct Scores
Some PRO instruments have composite scores calculated from several constructs. An example is the Functional Assessment of Cancer Therapy (FACT) Trial Outcome Index (FACT TOI) used in the FACT B questionnaire. This composite score is a summation of the FACT physical well-being, social well-being and breast cancer subscale scores [2,3]. Users can combine the values of multiple construct scores using arithmetic operators or by measures of central tendency like mean and median. These composite scores are specified using a many-to-many database relationship, allowing the same construct score to be used for calculating multiple composite scores.
Review
The database architecture allowed us to develop a rule-based system for displaying patient responses. The review page now has a section called topline results, which shows the constructs where the score indicates a worse outcome for the patient. In addition to the latest response, a longitudinal display of scores is available. Interactive line plots are created using Bokeh (Figure 4). Color blind friendly palettes have been used for the plots.
Figure 4.
Display of construct scores and Item responses. Construct score line plot (on the left) shows the current score with an icon indicating the direction of change in the score (red color indicating that the decline indicates a worse outcome). The bold black line represents the patient’s score over a period of 16 weeks (the date of start can be flexibly defined - in this plot it is defined with respect to the date of registration). Mean normative scores and 1 standard deviation are displayed with a blue color on the plot. The dotted lines with error bars represent the aggregated values for the other patients at the same time point from their respective dates of registration. On the right we show the specialized display for likert items where the ordinal nature of the display is emphasized using a sequential viridis color palette. The color palette automatically adjusts the colors based on the number of response categories and darker colors indicate a worse response.
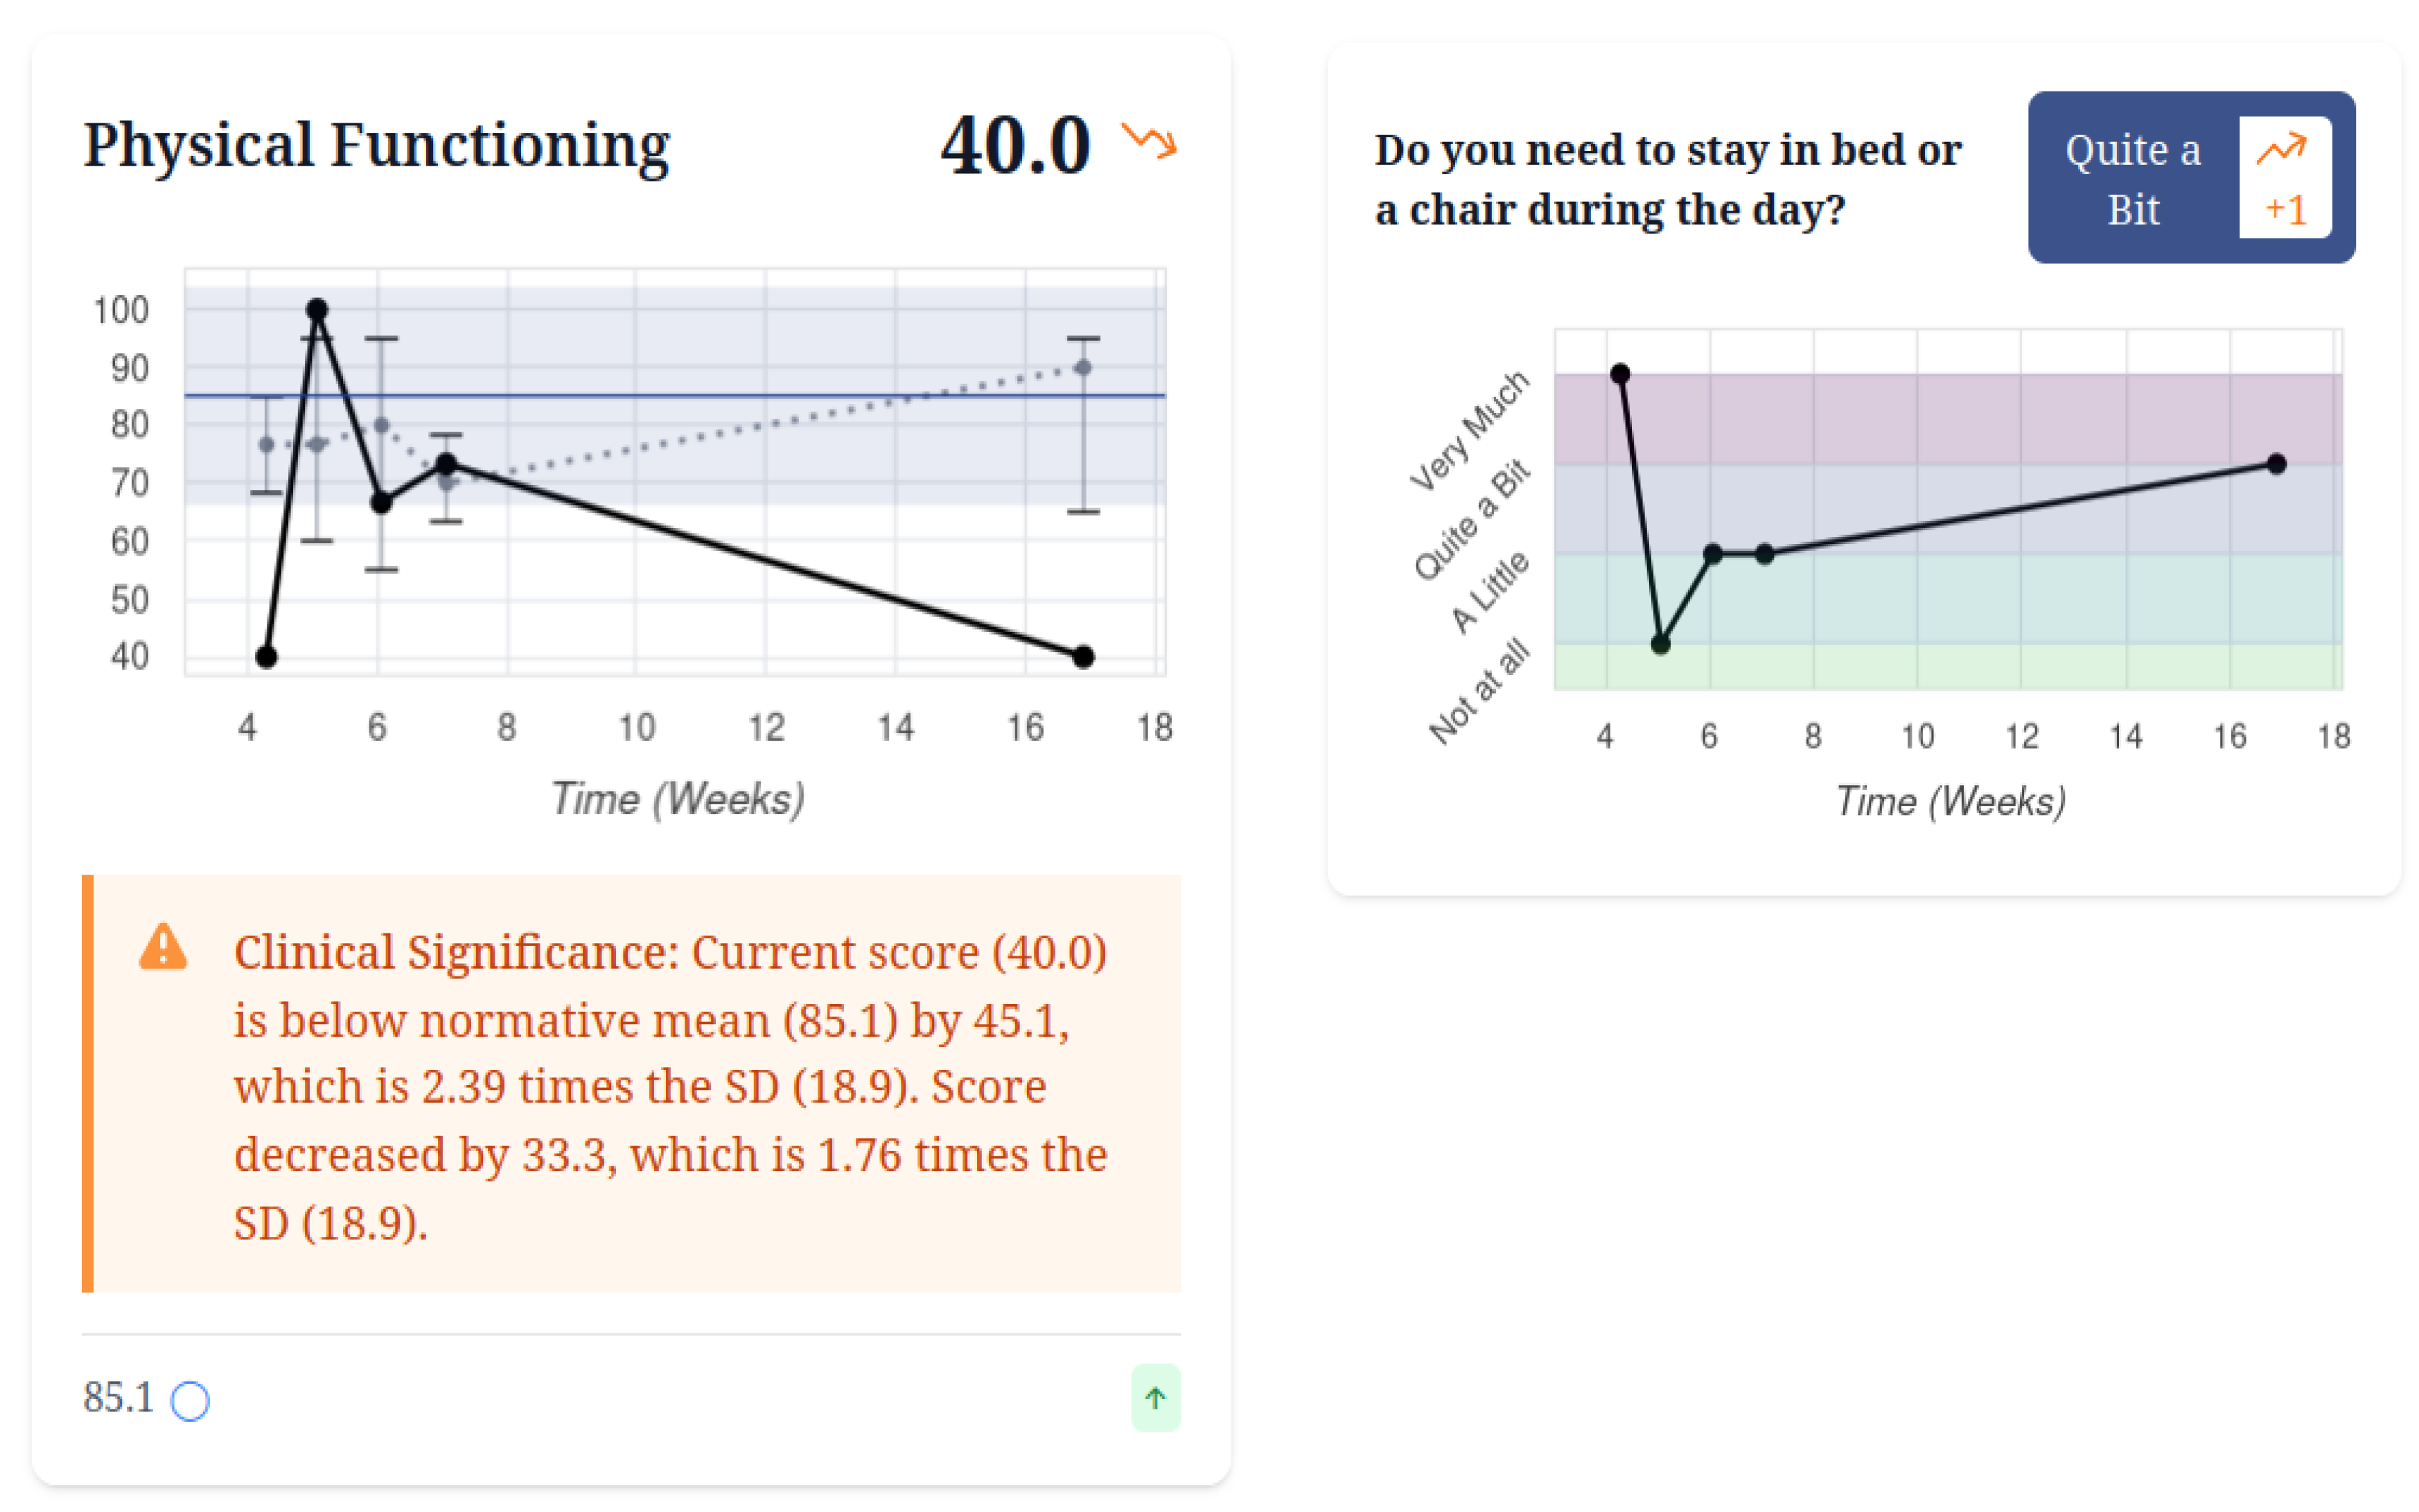
A significant advance is the integration of aggregated scores in the plots. These aggregated scores are calculated based on the responses available for other patients for the same construct. Users are shown a clear indicator of why a score change for a construct is clinically significant. Users can choose to display a variety of aggregations, e.g. Median with interquartile range (default), mean with 95% confidence intervals and mean with standard deviation. SciPy and Pandas are used to calculate these aggregated statistics.
Patient Portal
A dedicated patient portal has been designed which allows patients to review their responses. The patient portal shows the responses to the individual items and allows the users to be active participants in the system.
Discussion
While there are several commercial e-PRO systems available, none have been developed in LMIC, and very few focus on providing all the features described above. Some examples are: Assessment Centre (NIH) [4], Ayva (Bravado Health) [5], EPIC (EPIC Systems Corporation) [6], Patient IQ (PatientIQ) [7], CHES platform (Evaluation Software Development) [8]. Particularly, we are unsure if any of the commercial systems offer the facility for displaying aggregated responses in the granular detail that this application has. None of these applications are available free of cost - an important consideration when constrained healthcare systems with limited funds are considered, except an open-source project called openPRO; however, it has seen limited development over the past few months (19).
We have developed an improved version of the PRO system with several advanced features, including display of aggregated responses. Two-factor authentication and data encryption at storage are two new security features that have been added to strengthen the inherent security provided by the Django framework. The system has been released under a permissive open source Apache 2.0 licence at (https://github.com/CHAVI-India/chavi-prom).
Statement of Informed Consent
Not applicable for describing the development of software.
Statement of Human and Animal Rights
Not applicable for this manuscript.
Conflicts of Interest
The first author has received a research grant from ASCO for the evaluation of this software in an ongoing clinical trial. However, no funding was obtained for the development of the software itself. No other conflicts of interest to declare.
References
- Chakraborty S, Mallick I, Bhattacharyya T, Singh MA, Achari RB, Chatterjee S. Development and user experience testing of an electronic system for routine collection and use of electronic patient-reported outcome measures. Health Technol 2022, 12, 443–52. [Google Scholar] [CrossRef]
- Django. Django Software Foundation; 2025.
- Brady MJ, Cella DF, Mo F, Bonomi AE, Tulsky DS, Lloyd SR, et al. Reliability and validity of the Functional Assessment of Cancer Therapy-Breast quality-of-life instrument. J Clin Oncol 1997, 15, 974–86. [Google Scholar] [CrossRef] [PubMed]
- Assessment Center, n.d. https://www.assessmentcenter.net/. (accessed on 7 April 2020).
- Ayva - Bravado Health, n.d. https://www.bravadohealth.com/ayva/. (accessed on 7 April 2020).
- About Us | Epic, n.d. https://www.epic.com/about. (accessed on 7 April 2020).
- PatientIQ, n.d. https://www.patientiq.io/. (accessed on 7 April 2020).
- PRO monitoring, n.d. https://ches.eortc.be/cms/routine.php. (accessed on 13 April 2020).
Disclaimer/Publisher’s Note: The statements, opinions and data contained in all publications are solely those of the individual author(s) and contributor(s) and not of MDPI and/or the editor(s). MDPI and/or the editor(s) disclaim responsibility for any injury to people or property resulting from any ideas, methods, instructions or products referred to in the content. |
© 2025 by the authors. Licensee MDPI, Basel, Switzerland. This article is an open access article distributed under the terms and conditions of the Creative Commons Attribution (CC BY) license (https://creativecommons.org/licenses/by/4.0/).
Copyright: This open access article is published under a Creative Commons CC BY 4.0 license, which permit the free download, distribution, and reuse, provided that the author and preprint are cited in any reuse.


