Submitted:
04 August 2025
Posted:
06 August 2025
You are already at the latest version
Abstract
Gully erosion, driven by the interplay of natural processes and human activities, results in severe soil degradation and landscape alteration, yet approaches for accurately quantifying erosion triggered by extreme precipitation using multi-source high-resolution remote sensing remain limited. This study first extracted digital surface models (DSM) for the years 2014 and 2024 using Ziyuan-3 and GaoFen-7 satellite stereo imagery, respectively. Subsequently, the DSM was calibrated using high-resolution unmanned aerial vehicle photogrammetry data to enhance elevation accuracy. Based on the corrected DSMs, gully erosion depths from 2014 to 2024 were quantified. Erosion patches were identified through a deep learning framework applied to GaoFen-1 and GaoFen-2 imagery. The analysis further explored the influences of natural processes and anthropogenic activities on elevation changes within the gully erosion watershed. Topographic monitoring in the Sandu River watershed revealed a net elevation loss of 2.6 m over 2014–2024, with erosion depths up to 8 m in some sub-watersheds. Elevation changes are primarily driven by extreme precipitation-induced erosion alongside human activities, resulting in substantial spatial variability in surface lowering across the watershed. This approach provides a refined assessment of the spatial and temporal evolution of gully erosion, offering valuable insights for soil conservation and sustainable land management strategies in the Loess Plateau region.
Keywords:
stereoscopic imagery
; UAV LiDAR
; soil erosion
; extreme runoff events
; high resolution
1. Introduction
Soil erosion is one of the most severe environmental challenges across the globe [1]. External forces such as anthropogenic disturbances, hydraulic and wind actions cause the detachment and transport of surface soil, directly leading to land resource degradation [2]. Moreover, soil erosion reduces carbon storage, thereby contributing to climate warming. Its socio-economic consequences are profound, particularly for rural communities dependent on agriculture, where it exacerbates vulnerability and poverty. Gully erosion represents one of the most conspicuous forms of soil erosion [3], characterized by its sudden onset, destructive impact, and irreversibility. Beyond causing the loss of arable land and ecosystem degradation, gully erosion can also trigger secondary hazards such as landslides and debris flows [4]. Therefore, accurate and systematic identification and quantification of gully erosion are critical for land resource conservation and the sustainable development of ecological environments.
Changes in rainfall characteristics, including rainfall amount, rainfall intensity, and rainfall spatial-temporal distribution, directly affect the process of runoff and soil erosion. Ongoing warming has increased water-holding capacity of the atmosphere, which contributes to changes in precipitation patterns and intensity [5]. The frequency and severity of extreme rainfall events have intensified significantly in recent years [6]. Saturation excess runoff, induced by long-duration and low-intensity rainfall, contribute significantly to soil erosion, particularly under conditions of bare soil surfaces or shallow soil layers [7]. Excess surface runoff, induced by extreme rainfall events, can remove nutrient-rich topsoil, depleting organic matter and essential minerals, thereby accelerating soil erosion [8]. In most climatic zones (especially in warm-humid areas), high-intensity and short-duration rainfall is more frequent than long-duration rainfall. High-intensity rainfall may induce a shift in runoff generation from saturation-excess dominated to infiltration-excess dominated [9]. Infiltration excess runoff accumulates and removes the soil from narrow channels to considerable depths, resulting in gully erosion [10]. Increasingly frequent rainfall events can accelerate gully erosion rates, with mega-gulling showing drastically increase under high-magnitude rainfall events [11]. Under extreme rainfall conditions, severe rill erosion and dense rill networks provide abundant concentrated flows and sediments for ephemeral and permanent gully formation, resulting in serious gully erosion and threatening watershed geomorphology [12]. Although the severity of runoff and erosion driven by rainfall extremes is mediated by vegetation, high-intensity and short-duration rainfall events can induce severe runoff and soil loss under all vegetation types [13,14]. Therefore, quantifying extreme rainfall-induced erosion risks is vital for understanding climate threats to ecological security and guiding targeted soil conservation strategies.
Gully erosion estimation has transitioned from conventional field-based surveys to geoinformatics-driven remote sensing approaches, with the advancement of remote sensing technologies [15]. Remote sensing-based estimation methods have gained widespread acceptance due to their robustness, cost-efficiency, and high accuracy, significantly facilitating soil erosion assessments over extensive spatial scales, particularly in remote or inaccessible regions [16]. Technological advancements have driven a shift in medium-resolution imagery applications (e.g., Landsat, Sentinel) from initial reliance on visual interpretation and terrain indices to the widespread adoption of object-based image analysis and machine learning algorithms [17,18,19,20,21]. Nevertheless, medium-resolution imagery remains insufficient for accurately capturing the morphological information of gully erosion [22]. Consequently, recent research has increasingly focused on high-resolution imagery (sub-meter to meter scales), which enables more precise detection and classification of various gully erosion [23]. Although high-resolution imagery has enhanced gully erosion detection, current technologies continue to face significant challenges, such as missing three-dimensional structural parameters and inadequate multi-source data integration. Addressing these limitations necessitates the development of a synergistic estimation framework that leverages high-resolution imagery. In this regard, domestically developed satellites demonstrate distinct advantages. The GaoFen7 satellites, China’s first equipped with laser altimetry, offers 1:10,000-scale stereoscopic mapping capabilities that provide critical support for estimating gully erosion depth. The GaoFen1 and GaoFen2 satellites supply 2-meter (0.8 m) panchromatic and 8-meter (3.2 m) multispectral imagery, which effectively facilitate the extraction of gully erosion patches. Additionally, the Ziyuan-3 satellite (2.1-meter panchromatic) enables dynamic monitoring of gully erosion length and area. Therefore, integrating high-resolution data from GaoFen1, GaoFen2, GaoFen7, and Ziyuan-3 satellites into a multi-source collaborative estimation system establishes a more robust technical foundation for the accurate identification and continuous monitoring of gully erosion.
The Loess Plateau, spanning the middle and upper reaches of the Yellow River in North China, covers 6.6 % of the land yet sustains 8.5 % of the population in China [24]. As one of the planet’s most severely eroded regions, gully erosion alone generates more than 70 % of hillslope erosion and about half of total sediment loss [12,25]. Ecological restoration programmes, most notably the 1999 Grain-for-Green Project, have raised vegetation cover from 32 % in 1999 to 63 % in 2018, effectively mitigating gully incision [26]. Nevertheless, heavy rainfall events caused by climate change increasingly challenge these gains. Gully erosion is readily activated when rainfall intensity, duration, accumulated volume, or previous rainfall reach critical thresholds [27,28]. Frequent short-duration rainstorms between July and September in the Loess Plateau often trigger extreme erosion [29,30], seriously undermining the stability of the basin’s geomorphology [31,32]. The Loess Plateau in central Gansu Province serves as a typical region characterized by a high density of gullies and significant cutting depth. Among these regions, gully erosion is particularly severe in the Sandu River watershed, located in the hilly and dissected terrain of the Loess Plateau, where rainstorms are concentrated and intense during the rainy season.
Soil erosion poses a significant threat to ecosystem sustainability and agricultural productivity, particularly in sensitive regions like the Sandu River watershed, where complex terrain and intensified human activities accelerate land degradation. This study presents an integrated framework for quantifying gully erosion dynamics by synergizing multi-source remote sensing data and deep learning techniques. First, we generate an initial digital surface model (DSM) using Ziyuan-3 and GaoFen7 stereoscopic imagery, then enhance its accuracy through systematic correction with unmanned aerial vehicle-derived data for reliable gully depth calculation (2014–2024). Second, high-resolution GaoFen1 and GaoFen2 imagery are processed using deep learning models to automatically identify and delineate erosion patches. Third, we systematically evaluate the influence of both natural factors (i.e., gully erosion, vegetation restoration) and anthropogenic drivers (i.e., mining activities, terracing) on elevation changes during 2014–2024 using the corrected DSM time series and erosion patch maps. By unifying multi-platform remote sensing, deep learning-based feature extraction, and causal analysis, this study provides a replicable template for monitoring fine-scale geomorphological changes in ecologically fragile regions, with direct implications for targeted soil conservation planning.
2. Materials and Methods
2.1. Materials
2.1.1. Study Area
The Sandu River watershed is located in the upper reaches of the Wei River Basin, which is a major hydrological subsystem of the Yellow River Basin, covering an area of 2484 km2 (Figure 1). The watershed exhibits a continental monsoon climate, featuring a mean annual temperature of approximately 10.2°C and precipitation of around 473.4 mm [33]. According to the spatial distribution of the average annual precipitation in the watershed over the last 11 years (Figure 2), the low precipitation areas of the watershed are mainly located in the north-central and western parts of the region. The upper part of the watershed shows the highest annual precipitation, with a significant decrease in the middle and upper reaches. The average annual runoff in this watershed is approximately 0.45 × 10⁹ m3, and approximately 70% of the runoff occurs between May and September, with flood discharge accounting for 70.1% of the annual runoff volume [34].
In the Sandu River watershed, land use is dominated by agricultural cultivation, with sparse vegetation and severe soil erosion. Its average annual erosion modulus reaches 8560 t/km2—the highest among all tributaries in the upper Wei River. The middle and lower reaches feature highly developed gully networks with elevated bifurcation ratios. The riverbed consists primarily of clayey sand, with gravel and cobble deposits being exceptionally rare throughout the channel [35]. Gully erosion exhibits significant spatial variability across the watershed, attributable to heterogeneous topographic gradients, pedologic characteristics, and vegetative cover [36]. This variability may be further amplified by extreme precipitation events. To investigate these spatial variations in erosion dynamics, we conduct a comparative analysis of five characteristic sub-watersheds within the watershed: Huanglong River, Jimaligou, Cunpinggou, Zhangjiagou, and Zaotangou.
2.1.2. Datasets
To characterize erosion patterns in the Sandu River watershed, we employed multi-source remote sensing imagery (Table 1), including Ziyuan-3 (ZY-3), GaoFen7 (GF-7), GaoFen1 (GF-1), GaoFen2 (GF-2), and GaoFen6 (GF-6). High-resolution stereo-pair images from ZY-3 (10 m resolution for three-line-array camera data, 2 m resolution for digital orthophoto map) and GF-7 (0.8 m spatial resolution) were used to generate digital surface model (DSM), while GF-2 (0.8 m spatial resolution) and GF-1 (2 m spatial resolution) data enabled precise identification of erosion patches. Unmanned aerial vehicle (UAV) digital orthophoto map (0.2 m spatial resolution) and LiDAR data acquired in 2024 was applied to correct ZY-3-derived DSMs. Satellite data spanned 2014–2024, with additional years to ensure temporal coverage. Daily meteorological data (2014–2024) from 9 stations (e.g., precipitation) were sourced from China Meteorological Administration stations within the watershed (two stations) and in the vicinity of the watershed (Figure 2).
2.2. Methods
2.2.1. Overall Technical Framework
The technical flowchart begins with the preparation of input datasets, including stereo imagery, a baseline digital orthophoto map (DOM), a baseline digital elevation model (DEM), topographic maps, and ground control point (GCP). Control point matching is first conducted to achieve geometric consistency across datasets. This is followed by block adjustment through a regional network approach to further refine spatial alignment and reduce systematic errors. Elevation error analysis is then performed to quantify discrepancies between generated digital surface models and reference elevations. Spatial correlation analysis of DSM errors is undertaken to assess the pattern and extent of error distribution. Subsequently, a continuous spatial surface model is constructed to represent elevation differences and model systematic deviations (Figure 3).
2.2.2. DSM Calibration and Validation based on UAV
Digital surface models (DSMs) for two distinct periods were generated using stereo imagery acquired from the ZY-3 satellite in 2014 and the GF-7 satellite in 2024. We employed the Radial Basis Function (RBF) interpolation method to correct multi-temporal digital surface model data within the study area, enabling the extraction of detailed channel change information. RBF interpolation is a technique used for interpolating scattered data in high-dimensional spaces. It establishes a continuous functional relationship between elevation differences () at control points and their spatial coordinates , thereby constructing a continuous spatial surface model of elevation differences to perform interpolation at any location within the region. First, stable ground features with minimal change from 2014 to 2024 were selected as control points, prioritizing roads, buildings, and engineered structures, while excluding cultivated land, channels, water bodies, and vegetation-covered infrastructure. We selected 170 control points distributed essentially uniformly over the study area for DSM elevation correction (Figure 4). Field-measured terrain elevations obtained via unmanned aerial vehicle (UAV) surveys were assigned to these control points (Figure 3). Second, DSM spatial data were generated using tri-stereo satellite imagery (ZY-3 satellite), facilitating the construction of the continuous spatial surface model of elevation differences. Finally, the multi-temporal DSM datasets across the study area were corrected using either a global shift combined with local interpolation or purely local interpolation methods.
We used the mean square error of elevation difference (σ) to assess the accuracy and reliability of elevation points. This evaluation involved calculating residuals between measured and true elevation values, typically expressed as standard deviation.
where denotes the elevation difference, denotes the average of elevation difference.
2.2.3. Analysis of Changes in Gully Erosion Depth
The analysis of gully depth changes primarily relies on terrain data that have been corrected using a continuous spatial surface model of elevation differences. Specifically, the centerline data of gullies within the Sandu River watershed were first extracted by integrating hydrological analysis models in ArcGIS software with high-resolution optical remote sensing imagery. Subsequently, spatial analysis tools in ArcGIS software were used to assign elevation values from the corrected terrain data of two different periods to the gully centerline data. Finally, elevation differences were calculated to assess changes in gully depth in the Sandu River watershed from 2014 to 2024.
2.2.4. Identification of Gully Erosion Using Optical Remote Sensing Imagery
We used five sub-watersheds within the Sandu River watershed including the Huanglong River, Jimaligou, Cunpinggou, Zhangjiagou, and Zaotangou as sample areas for gully erosion. First, a 200-meter buffer was generated by acquiring stream data based on the hydrologic analysis tool in the ArcGIS software. Erosion patches were then manually interpreted in these buffer zones by integrating erosion gully shape, texture, vegetation cover, feature changes, and other characteristics from the high-resolution optical images for the years 2014, 2019, and 2024. The minimum identification unit requirement for erosion patches is 4 x 4 pixels (based on GF-2 imagery), and its validation is based on UAV aerial survey data conducted on-site in October 2024. A total of 244 effective erosion gully patches were identified within the sample area, of which 8 erosion patches were attributed to change from 2014–2019, 150 to 2019–2024, and 86 to continuous change from 2015–2024. The total area of the patches was 92,191.49 m2, the minimum patch was 16.44 m2, the maximum patch was 9434.47 m2, and the average area was 358.72 m2. Meanwhile, each patch was turned into a point with geometric center, and the distance between its center point and the centerline of the river channel had an average of 19.42 m, a minimum of 0.24 m, and a maximum of 99.24 m.
The U-Net model was utilized for erosion identification (Figure 5), and the erosion areas were accurately identified through its powerful image segmentation capability. Sample selection was based on five typical sub-watersheds covering a variety of shapes, textures, and vegetation cover levels to ensure a diverse and representative sample. The data were derived from three periods of pre-processed high-resolution optical imagery in 2014, 2019, and 2024, resulting in 244 high-confidence gully erosion patches that were used to train, validate, and test the model. The sample allocation follows a ratio of 8:1:1 divided into training, validation and testing sets to ensure that the model gets full learning as well as generalization capabilities. For the training of the model, we optimize it with a cross-entropy loss function, use the Adam optimizer (with the learning rate set to 0.001), and incorporate data augmentation techniques to improve the model’s robustness and resistance to overfitting. The accuracy of the final model (i.e., the IoU metric on the test set) reaches 87%, showing excellent classification results. In addition, for the initial results output from the U-Net model, we applied Segment Anything Model (SAM) for post-processing. This process effectively eliminates the noise and misclassification of model prediction, optimizes the boundary fineness and accuracy of segmented patches, and thus further improves the accuracy and practicality of soil erosion monitoring.
3. Results
3.1. Accuracy Assessment and Correction of Parameters
We first conducted aerial surveys using a LiDAR sensor-equipped UAV on the Huanglong River, Jimaligou, Cunpinggou, Zhangjiagou, and Zaotangou subwatersheds. We compared the elevation data obtained from GF7 and ZY3 imagery using the 2024 UAV aerial survey elevation data as a baseline. The results show that the median error in elevation between GF7-DSM and UAV data is 0.8433 meters, while it is 4.2738 meters between ZY3-DSM and UAV data, and 4.2401 meters between GF7-DSM and ZY3-DSM data, indicating that the GF7-DSM data meets the requirement of accuracy, but there is an obvious systematic offset error in ZY3-DSM data. The ZY3-DSM data for 2014 and 2024 were then corrected based on a continuous model of elevation difference spatial surfaces. We further compare the corrected ZY3-DSM data with the UAV elevation data and GF7-DSM elevation data. We find that the median error in elevation between the corrected ZY3-DSM data and the UAV data is 1.7702 m, and the median error in elevation between the GF7-DSM and the ZY3-DSM data is 1.7395 m. This demonstrates that the systematic offset error of the ZY3-DSM data has been effectively corrected after the correction process.
Specifically, in the Huanglong River sub-watershed the mean square error of elevation difference (σ) from 2014 to 2024 was 1.83 meters, and after correction the value was 0.99 meters (Figure 6b), indicating a 46.13% reduction in elevation error. In the Jimaligou sub-watershed, the σ values dropped from 1.71 m to 1.28 m following adjustment (Figure 6c), corresponding to a 25.12% decrease. For the Cunpinggou, the mean square error of elevation difference initially measured 2.53 m and was reduced to 1.84 m post-correction (Figure 6d), indicating a 27.36% improvement in accuracy. Zhangjiagou exhibited a substantial reduction, with σ values declining from 3.10 m to 2.44 m (Figure 6e), amounting to a 21.35% decrease in error. Lastly, in Zaotangou sub-watershed, the σ decreased from 3.09 m to 2.34 m after correction (Figure 6f), reflecting a 24.11% reduction in elevation discrepancy. Overall, 805 validation points were selected in the Sandu River watershed, which in turn corrected the 2014 and 2024 DSM data. Elevation errors were reduced by 18.97% (σ=2.95 for before; σ=2.39 for after) in the Sandu River watershed (Figure 6a).
The corrected DSM results for the Sandu River watershed in 2014 and 2024 are shown in Figure 7. The corrected DSM results indicate that the elevation range in the Sandu River watershed was 1069–2474 m in 2014 and 1091–2481 m in 2024. The minimum and maximum elevation of the DSM show slight increases in the whole watershed, which may be associated with channel sedimentation and vegetation recovery in the watershed. The DSM elevations in the northern region are higher than those in the southern region, while the western part shows greater elevations compared to the eastern part. This is closely associated with the topographic distribution of the Sandu River watershed, where higher mountains dominate the northern and western parts of the watershed, while the downstream southern and eastern areas feature a denser drainage network (Figure 1).
3.2. Dynamic Variation of Gully Erosion Depth
The difference in erosion depth at each pixel along the central line of gullies in the Sandu River watershed between 2014 and 2024 is illustrated in Figure 8. Over the past decade, the average gully erosion depth in the Sandu River watershed was 2.6m, with an annual rate of 0.26m yr−1 and a maximum observed depth of 19.3 m (Figure 8a-b). Gully erosion has reduced the average elevation in the Sandu River watershed from 1615.5 m in 2014 to 1612.9 m in 2024 (Figure 8c). Topographic analysis of the Sandu River watershed between 2014 and 2024 documented measurable elevation declines across all monitored sub-watersheds, demonstrating distinct spatial patterns in erosional response (Figure 8d-h). The Huanglong River in the northern part of the watershed decreased from 1819.1 m to 1815.9 m (-3.2 m, Figure 8d), while the Jimaligou in the western part declined from 1879.4 m to 1876.5 m (-2.9 m, Figure 8e). In the eastern part of the watershed, three adjacent sub-watersheds exhibited distinct elevation changes: Cunpinggou declined from 1314.0 m to 1311.6 m (-2.4 m, Figure 8f), Zhangjiagou showed a dramatic drop from 1283.0 m to 1275.0 m (-8.0 m, Figure 8g), and Zaotangou experienced the smallest reduction from 1211.8 m to 1209.8 m (-2.0 m, Figure 8h). These spatially heterogeneous changes demonstrate varying erosion susceptibilities among the watershed systems, which may be closely associated with differences in natural environmental conditions and anthropogenic disturbance intensities across sub-watersheds [13].
The spatial distribution of erosion patches over the past decade is shown in Figure 9. Widespread elevation decline occurred across the Sandu River watershed from 2014 to 2024, exhibiting spatially heterogeneous surface lowering magnitudes. The eastern watershed exhibits greater elevation reduction compared to the western watershed, which may be related to the regional topographic gradient descending from west to east. The larger depth of gully erosion is primarily in the central part of the watershed, with localized maximum elevation losses exceeding 100 m. Compared to vegetated areas, loess-covered regions exhibit greater elevation loss and higher susceptibility to gully erosion, consistent with existing research [13]. Erosion depth is greater along terrace bases, likely results from concentrated runoff imposing enhanced shear stress on bottom soils [37].
3.3. Drivers of Topographic Variations
The Sandu River watershed experienced an intricate change in elevation from 2014–2024, with the spatial heterogeneity pattern of surface deformation influenced by a variety of factors, including gully erosion, vegetation restoration, mining activities and terracing (Figure 10). Gully erosion remains the main natural driver of elevation change (Figure 10a), especially in the steep gullies of Huanglong River and Zhangjiagou sub-watersheds, where annual rates of lowering reach 0.18–0.34 meters/year. DSM variations reveal that these erosion hotspots account for about 20–38%% of the entire area. The erosion process exhibits strong seasonal characteristics, with particularly heavy rainfall events triggering extensive slope damage and gully retreat. However, large-scale vegetation restoration efforts (Figure 10b), such as Grain for Green Project and slope protection, may offset soil erosion, thereby resulting in a net elevation increase of 0.19–0.55 meters per year. Our analyses of vegetation cover and elevation changes indicate significant differences in elevation trajectories between areas with increased vegetation cover and those without restoration. Compared to cropland, forest land represents the most effective soil retention and can significantly reduce gully erosion. Human activities exhibit contrasting effects on elevation changes, particularly mining activities and terracing. Open-pit mining operations have typically resulted in localized depressions that have lowered elevations by 1.52–8.92 m over the past decade, while disposal of waste soil and waste rock stockpiles in adjacent areas have resulted in artificial elevations of 3.44–8.56 m (Figure 10c). Traditional terrace leveling and maintenance activities have produced significant elevation changes (Figure 10d), resulting in a net elevation loss of 0.19–0.77 meters per year.
4. Discussion
4.1. Potential for Estimating Gully Erosion from Multi-Source Remote Sensing Imagery
Combining multi-source high-resolution remote sensing images to estimate and monitor gully erosion has significant advantages, especially in the Loess Plateau where the environment is more complex. Such intricate landscapes present limitations to traditional field-based observation methods, such as scale and time constraints. We used DSM from GF7 and ZY3 stereo satellite imagery to estimate gully erosion depths and corrected them using UAV data. We also used high spatial resolution GF2 imagery to delineate erosion regions. Despite being implemented only in the Sandu River watershed, this method demonstrates the synergistic potential of combining multi-source remote sensing sensors for gully erosion monitoring. The DSM generated by GF7 and ZY3 provides detailed topographic information that accurately quantifies surface elevation changes associated with gully formation and development, which is more subtle when quickly identifying gully erosion due to heavy precipitation events. Following ground control and calibration, the ZY3 imagery can provide high vertical accuracy. Combining ZY3 and GF7 on the temporal scale can effectively capture the elevation distribution and fine-scale surface features for the study area over the past 10 years. Such accuracy mapping is critical to estimate gully erosion depths accurately, especially in areas where elevation changes are driven by a combination of natural and human activities. The acquisition of UAV data is essential to bring the different data sources into a harmonized framework. GF2 imagery with sub-meter spatial resolution enhances the identification and mapping of erosional features, including the depiction of gully boundaries, and especially the monitoring of gully erosion that has been overlooked in coarse datasets. Moreover, using multi-source remote sensing imagery addresses several challenges inherent to single-sensor data. For example, the limited temporal coverage of single-sensor data, and the fact that optical imagery is affected by vegetation cover or shading effects. We also employed advanced image analysis techniques, such as deep learning techniques and Segment Anything Model, to further improve the accuracy of gully detection with multi-source inputs.
4.2. Potential for Estimating Gully Erosion from Multi-Source Remote Sensing Imagery
The observed topographic changes in the Sandu River watershed are driven by complex interactions between natural processes and anthropogenic disturbances. Soil erosion, as a common phenomenon in nature, is the process of destruction, denudation, transport and deposition of soil and its soil-forming parent material by external forces such as water, wind, gravity and human activities. Dynamic erosion pattern continuously drives the micro-variation in surface elevation [38]. Rainfall-induced hydraulic erosion is one of the main forms of soil erosion in the Sandu River watershed. During high-intensity rainfall events, concentrated surface runoff develops into linear flow paths that exert shear stress on the soil, initiating gully erosion features ranging from rills to ephemeral gullies and ultimately permanent gullies [39,40]. As erosion progresses, the channels expand both vertically and laterally, creating a rough terrain with alternating highs and lows. In addition, gravitational erosion induces instability and downslope movement of weathered debris or unstable rock-soil masses on slopes, triggering geological hazards such as collapses and landslides [41]. This process creates localized depressions and protrusions on mountain surfaces, thereby altering topographic relief.
Vegetation cover significantly mitigates gully erosion in the Sandu River watershed, thereby stabilizing surface topography and reducing terrain dissection. Under precipitation conditions, vegetation roots and stems play different roles in the process of runoff erosion, altering the runoff process while increasing resistance to soil erosion [42,43]. Plant roots can effectively increase soil cohesion and consolidate soil, reducing erodibility while improving soil stability, thereby mitigating landslide and collapse risks and contributing to terrain smoothing [44,45]. Vegetation canopy interception promotes gradual rainwater infiltration while suppressing rapid surface runoff, thereby reducing flow erosivity and soil erosion potential [46]. Furthermore, vegetation growth could curb gully evolution during erosion by hindering soil transport, reducing soil loss rates, and increasing critical shear stress [47].
Compared to natural processes, anthropogenic activities may lead to faster rates in reshaping surface topography [48,49]. Open-pit mining, as one of the prominent anthropogenic activities in the Sandu River watershed, can rapidly and significantly alter surface topography within a relatively short period. The open-pit mining process excavates and destroys the original landform, while waste dumps overlay and compress it, thereby forming a new special landform type characterized by depressions and elevated mounds. Moreover, open-pit mining exerts severe ecological impacts on land by altering vegetation, soil composition, and subsurface geological structures [50,51]. These modifications consequently induce changes in surface hydrology, groundwater levels, and flow pathways, ultimately exacerbating the extent of land subsidence [52,53].
The implementation of soil and water conservation measures is one of the main anthropogenic factors contributing to topographic changes in the watershed. The Sandu River watershed is almost entirely covered by loess, with sparse vegetation and high sediment load in the river. To address the harsh natural conditions and severe soil erosion in the watershed, comprehensive soil and water conservation measures, primarily involving the conversion of sloping land to terraces, have been implemented since the 1970s. Terracing, as an effective measure to enhance the soil water holding capacity, can thoroughly alter landforms by transforming natural slopes in to stair-steps of flat surfaces. Compared to natural slopes or terrace risers, terracing significantly reshapes the original slope morphology, including gradient, length, curvature, and surface roughness [54]. This transformation modifies hydrologic connectivity, rebalances runoff and infiltration patterns in watersheds, and generates micro-watersheds to improve rainwater harvesting efficiency [55]. The implementation of diverse terracing measures (e.g., level ditch, slope, counter-slope, and half-moon terraces) improved watershed conditions, thereby increasing the survival rate of planted vegetation such as trees, shrubs or grasses [56]. In this way, even very little precipitation can be infiltrated efficiently, avoiding runoff, achieving water storage and reducing the quantity of sand [57].
4.3. Limitation and Future Works
There are several limitations in this study. First, the estimation of gully erosion depths depends mainly on DSM from GF-7 and ZY-3 imagery, which are limited by the inherent spatial resolution and vertical accuracy of these data. These limitations can lead to underestimation or overestimation of subtle topographic changes, especially in regions with complicated topography or dense vegetation cover. Second, although UAV-derived data were used to calibrate the ZY3 DSM, the limited spatial coverage of the UAV survey may introduce localized biases in the calibration process. Third, the identification of erosion areas based on GF-2 images is affected by the spectral and spatial features of the sensors, which may not capture all the microscale erosion features or distinguish between erosion and other surface disturbances. Finally, matching between different datasets can affect the accuracy of change detection and erosion assessment. Future efforts should consider the integration of more temporal datasets, as well as advanced data fusion techniques to improve the robustness of erosion monitoring in different environments.
5. Conclusions
This study employed multi-source high resolution remote sensing imagery and deep learning methods to identify gully erosion in the Sandu River watershed and further investigated the characteristics of topography changes over the past decade under the combined effects of erosion and other environmental and anthropogenic factors. The main findings of our study can be summarized as follows:
Topographic monitoring in the Sandu River watershed revealed a net elevation decrease of 2.6 m (from 1615.5 m in 2014 to 1612.9 m in 2024) attributable to gully erosion processes during the study period. More than 50% of the watershed area experienced measurable elevation reduction, with varying magnitudes of surface lowering. Across the monitored sub-watersheds, the measured gully erosion depths across sub-watersheds varied from 2.0 m to 8.0 m of elevation loss, with the maximum reduction (-8.0 m) observed in Zhangjiagou, indicating higher erosional dynamics.
The complex elevation changes in the Sandu River watershed result from coupled natural and anthropogenic drivers. Gully erosion drives the most severe natural elevation reduction, with localized surface lowering reaching 0.18–0.34 m yr-1 in steep gullies, particularly triggered by extreme precipitation events. Conversely, large-scale vegetation cover can enhance surface stability with measurable net elevation gains of 0.19–0.55 m yr-1, demonstrating that increased vegetation cover serves as an effective measure for erosion control. In addition, human activities exhibit bifurcated impacts on elevation changes. Mining operations concurrently produce localized depressions (1.52–8.92 m depth) and adjacent artificial fills (3.44–8.56 m depth), while terrace maintenance results in systematic net losses of 0.19–0.77 m yr-1. This study provides further insights into the risk of soil erosion in ecologically fragile regions and highlights the urgent need for coordinated landscape management.
Author Contributions
Conceptualization, Y.Q. and X.L.; methodology, L.W., Y.Q., W.X., R.Y., S.Z. and Y.D.; software, L.W., W.X., R.Y., S.Z., Y.D. and X.W.; validation, L.W., R.Y. and S.Z.; formal analysis, L.W., Y.Q. and R.Y.; investigation, L.W., Y.Q., W.X., R.Y., S.Z. and Y.D.; data curation, L.W., R.Y., S.Z. and Y.D.; writing—original draft preparation, L.W.; writing—review and editing, Y.Q. and X.L.; visualization, L.W., R.Y., S.Z. and Y.D.; supervision, Y.Q.; project administration, Y.Q.; funding acquisition, Y.Q. All authors have read and agreed to the published version of the manuscript.
Funding
This research was funded by the Key Research and Development Program of Gansu Province (Grant No. 23YFGA0014): Development and Integrated Application of Key Monitoring Products for Typical Medicinal Herbs in the Eastern Loess Plateau of Gansu Using Domestic High-Resolution Remote Sensing, the Strategic Priority Research Program of the Chinese Academy of Sciences (Grant No. XDA20100101), the National Key Research and Development Program of China (Grant No. 2019YFC0507404), and the Gansu Province Water Conservancy Science Experiment Research and Technology Promotion Program Project (Grant No. 24GSLK003).
Data Availability Statement
Data are available upon request due to restrictions (project data privacy). The data presented in this study are available upon request from the corresponding author.
Acknowledgments
In this section, you can acknowledge any support given which is not covered by the author contribution or funding sections. This may include administrative and technical support, or donations in kind (e.g., materials used for experiments). Where GenAI has been used for purposes, such as generating text, data, or graphics, or for study design, data collection, analysis, or interpretation of data, please add “During the preparation of this manuscript/study, the author(s) used [tool name, version information] for the purposes of [description of use]. The authors have reviewed and edited the output and take full responsibility for the content of this publication.”
Conflicts of Interest
The authors declare no conflicts of interest.
Abbreviations
The following abbreviations are used in this manuscript:
| DSM | Digital surface model |
| RBF | Radial Basis Function |
| UAV | Unmanned aerial vehicle |
| SAM | Segment Anything Model |
References
- Xu, M. X., Li, Q. & Wilson, G. Degradation of soil physicochemical quality by ephemeral gully erosion on sloping cropland of the hilly Loess Plateau, China. Soil Till Res 155, 9-18 (2016). [CrossRef]
- Zhang, X. et al. Remote sensing image segmentation of gully erosion in a typical black soil area in Northeast China based on improved DeepLabV3+ model. Ecological Informatics 84 (2024). [CrossRef]
- Saha, A. et al. Land degradation risk dynamics assessment in red and lateritic zones of eastern plateau, India: A combine approach of K-fold CV, data mining and field validation. Ecological Informatics 69 (2022). [CrossRef]
- Majhi, A., Bhattacharjee, P., Harris, A., Evans, M. & Shuttleworth, E. Gully erosion is a serious obstacle in India’s land degradation neutrality mission. Sci. Rep. 15 (2025). [CrossRef]
- Samuel, S., Dosio, A., Mphale, K., Faka, D. N. & Wiston, M. Comparison of multi-model ensembles of global and regional climate model projections for daily characteristics of precipitation over four major river basins in southern Africa. Part II: Future changes under 1.5 °C, 2.0 °C and 3.0 °C warming levels. Atmospheric Research 293 (2023). [CrossRef]
- Kendon, E. J., Fischer, E. M. & Short, C. J. Variability conceals emerging trend in 100yr projections of UK local hourly rainfall extremes. Nat. Commun. 14 (2023). [CrossRef]
- Mulligan, M. Modelling the geomorphological impact of climatic variability and extreme events in a semi-arid environment. Geomorphology 24, 59-78 (1998). [CrossRef]
- Biddoccu, M., Ferraris, S., Opsi, F. & Cavallo, E. Long-term monitoring of soil management effects on runoff and soil erosion in sloping vineyards in Alto Monferrato (North-West Italy). Soil Till Res 155, 176-189 (2016). [CrossRef]
- Wang, S., Yan, Y., Fu, Z. Y. & Chen, H. S. Rainfall-runoff characteristics and their threshold behaviors on a karst hillslope in a peak-cluster depression region. J Hydrol 605 (2022). [CrossRef]
- Poesen, J., Nachtergaele, J., Verstraeten, G. & Valentin, C. Gully erosion and environmental change: importance and research needs. Catena 50, 91-133 (2003). [CrossRef]
- Moeyersons, J., Imwangana, F. M. & Dewitte, O. Site- and rainfall-specific runoff coefficients and critical rainfall for mega-gully development in Kinshasa (DR Congo). Nat. Hazards 79, S203-S233 (2015). [CrossRef]
- Guo, M. M. et al. Distribution, morphology and influencing factors of rills under extreme rainfall conditions in main land uses on the Loess Plateau of China. Geomorphology 345 (2019). [CrossRef]
- Chen, H. et al. Effects of vegetation and rainfall types on surface runoff and soil erosion on steep slopes on the Loess Plateau, China. Catena 170, 141-149 (2018). [CrossRef]
- Zhang, S. Q. & Zhang, K. L. Assessing the impact of extreme rainfall and slope surface conditions on runoff and erosion based on a big database in Southwest China’s karst region. J Hydrol 659 (2025). [CrossRef]
- Vanmaercke, M. et al. Measuring, modelling and managing gully erosion at large scales: A state of the art. Earth-Science Reviews 218 (2021). [CrossRef]
- Seutloali, K. E., Dube, T. & Mutanga, O. Assessing and mapping the severity of soil erosion using the 30-m Landsat multispectral satellite data in the former South African homelands of Transkei. Phys Chem Earth 100, 296-304 (2017). [CrossRef]
- Daggupati, P., Sheshukov, A. Y. & Douglas-Mankin, K. R. Evaluating ephemeral gullies with a process-based topographic index model. Catena 113, 177-186 (2014). [CrossRef]
- Yang, X., Na, J. M., Tang, G. A., Wang, T. T. & Zhu, A. X. Bank gully extraction from DEMs utilizing the geomorphologic features of a loess hilly area in China. Front Earth Sci-Prc 13, 151-168 (2019). [CrossRef]
- Arabameri, A., Pradhan, B. & Rezaei, K. Gully erosion zonation mapping using integrated geographically weighted regression with certainty factor and random forest models in GIS. J. Environ. Manage. 232, 928-942 (2019). [CrossRef]
- Karami, A., Khoorani, A., Noohegar, A., Shamsi, S. R. F. & Moosavi, V. Gully Erosion Mapping Using Object-Based and Pixel-Based Image Classification Methods. Environ Eng Geosci 21, 101-110 (2015). [CrossRef]
- Phinzi, K., Holb, I. & Szabó, S. Mapping Permanent Gullies in an Agricultural Area Using Satellite Images: Efficacy of Machine Learning Algorithms. Agronomy-Basel 11 (2021). [CrossRef]
- Golosov, V. et al. Mapping and spatial-temporal assessment of gully density in the Middle Volga region, Russia. Earth Surface Processes and Landforms 43, 2818-2834 (2018). [CrossRef]
- Dong, F. Y., Jin, J. Z., Li, L., Li, H. Y. & Zhang, Y. C. A Multi-Scale Content-Structure Feature Extraction Network Applied to Gully Extraction. Remote Sensing 16 (2024). [CrossRef]
- Liang, W. et al. Quantifying the impacts of climate change and ecological restoration on streamflow changes based on a Budyko hydrological model in China’s Loess Plateau. Water Resources Research 51, 6500-6519 (2015). [CrossRef]
- Chen, Y. X. et al. Response of gully morphology and density to the spatial and rainy-season monthly variation of rainfall at the regional scale of the Chinese Loess Plateau. Catena 236 (2024). [CrossRef]
- Xu, Y. G. et al. Revegetation Changes Main Erosion Type on the Gully-Slope on the Chinese Loess Plateau Under Extreme Rainfall: Reducing Gully Erosion and Promoting Shallow Landslides. Water Resources Research 60 (2024). [CrossRef]
- De Rose, R. C. Slope control on the frequency distribution of shallow landslides and associated soil properties, North Island, New Zealand. Earth Surface Processes and Landforms 38, 356-371 (2013).
- von Ruette, J., Lehmann, P. & Or, D. Effects of rainfall spatial variability and intermittency on shallow landslide triggering patterns at a catchment scale. Water Resources Research 50, 7780-7799 (2014). [CrossRef]
- Jin, Z. et al. Gully erosion and expansion mechanisms in loess tablelands and the scientific basis of gully consolidation and tableland protection. Science China-Earth Sciences 66, 821-839 (2023). [CrossRef]
- Wang, Z. J., Jiao, J. Y., Rayburg, S., Wang, Q. L. & Su, Y. Soil erosion resistance of “Grain for Green” vegetation types under extreme rainfall conditions on the Loess Plateau, China. Catena 141, 109-116 (2016).
- Govers, G., Giménez, R. & Van Oost, K. Rill erosion:: Exploring the relationship between experiments, modelling and field observations. Earth-Science Reviews 84, 87-102 (2007).
- Lei, T. W., Nearing, M. A., Haghighi, K. & Bralts, V. F. Rill erosion and morphological evolution: A simulation model. Water Resources Research 34, 3157-3168 (1998). [CrossRef]
- Zhang, S. et al. Changes in streamflow regimes and their responses to different soil and water conservation measures in the Loess Plateau watersheds, China. Hydrological Processes 35 (2021). [CrossRef]
- Zhang, R. Variation Characteristics of Measured Runoff in the Upper Wei River over the Past 50 Years. Gansu Water Conservancy and Hydropower Technology 45, 7-9 (2009).
- Jin, Y. Sediment deposition issues in the Sandu River tributary of the Wei River. Journal of Yellow River Conservancy Technical Institute 16, 23-24 (2004).
- Huang, D., Zhao, X., Yin, Z. & Qin, W. Utilizing geodetectors to identify conditioning factors for gully erosion risk in the black soil region of northeast China. International Soil and Water Conservation Research 12, 808-827 (2024). [CrossRef]
- Wen, Y., Kasielke, T., Li, H., Zhang, B. & Zepp, H. May agricultural terraces induce gully erosion? A case study from the Black Soil Region of Northeast China. Sci. Total Environ. 750 (2021). [CrossRef]
- Luo, J., Zheng, Z., Li, T. & He, S. Spatial variation of microtopography and its effect on temporal evolution of soil erosion during different erosive stages. Catena 190 (2020). [CrossRef]
- Gong, J. G. et al. An experimental study on dynamic processes of ephemeral gully erosion in loess landscapes. Geomorphology 125, 203-213 (2011). [CrossRef]
- Valentin, C., Poesen, J. & Li, Y. Gully erosion: Impacts, factors and control. Catena 63, 132-153 (2005). [CrossRef]
- Zhu, B., Zhou, Z. & Li, Z. Soil Erosion and Controls in the Slope-Gully System of the Loess Plateau of China: A Review. Frontiers in Environmental Science 9 (2021). [CrossRef]
- Duan, J. et al. Importance of grass stolons in mitigating runoff and sediment yield under simulated rainstorms. Catena 213 (2022). [CrossRef]
- Prosser, I. P. & Soufi, M. Controls on gully formation following forest clearing in a humid temperate environment. Water Resources Research 34, 3661-3671 (1998). [CrossRef]
- Guo, M., Wang, W., Wang, T., Wang, W. & Kang, H. Impacts of different vegetation restoration options on gully head soil resistance and soil erosion in loess tablelands. Earth Surface Processes and Landforms 45, 1038-1050 (2020). [CrossRef]
- Guo, M., Wang, W., Kang, H. & Yang, B. Changes in soil properties and erodibility of gully heads induced by vegetation restoration on the Loess Plateau, China. J Arid Land 10, 712-725 (2018). [CrossRef]
- Dong, Y. et al. Effects of vegetation buffer strips on concentrated flow hydraulics and gully bed erosion based on in situ scouring experiments. Land Degrad Dev 29, 1672-1682 (2018). [CrossRef]
- Yang, S. et al. Erosion control of hedgerows under soils affected by disturbed soil accumulation in the slopes of loess plateau, China. Catena 181 (2019). [CrossRef]
- Kemp, D. B., Sadler, P. M. & Vanacker, V. The human impact on North American erosion, sediment transfer, and storage in a geologic context. Nat. Commun. 11 (2020). [CrossRef]
- Harden, C. P. The human-landscape system: challenges for geomorphologists. Physical Geography 35, 76-89 (2014). [CrossRef]
- Zhao, Z. et al. Soils development in opencast coal mine spoils reclaimed for 1–13 years in the West-Northern Loess Plateau of China. Eur. J. Soil Biol. 55, 40-46 (2013). [CrossRef]
- Wang, J., Jiao, Z. & Bai, Z. Changes in carbon sink value based on RS and GIS in the Heidaigou opencast coal mine. Environmental Earth Sciences 71, 863-871 (2013). [CrossRef]
- Li, X. et al. Simulation of surface water–groundwater interaction in coal mining subsidence areas: A case study of the Kuye River Basin in China. J Hydrol 659 (2025). [CrossRef]
- Han, J. et al. Mechanism the land subsidence from multiple spatial scales and hydrogeological conditions – A case study in Beijing-Tianjin-Hebei, China. Journal of Hydrology: Regional Studies 50 (2023). [CrossRef]
- Wei, W. et al. The effects of terracing and vegetation on soil moisture retention in a dry hilly catchment in China. Sci. Total Environ. 647, 1323-1332 (2019). [CrossRef]
- Rockström, J. & Falkenmark, M. Increase water harvesting in Africa. Nature 519, 283-285 (2015). [CrossRef]
- Zhang, H. et al. Experimental study of water-based drilling fluid disturbance on natural gas hydrate-bearing sediments. Journal of Natural Gas Science and Engineering 47, 1-10 (2017). [CrossRef]
- Lin, L. & Chen, J. The effect of conservation practices in sloped croplands on soil hydraulic properties and root-zone moisture dynamics. Hydrological Processes 29, 2079-2088 (2014). [CrossRef]
Figure 1.
The geographic location of study area.
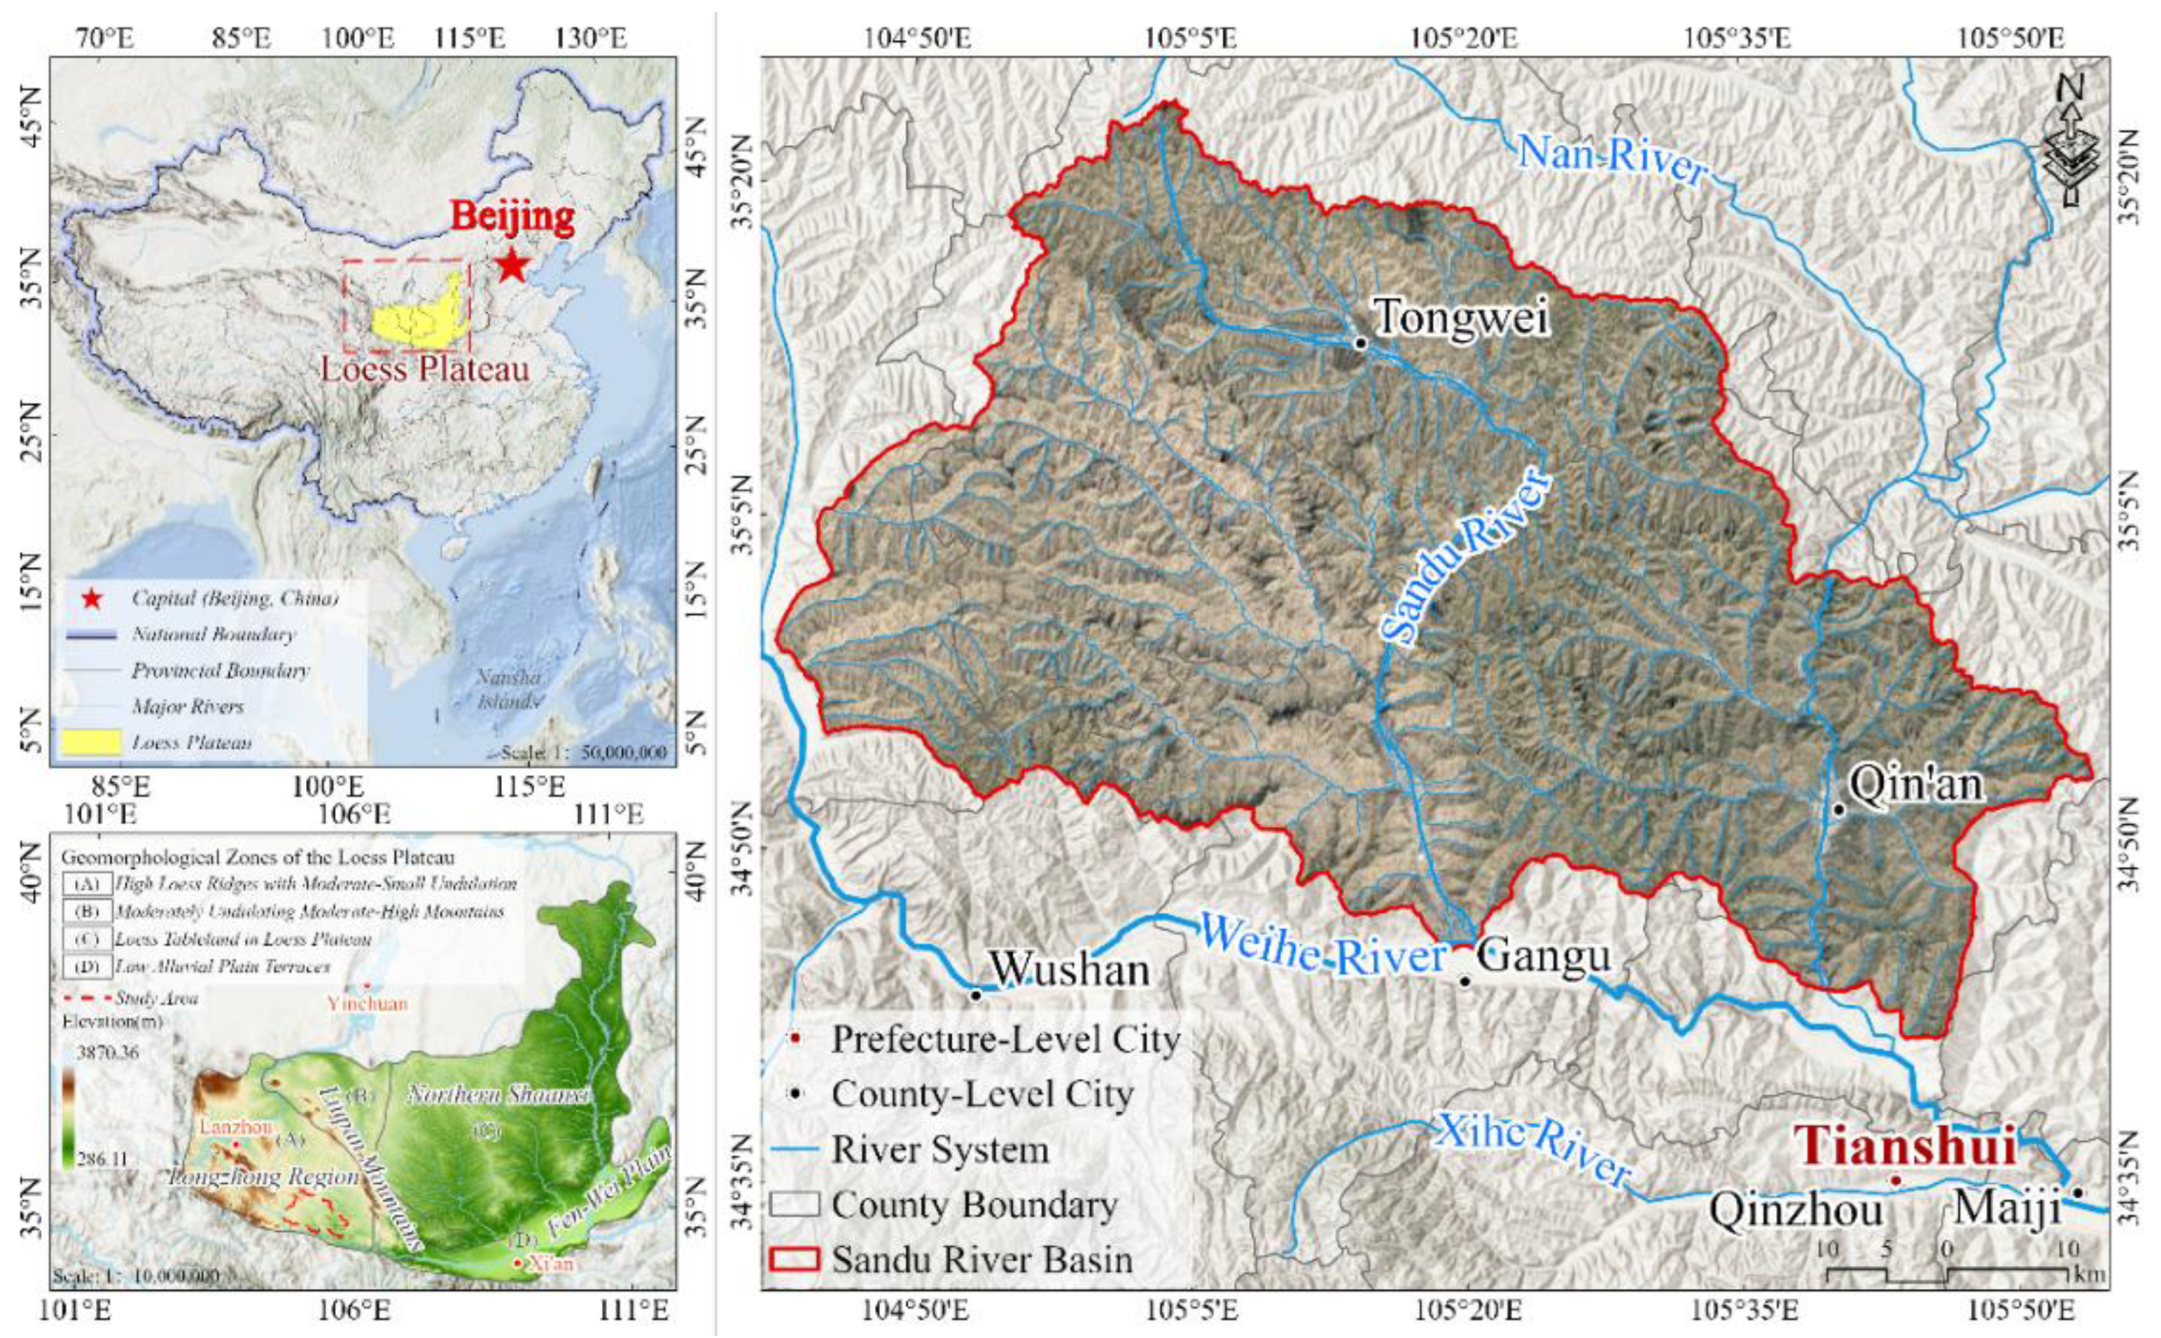
Figure 2.
Precipitation changes over the study area during 2014–2024.
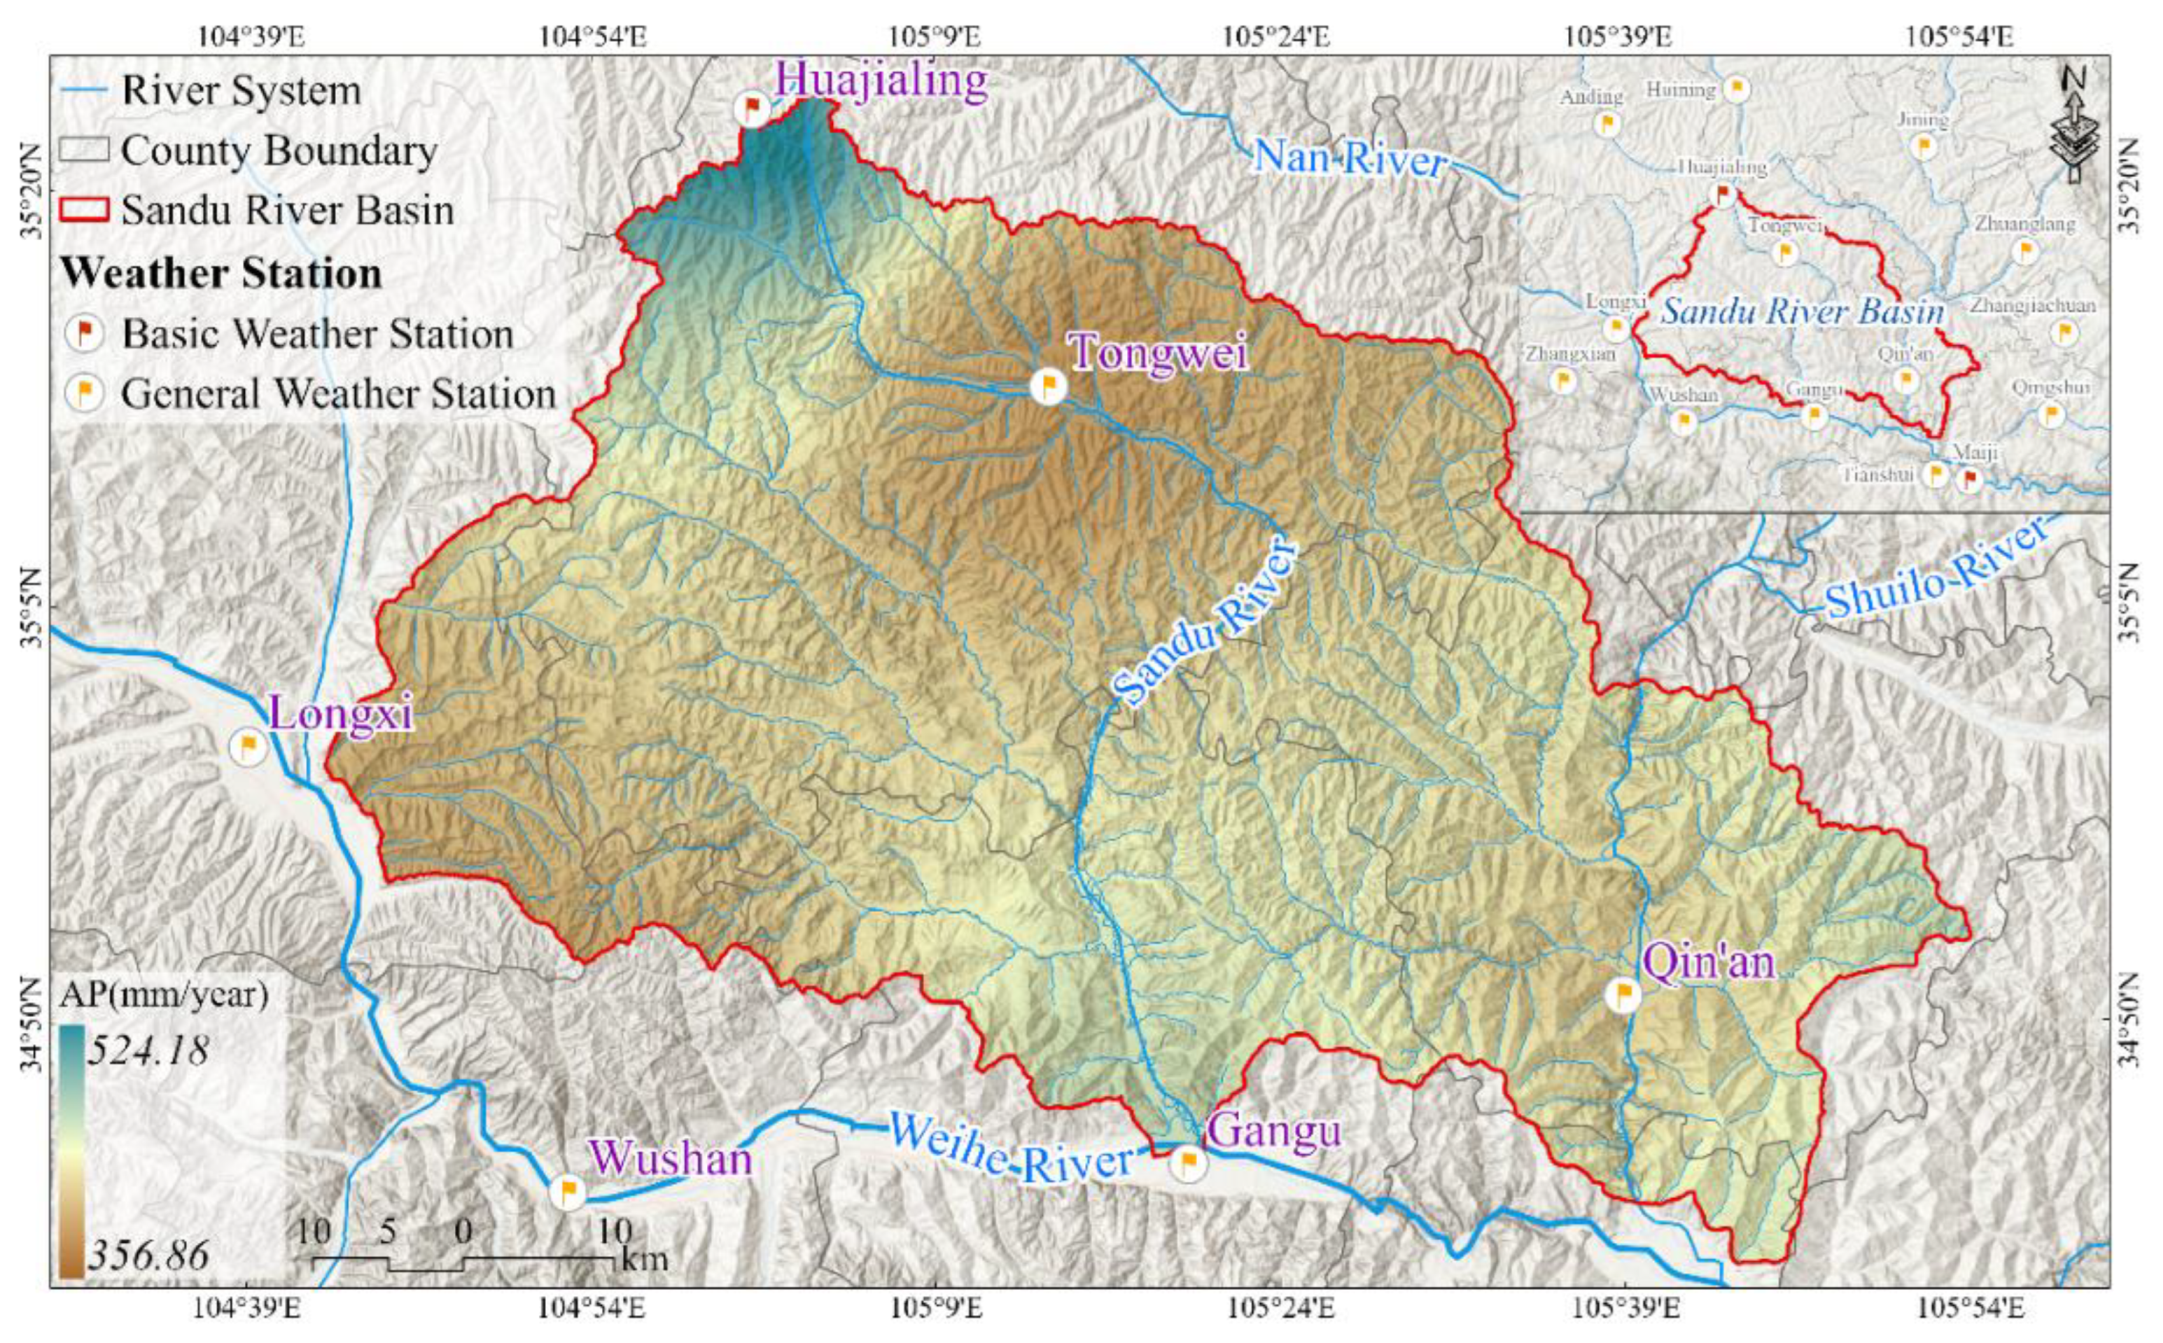
Figure 3.
A flowchart of DSM extraction and validation.
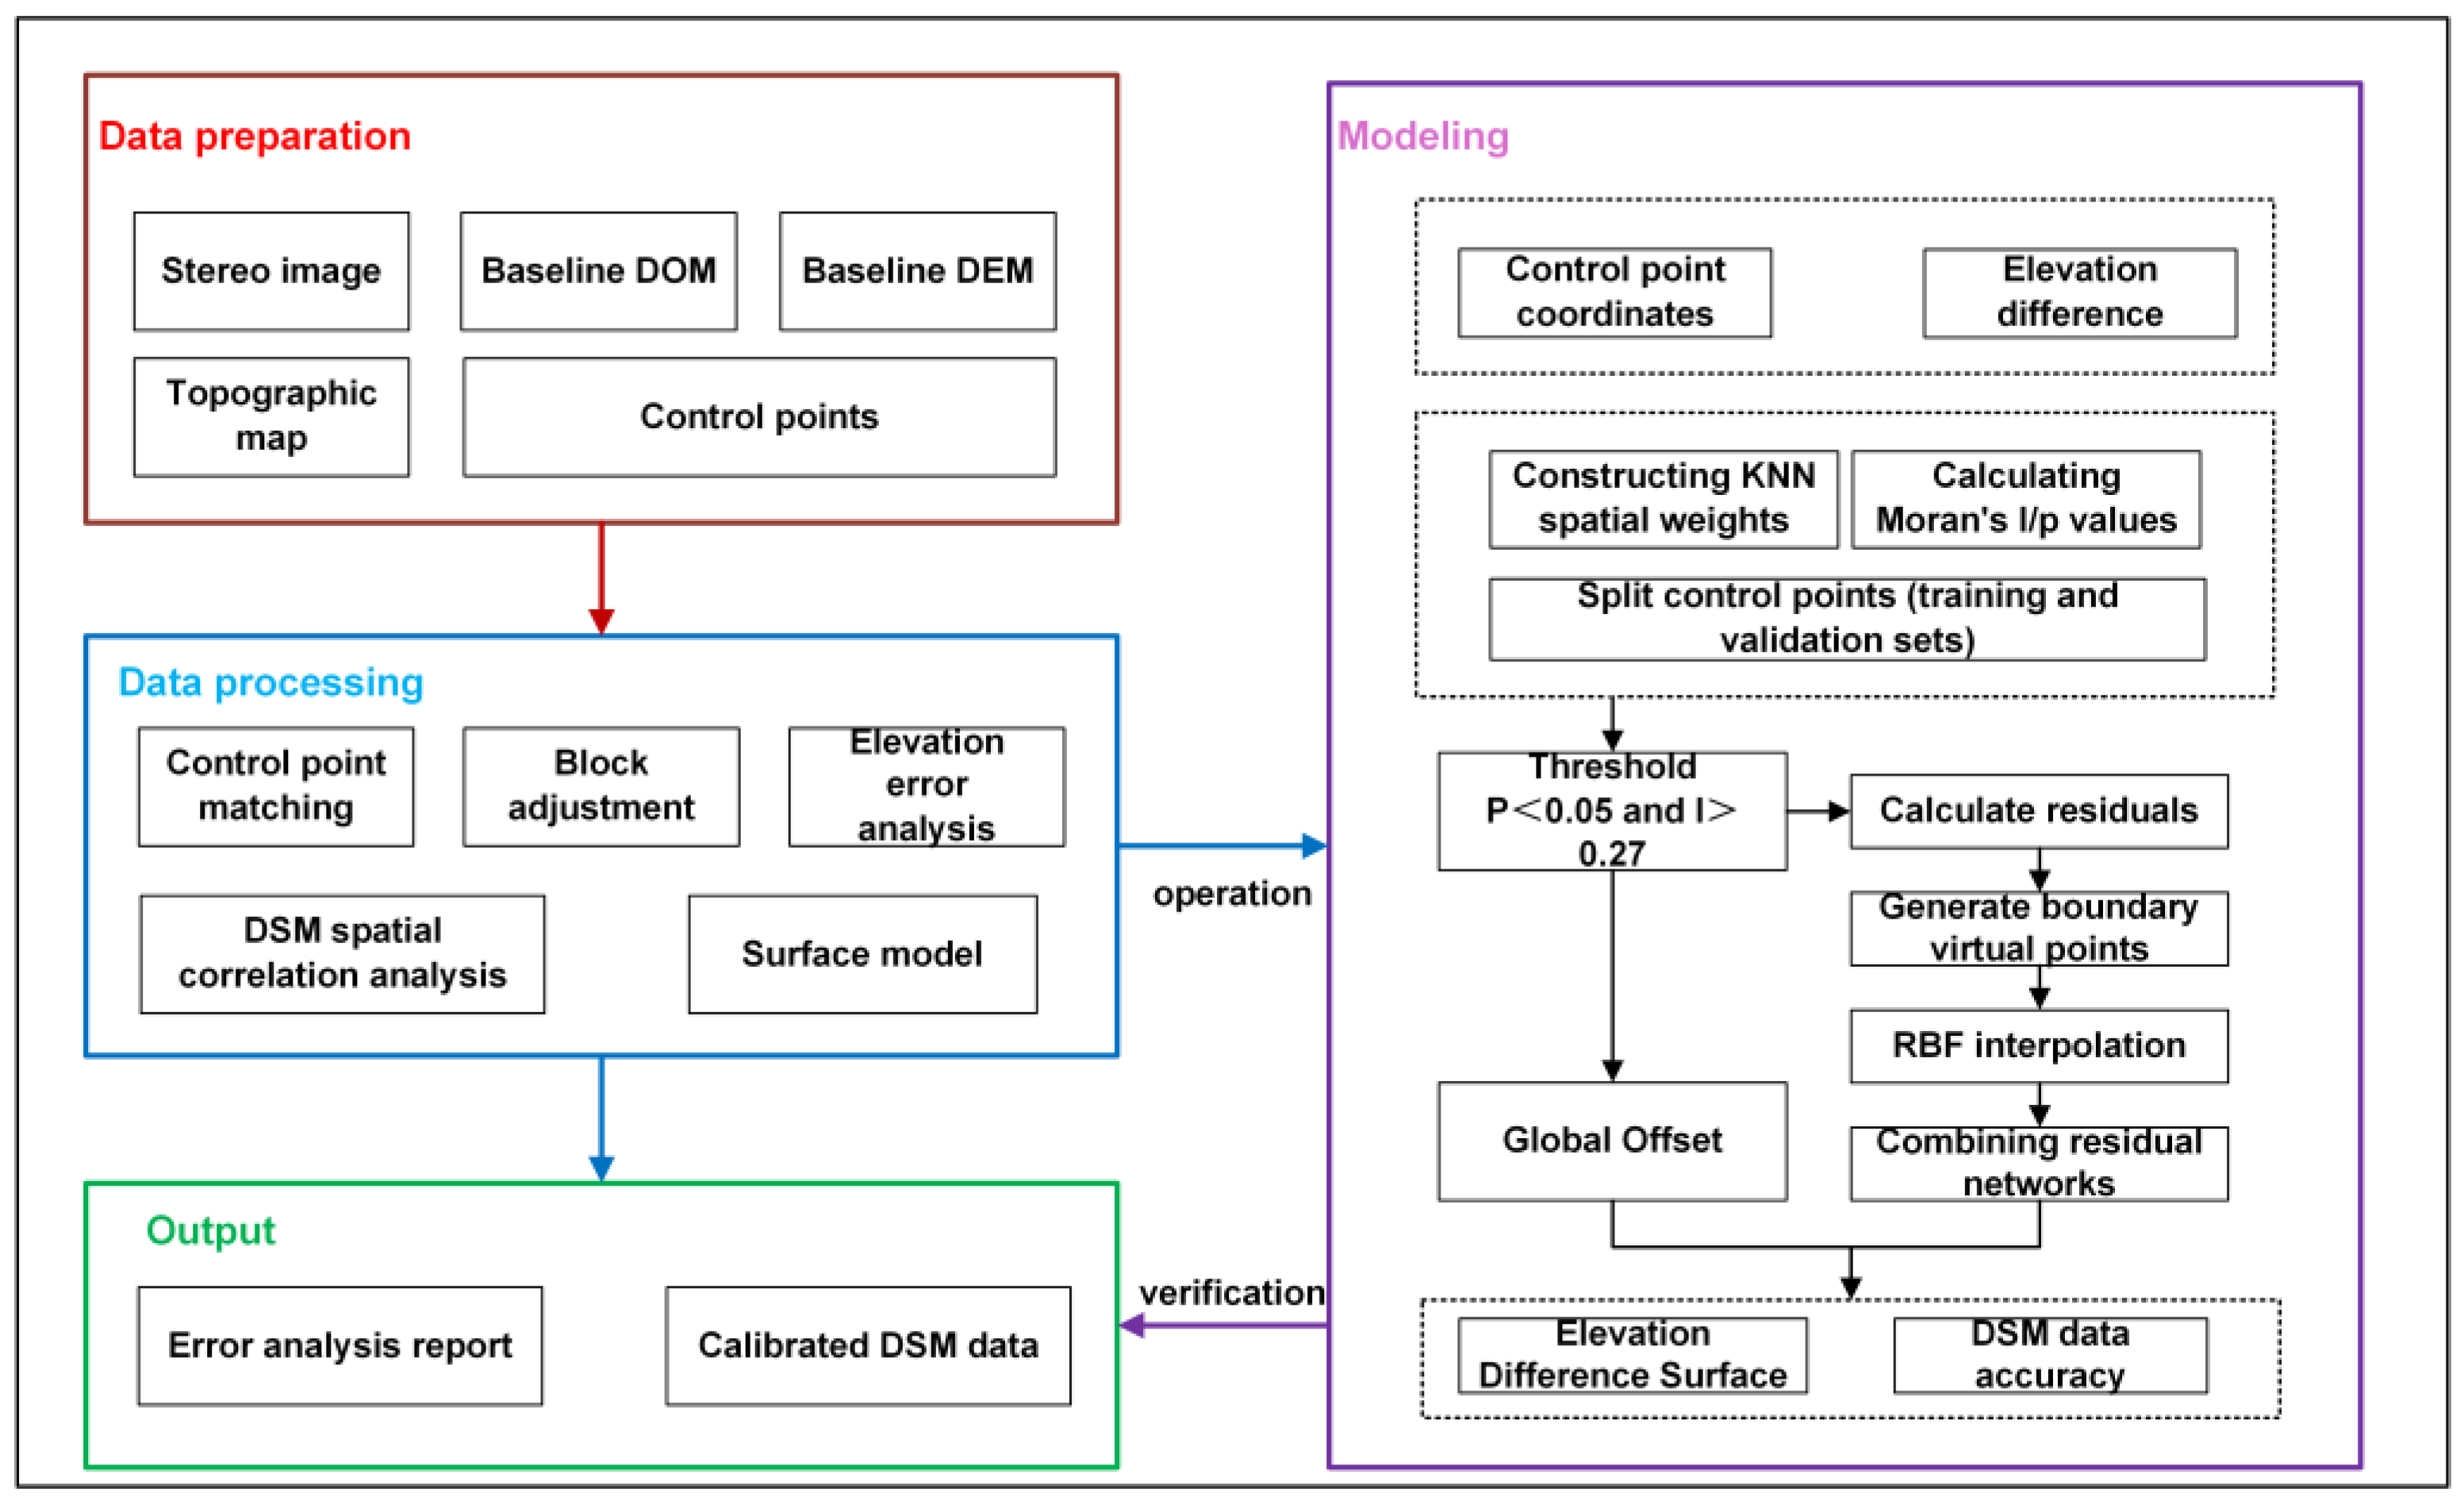
Figure 4.
Spatial distribution of control points in study area.
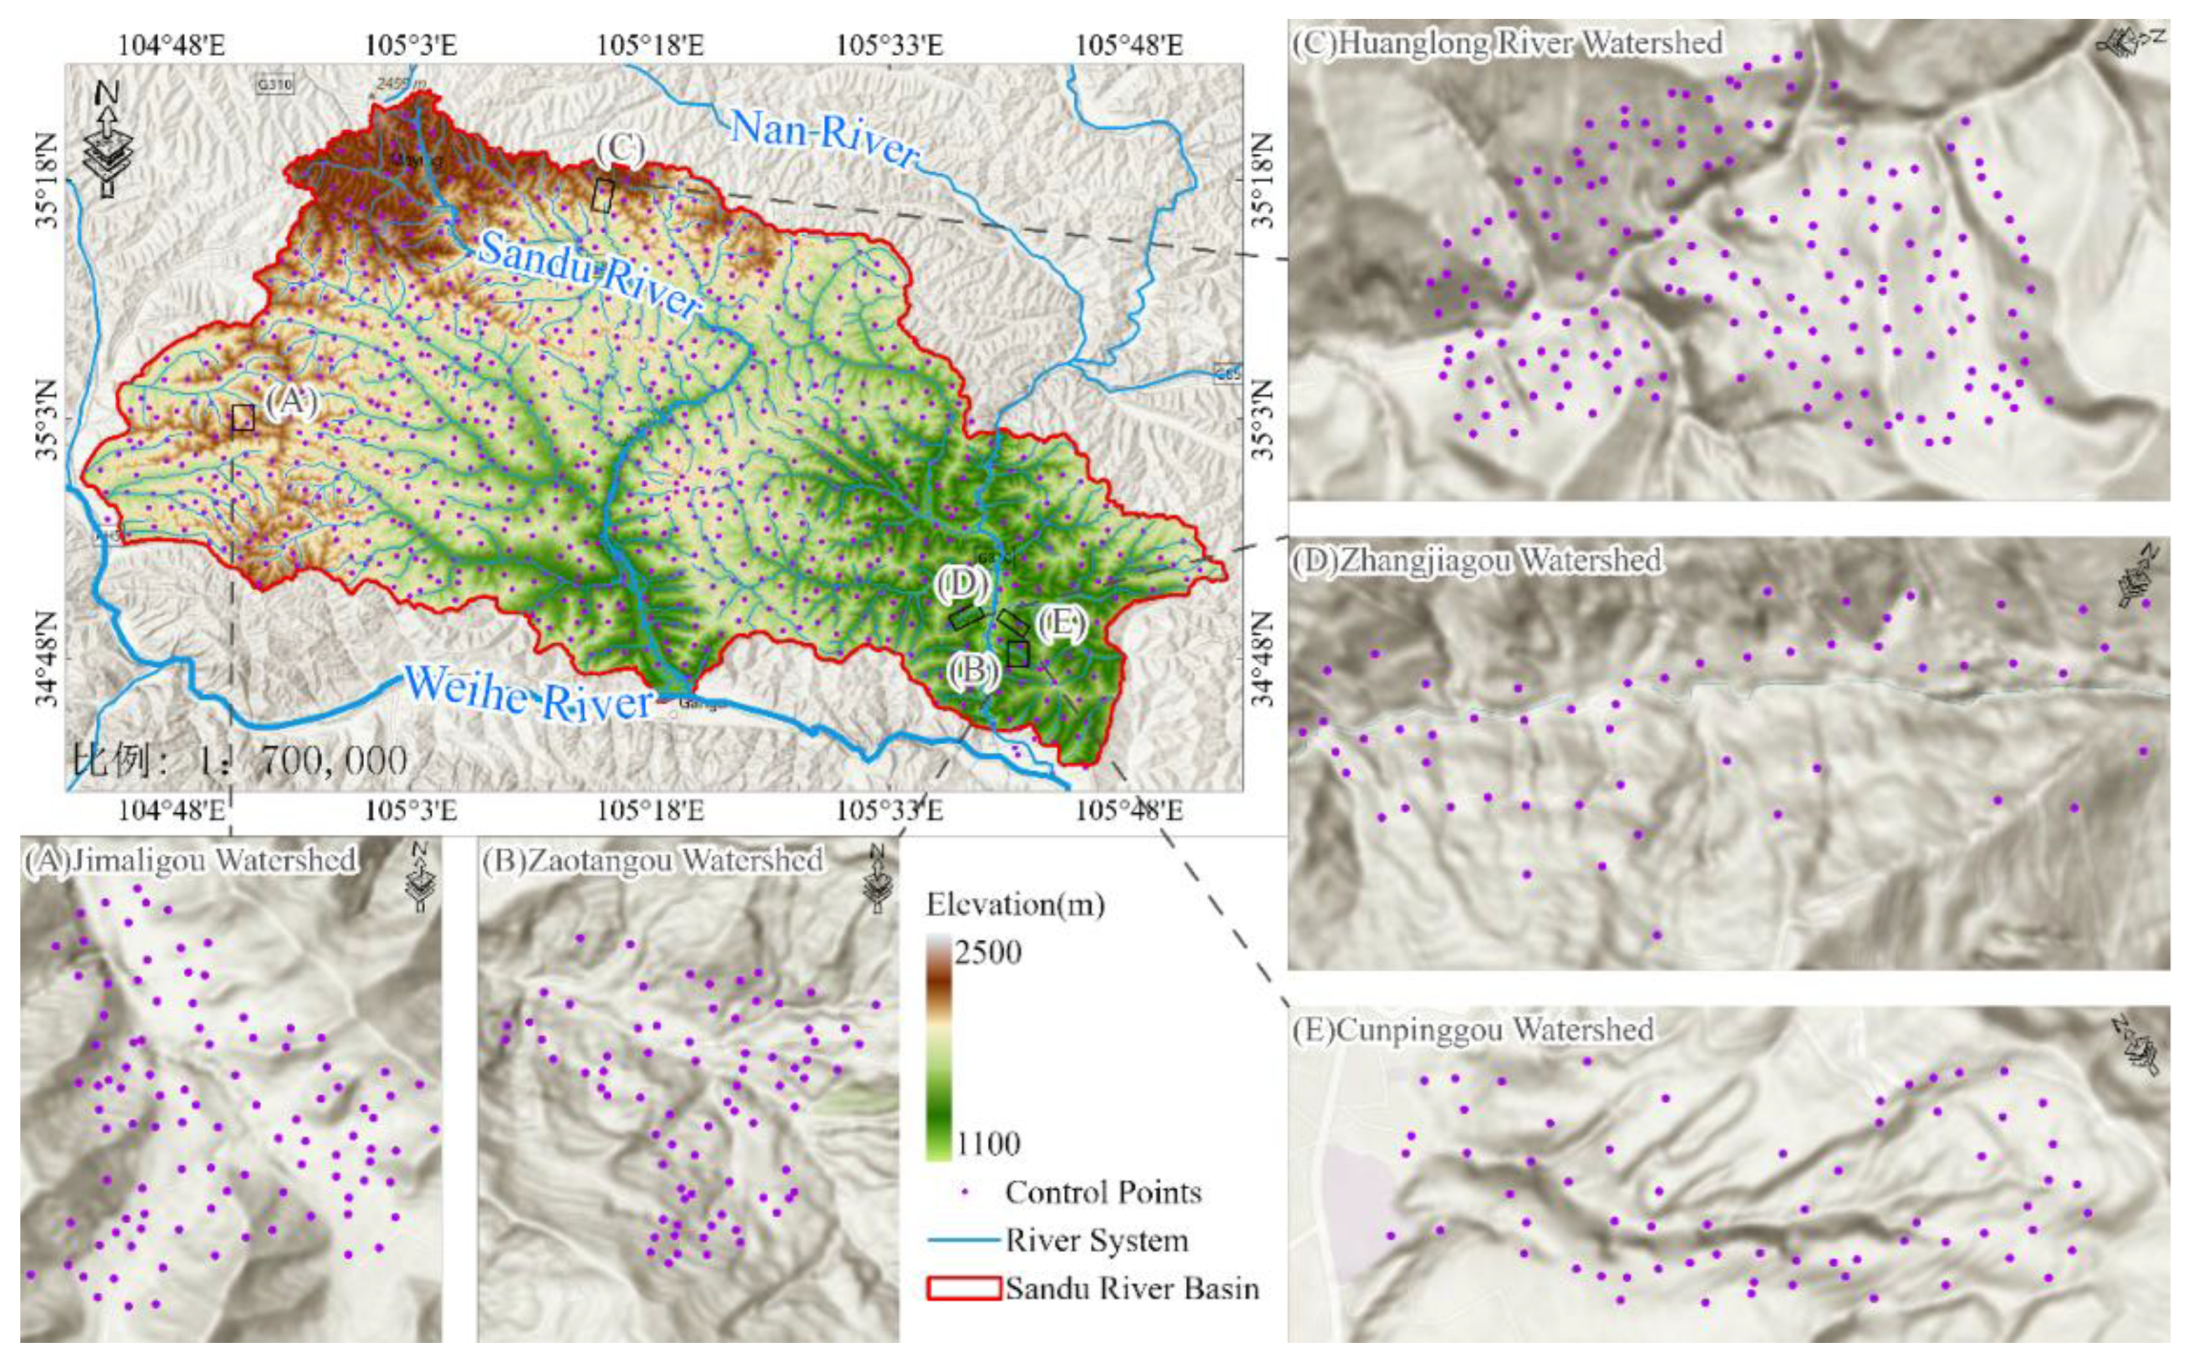
Figure 5.
Model for identifying gully erosion patches.
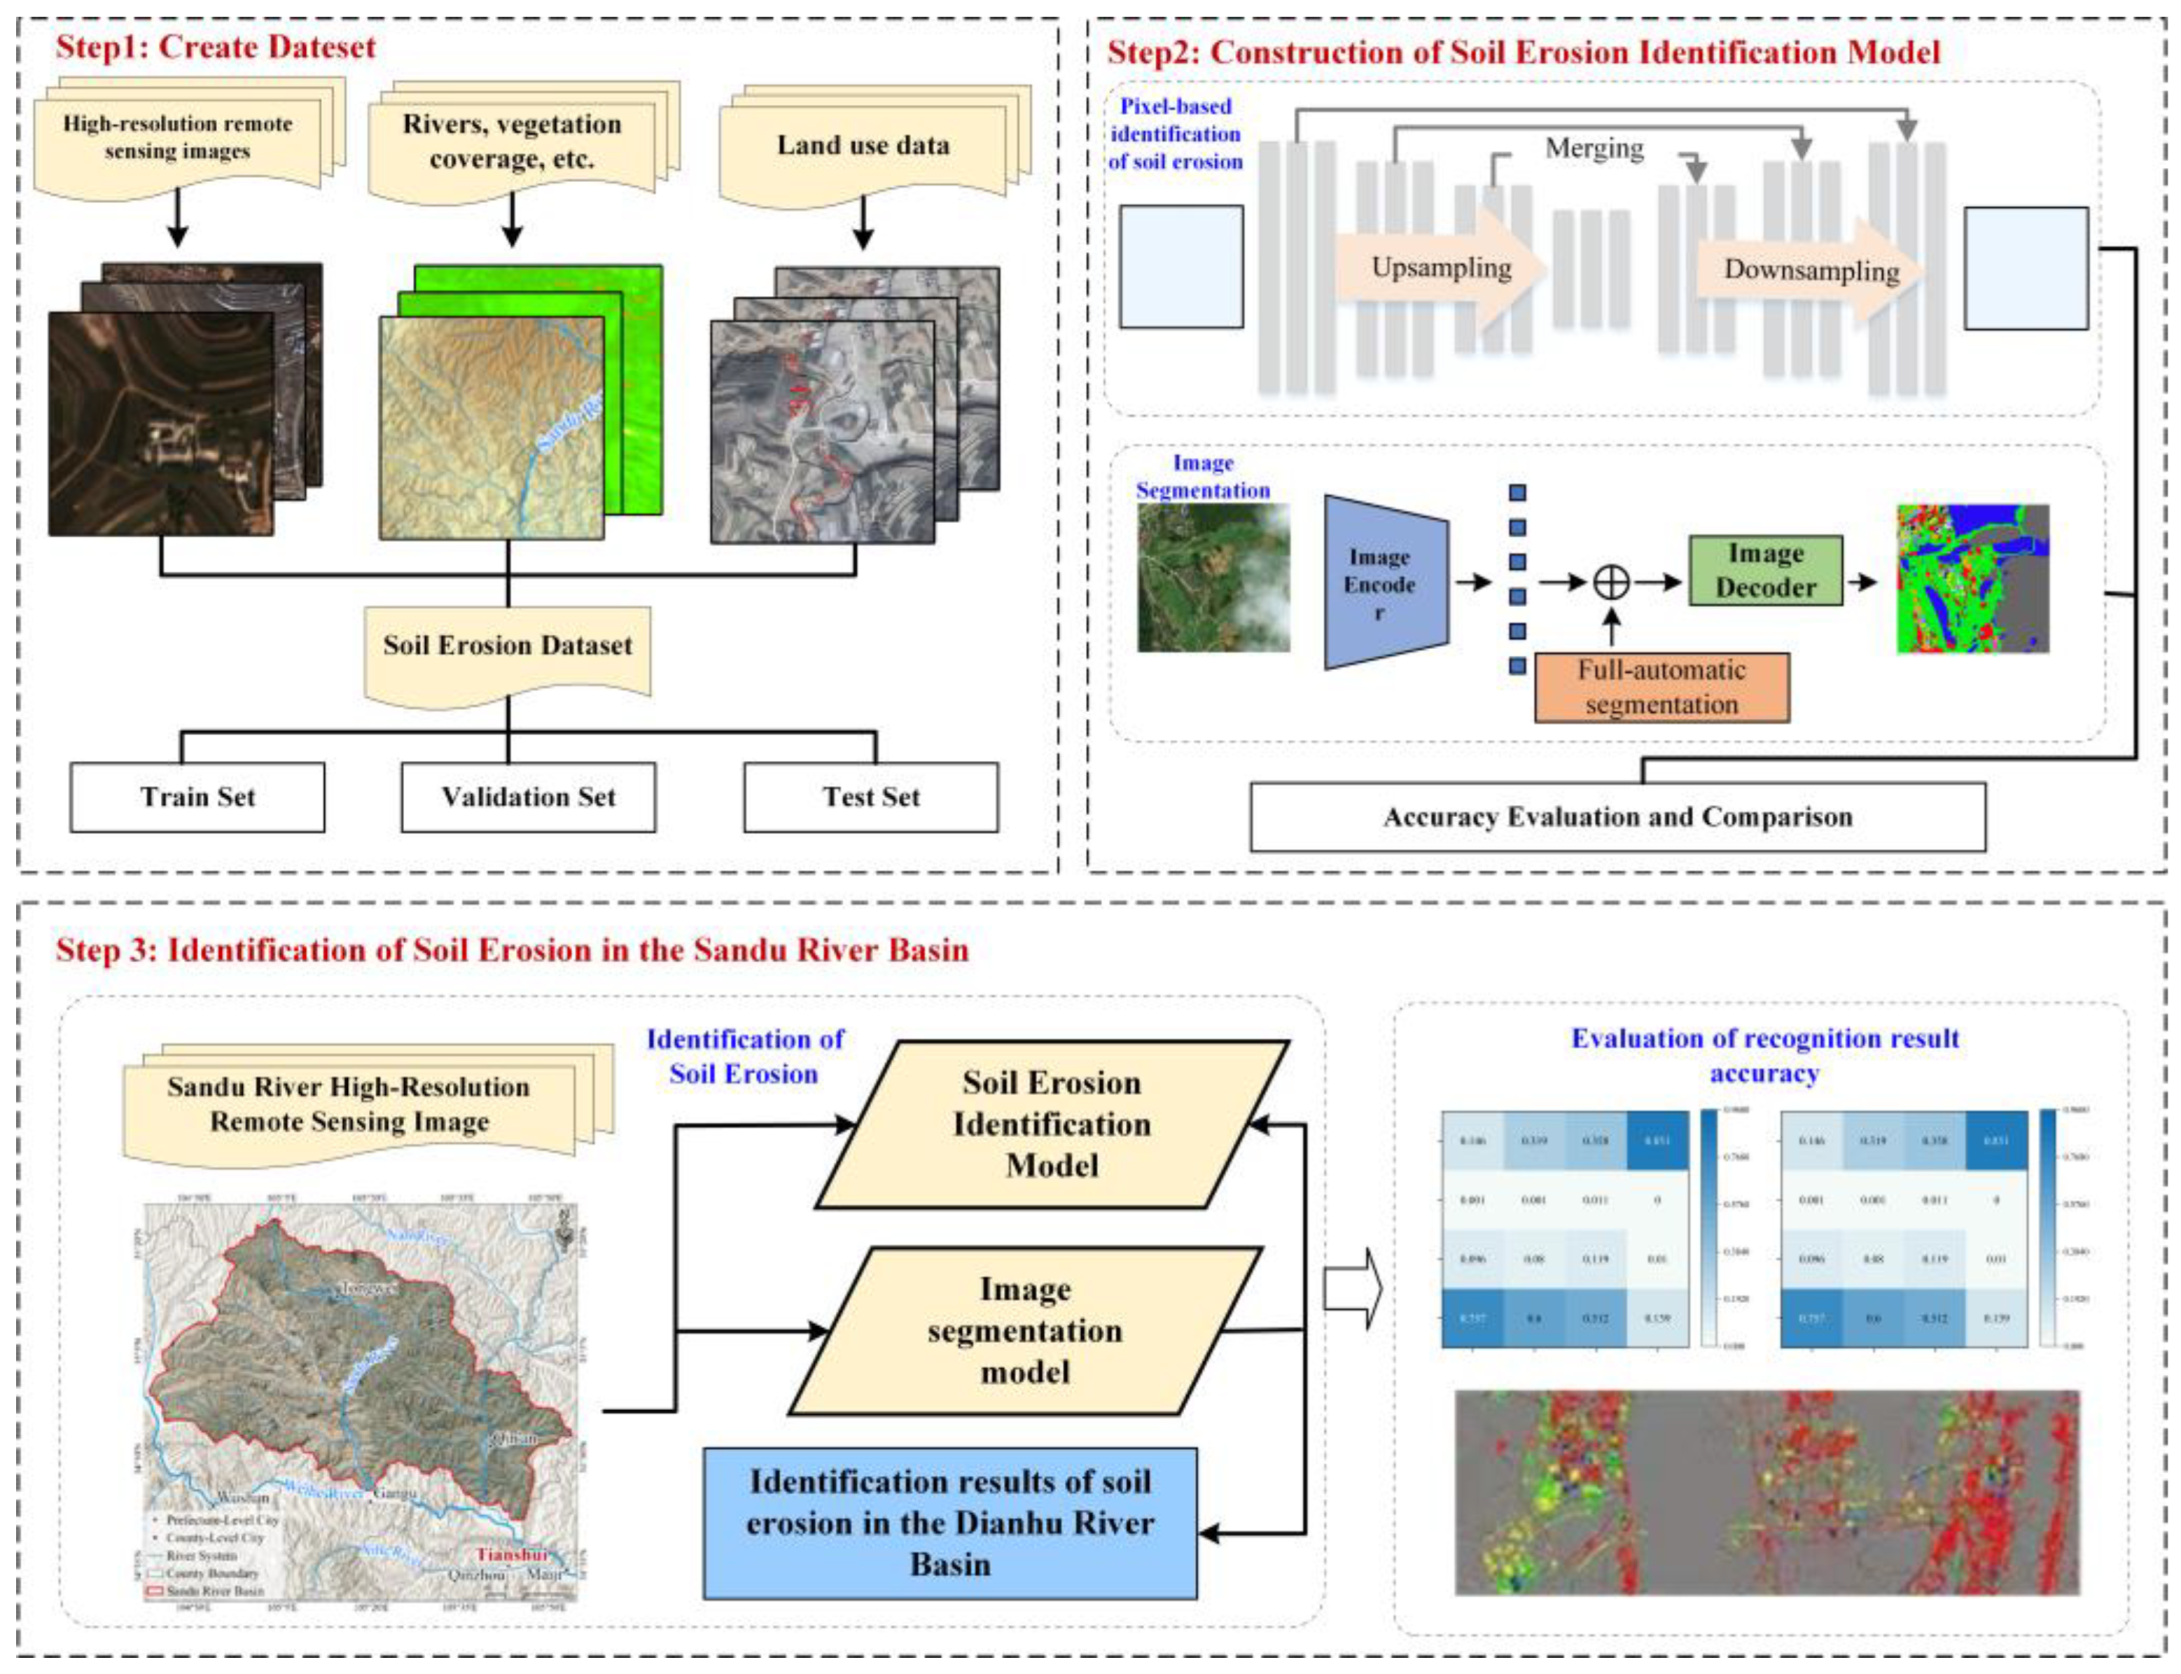
Figure 6.
Distribution of elevation difference before and after DSM correction. a, Sandu River watershed, b-f, Huanglong River, Jimaligou, Cunpinggou, Zhangjiagou, and Zaotangou. B and A denote the before and after DSM correction. σ denotes the mean square error of elevation difference from 2014 to 2024.
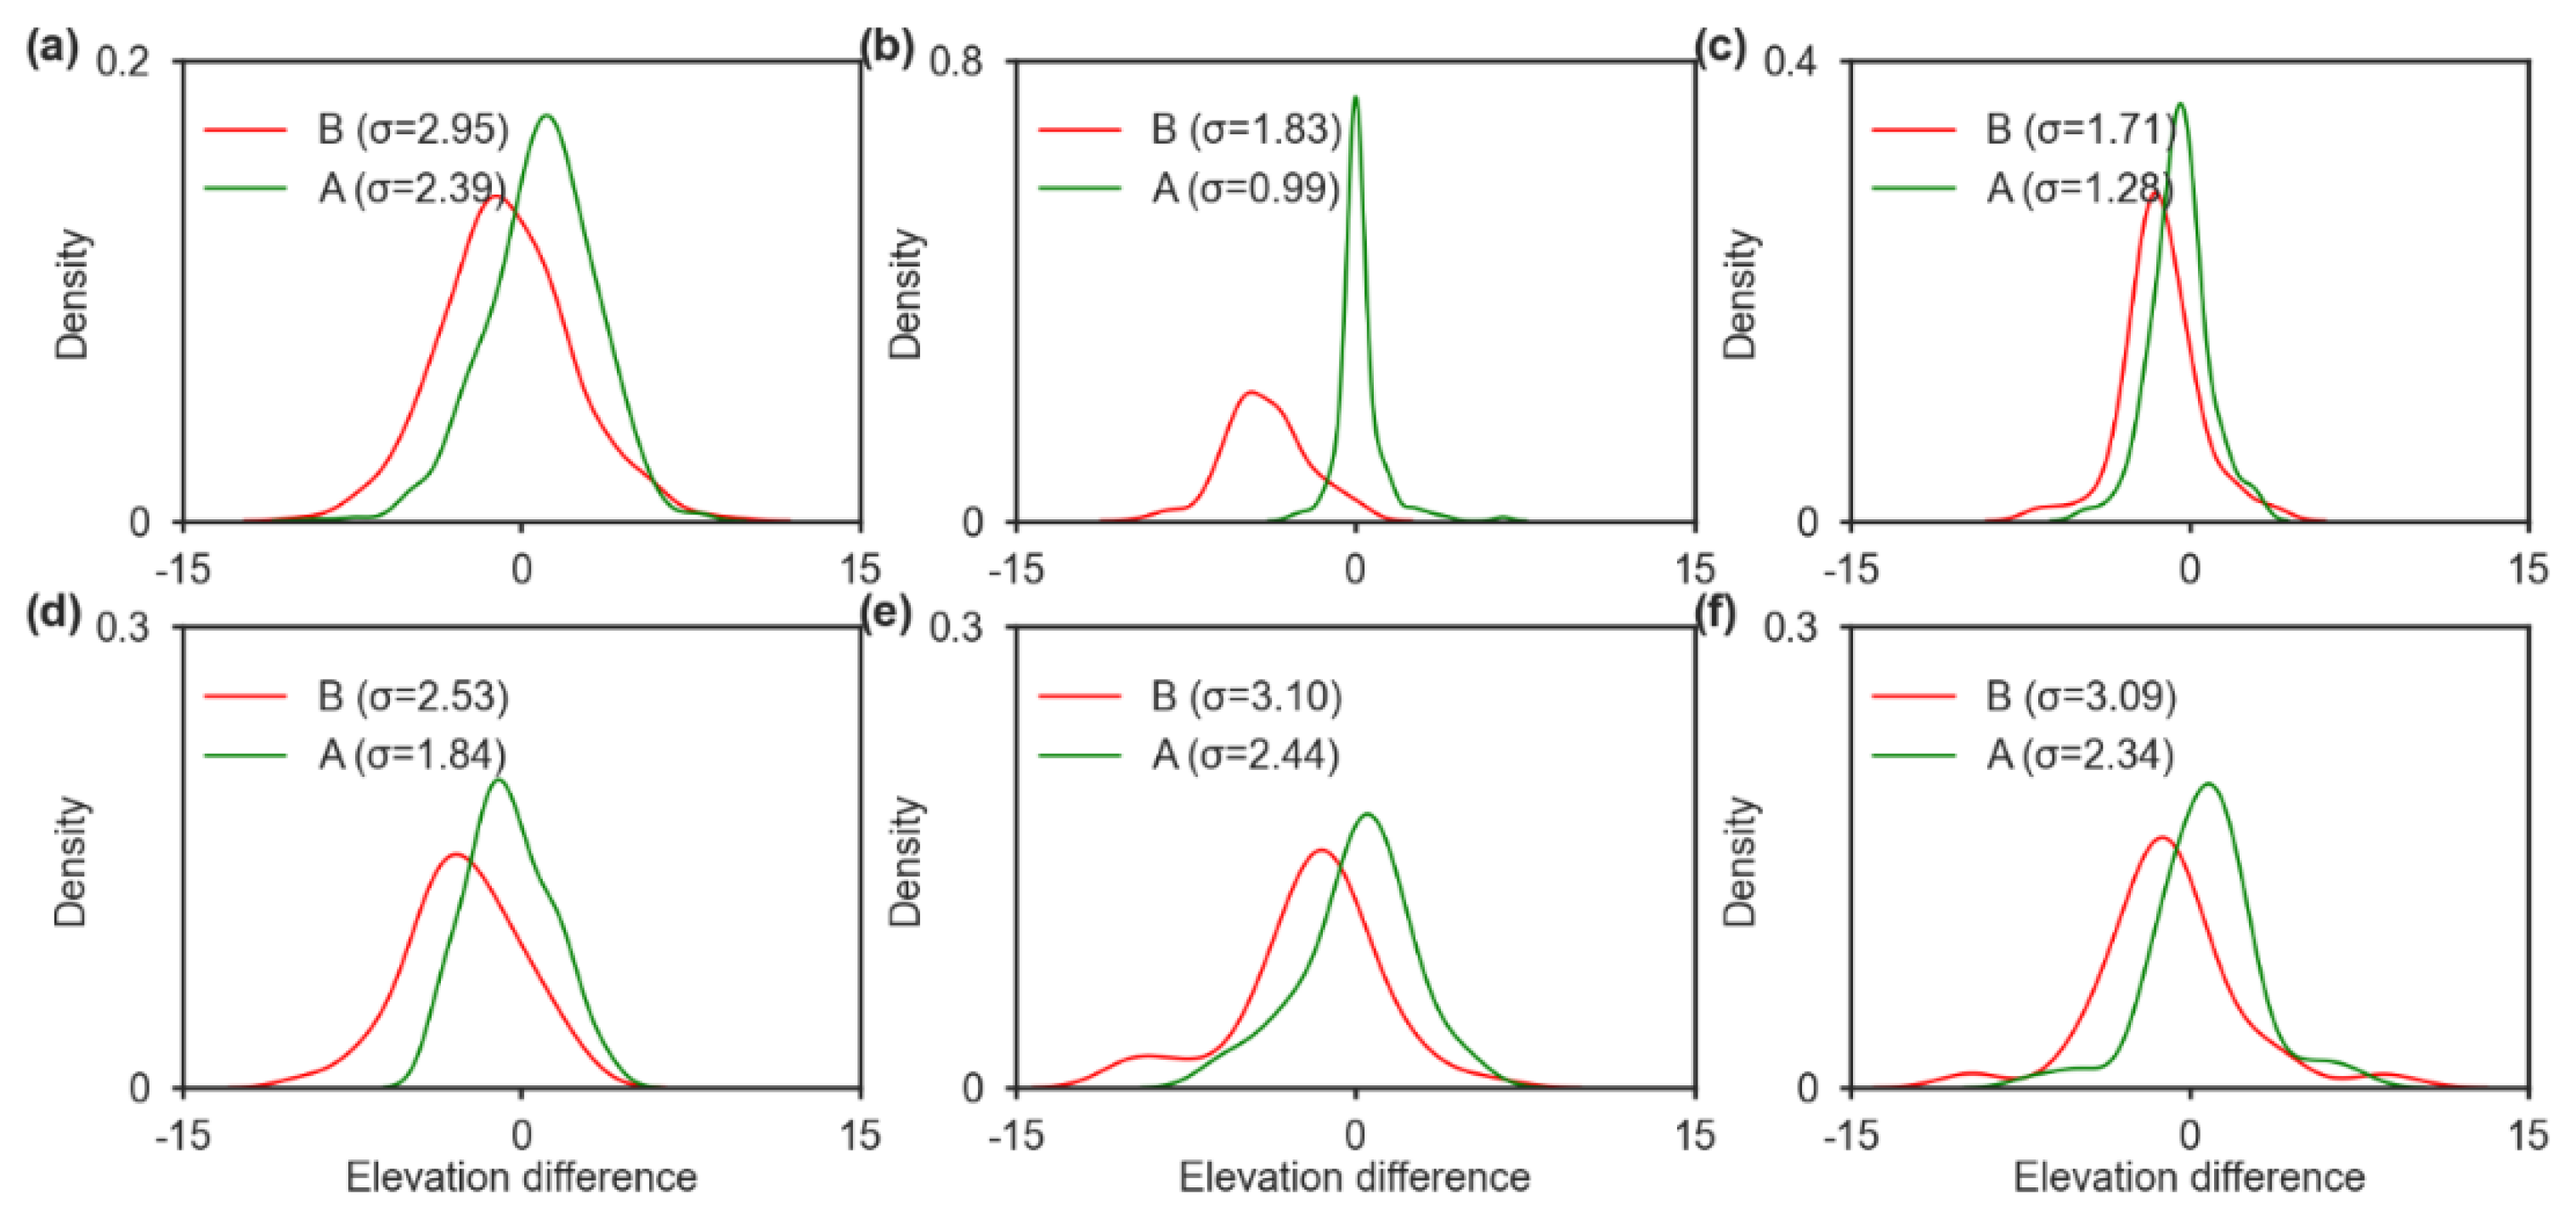
Figure 7.
The distribution of corrected DSM in the Sandu River watershed. (a) denotes the results in 2014. (b) shows the results in 2024.
Figure 7.
The distribution of corrected DSM in the Sandu River watershed. (a) denotes the results in 2014. (b) shows the results in 2024.
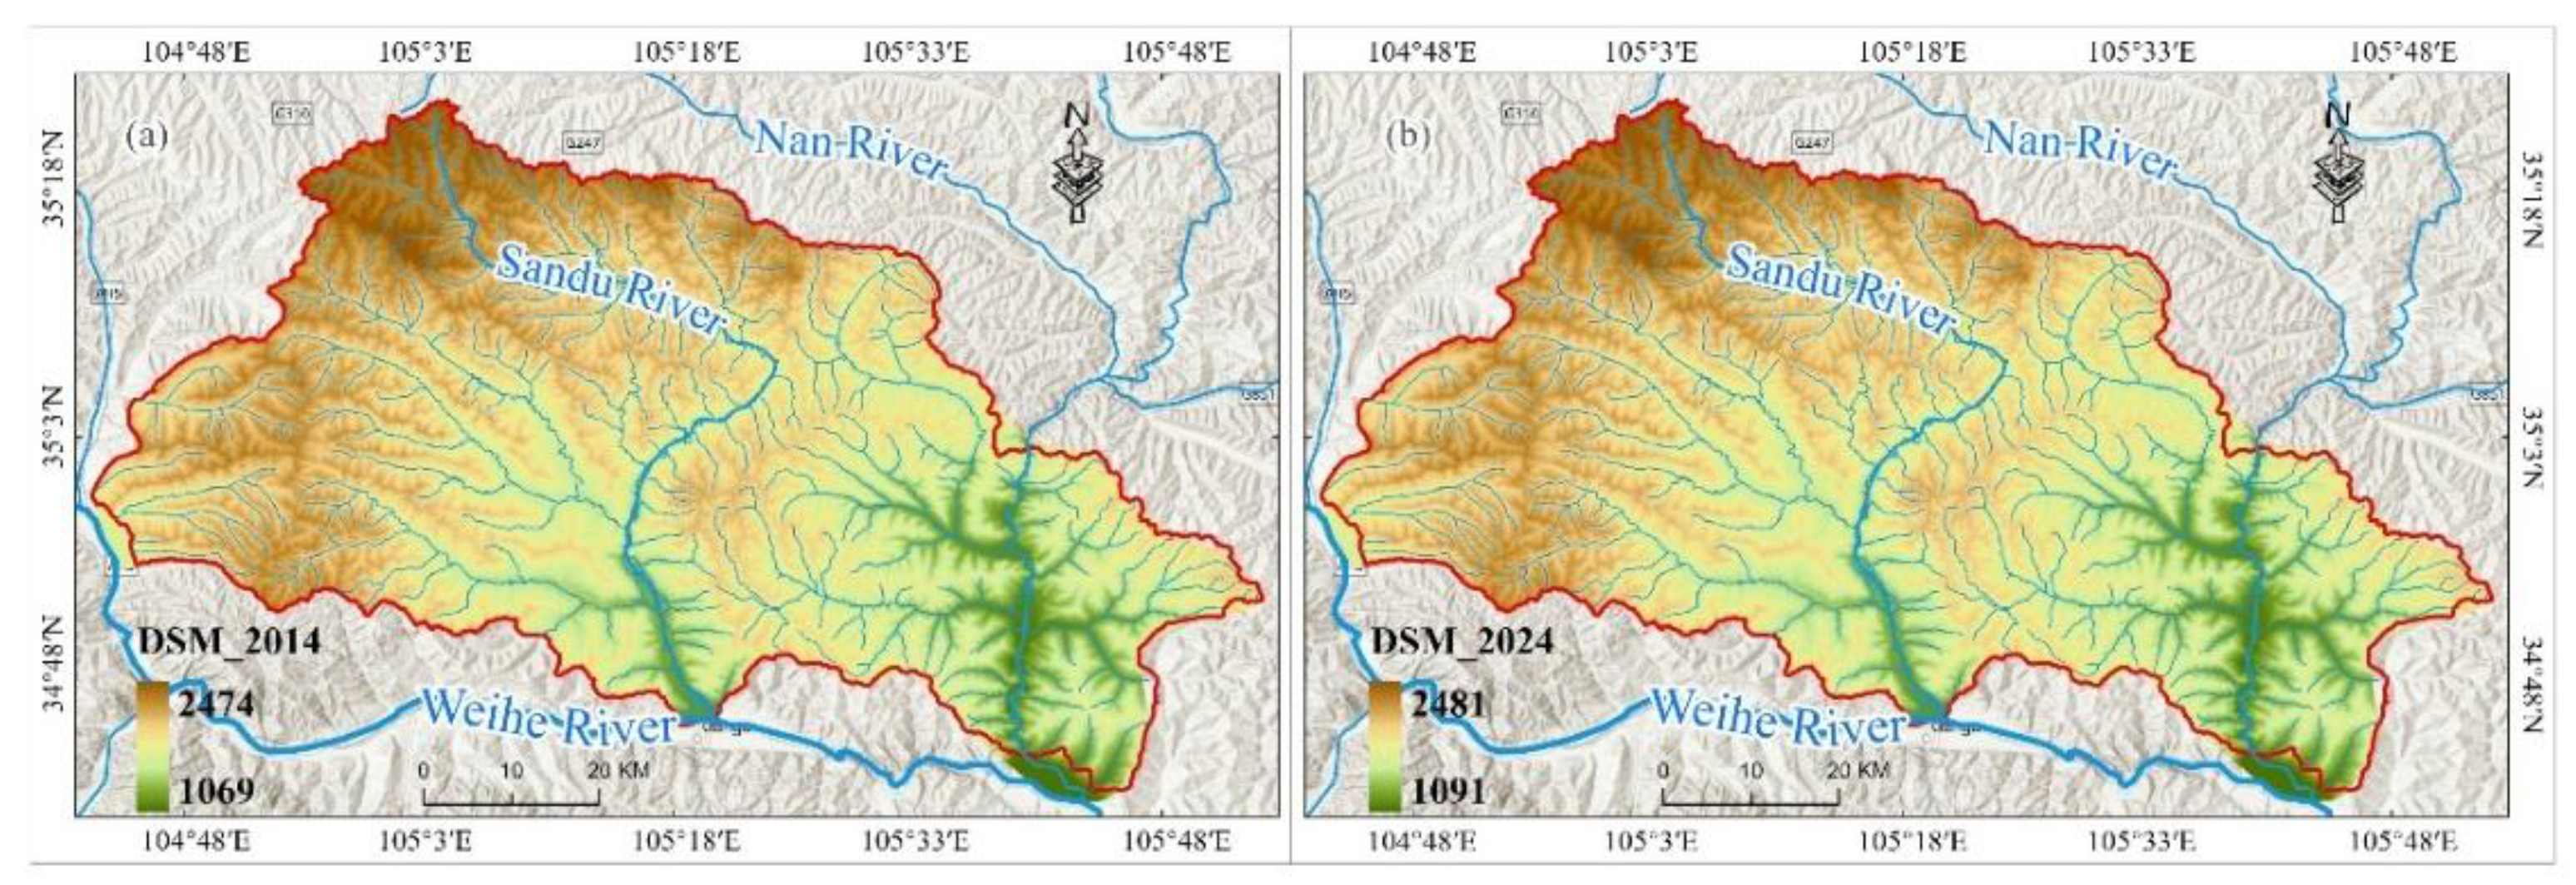
Figure 8.
Comparison of changes in gully erosion depths. a, gully erosion depth in Sandu River watershed during 2014–2024. b, the elevations of the centerline of the gully in Sandu River watershed for 2014 and 2024 respectively. c, Distribution of elevations in the gully centerline in Sandu River watershed. d–h, Distribution of elevations in the gully centerline in fiver sub-watersheds including Huanglong River, Jimaligou, Cunpinggou, Zhangjiagou, and Zaotangou. μ denotes the mean value of elevation.
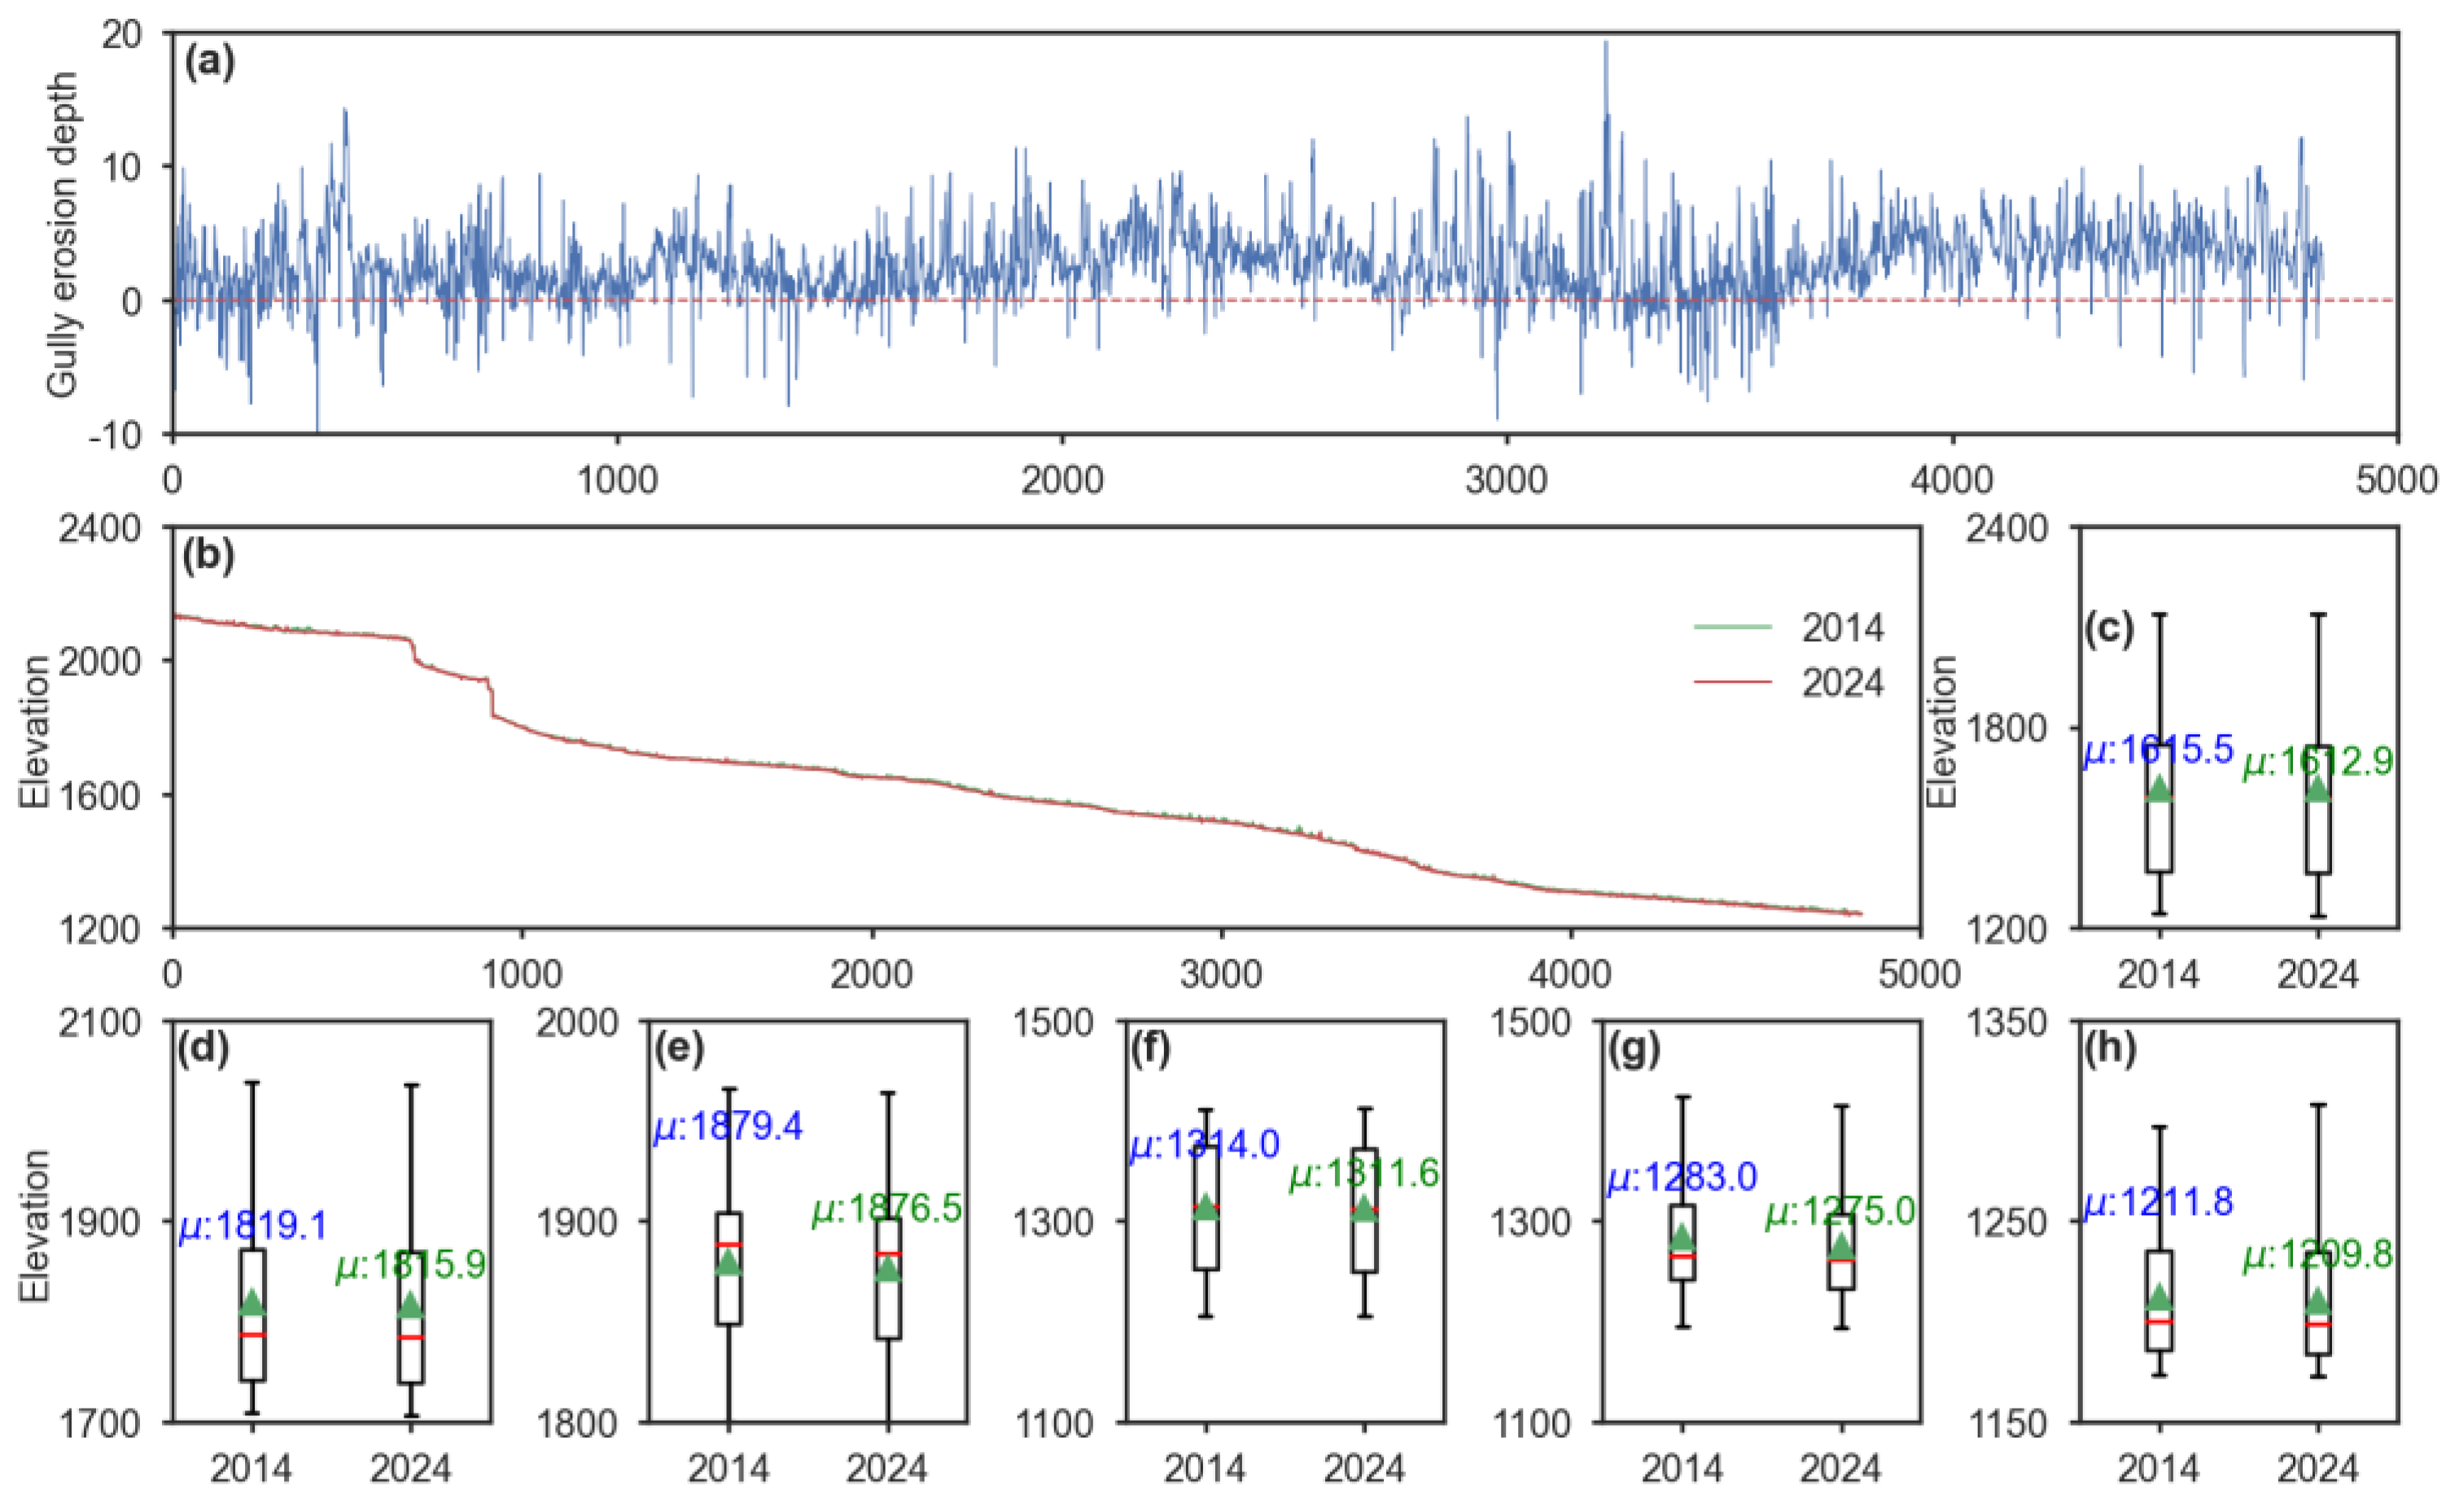
Figure 9.
Spatial distribution of severe soil erosion.
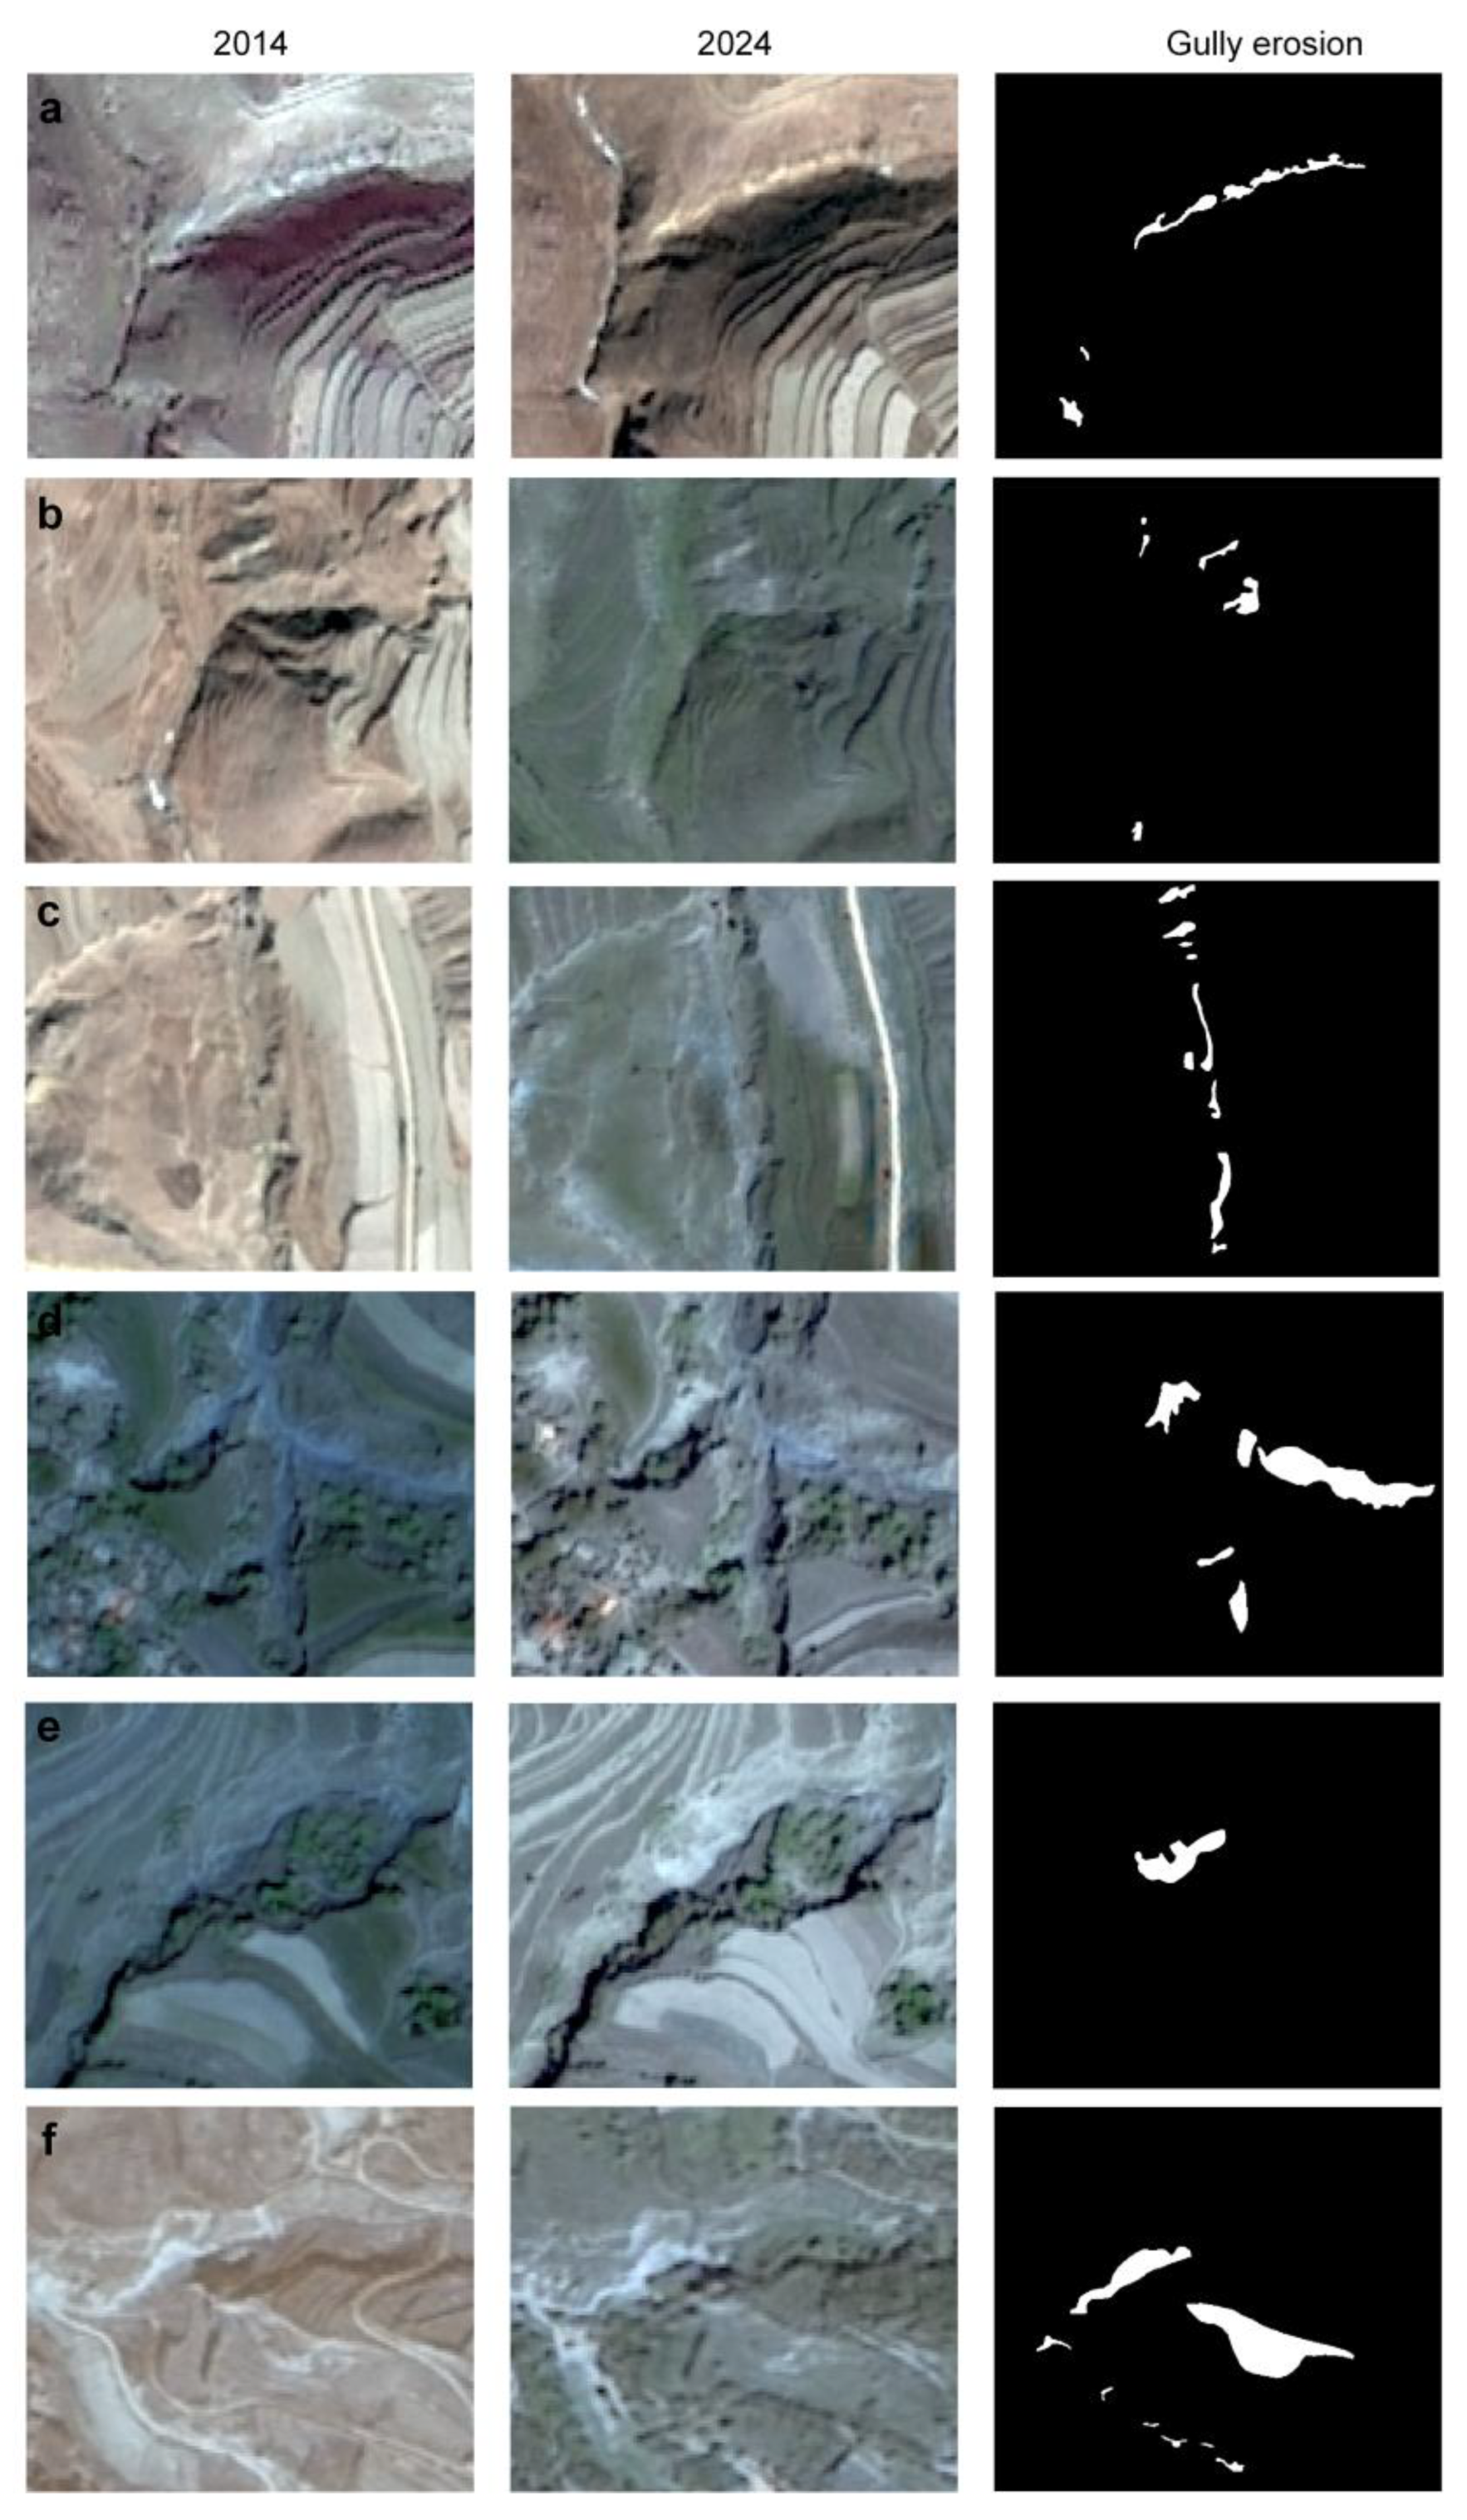
Figure 10.
Variations in gully erosion depths and driving factors during 2014–2024.
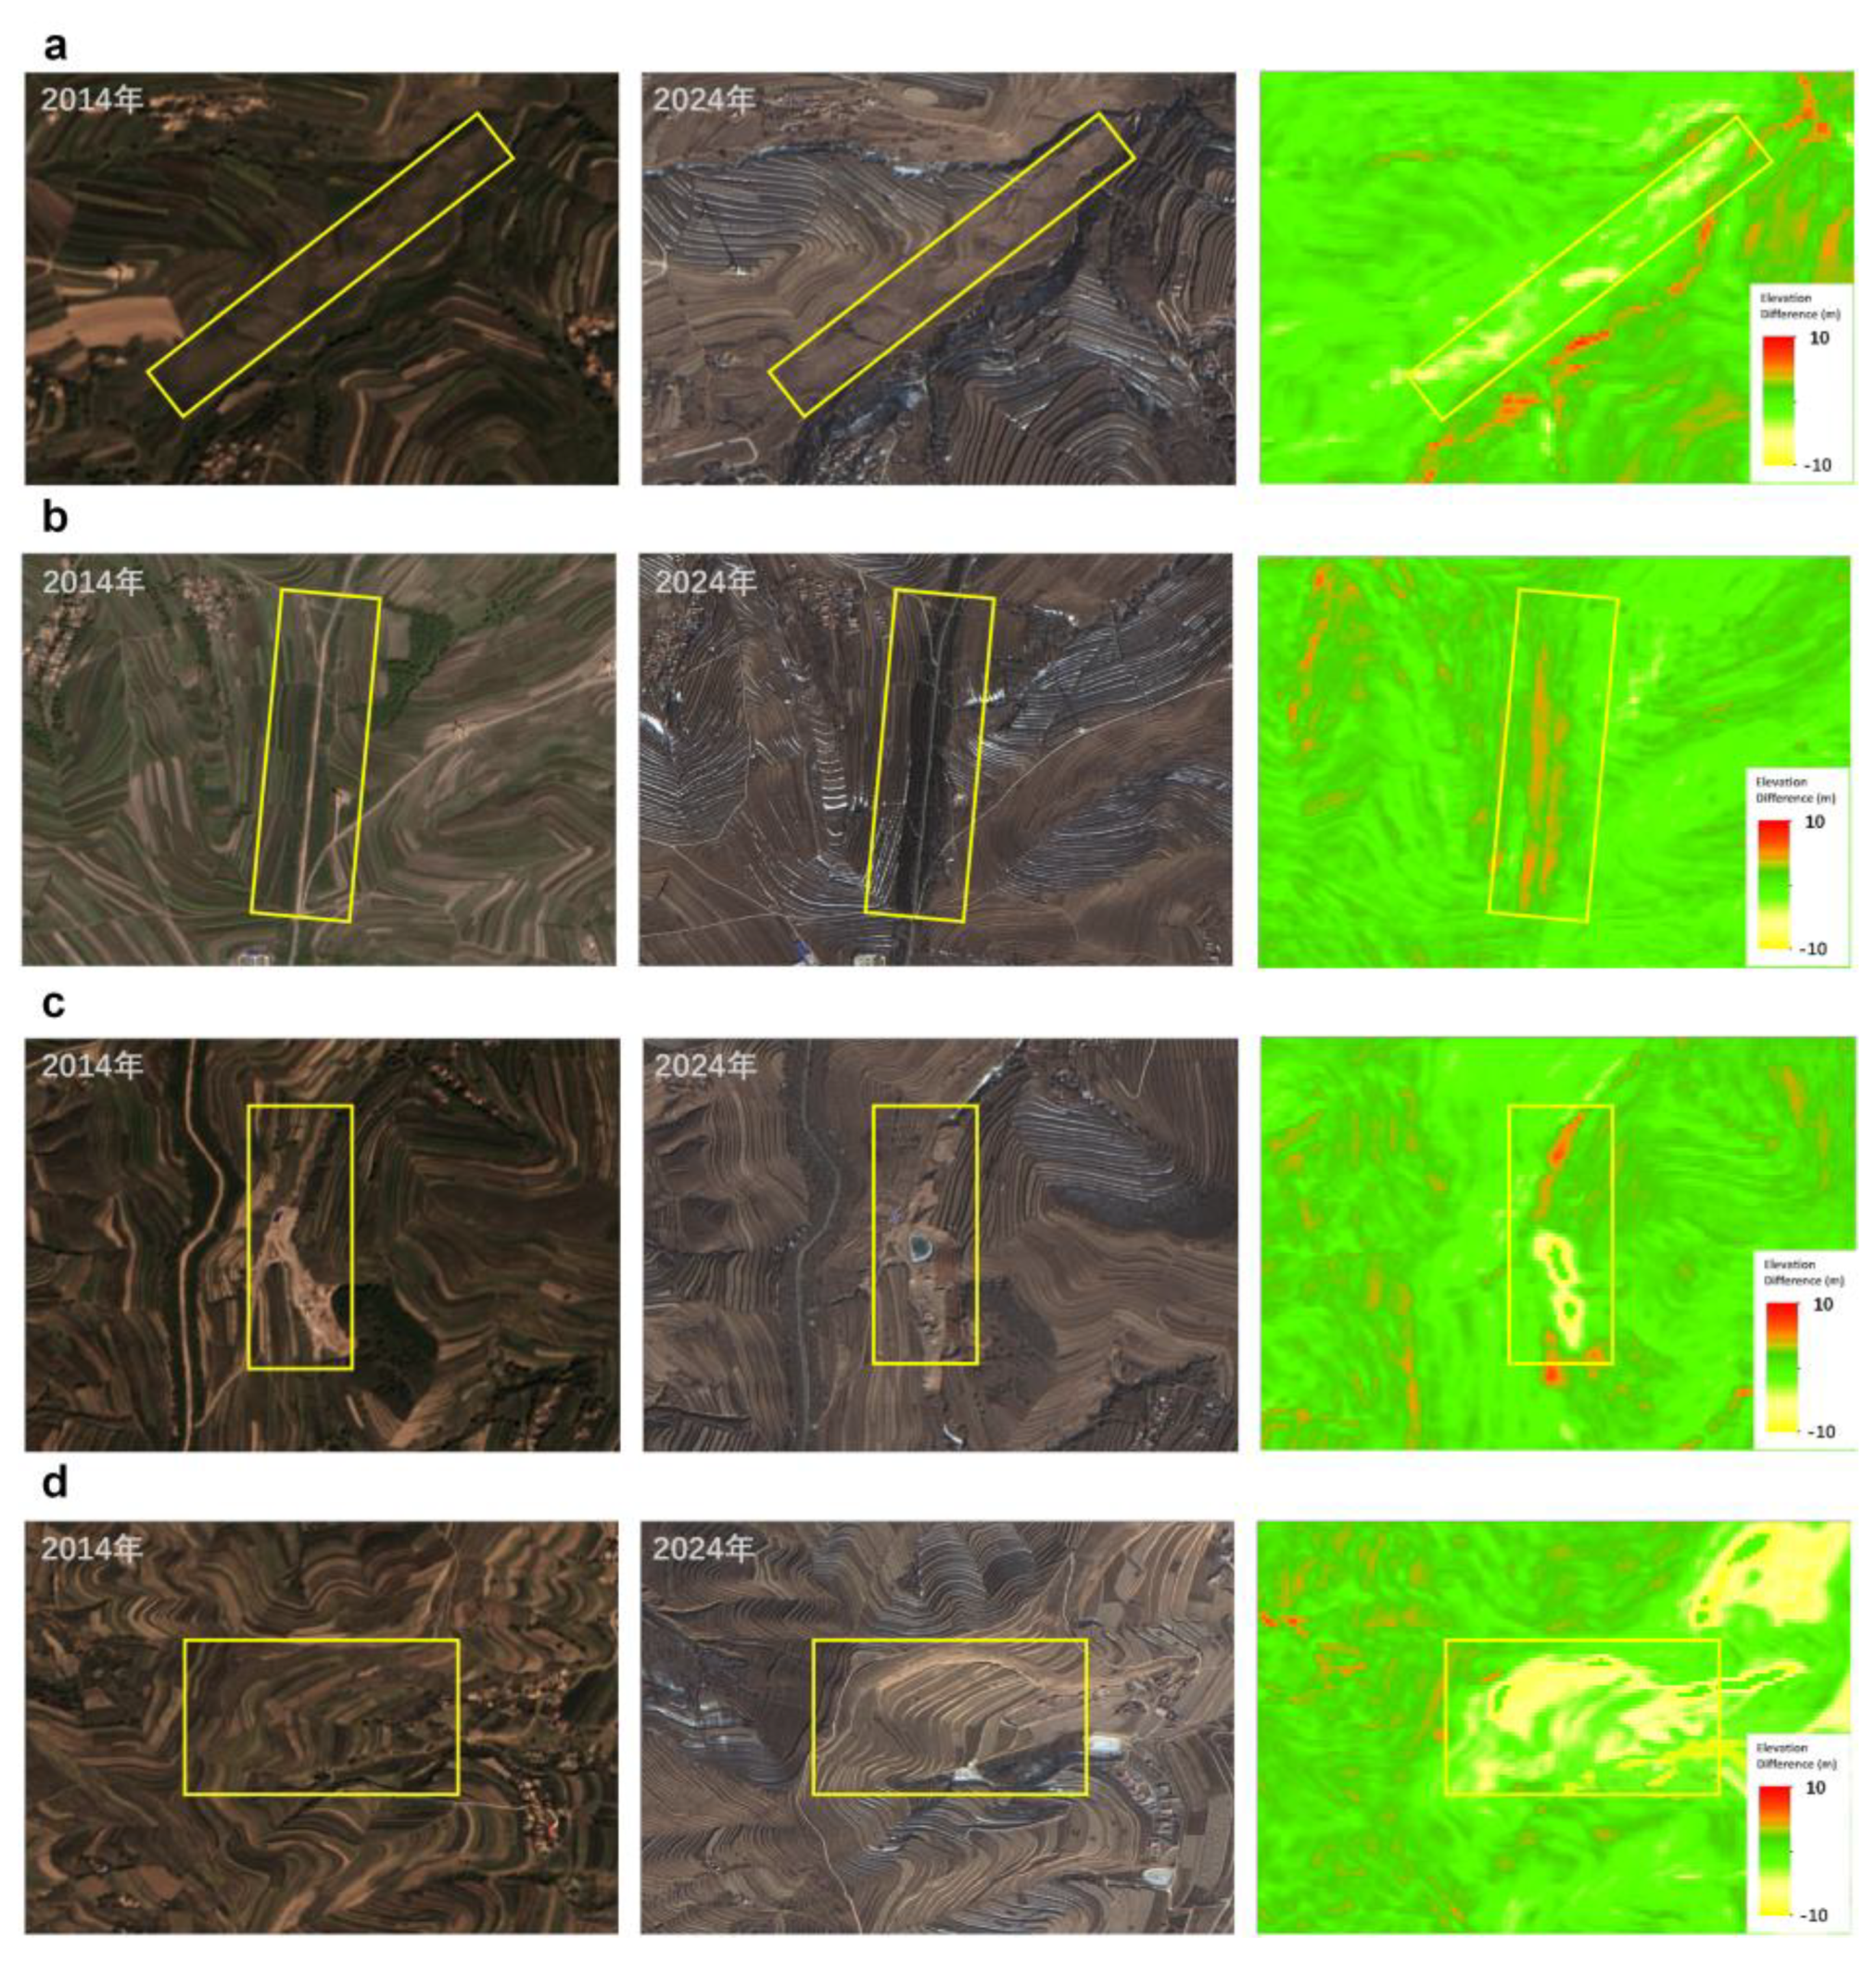

Table 1.
Datasets used in this study.
| Name | Resolution | Time | bands | Sensor | Scenes |
|---|---|---|---|---|---|
| CB04A | 2 m | 2024 | Blue, Green, Red, Nir | WPM | 1 |
| ZY302A | 2 m | 2014, 2023, 2025 | Blue, Green, Red, Nir | PMS | 5 |
| ZY302A | 10 m | 2013-2017, 2019, 2020, 2022-2025 | Three-line-array data | TMS | 23 |
| GF-6 | 2 m | 2019, 2024 | Blue, Green, Red, Nir | PMS | 3 |
| GF-7 | 0.8 m | 2020, 2023, 2024, 2025 | Blue, Green, Red, Nir | DLC | 12 |
| GF-1/ GF1D | 2 m | 2014, 2015, 2019, 2024 | Blue, Green, Red, Nir | PMS1/PMS2/ PMS | 22 |
| GF-2 | 0.8 m | 2024 | Blue, Green, Red, Nir | PMS1/ PMS2 | 2 |
| UVA | 0.2m | 2024 | Blue, Green, Red, Nir; LiDAR |
5 | |
| Meteorological data | Daily | 2014–2024 | Station | 9 stations |
Disclaimer/Publisher’s Note: The statements, opinions and data contained in all publications are solely those of the individual author(s) and contributor(s) and not of MDPI and/or the editor(s). MDPI and/or the editor(s) disclaim responsibility for any injury to people or property resulting from any ideas, methods, instructions or products referred to in the content. |
© 2025 by the authors. Licensee MDPI, Basel, Switzerland. This article is an open access article distributed under the terms and conditions of the Creative Commons Attribution (CC BY) license (http://creativecommons.org/licenses/by/4.0/).
Copyright: This open access article is published under a Creative Commons CC BY 4.0 license, which permit the free download, distribution, and reuse, provided that the author and preprint are cited in any reuse.


