
Submitted:
30 July 2025
Posted:
02 August 2025
You are already at the latest version
Abstract
Objectives: Significant attention should be given to healthy longevity in a country like Japan. This research aims to clarify the confounding factors between hav-ing a physician and/or dentist and healthy longevity. Methods: In September 2001, 16,462 elderly people aged 65 to 84. Residents of suburban Tokyo received a self-administered questionnaire by mail. The cohort survey was conducted three times. From the third year in 2004, the survival of 8162 individuals was tracked, confirming the death dates of 278 men and 160 women. Their bedridden status was verified three years later. Covariance structure analysis was utilized to clarify the causal structure of the hypothetical model with latent variables. Results: The direct impact of ⌈Physician and/or Dentists⌋ (⌈⌋ denotes observed variable) on “Healthy Longevity” (“” denotes latent variable), which correlates with both survival days and bedridden status, was nearly zero. By reducing ⌈Treated Diseases⌋ through the use of recommended "Lifestyle and Diet Scores” and “Three Health Factors” based on favorable “Socioeconomic Status,” residents found it easier to trust a family dentist instead of a physician, as their connection to maintaining “Healthy Longevity” became clear. Sixty-eight percent of “Healthy Longevity” was explained in the final model. This study clarified the confounding factors related to the role of family dentists and healthy longevity. Conclusions: In new health support initiatives aimed at encouraging healthy longevity, it is important to consider socioeconomic status as a foundation for reducing diseases that can be addressed through positive lifestyle habits and mental, physical, and social well-being, rather than solely relying on the idea that just having a family dentist leads to healthy longevity. By helping to reduce treatable diseases, the demand for family physicians is expected to decrease, while the emphasis on preventive dental care is anticipated to increase.
Keywords:
family dentist
; healthy longevity
; socioeconomic status
; confounding factor
; aged people
1. Introduction
Significant attention should be given to healthy longevity in a country like Japan, which has a rapidly aging population. Healthy longevity reduces the burden of long-term care and stabilizes medical costs. Most importantly, to achieve healthy longevity, individuals must maintain a high quality of life(QOL) and live comfortably [1]. In response to these challenges, Japan announced the Health Japan Plan 21 to achieve healthy longevity in 2000 [2]. This plan outlines strategies to uphold oral hygiene, promote a balanced diet, and implement measures to support lifestyle-related habits, including smoking cessation.
Family dentists play a crucial role in promoting good oral hygiene practices. The Japan Dental Association defines a family dentist as follows [3]: somebody who provides safe and secure dental care, with a broad range of knowledge and insights related to medical care. They fulfill their responsibilities in regional medical care to maintain and enhance oral function throughout residents’ lives. Conversely, family doctors play an essential role in preventing and treating various diseases, conducting health checkup activities, and improving lifestyle habits. The Japanese Medical Association defines a family doctor as a home medical doctor who can discuss health-related issues and refer patients to a specialized medical institution when necessary [4].
The Japan Dental Association has released a report clarifying the current scientific basis for dentists’ contributions to medical care and disease prevention, to foster a society that promotes longevity. The title of this report is “Evidence for Dental Health and Oral Health that Contributed to a Healthy and Longevity Society in 2015” [5]. This report also includes a follow-up study showing that women’s survival rates were maintained, particularly when the number of remaining teeth, a desirable outcome of oral hygiene care, was ten or more [6]. Furthermore, the incidence of aspiration pneumonia was significantly higher among institutional residents in the control group without oral hygiene care intervention compared to the group receiving oral hygiene care support. As a result, the mortality rate was reduced [7].
In a study examining the relationship between having a family dentist and subsequent survival maintenance, the authors tracked the survival days of 16,462 older adults living in the suburbs of Tokyo over six years. We reported that the cumulative survival rate after this period was significantly higher for both men and women than for those without a family dentist. An analysis using the Cox proportional hazards model, which accounted for other related factors, revealed that women with a family dentist had significantly more survival days [8].
Even if a family dentist’s presence and continued existence are maintained, the causal structure and related socioeconomic status, such as educational background, annual income, lifestyle habits, and physical, mental, and social health, remain unclear. The importance of relying solely on dentists for healthy longevity can be evaluated by examining socioeconomic status and the possibility of a causal relationship tied to positive lifestyle habits.
Several factors have been identified that can support survival. The main factors affecting survival include healthy lifestyle habits and diet [9,10], while mental [11,12], physical [13,14], and social health [15,16] are also recognized as predictors of survival rates. Research has shown that higher annual income is strongly associated with increased survival rates [17]. At the same time, it has been reported that having a dentist rather than a family physician is associated with healthier longevity after three years [18]. However, confounding factors related to cause and effect have not been examined.
In this way, effective health support activities can be achieved by clarifying not only the presence of a family dentist and the subsequent maintenance of health to prevent the need for long-term care, but also a wide range of factors related to healthy longevity. These include not only direct relevance but also causal relationships involving confounding variables. To emphasize the importance of dentists' role in promoting healthy longevity, it is crucial to clarify the causal link between socioeconomic status, positive lifestyle habits, and overall health, including mental, physical, and social well-being.
This study aims to clarify the structural relationship between family doctors and/or dentists, socioeconomic status, physical, mental, and social health, disease status, lifestyle, and confounding factors among older adults living in suburban areas of Tokyo. It also explores the causal structure of healthy longevity as a dependent latent variable linked to bedridden status after three years and the number of survival days over the subsequent three years, categorized by sex. If this research hypothesis is confirmed, we expect that the importance of having only a family dentist, a controllable factor, will be highlighted.
2. Materials and Methods
2.1. Research Subjects
In September 2001, we conducted a questionnaire survey among elderly individuals aged 65 and older living at home in suburban Tokyo, specifically in Tama City, Japan. Out of 16,462 eligible elderly individuals, 13,066 (79.4% response rate) provided informed consent to participate in the study and returned the self-administered questionnaire by mail. In September 2004, we sent a second questionnaire, identical to the first, to the respondents. A total of 8558 participants responded (505 had moved, 914 were deceased, and 4089 did not respond). We followed up with all the participants until 31 August 2007. We analyzed 8162 subjects, including 3851 males and 4311 females, aged 65 to 84 during the first survey, who were able to determine their need for long-term care three years later. Over the three-year period from 2004 to 2007, we confirmed the survival durations and death dates of 278 men and 160 women through the municipal resident registry.
2.2. Research Area
The city selected for this study was partly developed as a commuter town to accommodate the growing number of workers and their families in the metropolitan Tokyo area from the 1970s to the 1990s, an era marked by significant economic growth in Japan. Most residents belonged to the middle class. As of 2000, the city’s total population was 145,862, with 11.1 percent of the population aged 65 or older.
2.3. Questionnaire and Measures
In the surveys, standardized questions were used to validate assessments of health status and lifestyle. In 2001, socioeconomic status was evaluated based on educational attainment and annual income. Educational attainment levels were categorized into four groups: high school graduates, junior college graduates, those who achieved a higher education level than college, and individuals who chose not to respond. Annual marital income levels were classified into four categories: less than JPY 1 million (equivalent to less than USD 6667 at an exchange rate of 1 USD = JPY 150), less than JPY 3 million, less than JPY 7 million, and more than JPY 7 million in 2001.
We included educational background, annual income, and height as additional variables to analyze socioeconomic status. The reason for including height in the survey is that a certain level of height growth indicates a prosperous and healthy childhood. Height has been reported to be a highly valid indicator of survival prognosis after about half a century [19,20].
Jousilahti et al. [19] conducted follow-up research involving 31,199 adult residents in eastern Finland. They tracked these individuals for 15 years and reported that shorter height was associated with an increased overall mortality rate. Similarly, the survival of 13,460 older adults in the suburbs of Japan was monitored over a three-year period. It was reported that the mortality rate for males with a BMI of less than 19 and females with a height of less than 150 cm was significantly higher than that of the taller group [20].
Healthy lifestyle factors are recognized as beneficial habits strongly linked to increased survival days [9]. Our analyses reveal that habits associated with longer survival include daily alcohol use, never having smoked (even in the past), sleeping less than nine hours per night, exercising more than once a week, and maintaining a BMI above 20. We assessed these healthy lifestyle habits on a scale from 0 to 5, where higher scores reflect a healthier lifestyle.
Our analyses identified healthy dietary habits: consuming meat, eggs, and blue-backed fish 1 to 4 days per week; eating soy foods, dairy products, and fruits more than three days per week; consuming vegetables more than five days per week; and having breakfast daily. Lastly, we calculated the dietary health score based on the consumption of the four recognized healthy food categories (three points for each type), ranging from 0 to 12, with a higher score indicating healthier nutritional habits [10].
In 2001, mental health was self-reported as a subjective measure. We asked the question, “Do you think you are healthy?” The respondents had four options: very healthy, moderately healthy, not so healthy, and not healthy [11]. The life satisfaction question was, “Are you satisfied with your daily life?” This question provided three options: very satisfied, moderately satisfied, and unsatisfied. The scores ranged from 1 to 3 [12].
The three health-related dimensions examined in our study include physical, mental, and social health components. Physical health parameters encompassed basic activities of daily living (BADLs) [13] and instrumental activities of daily living (IADLs) [14]. Three questions were posed to assess an individual’s BADs: “Can you go to the toilet by yourself?”, “Can you take a bath by yourself?”, and “Can you walk outside?”. Individuals received 1 point for each function they could perform, resulting in overall scores ranging from 0 to 3, where higher scores indicated a greater level of basic activity competence. An individual’s IADLs were determined by asking five questions related to instrumental activities: “Can you buy daily necessities by yourself?”, “Can you cook daily meals by yourself?”, “Can you deposit and withdraw money in a bank account?”, “Can you complete documents related to insurance and pensions?” and “Can you read books and newspapers?” Since the IADLs were similar to the BADLs, total scores ranged from 0 to 5, with higher scores indicating a greater capability to perform instrumental activities.
Social health was measured by variables such as communication within the neighborhood. The question examined the frequency of going outside: “How often do you go outside, including around your neighborhood?”. The responses ranged from less than once a month to more than 3 to 4 times a week [15]. Communication with the neighborhood was assessed by asking, “How often do you communicate with your friends or neighbors?”. Using a scale from 1 to 4, the responses were seldom, once a month, 3 to 4 times a week, and almost daily [16].
Given the high prevalence of diseases closely associated with decreased survival over six years, we concentrated on five conditions: hypertension, cerebrovascular disease, diabetes, heart disease, and liver disease. The range of treated diseases varies from 0 to 5 points.
The number of survival days for the dependent variable was measured over a three-year period starting in 2004, while considering the stability of the survival rate. Bedridden status was used to assess the health condition of elderly participants three years later. This evaluation employed a public tool developed by the Japanese Ministry of Health, Labour, and Welfare. The tool has six levels, from the least severe (requiring mild support) to the most severe (requiring full care). In our analysis, respondents who received no care scored zero, those classified as the least severe scored one, and those at the most severe level scored six. The independent variable “Healthy Longevity” was defined as a latent variable that accounts for the number of days survived after three years over the following six years, with bedridden status at three years used as an observational variable.
Data were analyzed using the Statistical Package for the Social Sciences (SPSS) and AMOS Version 27.0 software (IBM, New York, NY, USA). The relationships among categories were assessed with the chi-square test or Kendall’s τ test, and quantitative comparisons were made using a one-way analysis of variance. To clarify the causal structure of the hypothetical model with latent variables, covariance structure analysis [19,20] was employed.
The latent variables in the model were identified using exploratory factor analysis, with the varimax rotation method and the maximum likelihood estimation approach. When analyzing the causal structure, the model’s goodness-of-fit indices included the NFI (Standardized Fit Index), IFI (Incremental Fit Index), and RMSEA (Root Mean Square Error of Approximation) [19,20]. All estimates were standardized constants, and the threshold for statistically significant differences was 5% or less.
3. Results
3.1. Classification Method of a Family Physician and/or Dentist
Table 1 presents the gender and age groups of the subjects. A total of 8162 subjects, including 3851 men and 4311 women, aged 65 to 84, were analyzed. Previous studies have detailed the distributions of all the variables used in this study by sex [17,18].
The percentage of individuals with a family physician and a family dentist was 60%. The respective percentages were 17% for those with only a family physician and 12.7% for those with only a family dentist. The number of individuals with only family physicians significantly increased with age, while the proportion of those with only family dentists declined. Six hundred seventy-nine people (8.5%) were uncertain whether they had a physician or a dentist (Table 1). We examined the relationship between the actual conditions of physicians and dentists and the number of survival days. Participants were divided into four groups based on their survival days, ranked from longest to shortest. The group with the longest survival was associated with having only a family dentist. In contrast, the second-longest survival group included individuals with neither a family physician nor a dentist. The third group consisted of individuals with both family physicians and dentists; the shortest survival group comprised individuals with only family physicians (Table 1). The most extended three-year survival was recorded for those with just a family dentist, averaging 1042.9 days for men and 1054 days for women. In comparison, individuals with only a family physician averaged 1031 days for men and 1036 days for women. A multiplex comparison of survival days using a one-way analysis of variance revealed that the group with only family dentists had a longer lifespan than the group with only family physicians. However, a statistically significant difference was observed only in women. When examining the level of care required after three years among the four groups with family doctors and/or dentists, the rate of bedridden status remained favorable in the group with only family dentists compared to the other three groups for both men and women. Additionally, in the group consisting of internal physicians and dentists, the required level of care for both men and women was more favorable than in the group with only family physicians. There was no specific association between the group with a family doctor and dentist and the group without either a doctor or a dentist. However, the number of diseases treated was significantly higher in the group with both a family physician and a dentist than in the group without either. Therefore, in Table 2, we have compared the relevant factors divided into two groups—family physician only and family dentist only, by gender (Table 2).
3.2. Causal Structure with Various Factors for Healthy Longevity
(1) Latent Variables for Covariance Structure Analysis by Factor Analysis
This analysis employed the maximum likelihood procedure and a Promax oblique rotation to examine the causal structure of healthy longevity through latent variables.
The number of survival days and bedridden status were defined as “Healthy Longevity” and recognized as dependent latent variables.
The factor analysis revealed that the first factor encompassed IADLs and BADLs, as “Physical Health”.
The second factor was divided into two latent variables: “Mental Health” and “Social Health,” as well as “Lifestyle Scores and Diet Scores,”. The third factor is “Socioeconomic Status,” which includes educational background, yearly income, age, and height, thus classifying it as a latent variable.
⌈Treated Diseases⌋ and ⌈Physicians and/or Dentists⌋, which were classified as four factors, were separate observational variables intended to be analyzed as dependent observed variables.
The cumulative sum of squared loads for the three factors mentioned was 28.5%, while Cronbach’s Alpha Confidence Coefficient of the “Three Health Factors” was 0.59. However, the “Socioeconomic Status” was notably low at 0.08 (Table 3).
(2) Structure relationship for healthy longevity
From the hypothetical models inferred using the latent variables obtained through exploratory factor analysis, we identified the model with the highest goodness of fit based on a modified index [19,20]. Survey items that excluded “Healthy Longevity” but included “Socioeconomic Status,” “Lifestyle Diet Scores,” “Three Health Factors,” and ⌈Treated Diseases⌋ and ⌈Physicians and/or Dentists⌋ were surveyed simultaneously. Consequently, each survey item may function both as a cause and an effect. We examined the direction and strength of the cause-and-effect relationships across all possible combinations to clarify causality. For instance, if only dentists are selected, the three health factors are expected to be favorable based on the advisable “Socioeconomic Status.” Conversely, due to the superiority of the “Three Health Factors,” having fewer diseases may lead individuals to choose a dentist over a physician.
Therefore, we analyzed the causal relationships among all combinations and selected the one with the largest standardized estimate. As a result, we set “Healthy Longevity” as a dependent latent variable, using “Socioeconomic Status”, “Three Health Factors”, and “Lifestyle and Diet Scores” as explanatory latent variables. Both ⌈Treated Diseases⌋ and ⌈Physician and/or Dentist⌋ were established as observed explanatory variables. The absence of a drawn path indicates that no significant difference was found.
(3) Causal Structure of Explanatory Factors on “Healthy Longevity”
In the comprehensive analysis presented in Figure 1, the most effective standardized total impact on “Healthy Longevity” was achieved through the recommended combination of “Three Health Factors” and “Lifestyle and Diet Scores,” based on “Socioeconomic Status.” Additionally, the number of ⌈Treated Diseases⌋ is maintained along the path to “Healthy Longevity.” The standardized total effect of the “Three Health Factors” on “Healthy Longevity” is 0.83, accounting for 68% of the coefficient of determination of “Healthy Longevity.” In Figure 1, the standardized estimates of the direct effects of ⌈Physicians and/or Dentists⌋ on “Healthy Longevity” were nearly zero.
On the other hand, the total effect of ⌈Physicians and/or Dentists⌋ on “Healthy Longevity” was 0.13, as shown in Figure 2. Therefore, the structural relationships between ⌈Physician and/or Dentist⌋ and “Healthy Longevity” were identified as confounding factors influenced by “Socioeconomic Status,” “Three Health Factors,” “Lifestyle and Diet Scores,” and ⌈Treated Diseases⌋. These confounding factors were recognized as novel research findings. Next, the relationship among each observed variable, the latent variable, and “Healthy Longevity” will be described.
(4) Causal Structure of ⌈Physician and/or Dentist⌋ on “Healthy Longevity”
The estimated direct effect of “Socioeconomic Status” on ⌈Physician and/or Dentist⌋ was 0.20. Similarly, the direct effects of ⌈Treated Diseases⌋ on ⌈Physician and/or Dentist⌋ were −0.17. This suggests that the group with only family dentists had fewer diseases to treat and a more advantageous socioeconomic status. However, the coefficient of determination for ⌈Physicians and/or Dentists⌋ was only 7%, leaving 93% unexplained.
(5) Causal Structure of “Lifestyle and Diet Scores” on “Healthy Longevity”
The direct effect of “Socioeconomic Status” on “Lifestyle and Diet Scores” was 0.50, accounting for 25% of the coefficient of determination of “Lifestyle and Diet Scores.” The total effect of “Lifestyle and Diet Scores” on “Healthy Longevity” was the second largest, measured at 0.45 (Table 4).
(6)
Causal Structure of “Three Health Factors” on “Healthy Longevity”
The direct effect of “Lifestyle and Dietary Scores” on “Three Health Factors” was 0.38. The indirect effect of “Socioeconomic Status” on “Three Health Factors” through “Lifestyle and Dietary Scores” was 0.19 (0.50x0.38). Twenty-three percent of the “Three Health Factors” were explained. The direct effect of “Three Health Factors” on “Healthy Longevity” was the highest at 0.85 (Table 4).
(7) Causal Structure of ⌈Treated Diseases⌋ on “Healthy Longevity”
The direct effect of “Three Health Factors” on ⌈Treated Diseases⌋ was significant at −0.33, with ten percent of ⌈Treated Diseases⌋ being explained. The direct effect from ⌈Treated Disease⌋ to “Healthy Longevity” was 0.06.
(8)
Total Effects of Explanatory Factors on “Healthy Longevity”
The total effect of “Three Health Factors” on “Healthy Longevity” was the most significant, measuring 0.83. The effect of “Lifestyle and Diet Scores” on “Healthy Longevity” was recorded at 0.31. Similarly, the total effect of “Socioeconomic Status” was 0.29 (Table 4). It was clarified that “Socioeconomic Status” does not directly determine “Healthy Longevity”; rather, it indirectly promotes “Lifestyle and Diet Scores” and “Three Health Factors” while also aiding ⌈Treated Diseases⌋.
The direct effect of ⌈Physician and/or Dentist⌋ on “Healthy Longevity” was nearly zero (Figure 1). In contrast, the standardized estimate for the direct effect of ⌈Physician and/or Dentist⌋ on “Healthy Longevity” was 0.13 in analyzing the two variables (Figure 2). In the final model, relying on a family dentist proved easier than depending on a physician because the “Lifestyle and Diet Scores” and the “Three Health Factors,” based on “Socioeconomic Status,” were favorable. Therefore, the confounding factors supported the maintenance of both ⌈Physician and/or Dentist⌋ and “Healthy Longevity.”
4. Discussion
4.1. The Causal Effect of Having Only a Family Dentist and Healthy Longevity
In the analysis of ⌈Physician and/or Dentist⌋ and “Healthy Longevity” alone, the estimated effect of “Healthy Longevity” from ⌈Physician and/or Dentist⌋ was 0.13 (Figure 2). Additionally, nearly all explanatory variables, excluding BADLs, showed a significant correlation with having only a dentist rather than a physician(Table 2).
The final covariance structure analysis showed that the direct effect of ⌈Physician and/or Dentist⌋ on “Healthy Longevity” was nearly zero. Reducing ⌈Treated Diseases⌋ made it easier to rely on a family dentist rather than a physician, since “Lifestyle and Diet Scores,” based on “Socioeconomic Status” and “Three Health Factors,” are desirable (Figure 1). Additionally, these factors are connected to maintaining “Healthy Longevity.” Therefore, the presence of this confounding factor is a novel finding of this study. In contrast, the group with only a family physician experienced negative effects on “Healthy Longevity.” It was suggested that these adverse effects result from an overlooked structure that leads to an overall increase in the number of diseases needing treatment, due to unfavorable socioeconomic status, unhealthy lifestyle habits, poor diet, and inadequate health factors. In other words, achieving healthy longevity depends not only on favorable lifestyle choices and a balanced diet but also on an affordable socioeconomic status that supports better lifestyle practices.
This confirms the findings of our previous research [23]. The study indicates that favorable lifestyle habits do not directly cause healthy longevity, but rather that socioeconomic factors enabling these lifestyles are confounding factors. Recognizing confounding factors related to cause and effect is crucial for identifying a genuine association between a causal factor and its outcome.
Therefore, our new detailed analysis revealed that both the research report presented in the previous study, which states that the survival rate is maintained when there is a family dentist [8], and the research report linking it to healthy longevity [9], are incorrect. In particular, the causal structure that can achieve the ultimate effect of healthy longevity has been clarified for the first time in the world, showing that reducing the number of diseases to be treated is based on desirable socioeconomic factors, with the three factors of favorable lifestyle habits and health being interconnected. The foundation and benefits of having family dentists based on socioeconomic status are likely connected to the ultimate goal of healthy longevity supported by a recommended lifestyle and three health factors.
Notably, no previous studies have examined confounding factors, including socioeconomic elements, affecting healthy longevity, except those conducted by the authors [17,23]. It was not a favorable lifestyle that sustained survival, but rather socioeconomic factors that formed the foundation, and the three health factors were identified as confounding factors.
The scarcity of research reports necessitates the need to track the survival of a sufficiently large group of subjects over an extended period, which is essential for clarifying confounding factors and analyzing the causal structure through covariance structure analysis. Reproducibility is expected.
4.2. Importance of the Three Health Factors for the Total Effect on Healthy Longevity
The “Three Health Factors” had the most significant overall effect on “Healthy Longevity,” with a total effect of 0.83, followed by “Lifestyle and Diet Scores,” which had a total impact of 0.43. The total effect of “Socioeconomic Status” on “Healthy Longevity” was also 0.27. Therefore, this indicated that the effect on “Healthy Longevity” was not directly influenced by “Socioeconomic Status,” but instead serves as a fundamental foundation when considered alongside the results of a previous study [17,23]. This confirms that the desirability of an educational background, a socioeconomic factor, decreases the prevalence of diseases and enhances the ability to maintain daily activities while also improving the three health factors, including the level of care required. This suggests a related structure linked to extending healthy longevity.
4.3. The Actual Situation of a Physician and/or Dentist
According to this study, 17.2% of older individuals live in suburbs with only a family physician, and this percentage increases with age. In contrast, 12.7% of people have only a family dentist, which declines with age for both sexes. This study suggests that as people age, the decrease in educational attainment and annual income may lead to an increase in diseases that require treatment and a rise in the proportion of those relying solely on family physicians. However, aside from reports from the Japanese Dental Association, there are no research findings regarding the actual situation of family dentists. A nationwide survey conducted by the Japan Dental Association in 2011 revealed that 77.7% of people in their 60s and 87.7% of those in their 70s have family dentists. The proportion of individuals with only a family dentist should be examined in future studies.
4.4. The Importance of Having a Family Physician and/or Dentist and Research Topics
Ogden et al. demonstrate that health support related to oral hygiene, provided by family dentists and dental hygienists, offers a systematic and comprehensive approach to primary, secondary, and tertiary prevention for examinees [24]. The German researchers Gellrich et al. [25] report that this support should be used for early disease detection and to encourage activities that promote a healthier lifestyle, fulfilling a dentist’s role. Reichart [26] indicates that for a family dentist to contribute to disease prevention, the four A’s (Ask, Advice, Assist, and Arrange) should be applied, which are part of Europe’s preventive strategy model. This study illustrates the association between family dentists and healthy longevity.
Takada et al. [27] conducted dental examinations and provided health education to 509 workers under the age of 40 over two years. As a result, when assessing the degree of periodontal disease using the CPITN (Community Periodontal Index Treatment Needs), the percentage of suspected periodontal disease in men dropped from 43% to 21% in the following year. Future research should include randomly selected control groups. Based on previous research, the importance of maintaining good health through proper oral hygiene can be summarized as follows: having a family dentist and taking socioeconomic status into account tend to keep the residual index low. Preventive measures, such as oral hygiene care, are preferred. This is linked to disease prevention and longevity through the quality of food [17,23]. Our follow-up surveys indicate that oral hygiene care assessed by dentists is superior in the group that visits a family dentist emphasizing prevention, compared to the group that sees a family dentist focused on treating toothaches. Additionally, sustained eating habits significantly aid survival and demonstrate a cause-and-effect relationship [28]. In the future, it will be essential to clarify the circumstances surrounding family dentists and the causal framework of later healthy longevity in relation to socioeconomic status. This includes factors such as the motivation to visit the dentist and assessments of oral hygiene by specialists.
4.5. Collaboration Between Family Physicians and Dentists
Extensive research reviews have shown that the health support provided by family physicians reduces health risks and contributes to improved survival outcomes. This meta-analysis indicates that the primary medical activities of family doctors are crucial in managing diseases and mortality risk factors. As a result, survival is maintained [29]. It is essential to ensure the reproducibility of scientific evidence, such as our study, demonstrating that survival rates were preserved in the groups with family dentists only.
Oral infections such as tooth decay and periodontal disease can increase the risk of infectious pericarditis. In this context, Yamada et al. [30] highlighted the importance of addressing the infection source in the oral cavity as part of dental care. This includes coordinating medical evaluations prior to surgery for congenital heart disease. Therefore, fostering collaboration between medical and dental care is crucial.
4.6. Future Research Issues
This survey examine
d
the structural effects on “Healthy Longevity” after three years. The survey period for the “Three Health Factors” coincided with that of “Socioeconomic Status” and “Physician and/or Dentists."
The next step is to clarify the causal structure by conducting follow-up surveys across
follow-up
research years for each latent variable and verifying reproducibility with representative subjects through random sampling and enhancing external validity presents significant research challenges. In this study, one limitation was the reliance on individual self-reports regarding the presence of family doctors and/or dentists. Furthermore, the diagnosis and treatment status of family doctors and dentists, along with their effectiveness, remain unclear. Future research should focus on this issue.
Additionally, future studies should evaluate the causal relationship of healthy longevity after assessing dental hygiene and incorporating objective indices from medical examinations. Moreover, clarification is needed regarding the type of oral hygiene assessment conducted in collaboration with the patient’s doctor. Additional research on other populations has indicated that individuals who preferred self-care to maintain their oral hygiene and sought preventive support from a dentist achieved better oral hygiene, which was linked to their later survival [28]. Further research should clarify the importance of prevention among family dentists, as the preventive and therapeutic effects of oral hygiene are expected to benefit both patients and specialists; this will hopefully be verified through an interventional follow-up study. New health support initiatives that promote healthy longevity must consider how socioeconomic status influences recommended lifestyle habits and health conditions. By helping to reduce the number of diseases requiring treatment, the demand for family physicians may decrease, while the focus on preventive dental care should increase.
Funding
This study was funded by a grant from the Japanese Ministry of Health, Labour and Welfare (Hone0-Health-042) and a Grant-in-Aid for Scientific Research (B) from the Japanese Ministry of Education, Culture, Sports, Science and Technology (No.15 31012 and 14350327). We also appreciate the financial support received from the Mitsubishi Foundation (2009-21) in 2009.
Institutional Review Board Statement
The Tama City local government and Tokyo Metropolitan University signed an agreement to protect privacy and confidentiality. Here, mutual secrecy is strictly enforced. All analysis data are identified by ID only. The survey was conducted on 16 September 2000, with the consent of the Tokyo Metropolitan University Graduate School of Ethics Committee. The survey data are registered with UMIN and are accessible at http://www.umin.ac.jp/ (accessed on June 16th, 2025 ).
Informed Consent Statement
Informed consent was obtained from all subjects involved in the study.
Data Availability Statement
The follow-up data and survey questionnaire in Japan used in this study are available at the address of the first author, T. Hoshi (star@onyx.dti.ne.jp). At the same time, the survey data are registered with UMIN and available at http://www.umin.ac.jp/ (accessed on June 16th, 2025).
Acknowledgments
The authors express particular gratitude to all the survey participants in Tama City, Tokyo, Japan.
Conflicts of Interest
The authors declare no conflicts of interest. The funders had no role in the study’s design, data analysis, or interpretation.
Abbreviations
The following abbreviations are used in this manuscript:
| QOL | Quality of Life |
| BADLs | Basic activities of daily living |
| IADLs | Instrumental activities of daily living |
| NFI | Normed fit index |
| IFI | Incremental fit index |
| RMSEA | Root mean square error of approximation |
| CPITNN | Community Periodontal Index Treatment Needs |
References
- Labor Statistics Association. Trends in National Hygiene 65 (2018/2019); pp. 82–84. Available online: https://ndlsearch.ndl.go.jp/books/R000000004-I032347714 (accessed on June 16th, 2025).
- Sakurai, N.; Hoshi, T. The aim of Health Japan 21. Hokennokagaku 2003, 45. Available online: https://ndlsearch.ndl.go.jp/books/R000000004-I6665573 (accessed on June 16th, 2025).
- Definition of Family Dentist in Japan. Available online: https://www.jda.or.jp/jda/other/kakaritsuke.html (accessed on June 16th, 2025).
- Definition of Family Physician in Japan. Available online: https://www.med.or.jp/doctor/kakari/ (accessed on June 16th, 2025).
- Scientific evidence of dental health and oral health that contributes to a healthy and long-lived society in 2015. Jpn. Dent. Assoc. 2019. Available online: https://www.jda.or.jp/dentist/program/pdf/world_concgress_2015_evidence_jp.pdf (accessed on June 16th, 2025).
- Fukai, K.; Takiguchi, T.; Ando, Y.; Aoyama, H.; Miyakawa, Y.; Ito, G.; Inoue, M.; Sasaki, H. Mortality rates of community- residing adults with and without dentures. Geriatr. Gerontol. Int. 2008, 8, 152–159. [CrossRef]
- Yoneyama, T.; Yoshida, M.; Matsui, T.; Sasaki, H.; Oral Care Working Group. Oral hygienic care and pneumonia. Lancet 1999, 354, 515. [CrossRef]
- Tano, R.; Hoshi, T.; Takahashi, T.; et al. The Effects of Family Dentists on Survival in the Urban Community-dwelling Elderly. American J. Med. Med. Sci. 2013, 3, 156–165. [CrossRef]
- Berkman; Breslow, L. Health and Ways of Living: The Alameda County Study; Oxford University Press: Oxford, UK, 1983. https://openlibrary.org/books/OL3488287M/Health_and_ways_of_living (accessed on June 16th, 2025).
- Kodama, S.; Hoshi, T.; Kurimori, S. Decline in independence after three years and its association with dietary patterns and IADL-related factors in community-dwelling older people: An analysis by age stage and sex. BMC Geriatr. 2021, 21, 385. [CrossRef]
- 1Kaplan, G.A.; Camacho, T. Perceived health and mortality: A nine-year follow-up of the human population laboratory cohort. J. Epidemiol. 1983, 117, 292–304. [CrossRef]
- Laura, C.R.; Longdi, F.; Emmalin, B.; Goel, V. Death and Chronic Disease Risk Associated with Poor Life Satisfaction: A Population-Based Cohort Study. J. Epidemiol. 2019, 18, 323–331. [CrossRef]
- Branch, L.G.; Katz, S.; Kniepmann, K.; Papsidero, J.A. A prospective study of functional status among community elders. Am. J. Public Health 1984, 74, 266–268. [CrossRef]
- Koyano, W.; Shibata, H.; Nakazato, K.; Haga, H.; Suyama, Y. Measurement of competence. Liability and validity of the TMIG Index of Competence. Arch. Gerontol. Geriatr. 1991, 13, 103–116. [CrossRef]
- Berkman, L.F.; Syme, S.L. Social networks, host resistance, and mortality: A nine-year follow-up study of Alameda County residents. Am. J. Epidemiol. 1979, 109, 186–204. [CrossRef]
- Seeman, T.E.; Kaplan, G.A.; Knudsen, L.; Cohen, R.; Guralnik, J. Social network ties and mortality among the elderly in the Alameda County Study. J. Epidemiol. 1987, 126, 714–723. [CrossRef]
- Hoshi T. Causal Structure for the Healthy Longevity Based on the Socioeconomic Status, Healthy Diet and Lifestyle, and Three Health Dimensions, in Japan. Health Promotion. InterOpen. 2024;1-19. [CrossRef]
- Hoshi T. The Causal Structure of the Role of Physicians and Dentists in the Healthy Longevity of Elderly Dwellers Residents. International Journal of Dentistry and Oral Health. 2022. 8(4). [CrossRef]
- Finkel, S.E. Causal Analysis with Panel Data; Sage Publications: Thousand Oaks, CA, USA. 1995; pp. 41–56. Available online: https://us.sagepub.com/en-us/nam/book/causal-analysis-panel-data (accessed on June 16th, 2025 ).
- Bentler, P.M.; Dudgeon, P. Covariance structure analysis: Statistical practice, theory, and directions. Annu. Rev. Psychol. 1996, 47, 563–592. [CrossRef]
- Jousilahti, P.; Tuomilehto, J.; Vartiainen, E.; Eriksson, J.; Puska, P. Relation of adult height to cause-specific and total mortality: A prospective follow-up study of 31,199 middle-aged men and women in Finland. Am. J. Epidemiol. 2000, 151, 1112–1120. [CrossRef]
- Hoshi, T.; Nakayama, N.; Takagi, T.; et al. Relationship between height and BMI classification of elderly people living at home in urban suburbs. Jpn. Jour. Health Education and Promotion 2010, 18, 268–277. https://cir.nii.ac.jp/crid/1010000782124139913.
- Hoshi, T. SES. Dietary and lifestyle habits, three health-related dimensions, and healthy survival days. In The Structure of Healthy Life Determinants: Lessons from the Japanese Aging Cohort Studies; Hoshi, T., Kodama, S., Eds.; Springer: Singapore, 2018; pp. 134–189. Available online: https://link.springer.com/chapter/10.1007/978-981-10-6629-0_8 (accessed on June 16th, 2025 ).
- Ogden, G.R.; Macluskey, M. An overview of the prevention of oral cancer and diagnostic markers of malignant change: 1. Prev. Dent Update 2000, 27, 95–99. [CrossRef]
- Gellrich, N.C.; Suarez-Cunqueiro, M.M.; Bremerich, A.; Schramm, A. Characteristics of oral cancer in a central European population: Defining the dentist’s role. J. Am. Dent. Assoc. 2003, 134, 307–314. [CrossRef]
- Reichart, P.A. Primary prevention of mouth carcinoma and oral precancerous conditions Article in German. Mund Kiefer Gesichtschir. 2000, 4, 357–364. [CrossRef]
- Takada, Y.; Maeda, Y.; Isada, T. Characteristics of workers for whom oral hygiene education is effective. J. Health Wellness Stat. 2004, 51, 25–29. Available online: https://ndlsearch.ndl.go.jp/books/R000000004-I6885636 (accessed on June 16th, 2025).
- Hoshi, T.; Yabuki, T.; Nagai, H.; et al. Causal structure of the existence of a family dentist and subsequent QOL and maintenance of survival.8020. Hachi-Maru-Nii-Maru 2016, 15, 130–133. Available online: https://ndlsearch.ndl.go.jp/books/R000000004-I027157339 (accessed on June 16th, 2025).
- Wang, Y.; Wan, E.Y.F.; Mak, I.L.; Ho, M.K.; Chin, W.Y.; Yu, E.Y.T.; Lam, C.L.K. The association between trajectories of risk factors and risk of cardiovascular disease or mortality among patients with diabetes or hypertension: A systematic review. PLoS ONE 2022, 17, e0262885. [CrossRef]
- Yamaza, H.; Takayama, F.; Ogasawara, T.; et al. A Case Report of Dental Treatment for Removing Sources of Oral Infection before Heart Surgery in a Patient with Noonan Syndrome through Medical Examination. Jpn. Soc. Disabil. Oral Health 2020, 41, 318–324. [CrossRef]
Figure 1.
The Causal Structure of “Healthy Longevity”, “Three Health Factors”, “Socioeconomic Status”, “Lifestyle and Diet Scores”, ⌈Treated Diseases⌋, and ⌈Physician and/or Dentist⌋.
Figure 1.
The Causal Structure of “Healthy Longevity”, “Three Health Factors”, “Socioeconomic Status”, “Lifestyle and Diet Scores”, ⌈Treated Diseases⌋, and ⌈Physician and/or Dentist⌋.
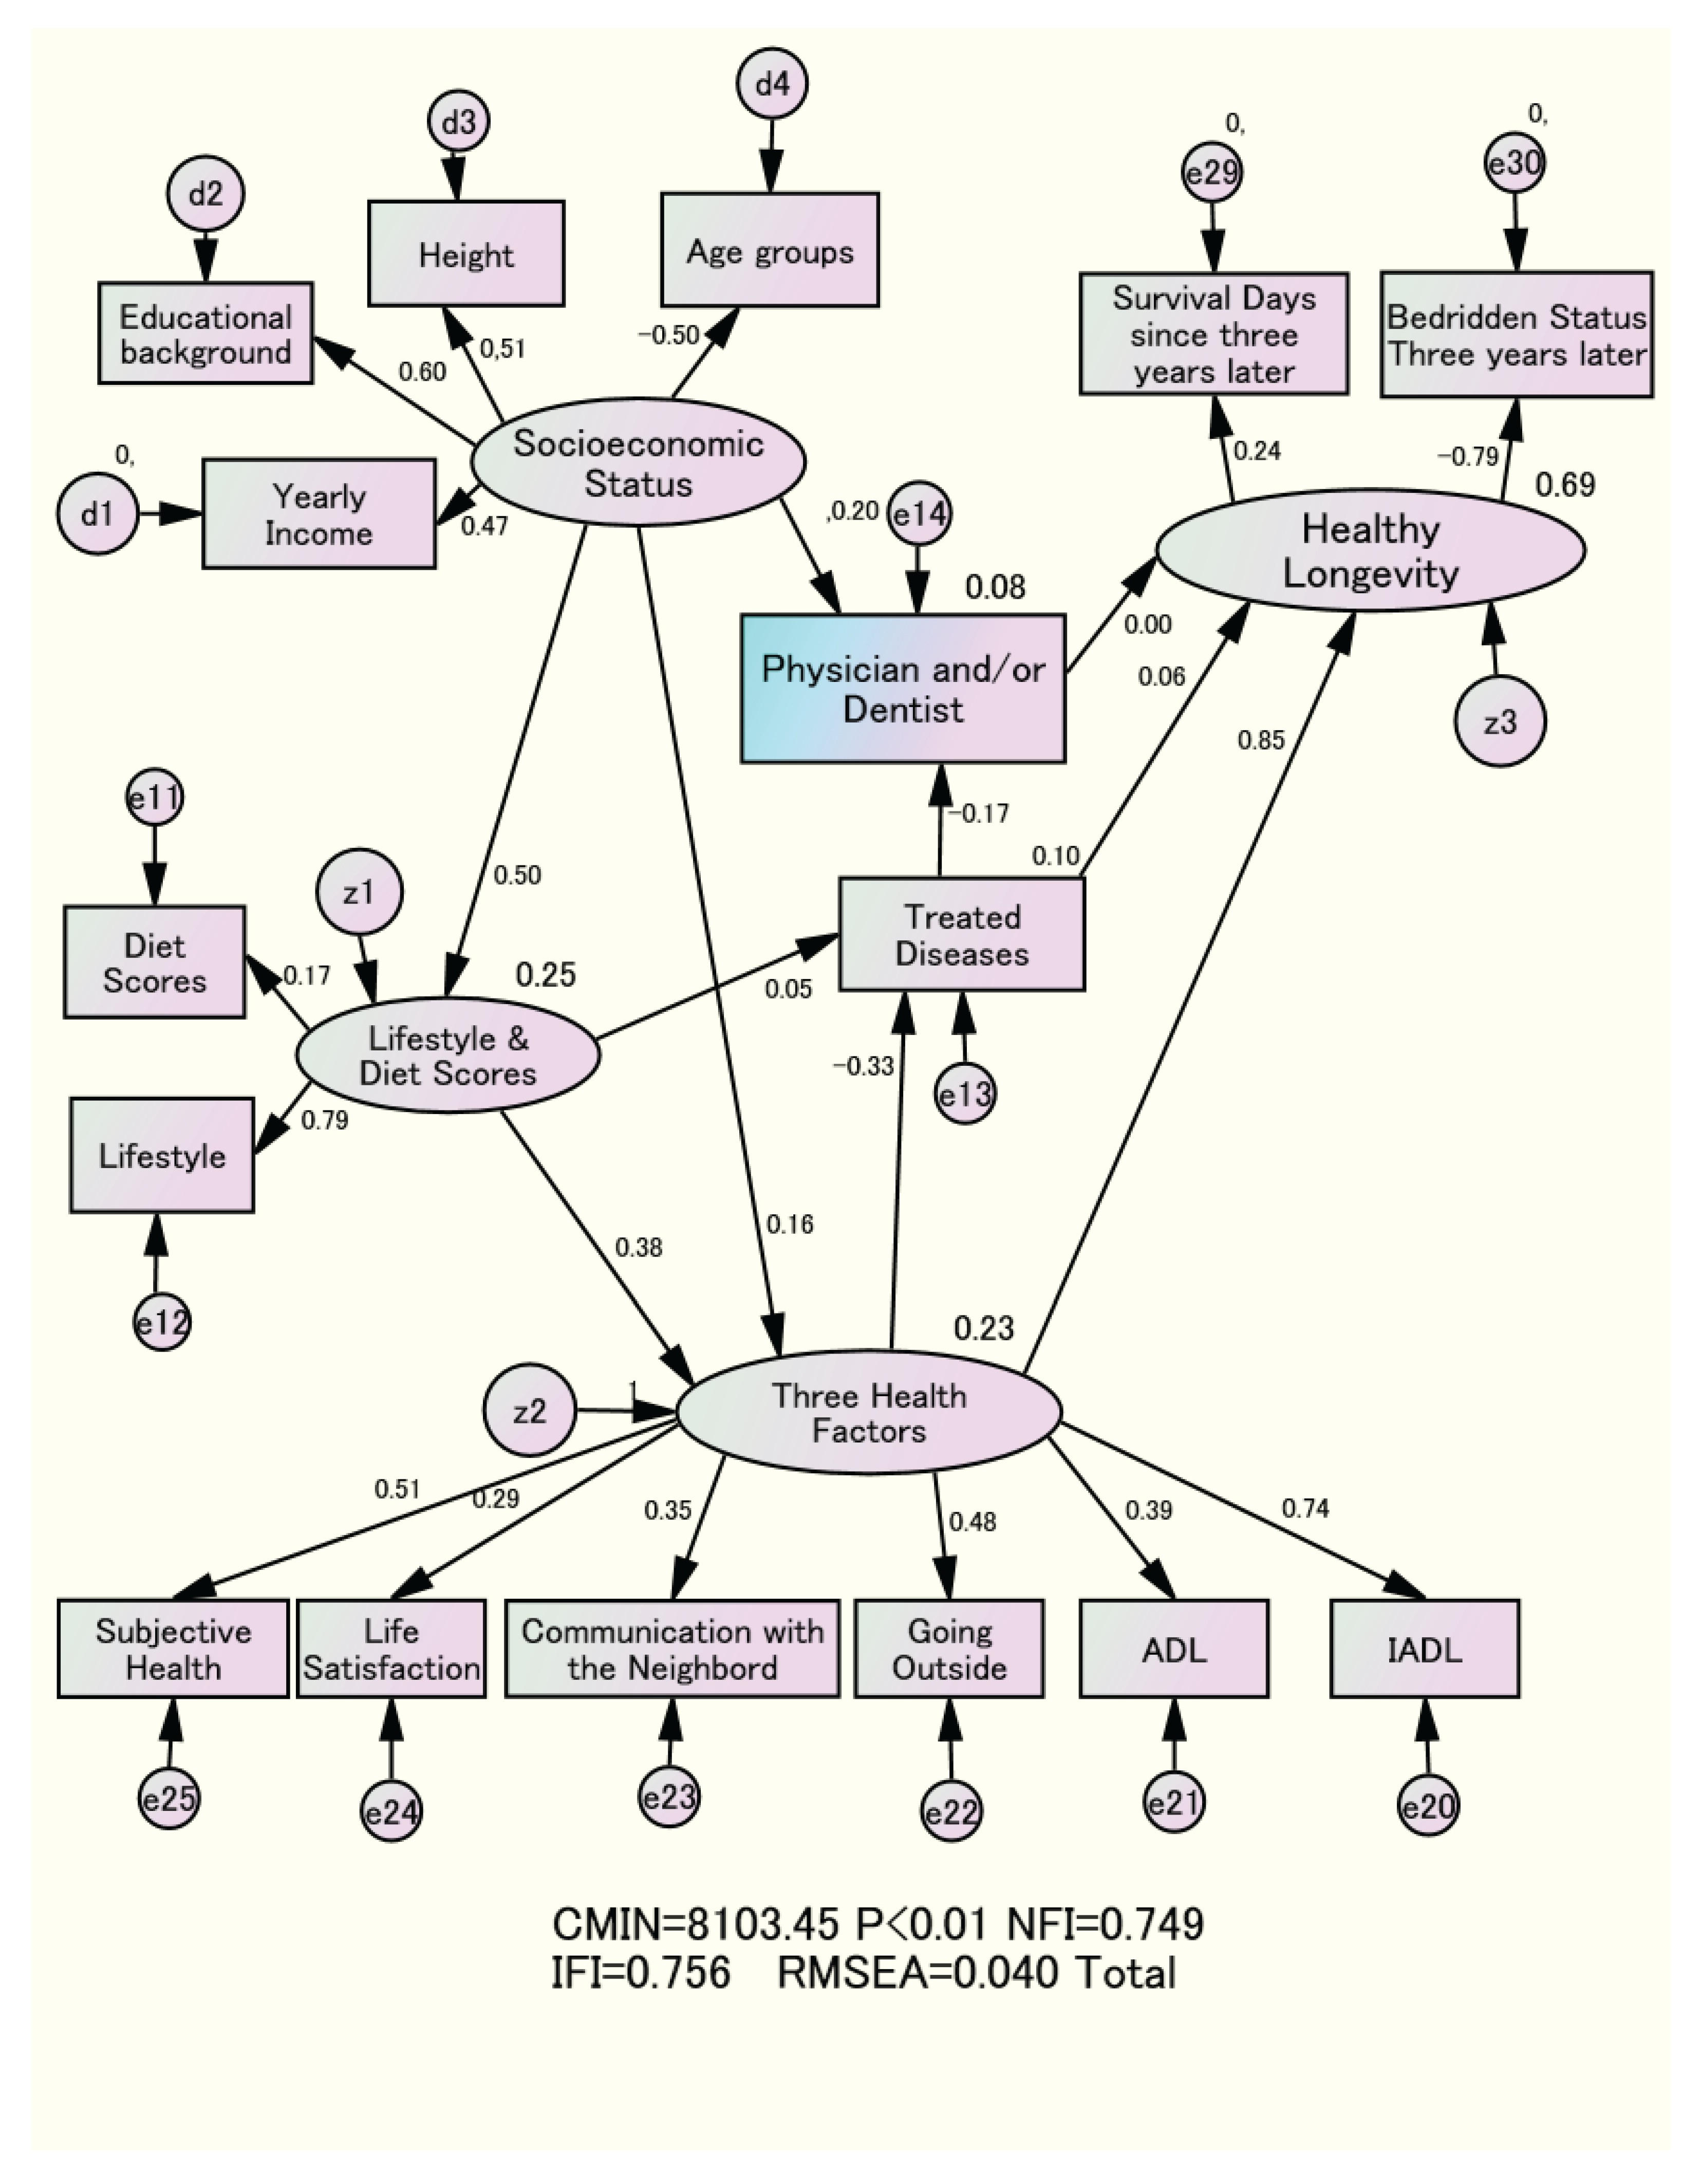
Figure 2.
The Causal Structure of “Healthy Longevity” and ⌈Physician and/or Dentist⌋ Based on “Socioeconomic Status”.
Figure 2.
The Causal Structure of “Healthy Longevity” and ⌈Physician and/or Dentist⌋ Based on “Socioeconomic Status”.
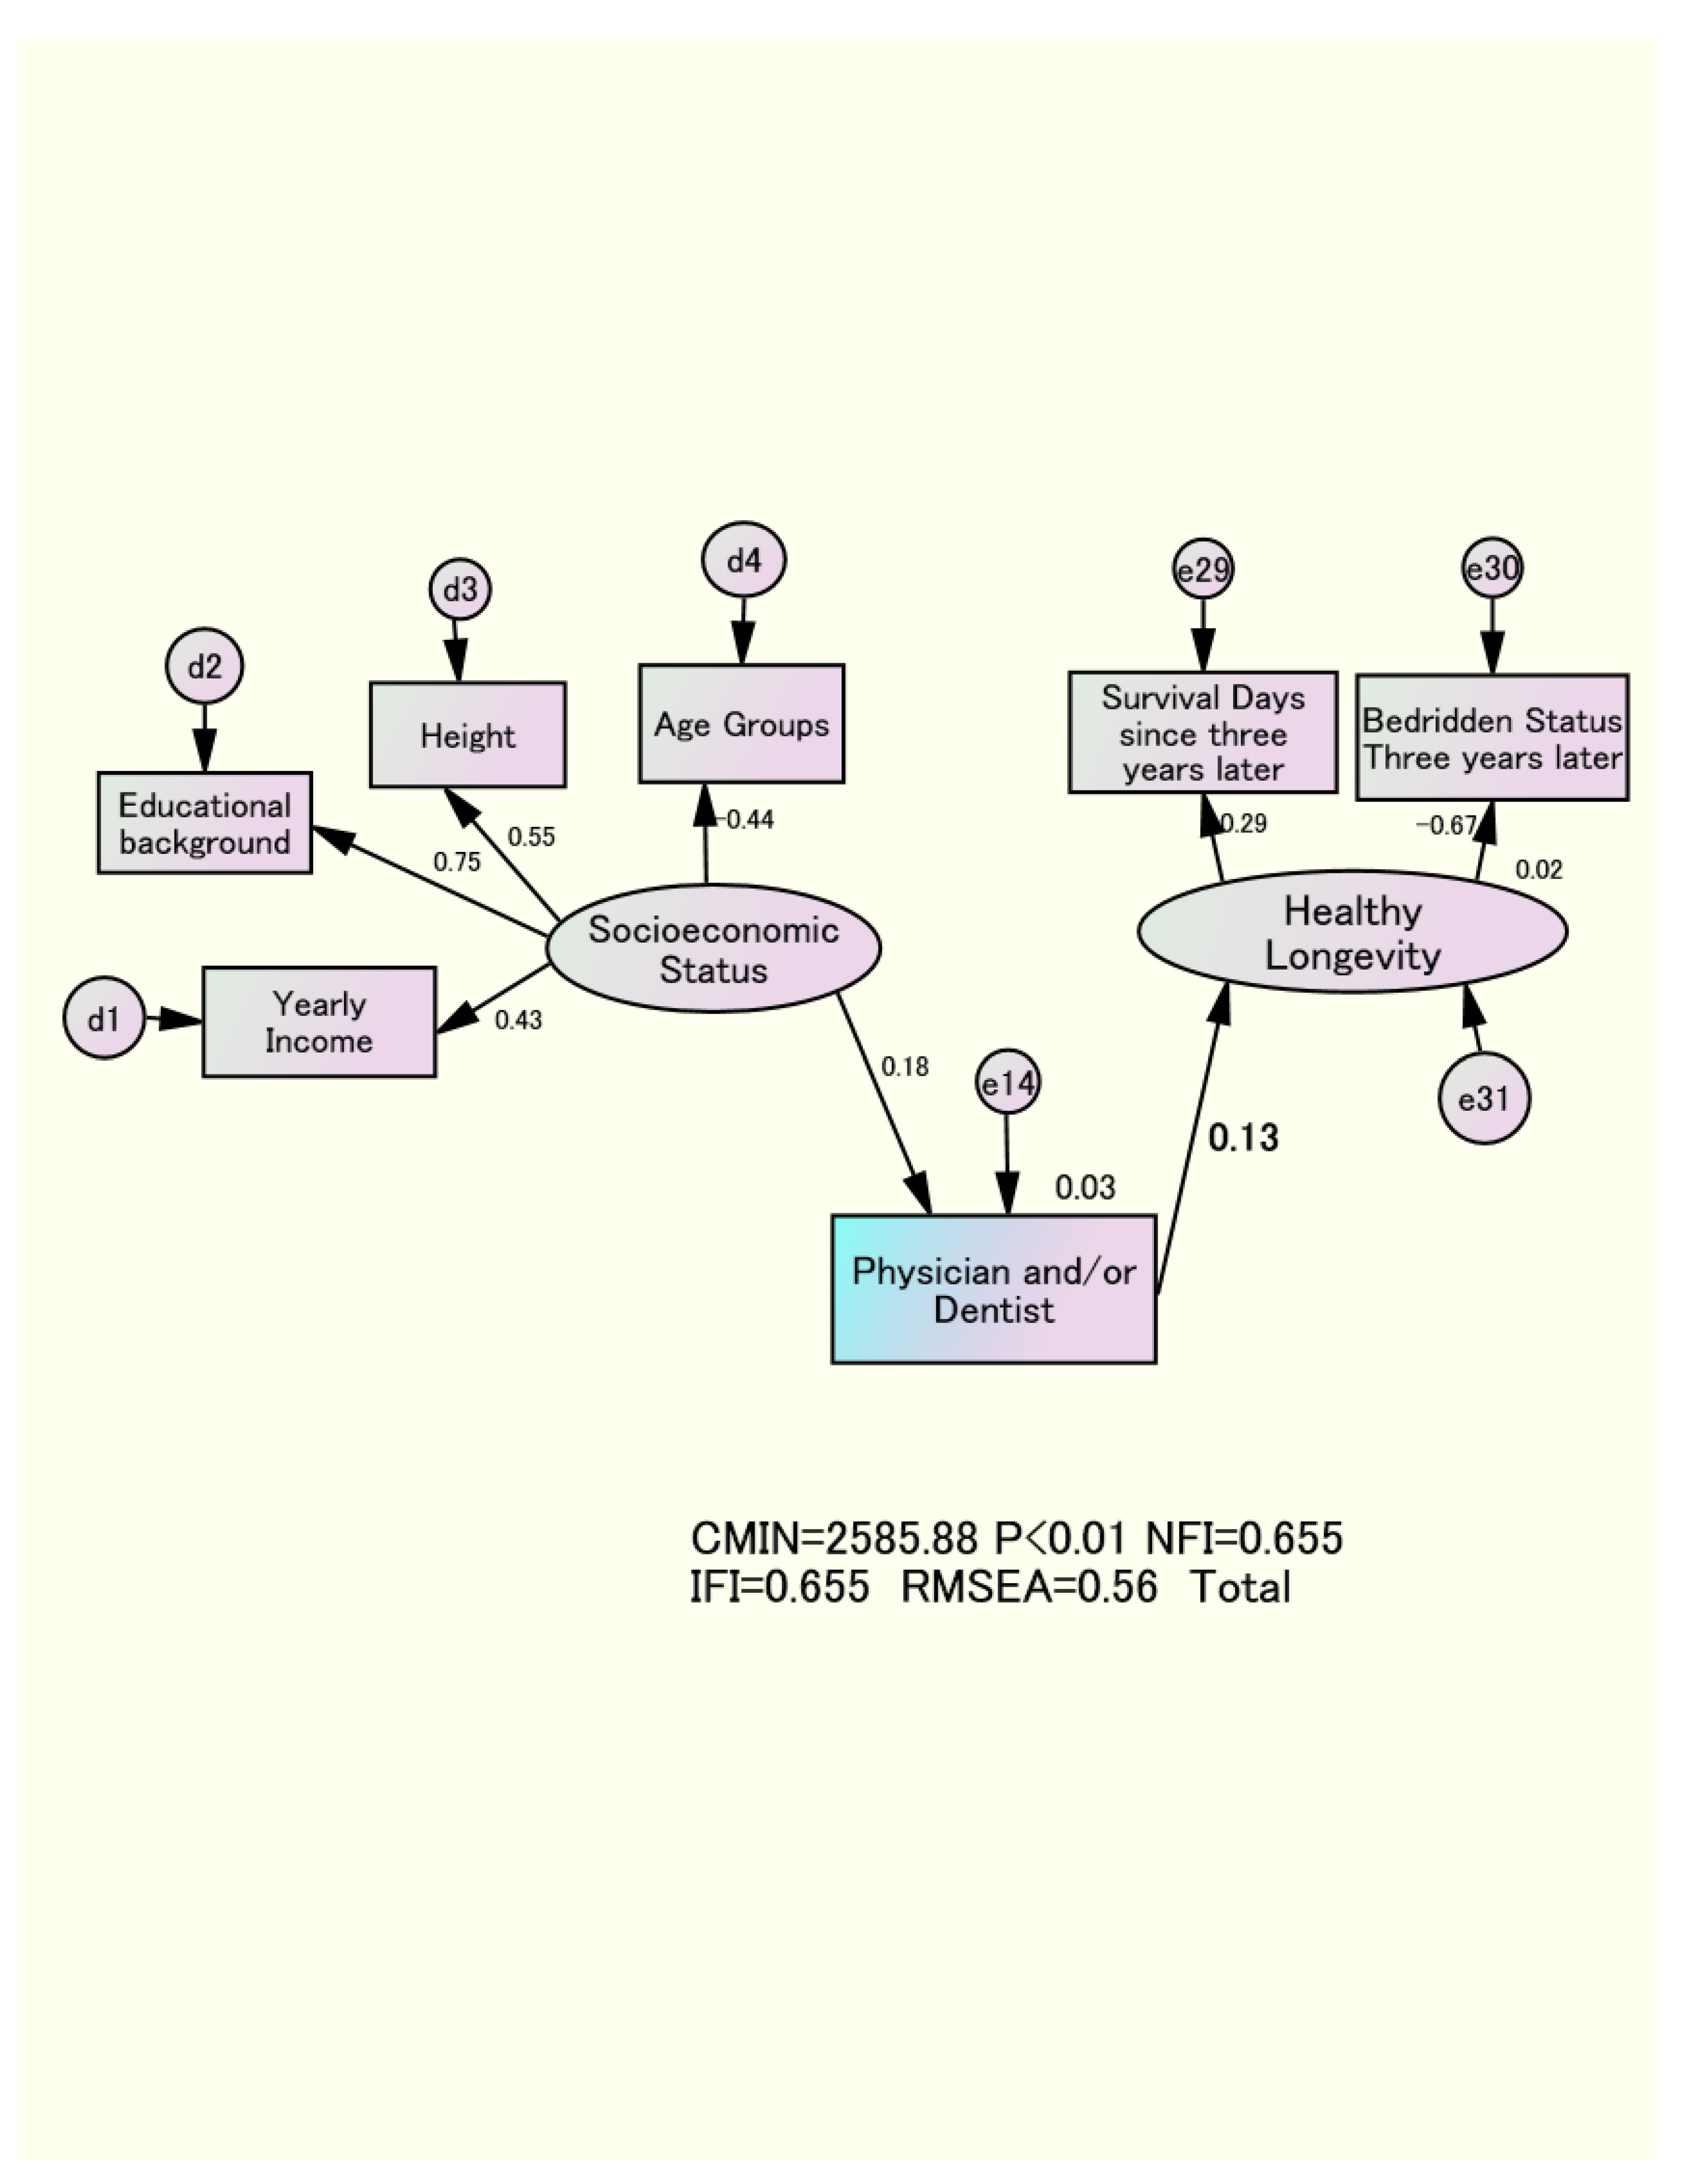

Table 1.
Survival Days and Bedridden Status with a Family Physician and/or Dentist by Age Group and Gender.
Table 1.
Survival Days and Bedridden Status with a Family Physician and/or Dentist by Age Group and Gender.
| Dentist only | Neither a dentist nor a Physician | Having both a dentist and a Physician | Physician only | Total | ||
| Men | 65-69 | 311 | 232 | 881 | 296 | 1720 |
| 18.1% | 13.5% | 51.2% | 17.2% | 100.0% | ||
| 70-74 | 116 | 77 | 634 | 166 | 993 | |
| 11.7% | 7.8% | 63.8% | 16.7% | 100.0% | ||
| 75-79 | 57 | 39 | 349 | 98 | 543 | |
| 10.5% | 7.2% | 64.3% | 18.0% | 100.0% | ||
| 80-84 | 14 | 23 | 162 | 55 | 254 | |
| 5.5% | 9.1% | 63.8% | 21.7% | 100.0% | ||
| Survival days | 1042.9(114.2) | 1041.1(114.7) | 1027.0(151.7) | 1028.1(145.0) | ||
| Bedridden status | 4( 0.8%) | 15( 4.0%) | 111( 5.5%) | 48( 7.8%) | ||
| Non of the bedridden status | 494(99.2%) | 356(96.0%) | 1,915(94.5%) | 567(92.2%) | ||
| Women | 65-69 | 270 | 124 | 1022 | 230 | 1646 |
| 16.4% | 7.5% | 62.1% | 14.0% | 100.0% | ||
| 70-74 | 98 | 54 | 700 | 157 | 1009 | |
| 9.7% | 5.4% | 69.4% | 15.6% | 100.0% | ||
| 75-79 | 44 | 45 | 485 | 147 | 721 | |
| 6.1% | 6.2% | 67.3% | 20.4% | 100.0% | ||
| 80-84 | 11 | 18 | 217 | 92 | 338 | |
| 3.2% | 5.3% | 64.0% | 27.2% | 100.0% | ||
| Survival days | 1054.7(83.9) | 1042.8(117.9) | 1048.2(104.3) | 1036.7(129.2) | ||
| Bedridden status | 9(2.1%) | 18( 7.5%) | 19( 7.8%) | 8(12.8%) | ||
| None of the bedridden status | 414(97.9%) | 223(92.5%) | 2234(92.2%) | 546(87.2%) | ||
| ( ): Standard Deviation | ||||||
Table 2.
Socioeconomic Status and Life Characteristics Associated with Visits to Family Physicians and Dentists by Gender.
Table 2.
Socioeconomic Status and Life Characteristics Associated with Visits to Family Physicians and Dentists by Gender.
| Men | Women | |||||
| Physician only | Dentist only | Physician only | Dentist only | |||
| Educational Background | ||||||
| Graduated from high school | 322(57.6%) | 224(47.9%) | 469(84.8%) | 273(72.4%) | ||
| Graduated from vocational school | 32( 5.7%) | 19( 4.1%) | P<0.01 | 63(11.4%) | 58(15.4%) | P<0.01 |
| Graduated from college | 205(36.7%) | 225(48.1%) | 21( 3.8%) | 46( 12.2%) | ||
| Yealy Income | ||||||
| <1million yen | 10( 1.8%) | 7( 1.5%) | 74(13.9%) | 28( 7.7%) | ||
| 1milion-3 million yen | 235(41.5%) | 128(27.8%) | 284(53.4%) | 146(40.0%) | ||
| 3 million-7 million yen | 268(47.3%) | 260(56.5%) | P<0.01 | 153(28.8%) | 157(43.0%) | P<0.01 |
| >7million yen | 53( 9.4%) | 65( 4.1%) | 21( 3.9%) | 34( 9.3%) | ||
| Height(cm) | 163.2(6.1) | 164.5(7.0) | P<0.01 | 150.2(7.2) | 152.0(4.9) | P<0.01 |
| Age | 71.5(5.1) | 69.5(4.1) | P<0.01 | 72.7(5.4) | 69.1(4.1) | P<0.01 |
| Subjective Health | ||||||
| very healthy | 63(10.2%) | 146(29.4%) | 50( 8.0%) | 250(27.2%) | ||
| almost healthy | 409(66.5%) | 317(63.8%) | P<0.01 | 390(62.3%) | 605(65.8%) | P<0.01 |
| not so healthy | 97(15.8%) | 27( 5.4%) | 129(20.6%) | 47( 5.1%) | ||
| Unhealthy | 46( 7.5%) | 7( 1.4%) | 57( 9.1%) | 18( 2.0%) | ||
| Life Satisfaction | ||||||
| very satisfied | 367(51.5%) | 490(45.1%) | 368(60.9%) | 93(70.6%) | ||
| moderately satisfied | 142(57.0%) | 107(43.0%) | P<0.01 | 179(29.6%) | 99(23.9%) | P<0.01 |
| Unsatisfied | 188(70.4%) | 37(29.6%) | 57( 9.4%) | 23( 5.5%) | ||
| Communication with the Neighborhood | ||||||
| Seldom | 234(39.6%) | 138(28.6%) | 180(30.2%) | 79(19.8%) | ||
| Once a month | 147(24.9%) | 135(28.0%) | P<0.03 | 110(18.4%) | 101(25.4%) | P<0.03 |
| 3 to 4 times a week | 147(24.9%) | 145(30.0%) | 218(36.5%) | 149(37.4%) | ||
| almost every day | 63(10.7%) | 65( 13.5%) | 89(14.9%) | 69(17.3%) | ||
| Going Outside | ||||||
| less than once a month | 40( 6.7%) | 12( 2.4%) | 45( 7.6%) | 7( 1.7%) | ||
| more than once a month | 46( 7.8%) | 31( 6.3%) | P<0.01 | 58( 9.8%) | 25( 6.1%) | P<0.01 |
| 3 to 4 times a week | 507(85.5%) | 447(91.2%) | 490(82.6%) | 377(92.2%) | ||
| Total Number of Treated Diseases | 0.92(0.82) | 0.17(0.48) | P<0.01 | 0.73(0.77) | 0.07(0.28) | P<0.01 |
| Basic Activities of Daily Living | 2.89(0.43) | 2.92(0.27) | P<0.12 | 2.87(0.41) | 2.89(0.32) | P<0.46 |
| Instrumental Activities of Daily Living | 4.59(1.05) | 4.83(0.50) | P<0.01 | 4.51(1.17) | 4.92(1.41) | P<0.01 |
| Lifestyle Scores | 2.75(1.20) | 3.04(1.11) | P<0.01 | 2.73(1.02) | 2.96(0.99) | P<0.01 |
| Diet Scores | 3.53(2.27) | 3.84(2.30) | P<0.01 | 4.13(2.18) | 4.57(2.25) | P<0.01 |
| ()means Standard Deviation | ||||||
Table 3.
Results of Exploratory Factor Analysis.
| Physical Health | Mental & Social Health | Socioeconomic Status | Factor 4 | |
| IADL | 0.722 | 0.258 | 0.037 | -0.124 |
| Bedridden Status | -0.619 | -0.178 | -0.036 | 0.100 |
| BADL | 0.484 | 0.048 | 0.045 | -0.007 |
| Life Satisfaction | 0.043 | 0.524 | 0.062 | -0.075 |
| Subjective Health | 0.210 | 0.500 | 0.123 | -0.349 |
| Communication with the Neighborhood | 0.083 | 0.455 | -0.060 | 0.007 |
| Going Outside | 0.323 | 0.328 | 0.083 | -0.026 |
| Lifestyle | 0.164 | 0.304 | 0.138 | -0.002 |
| Diet Scores | 0.058 | 0.180 | -0.031 | -0.034 |
| Educational Background | 0.057 | -0.021 | 0.648 | -0.087 |
| Height(cm) | 0.058 | -0.088 | 0.592 | -0.034 |
| Yealy Income | 0.022 | 0.197 | 0.434 | -0.027 |
| Treated Diseases | -0.061 | -0.111 | 0.022 | 0.654 |
| Family physician and/or Dentist | -0.045 | -0.025 | -0.102 | 0.426 |
Table 4.
Direct and Total effect of “Three Health Factors”, “Socioeconomic Status”, and ⌈Physician and/or Dentist⌋ on “Healthy Longevity” by sex.
Table 4.
Direct and Total effect of “Three Health Factors”, “Socioeconomic Status”, and ⌈Physician and/or Dentist⌋ on “Healthy Longevity” by sex.
| Men | Women | Total | ||
| “Socioeconomic Status”⇒「Physician and/or Dentist」 | 0.20 | 0.22 | 0.19 | |
| “Socioeconomic Status”⇒“Lifestyle and Diet Scores” | 0.20 | 0.22 | 0.19 | |
| Standardized | “Socioeconomic Status”⇒“Three Health Factors” | 0.52 | 0.64 | 0.47 |
| Direct Effect | “Lifestyle and Diet Score”⇒「Treated Diseases」 | 0.02 | 0.03 | 0.03 |
| “Lifestyle and Diet Score”⇒“Three Health Factors” | 0.51 | 0.53 | 0.35 | |
| “Three Health Factors”⇒“Healthy Longevity” | 0.80 | 0.89 | 0.82 | |
| 「Physician and or Dentist」⇒Three Health Factors” | 0.06 | 0.21 | 0.14 | |
| “Three Health Factors”⇒「Treated Diseases」 | -0.40 | -0.36 | -0.36 | |
| 「Treated Diseases」⇒「Physician and/or Dentist」 | -0.16 | -0.07 | -0.13 | |
| 「Treated Diseases」⇒“Healthy Longevity” | -0.16 | -0.07 | -0.13 | |
| “Socioeconomic Status”⇒⇒“Three Health Factors” | 0.28 | 0.32 | 0.30 | |
| “Socioeconomic Status”⇒⇒「Treated Diseases」 | -0.11 | -0.12 | -0.11 | |
| “Lifestyle and Diet scores”⇒⇒「Treated Diseases」 | -0.20 | -0.19 | -0.19 | |
| Standardized | “Socioeconomic Status”⇒⇒「Physician and/or Dentist」 | 0.22 | 0.22 | 0.22 |
| Total Effect | “Three Health Factors”⇒⇒「Physician and/or Dentist」 | 0.06 | 0.03 | 0.05 |
| “Lifestyle and Diet scores”⇒⇒「Physician and/or Dentist」 | 0.03 | 0.01 | 0.02 | |
| “Socioeconomic Status”⇒⇒“Healthy Longevity” | 0.24 | 0.31 | 0.27 | |
| “Lifestyle and Diet scores”⇒⇒“Healthy Longevity” | 0.43 | 0.50 | 0.45 | |
| “Three Health Factors”⇒⇒“Healthy Longevity” | 0.80 | 0.89 | 0.83 | |
| ⇒means direct effect ⇒⇒means total effect | ||||
Disclaimer/Publisher’s Note: The statements, opinions and data contained in all publications are solely those of the individual author(s) and contributor(s) and not of MDPI and/or the editor(s). MDPI and/or the editor(s) disclaim responsibility for any injury to people or property resulting from any ideas, methods, instructions or products referred to in the content. |
© 2025 by the authors. Licensee MDPI, Basel, Switzerland. This article is an open access article distributed under the terms and conditions of the Creative Commons Attribution (CC BY) license (http://creativecommons.org/licenses/by/4.0/).
Copyright: This open access article is published under a Creative Commons CC BY 4.0 license, which permit the free download, distribution, and reuse, provided that the author and preprint are cited in any reuse.


