
Submitted:
31 July 2025
Posted:
01 August 2025
You are already at the latest version
Abstract
Detecting and alerting for falls is a crucial component of both healthcare and assistive technologies. Wearable devices are vulnerable to damage and require regular inspection and maintenance. Manned video surveillance avoids these problems but it involves constant labor-intensive attention and, in most cases, may compromise the privacy of the observed individuals. To address the issue, in the work we introduce and evaluate a novel approach to fully automated fall detection. The presented technique uses direct reconstruction of principal motion parameters, avoiding the computationally expensive full optical flow reconstruction and still providing relevant descriptors for accurate detections. Our method is systematically compared with state-of-the-art techniques. Comparisons of detection accuracy, computational efficiency, and suitability for real-time applications are presented. Experimental results demonstrate notable improvements in accuracy while maintaining a lower computational cost compared to traditional methods, making our approach highly adaptable for real-world deployment. The findings highlight the robustness and universality of our model, suggesting its potential for integration into broader surveillance technologies. Future directions for development will include optimization for resource-constrained environments and deep learning enhancements to refine detection precision.
Keywords:
fall detection
; optical flow
; real-time detection
; video-surveillance
; principal motion parameters
1. Introduction
1.1. Motivation
Detection of falls is an increasingly important task in the modern world. Approximately one-third of adults aged 65 and above in the European Union experience one fall annually [1]. Falls are dangerous and often lead to serious injuries and health complications. In many cases, falling can be fatal [2]. Falls frequently require medical attention, and people often need to be hospitalized [2]. This rounds up to an annual cost of treatment around €25 billion, which is a substantial toll [3]. Naturally, developing alerting and prevention strategies, protocols, methods, and technologies is an important endeavor that helps reduce the negative outcomes and costs related to falls in the elderly population as well as in specific groups of vulnerable individuals such as epileptic patients.
There are different approaches for automated fall detection that are used in practice. Frequently used devices include wearable sensors and ambient devices. Wearable sensors are the most accurate [4,5,6] are widely used. They offer round the clock monitoring and instant response in the event of an emergency. Wearable sensors are affordable and can be customized based on the individual using them. Ambient sensors [7] also offer substantial benefits – they require no compliance from the user, provide broad area coverage and are usable continuously. In the current work, we use a visual-based sensor (camera) for data collection, specifically for the purpose of fall detection. When compared to wearables, camera-based systems offer several advantages. They can successfully identify falls in any individual present within the monitored space. Wearable devices presuppose that their user is already at risk of falling. Camera-based systems have no such assumption, thus broadening their field of application. Camera infrastructure is more robust and, once installed requires little support and/or maintenance. Wearable devices need to be charged and placed properly. They may also pose certain issues of compromising comfort, privacy and add stigmatizing effect for the individual wearing them. Remote sensors, such as cameras, will monitor and alert without obstructive effects. When compared to ambient devices cameras are less expensive and require less maintenance while offering the comparable benefits in terms of detection accuracy.
Our method for fall detection work by processing video data with Optical Flow (OF) [8,9,10,11] techniques. Such methods are widely used in different Computer Vision tasks, and their application for falls detection can offer various benefits. OF methods allow to capture motion without the need for physical markers or wearable devices [12]. If certain conditions are met, OF methods allow for real-time analysis of movement [13]. To work properly, Optical Flow methods only require simple and cheap hardware such as a basic USB camera, connected to a personal computer [14]. OF techniques have been shown to perform well under a dynamic environment - complex scenes with multiple moving objects [15]. Finally, Optical Flow methods can be combined with Machine Learning algorithms [16] in order to better solve different Computer vision tasks.
1.2. Related Works
Fall detection using camera-based systems is an increasingly important topic in the field of computer vision and digital healthcare. A lot of work is constantly being done in the field. Мany different approaches аrе available; we refer the reader to the relevant literature [4,17]. Here we will go over only those methods that use Optical Flow evaluation in their workflow. In [18] the motion vector field for each two consecutive frames is calculated. The mean value of the vertical component of the vector field for each two frames is evaluated. From it, certain features such as the maximum vertical velocity and acceleration are derived, and together with the maximum amplitude of the recorded sound, a feature vector is defined. An SVM [19] classifier is trained on a large dataset, and subsequently the classifier is evaluated on new data. For this work both video and audio data are used. The method proposed in [20] utilizes a mixture of background subtraction [21], standard Optical Flow techniques and Kalman filtering [22] to detect falling events. A feature vector that consists of the “angle” (defined as the angle between the x-axis and the major axis of an ellipse enclosing the subject), the “ratio” (defined as width-to-height relationship of a bounding rectangle), and the “ratio derivative” (defined as the velocity with which the silhouette changes) is used with a k-Nearest Neighbor [23] classifier to classify whether to observed movement event is a fall. In [24] OF is calculated and various features of points of interest are derived. These are then used by a Convolutional Neural network [25] for classification of falling events. The system also includes a two-step rule-based motion detection system that handles large, sudden movements and applies rule-based mechanisms when variations in optical flow exceed a threshold
In the current paper Optical Flow is calculated by a novel technique developed in our group [9]. This OF method provides substantial benefits when compared to traditional OF algorithms. GLORIA is a group parameter reconstruction method known for its computational efficiency and speed. In the following sections we show how to utilize the benefits of this method in solving the fall detection problem. We would like to point out that the method for fall detection we are presenting has been designed and tested on indoor data with a single moving person in frame, but can certainly be applied in open space applications as well.
1.3. Organization
The rest of the paper is organized as follows. The next section introduces our novel fall detection method. We introduce its description, machine learning methods that are used for classification, evaluation metrics and video datasets on which our algorithm is evaluated. Subsequently, we present our results on said datasets and provide comments about the method based on accuracy, speed and other conditions such as camera placement. In the Discussion section, we go over further details, plans for future developments, limitations, and the competitive properties of our approach. We also provide a detailed summary of our results and their meaning.
2. Materials and Methods
2.1. GLORIA Net
Description of our current method begins by introducing the OF problem in Eq. (1). We refer to an individual pixel in a color image frame as , where are its spatial coordinates and the current frame/time, is the color channel, most commonly labeled as R, G, and B. If we assume that all changes of the image content in time are caused by scene deformation, and if we define the local vector velocity (vector field as , the corresponding image transformation is:
In Eq. (1) is the vector field operator, is the current color channel and is the time or frame number. The velocity field can determine a large variety of object motion properties such as translations, rotations, dilatations (expansions and contractions), etc. For the current method, however, we do not need to calculate the velocity vector field for each point, as we can directly reconstruct global features of the optic flow, considering only specific aggregated values associated with it. Specifically, we want to find the global two-dimensional linear non-homogeneous transformations which consist of rotations, translations, dilatations, and shear transformations that characterize the fall movements. Therefore, we use “GLORIA. The vector field operator introduced in Eq. (1) takes the following form:
The representation in Eq. (2) can be used when decomposing the vector field as a superposition of known transformations. We mark the vector fields corresponding to each transformation generator within a group as , and the corresponding parameters as , then:
With Eq. (3) we define a set of differential operators for the group of transformations that form a Lie algebra:
We can apply Eq. (4) to the group of six general linear non-homogeneous transformations in two-dimensional images to derive the global motion operators:
The aggregated values related to the translations, shears, rotation and dilatation can be expressed through the structural tensor and the driving vector field :
The GLORIA algorithm allows us to skip point-wise OF calculation and instead obtain a 6-element mean-flow vector for each two consecutive frames. This is very advantageous as it allows us to speed up the process significantly, while preserving a high degree of accuracy. Another strength of this method is that it works regardless of camera position. It is also important to note that GLORIA can work with spectral data (in our case the color images that make up the video).
We examine the videos by splitting them in N = 150 frame subdivision. For each subsection we have a 6 × 150 array. We use our datasets to train a Convolutional Neural Network (CNN) that works with our GLORIA vectors and subsequently classify whether new video data contains a fall event or not.
The CNN uses a 1D-like architecture by applying 2D convolutional layers, allowing it to capture patterns across the width while preserving vertical structure. The network has an input layer tailored to arrays of size 6 × 150. It uses three convolutional blocks to extract features. The first two blocks each have a convolutional layer, a batch normalization, ReLU activation function, and max pooling step. These layers extract different features and reduce the width of the feature maps. The last convolutional block is used to refine finer details and features and can be optional. Afterwards, the feature maps are flattened into a one-dimensional vector, passed through a dense layer with 64 neurons, and regularized with dropout step to prevent overfitting. The final fully connected layer has two neurons that are used for binary classification, followed by a softmax and classification layer to output probabilities and compute the cross-entropy loss. The model is trained using an Adam optimizer with a learning rate of 0.001, mini-batches of size 32, and up to 16 epochs. Validation is performed regularly using test data, and L2 regularization (0.001) is applied to improve generalization. This architecture is specially designed for our type of structured temporal data. Our main idea with this approach is that a fall is a very fast and abrupt event and that will have an effect on all six elements of the flow vector. The CNN helps us to additionally refine and classify features that reflect the fall. A diagram of the network’s layers is presented in Figure 1:
2.2. LSTM
The GLORIA algorithm generates a sequence of 6 × 1 vectors, each quantifying the total motion between consecutive video frames, thereby encoding inherent temporal dependencies. To classify videos for fall detection, a model capable of processing this sequential data while preserving historical context was essential. Traditional recurrent neural networks (RNNs) are fundamentally limited in maintaining long-term contextual information. Consequently, we adopted Long Short-Term Memory (LSTM) networks [26], a robust extension designed to overcome these limitations through its specialized gating mechanism. Despite their prevalent use in natural language processing, LSTMs have demonstrated strong performance in time-series analysis, suggesting their utility for our classification problem. Our solution employs a hybrid CNN-LSTM architecture to leverage the respective strengths of both models. Convolutional Neural Network (CNN) layers are first utilized to extract local patterns and refine the raw motion vector representation. The output from these CNN layers is then fed into LSTM layers, which process the refined vectors sequentially to identify meaningful temporal features. This integrated approach effectively combines the spatial feature extraction capabilities of CNNs with the temporal modeling power of LSTMs, resulting in enhanced classification accuracy for fall detection. This LSTM approach allows us to additionally increase the accuracy of our method. Figure 2 shows where the Bidirectional LSTM block fits in our CNN layer structure:
2.3. Datasets
We have used a total of three datasets for method training and evaluations in this work. They are all public and and available for download by anyone. We have decided to use widely popular and freely available resources as we believe it is a good way to benchmark our method’s capabilities.
2.3.1. UP Fall Detection Dataset
This dataset [27] contains 1118 videos in total with FPS of 18 frames per second. There are two camera positions from which falls are recorded. Videos are short, with an average duration of roughly 16 seconds. The camera is placed horizontally with respect to the floor. Frame size is 640 × 480. The recorded video is in color. The dataset is labeled by activity. These are the motions the recorded person is doing – jumping, laying on the ground, sitting in a chair, walking, squatting, falling, standing still upright.
2.3.2. LE2I Video Dataset
This dataset [28] contains 191 videos with FPS of 25 frames per second. There are numerous camera positions, including camera placement in one of the upper corners of the room. This means that sometimes, depending on fall direction and camera placement, the velocities of the person related to the fall will not have a significant y-component. Frame resolution is 320 × 240. Here the videos are labeled by marking during which frames of the video a fall occurs.
2.3.3. UR Fall Detection Dataset
This dataset [29] contains 70 videos with FPS of 30 frames per second. Like the previous dataset, camera positions are numerous. Kinect cameras are used to record the fall events. The videos are in color. We use this dataset mainly as Out-of-distribution set to further evaluate the performance of the GLORIA Net method.
2.4. Evaluation Parameters
In the current work, we are interested in binary classification. In order to evaluate the performance of our models, we introduce a number of statistical values, derived from the confusion matrix. This is a 2 × 2 matrix that is used to compare ground-truth labels to labels predicted from our models. It has the following entries:
- True positives (TP) – number of times we have correctly predicted an event as positive (e.g., our model predicts a fall, and a fall occurred indeed);
- False positives (FP) – number of times we have incorrectly predicted an event as positive (Type I error);
- True negative (TN) – number of times we have correctly predicted an event as negative (e.g., our model predicts no fall, and a fall did not occur);
- False positives (FN) – number of times we have incorrectly predicted an event as negative (Type II error);
Using these values, we can define the following measures:
Accuracy is a useful evaluation parameter as it shows us the overall proportion of correctly predicted events. Another measure we use in the article is the Sensitivity:
This measure indicates how often the model correctly classifies positive cases. Similarly, the Specificity shows us how good the model’s prediction is for negative cases:
Precision show us the rate of predicted positives that are classified correctly:
The F1-score is a good example for a single parameter that can evaluate false positives and false negatives at the same time:
In order to demonstrate the performance of our model graphically, we will use Receiver Operating Characteristic (ROC) curves. They plot the Sensitivity (True Positive Rate) against the False positive rate (1-Specificity) at different thresholds. They are useful as the Area Under the Curve (AUC) can be used to describe how effective a model is. The closer AUC is to 1, the better the model is. An AUC value close to 0.5 indicates random guessing. The introduced values so far are dimensionless and indicate a percentage.
Used together, all the measures described so far can give a very detailed evaluation of the performance of our predictive model.
3. Results
A Lenovo® ThinkPad (Lenovo, Hong Kong) with an Intel® Core i5 CPU (Intel, Santa Clara, CA, USA) and 16 Gb of RAM is used to process videos from our sets. Algorithm realization is carried out in MATLAB® R2023b environment.
3.1. GLORIA Net Results
For training and evaluation of this method we combined the UP-Fall Dataset and the LE2I dataset. The CNN was trained on 90% of the data (as well as finetuning the hyperparameters and other network-related setting). Performance evaluation was then carried out on the remaining 10% of the data. We also introduced an out-of-distribution dataset (UR Fall Detection Dataset), in order to give a more detailed and clearer picture on model performance as sometimes CNNs tend to overfit on their training data. This also helps us to verify the quality, adequacy, reusability and robustness of the selected features. ROC curves for GLORIA Net are available in Figure 3:
The other evaluation measures, introduced in chapter 2.4 are displayed in Table 1:
With an included LSTM approach, the performance of our method is slightly improved (we register less false negative (FN) events). In this case, the same evaluation measures are presented in Table 2:
The results in Table 2 show the beneficial effect of the LSTM approach.
3.3. Comparison in Processing Times
We also provide a detailed evaluation of the speed with which we process the video data and classify events in a 150-frame window extract from the video. Figure 4 shows us the time our method needs to decide whether a fall event is present or not in a 150-frame time window for different camera resolutions:
This points to the method’s applicability in real-time scenarios.
4. Discussion & Conclusion
We have developed a novel method for detecting falls using video data from standard cameras. Our technique is very robust – it does not depend on camera placement, which is very advantageous as often cameras are placed in various locations throughout a room. We provide two evaluations with which we can judge overall performance of the method – one on the 10% remainder of training data and another on an OOD set. From the evaluations we see that it matches in accuracy state-of-the-art optical flow methods such as the one presented in [18], without needing fusion of both video and audio data.
The method relies on a fast OF algorithm, which makes it very suitable to for real-time problems such as the fall detection task. Both of these factors – freedom to place the camera in different locations and the computational efficiency shows us the universality of our method and its application for detection of falls in real-time.
In addition to the above, it is worth mentioning that in the present work, we show an original approach to apply and use CNNs in video data. Most commonly, CNNs are used with images. A number of possible approaches [30,31] for application of convolutional neural networks in videos can be found in the literature, but the integration of the principal component OF parameters with a CNN is а novel contribution.
Recently our group has introduced a system for real-time automated detection of epileptic seizures from video. Its capabilities were upgraded to include patient tracking and multiple camera coverage. GLORIA Net has been added to the existing system as it is modular in nature. We are currently observing its work, but so far, the addition has been very beneficial.
A limitation of our method is that it works with chunks of video data – collections of 150 frames from the video. This can be restricting in certain scenarios. As a future direction of development, we plan to increase responsiveness of the method so relevant parties can react quicker in the event of a fall.
Another direction for future development is to define and extract features from the data that are related to the fall event in a physical sense. For example. we may look at the fall duration, the acceleration of the person, whether or not movement is periodic and other similar quantities. Such preliminary refinement may help increase the accuracy of our fall detection scheme.
Many commercially available fall detection systems exist. Like the method here, they are described as accurate, inobtrusive, real-time and automatic. What our system can do better is to rely on less sensors than wearable approaches [6,7] – it can work with a single camera while retaining real-time function with accurate results. In addition, cameras are readily available and can be found in many hospitals and homes, which removes the need to install and maintain special ambient sensors [5]. These benefits of our method when compared to commercial products further highlight its usefulness and ease of applicability.
Author Contributions
Conceptualization, G.P. and S.K.; methodology, S.K., S.B.K. and O.G.; software, S.B.K, T.S. and A.T.; validation, S.B.K, T.S. and A.T.; formal analysis, G.P.; investigation, S.B.K, T.S., G.P and A.T.; resources, O.G. and S.K. ; data curation, S.B.K.; writing—original draft preparation, S.B.K..; writing—review and editing, O.G., S.K. and G.P.; visualization, S.B.K, T.S. and A.T.; supervision, S.K and G.P..; project administration, G.P.; funding acquisition, G.P., O.G. and S.K.All authors have read and agreed to the published version of the manuscript.
Funding
This research is part of the GATE project funded by the Horizon 2020 WIDESPREAD-2018-2020 TEAMING Phase 2 programme under grant agreement no. 857155, the programme “Research, Innovation and Digitalization for Smart Transformation” 2021-2027 (PRIDST) under grant agreement no. BG16RFPR002-1.014-0010-C01. Stiliyan Kalitzin is partially funded by “De Christelijke Vereniging voor de Verpleging van Lijders aan Epilepsie”, Program 35401, Remote Detection of Motor Paroxysms (REDEMP).
Institutional Review Board Statement
Not applicable.
Informed Consent Statement
Not applicable.
Data Availability Statement
Available upon request.
Acknowledgments
No acknowledgements.
Conflicts of Interest
The authors declare no conflicts of interest.
Abbreviations
The following abbreviations are used in this manuscript:
| OF | Optical Flow |
| SVM | Support Vector Machine |
| CNN | Convolutional Neural Network |
| ROC | Receiver Operator Characteristic |
| AUC | Area Under the Curve |
| FPS | Frames Per Second |
References
- J. C. Davis et al., “Cost-effectiveness of falls prevention strategies for older adults: protocol for a living systematic review,” BMJ Open, vol. 14, no. 11, p. e088536, Nov. 2024. [CrossRef]
- European Public Health Association, “Falls in Older Adults in the EU: Factsheet.” Accessed: Jun. 04, 2025. [Online]. Available: https://eupha.org/repository/sections/ipsp/Factsheet_falls_in_older_adults_in_EU.pdf.
- J. C. Davis, M. C. Robertson, M. C. Ashe, T. Liu-Ambrose, K. M. Khan, and C. A. Marra, “International comparison of cost of falls in older adults living in the community: a systematic review,” Osteoporosis International 2010 21:8, vol. 21, no. 8, pp. 1295–1306, Feb. 2010. [CrossRef]
- X. Wang, J. Ellul, and G. Azzopardi, “Elderly Fall Detection Systems: A Literature Survey,” Jun. 23, 2020, Frontiers Media S.A. [CrossRef]
- ”WO2025082457 FALL DETECTION AND PREVENTION SYSTEM AND METHOD.” Accessed: Jun. 16, 2025. [Online]. Available: https://patentscope.wipo.int/search/en/detail.jsf?docId=WO2025082457.
- ”US8217795B2 - Method and system for fall detection - Google Patents.” Accessed: Jun. 16, 2025. [Online]. Available: https://patents.google.com/patent/US8217795B2/en.
- C. Soaz González, “DEVICE, SYSTEM AND METHOD FOR FALL DETECTION,” EP 3 796 282 A2, Mar. 21, 2021 Accessed: Jun. 16, 2025. [Online]. Available: https://patentimages.storage.googleapis.com/e9/e8/a1/fc9d181803c231/EP3796282A2.pdf#page=19.
- S. Kalitzin, E. Geertsema, and G. Petkov, “Scale-Iterative Optical Flow Reconstruction from Multi-Channel Image Sequences,” Frontiers in Artificial Intelligence and Applications, vol. 310, pp. 302–314, 2018. [CrossRef]
- S. Kalitzin, E. Geertsema, and G. Petkov, “Optical Flow Group-Parameter Reconstruction from Multi-Channel Image Sequences,” Frontiers in Artificial Intelligence and Applications, vol. 310, pp. 290–301, 2018. [CrossRef]
- B. D. Lucas and T. Kanade, “An Iterative Image Registration Technique with an Application to Stereo Vision (IJCAI) An Iterative Image Registration Technique with an Application to Stereo Vision.” [Online]. Available: https://www.researchgate.net/publication/215458777.
- B. K. P. Horn and B. G. Schunck, “Determining optical flow,” Artif Intell, vol. 17, no. 1–3, pp. 185–203, Aug. 1981. [CrossRef]
- J. Jeyasingh-Jacob et al., “Markerless Motion Capture to Quantify Functional Performance in Neurodegeneration: Systematic Review,” JMIR Aging, vol. 7, p. e52582, 2024. [CrossRef]
- S. Karpuzov, G. Petkov, S. Ilieva, A. Petkov, and S. Kalitzin, “Object Tracking Based on Optical Flow Reconstruction of Motion-Group Parameters,” Information (Switzerland), vol. 15, no. 6, Jun. 2024. [CrossRef]
- V. Vargas, P. Ramos, E. A. Orbe, M. Zapata, and K. Valencia-Aragón, “Low-Cost Non-Wearable Fall Detection System Implemented on a Single Board Computer for People in Need of Care,” Sensors 2024, Vol. 24, Page 5592, vol. 24, no. 17, p. 5592, Aug. 2024. [CrossRef]
- L. Wu et al., “Robust fall detection in video surveillance based on weakly supervised learning,” Neural Networks, vol. 163, pp. 286–297, Jun. 2023. [CrossRef]
- S. Chhetri, A. Alsadoon, T. A. D. in, P. W. C. Prasad, T. A. Rashid, and A. Maag, “Deep Learning for Vision-Based Fall Detection System: Enhanced Optical Dynamic Flow,” Comput Intell, vol. 37, no. 1, pp. 578–595, Mar. 2021. [CrossRef]
- F. X. Gaya-Morey, C. Manresa-Yee, and J. M. Buades-Rubio, “Deep learning for computer vision based activity recognition and fall detection of the elderly: a systematic review,” Applied Intelligence, vol. 54, no. 19, pp. 8982–9007, Oct. 2024. [CrossRef]
- E. E. Geertsema, G. H. Visser, M. A. Viergever, and S. N. Kalitzin, “Automated remote fall detection using impact features from video and audio,” J Biomech, vol. 88, pp. 25–32, May 2019. [CrossRef]
- C. Cortes, V. Vapnik, and L. Saitta, “Support-vector networks,” Machine Learning 1995 20:3, vol. 20, no. 3, pp. 273–297, Sep. 1995. [CrossRef]
- K. De Miguel, A. Brunete, M. Hernando, and E. Gambao, “Home camera-based fall detection system for the elderly,” Sensors (Switzerland), vol. 17, no. 12, Dec. 2017. [CrossRef]
- M. Piccardi, “Background subtraction techniques: A review,” Conf Proc IEEE Int Conf Syst Man Cybern, vol. 4, pp. 3099–3104, 2004. [CrossRef]
- R. E. Kalman, “A New Approach to Linear Filtering and Prediction Problems,” Journal of Basic Engineering, vol. 82, no. 1, pp. 35–45, Mar. 1960. [CrossRef]
- T. M. Cover and P. E. Hart, “Nearest Neighbor Pattern Classification,” IEEE Trans Inf Theory, vol. 13, no. 1, pp. 21–27, 1967. [CrossRef]
- Y. Z. Hsieh and Y. L. Jeng, “Development of Home Intelligent Fall Detection IoT System Based on Feedback Optical Flow Convolutional Neural Network,” IEEE Access, vol. 6, pp. 6048–6057, Nov. 2017. [CrossRef]
- G. E. Hinton, “Computation by neural networks,” Nat Neurosci, vol. 3, no. 11s, p. 1170, 2000. [CrossRef]
- S. Hochreiter and J. Schmidhuber, “Long Short-Term Memory,” Neural Comput, vol. 9, no. 8, pp. 1735–1780, Nov. 1997. [CrossRef]
- L. Martínez-Villaseñor, H. Ponce, J. Brieva, E. Moya-Albor, J. Núñez-Martínez, and C. Peñafort-Asturiano, “UP-Fall Detection Dataset: A Multimodal Approach,” Sensors 2019, Vol. 19, Page 1988, vol. 19, no. 9, p. 1988, Apr. 2019. [CrossRef]
- Charfi, J. Miteran, J. Dubois, M. Atri, and R. Tourki, “Optimized spatio-temporal descriptors for real-time fall detection: comparison of support vector machine and Adaboost-based classification,” J Electron Imaging, vol. 22, no. 4, p. 041106, Jul. 2013. [CrossRef]
- B. Kwolek and M. Kepski, “Human fall detection on embedded platform using depth maps and wireless accelerometer.”.
- J. Carreira, A. Zisserman, Z. Com, and † Deepmind, “Quo Vadis, Action Recognition? A New Model and the Kinetics Dataset”.
- D. Tran, L. Bourdev, R. Fergus, L. Torresani, and M. Paluri, “Learning Spatiotemporal Features with 3D Convolutional Networks”.
Figure 1.
Description of the layers and their activations for GLORIA Net.
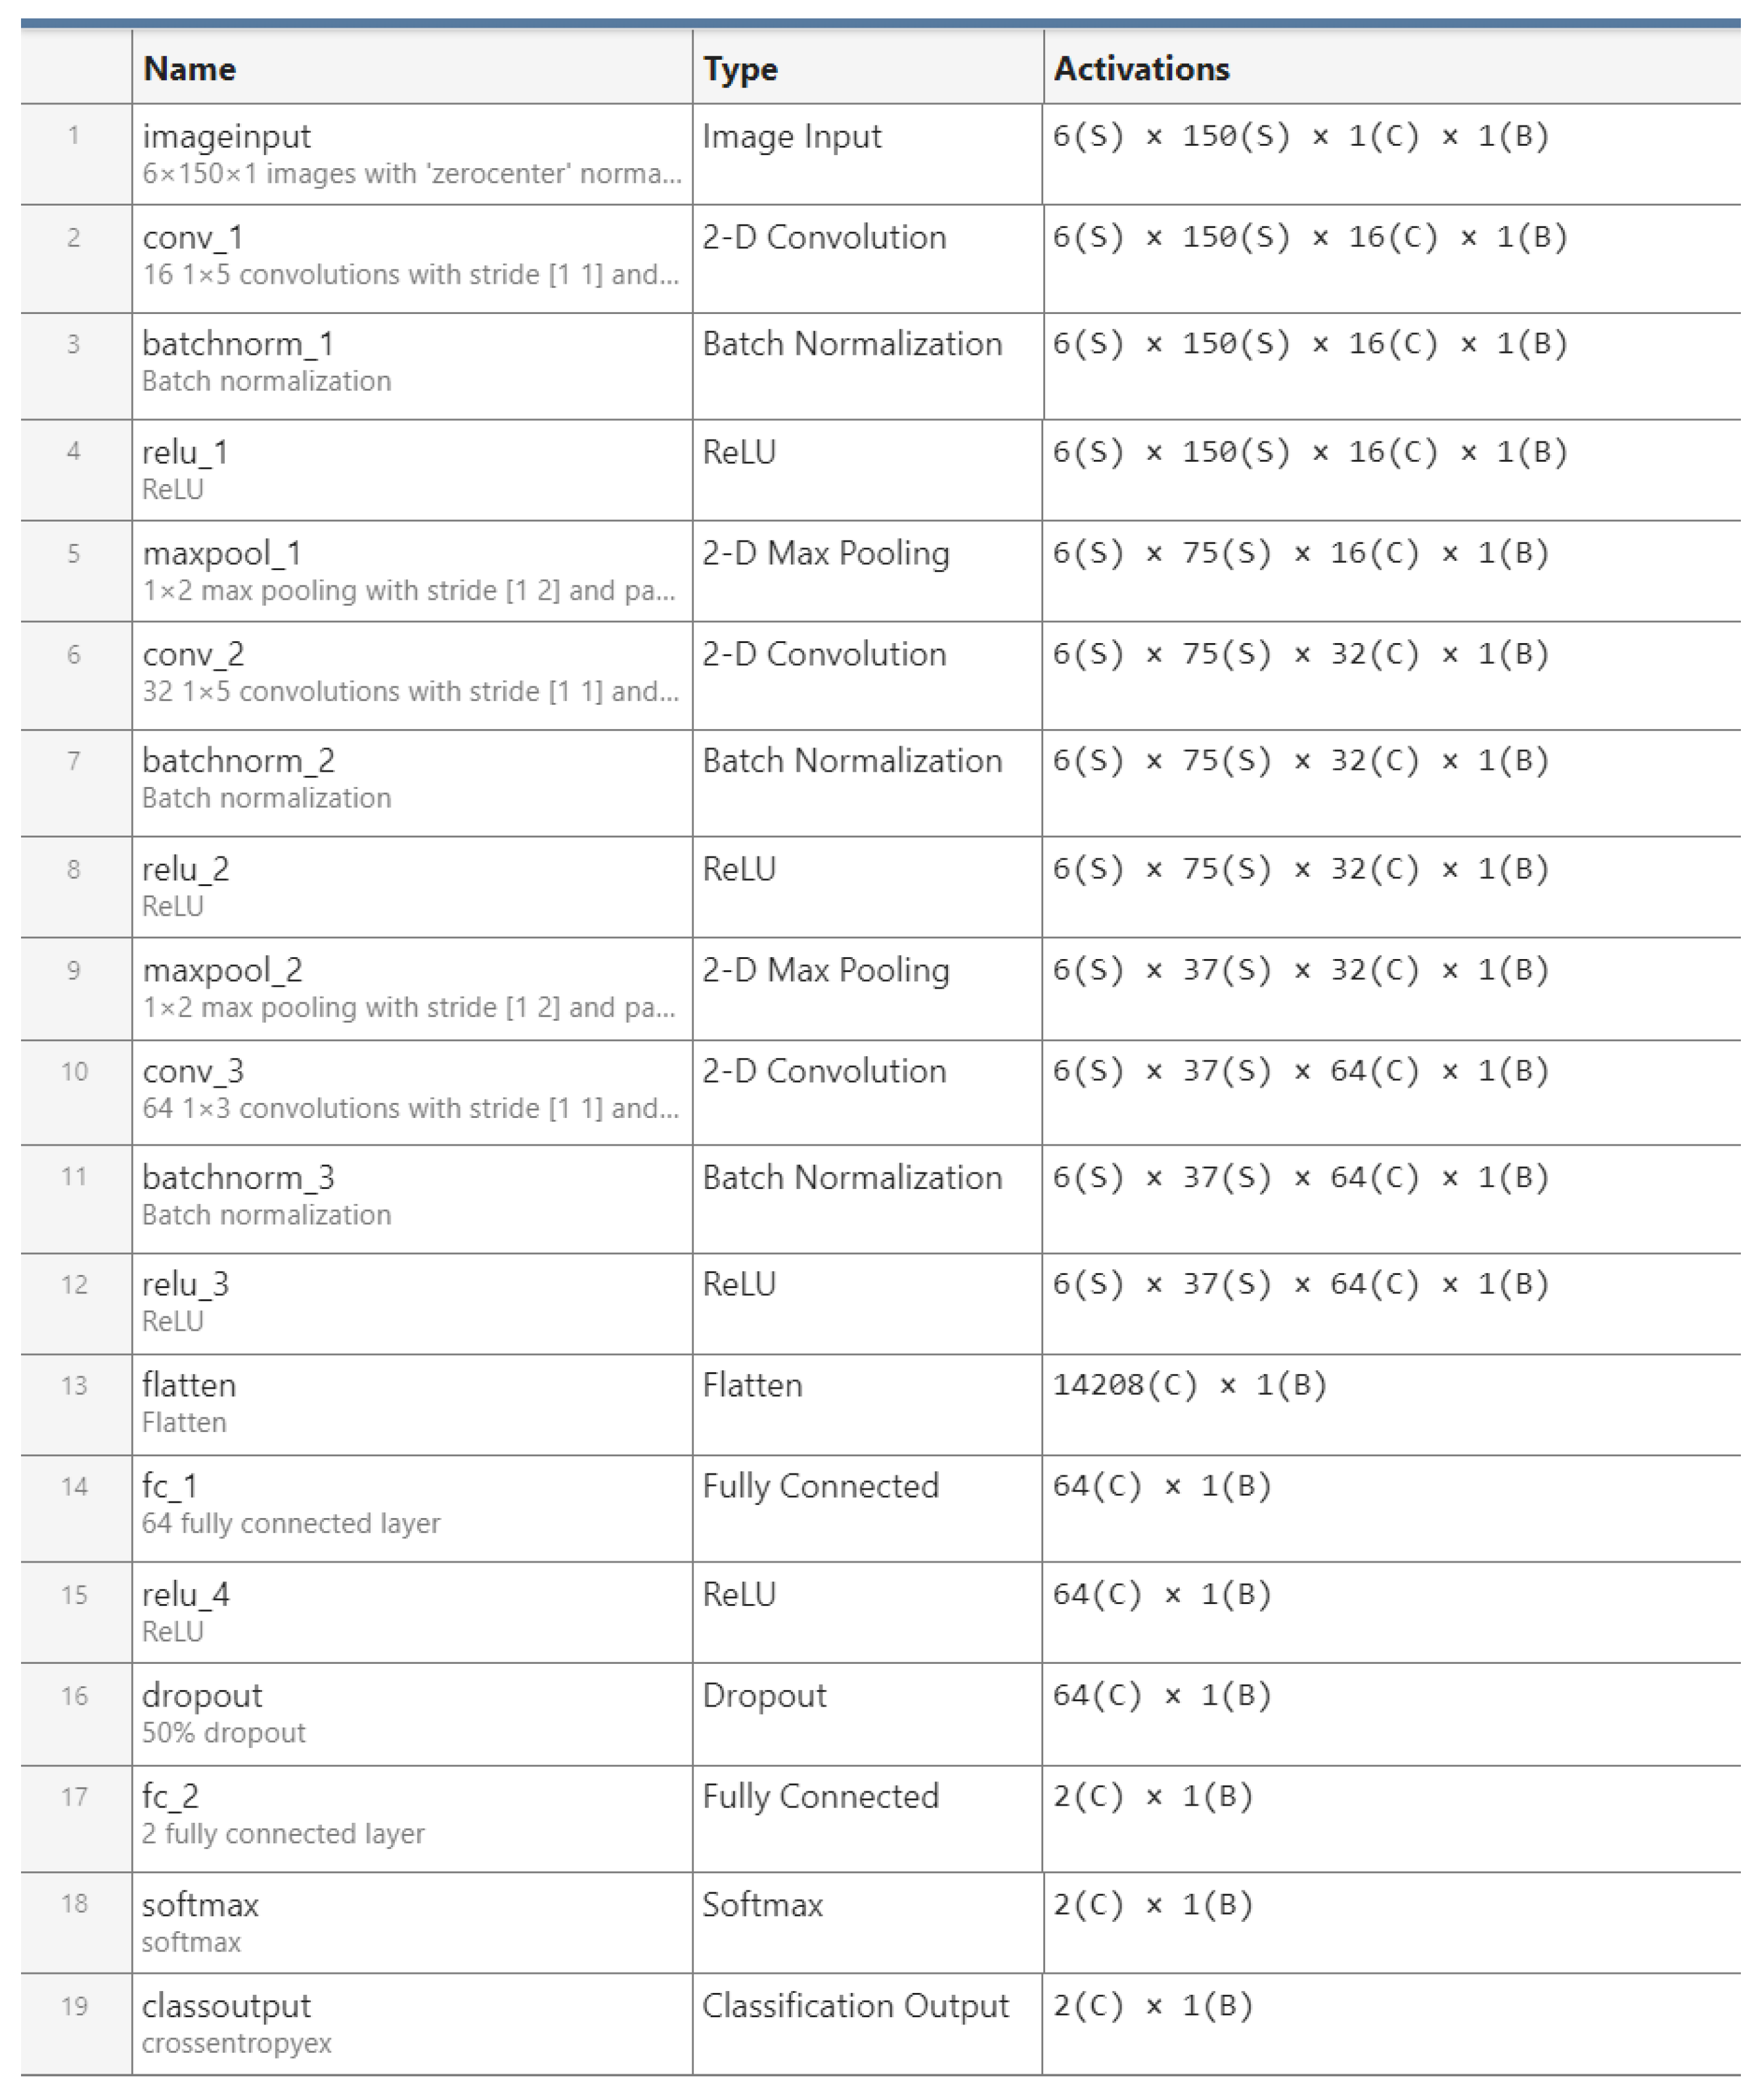
Figure 2.
Addition of the LSTM block to our network.

Figure 3.
ROC curves for the GLORIA Net. Green line is for the performance on UR Dataset, blue line is for the performance on the UP-Fall+LE2I 10% subset. AUC values are provided in the legend.
Figure 3.
ROC curves for the GLORIA Net. Green line is for the performance on UR Dataset, blue line is for the performance on the UP-Fall+LE2I 10% subset. AUC values are provided in the legend.

Figure 4.
Processing time required to make a classification for different screen resolutions.
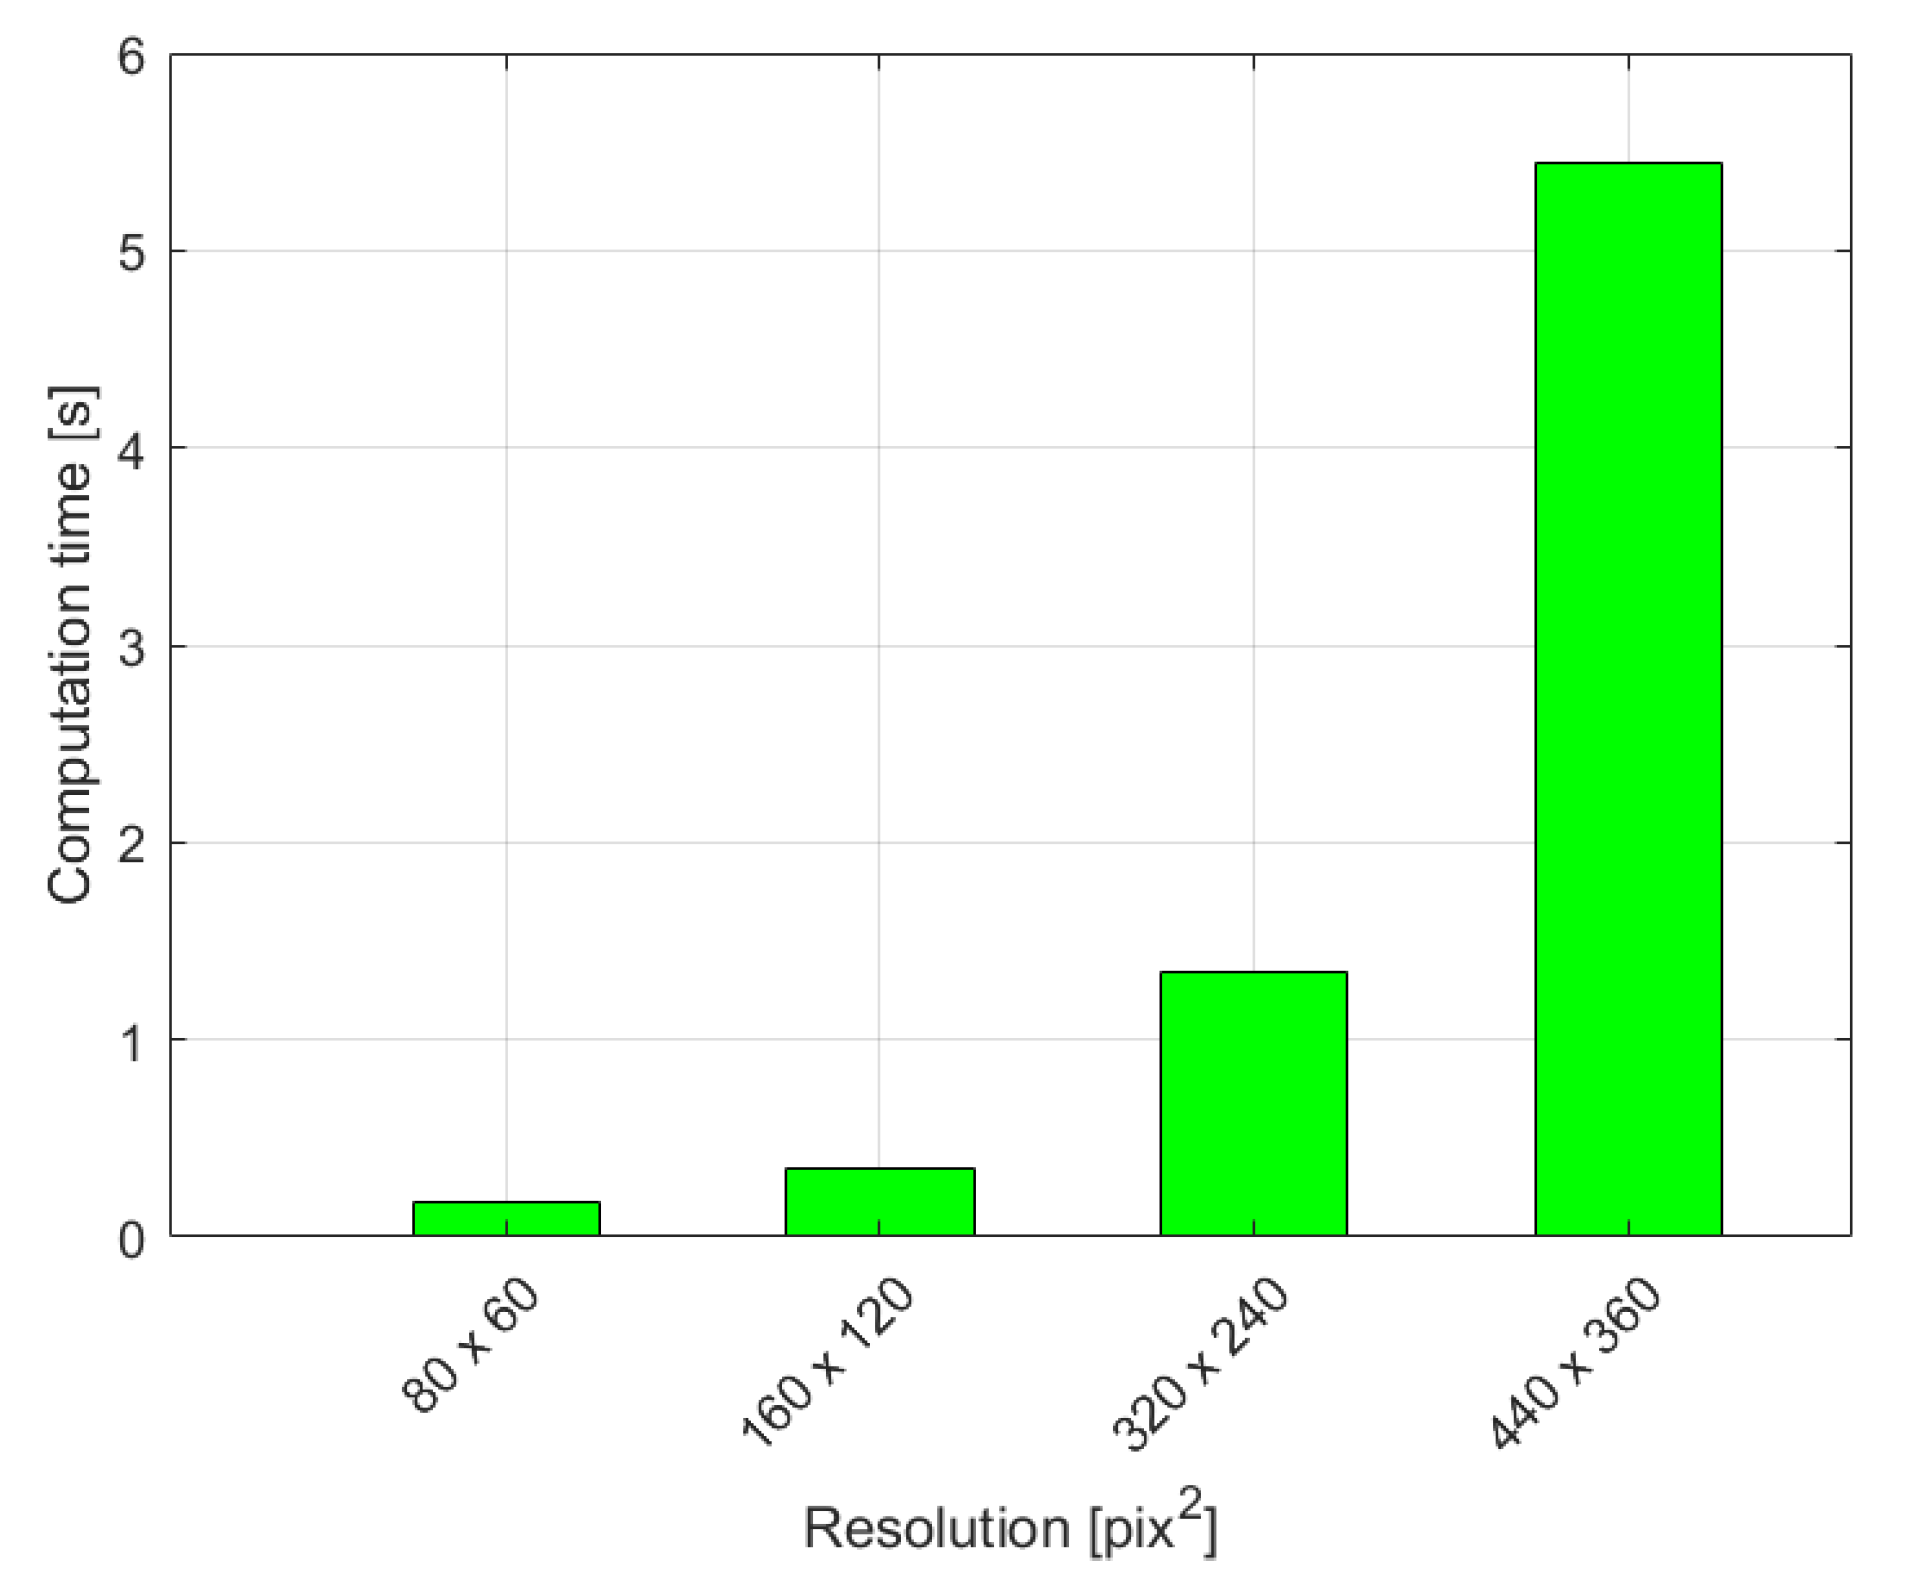

Table 1.
Accuracy, precision, sensitivity, specificity and f1-score for both datasets.
| Dataset | Accuracy | Sensitivity | Specificity | Precision | F1-score |
| UP-Fall+LE2I | 97.7% | 98.1% | 96.9% | 97.0% | 98.0% |
| UR | 83.3% | 83.3% | 83.3% | 83.3% | 83.3% |
Table 2.
Accuracy, precision, sensitivity, specificity and f1-score for both datasets.
| Dataset | Accuracy | Sensitivity | Specificity | Precision | F1-score |
| UR (+ LSTM) | 91.7% (↑ 8.4%) | 83.3% | 100.0% (↑ 16.7%) | 100.0% (↑ 16.7%) | 90.9% (↑ 7.6%) |
| UR (no LSTM) | 83.3% | 83.3% | 83.3% | 83.3% | 83.3% |
Disclaimer/Publisher’s Note: The statements, opinions and data contained in all publications are solely those of the individual author(s) and contributor(s) and not of MDPI and/or the editor(s). MDPI and/or the editor(s) disclaim responsibility for any injury to people or property resulting from any ideas, methods, instructions or products referred to in the content. |
© 2025 by the authors. Licensee MDPI, Basel, Switzerland. This article is an open access article distributed under the terms and conditions of the Creative Commons Attribution (CC BY) license (http://creativecommons.org/licenses/by/4.0/).
Copyright: This open access article is published under a Creative Commons CC BY 4.0 license, which permit the free download, distribution, and reuse, provided that the author and preprint are cited in any reuse.


