Submitted:
24 July 2025
Posted:
25 July 2025
You are already at the latest version
Abstract
Background: Single Digit Modality Test (SDMT) has been claimed to be one of the most sensitive tests to measure attention and information processing speed in multiple sclerosis (MS).
Objectives: We aimed to evaluate the efficacy and usefulness of three brief, easy-to-administer, and repeatable tests: SDMT, Digit Span Forward (DSF), and Digit Span Backward (DSB) in MS patients (MSp), and compare the results with those of healthy volunteers (CON). We were hoping to identify the most sensitive test that would be used in clinical practice on a regular basis. In addition, we tried to identify the metabolic background of the cognitive setting using the advanced radiological method, Mescher-Garwood (MEGA)-edited 1H - Magnetic Resonance Spectroscopy (1H - MRS).
Methods: 22 relapsing MSp and 23 age-, education-, and gender-matched CON were enrolled. In MSp, clinical disability was evaluated using Expanded Disability Status Scale (EDSS). The SDMT, DSF, and DSB tests were used in all participants. They also underwent a 1H - MRS brain examination. In addition to N-Acetyl-Aspartate (tNAA), Myoinositol (mIns), and Choline (tCho), and Creatine (tCr) containing compounds were also evaluated GABA and Glutamate-Glutamine (Glx) ratios.
Results: CON were superior to MSp in results of all neurocognitive tests. The DSB was found to be the most sensitive test to identify MSp. The SDMT in MSp correlated with inflammatory and degenerative metabolites in the thalamus, hippocampus, and corpus callosum. A correlation between increased Glx- and GABA-ratios and SDMT was found. Unlike the SDMT, the DSF and DSB showed correlations with inflammatory metabolites in the caudate nucleus and hypothalamus. DSF correlated with GABA-ratios in hippocampus.
Conclusion: Our study confirms efficacy of DSF and DSB tests in evaluating working memory cognitive impairment in MSp, showing an association of the tests with specific brain metabolites.
Keywords:
SDMT
; Digit Span Forward
; Digit Span Backward
; GABA-edited 1H – MRS
; Multiple Sclerosis
1. Introduction
Multiple sclerosis (MS), a chronic, immune-mediated neurodegenerative disorder of the central nervous system (CNS), which collectively contribute to progressive neurological disability [1,2]. While motor and sensory deficits are hallmark clinical features, cognitive dysfunction (CD) represents a profound burden, significantly impairing quality of life, vocational capacity, and psychosocial well-being [3]. CD may manifest early in the disease course, even without significant physical disability, and correlate poorly with conventional magnetic resonance imaging (MRI) markers such as T2 hyperintense lesion load or gadolinium-enhancing activity [4]. This dissociation underscores the limitations of structural imaging in capturing the complex neurobiological substrates of cognitive decline, which are hypothesized to involve microstructural damage, metabolic dysregulation, and network-level disconnection. Emerging evidence suggests that cortical and deep gray matter (GM) atrophy and diffuse white matter (WM) pathology in normal-appearing tissue may drive cognitive impairment. Yet, the molecular mechanisms linking neuroinflammation, neurodegeneration, and neuropsychological deficits remain not well understood [5,6,7].
One of the advanced MRI methods is 1-proton Magnetic Resonance Spectroscopy (1H - MRS) [8], which detects biochemical alterations in lesioned and normal-appearing brain tissue [4]. In this study was used Mescher-Garwood (MEGA)-edited 1H - MRS [9,10], which allows evaluation of neurotransmitters such as Glutamate with its precursor Glutamine (Glx), and γ-Aminobutyric Acid (GABA), in addition to traditional metabolites reflecting tissue alteration such as N-Acetyl-Aspartate(tNAA), Myoinositol (mIns), and Choline (tCho), and Creatine (tCr)-containing compounds [9,10]. In a short summary, tNAA is a marker of neuronal density and mitochondrial function synthesized in neuronal mitochondria; tCr is a compound central to adenosine triphosphate (ATP) buffering and cellular energy homeostasis; tCho is indicative of membrane phospholipid turnover and upregulated in neuroinflammatory states; mIns is a glial-specific osmolyte elevated in astrogliosis and microglial activation; Glx is an excitatory neurotransmitter involved in synaptic signaling and implicated in excitotoxic injury; GABA has a role as the major inhibitory neurotransmitter referred to as a marker of neuro-plasticity [11,12].
Cognitive function and affective symptoms have been evaluated using a standardized battery of neuropsychological tests and validated self-report measures selected for their established sensitivity to MS-related deficits. The Symbol Digit Modalities Test (SDMT)[13,14,15], is a validated measure of information processing speed (IPS) and working memory, the primary endpoint for assessing cognitive efficiency in MSp. The SDMT emphasizes rapid visual scanning, sustained attention, and cognitive flexibility, domains disproportionately impaired in MS. It has been identified as the most sensitive cognitive marker of disease progression [14,17].
Verbal working memory and attentional capacity could be assessed using the Digit Span subtest from the Wechsler Adult Intelligence Scale (WAIS-IV), administered in both forward (DSF) and backward (DSB) conditions [18]. DSB requires mental manipulation by reversing digit sequences, taxing executive control, and working memory updating. While DSF primarily reflects phonological loop integrity, DSB engages the central executive component of Baddeley’s working memory model, making it sensitive to frontal-subcortical circuit dysfunction common in MS [19].
In this study, we aimed to evaluate the efficacy and usefulness of three brief, easy-to-administer, and repeatable tests: SDMT, DSF, and DSB in MS patients, and compare the results with those of healthy volunteers (CON). We were hoping to identify the most sensitive test that would be used in clinical practice on a regular basis. In addition, we tried to fing the metabolic background of the cognitive setting using the advanced radiological method, MEGA-edited 1H - MRS. Selected areas of white and gray matter in the brains of MS patients and CON were evaluated; data were compared and correlated with the results of SDMT, DSF, and DSB tests.
2. Methods
2.1. Patients
Patients fulfilling the criteria for definite MS according to McDonald 2017 criteria [2] were randomly selected from the Multiple Sclerosis Centre, University Hospital in Martin, Slovakia, and they were entered the study after signing the written consent. The inclusion criteria were: relapsing course of the disease, the absence of clinical relapse and corticosteroid treatment within at least three months before study entry, EDSS ≤ 5.0, aged between 18 and 55 years, and the ability and willingness to cooperate in examinations. The exclusion criterion was serious comorbidities and acute depressive symptomatology confirmed by psychological examination.
We recruited 24 MSp and 23 (7males, 16 females) age-, education-, and gender-matched healthy participants (CON). Out of all participants, data from two MS patient (1male 1female) were not complete, and 1H - MRS data from one CON subject (female) did not meet the technical quality criteria for evaluation, so these subjects were excluded from the analyses. Finally, 22 MSp (9males 40.9% and 13 females 59.1%) participated in the study.
In MSp, clinical disability was evaluated by a neurologist certified in Expanded Disability Status Scale (EDSS) assessment. Cognitive status was tested using the SDMT, DSF and DSB from a neuropsychological battery WAIS-IV by an experienced neuropsychologist.
2.2. Mescher-Garwood GABA-Edited 1H - MRS
Measurements were performed on a 3 T whole-body MR scanner (TIM Trio®, Siemens Healthcare, Erlangen, Germany) using a 32-channel head coil (SiemensHealthcare, Erlangen, Germany) for signal reception. To ensure accurate and reproducible slice positioning, auto-align and three-dimensional T1-weighted anatomical reference images were used (magnetization-prepared two rapid acquisition gradient echoes – MP2RAGE, TR/TE = 4600/3.2 ms, resolution = 0.8 × 0.8 × 0.8 mm³). MRS- measurements were performed using a three-dimensional MEGA-edited sequence (TR/TE = 1600/68 ms, 32 averages, with a measurement time of ~20 min) with localized adiabatic spin echo refocusing selection and spiral encoding [9,10]. For real-time correction, the volumetric, dual-contrast, echo planar imaging-based navigators that update B0 shim, frequency, and motions artifacts were used. All 1H - MRS slices were placed parallel to the anterior commissure–posterior commissure line and covered the centrum semiovale and basal ganglia, with volume of interest-VOI= 90 × 80 × 50 mm3, field of view-FOV= 160 × 160 × 80 mm3, and ~2 cc nominal resolution. The acquired matrix size of 10×10×10 voxels was interpolated to the 16×16×16 matrix of multivoxel (CSI, chemical shift imaging) representation.
Required regions were derived based on T1-weighted images resulting in the selection of areas without detectable manifestation of focal WM or GM lesions. All MR-spectra were evaluated in LCModel software (Version 6.3–1, S. Provencher, LC Model, Oakville, ON, Canada) for obtaining following metabolite ratios tNAA/tCr, tCho/tNAA, tCho/tCr, mIns/tNAA, mIns/tCr, Glx/tNAA, Glx/tCr, GABA/tNAA, and GABA/tCr.
For further analytical processes, all selected voxels had to fulfill quality criteria including more than 10 signal-to-noise ratio and less than 0.10 ppm full width at half maximum.
2.3. Statistical Analyses
All statistical analyses were performed in NCSS (version 9.0, LLC. Kaysville, Utah, USA). One-way ANOVA was used for statistical analyses that found no differences between metabolic values in left and right voxels. Differences in demographic and clinical parameters (age, SDMT, DSF, DSB, EDSS) as well as GABA-edited 1H - MRS metabolite ratios between patients and controls were evaluated using Welsh two-sample t-test or one-way ANOVA with Bonferroni post-hoc test. Cochrane - Armitage test was applied to compare trends of results of DSF and DSB series. Random Forest test was used to stratify variables (cognitive tests and metabolites) according to their predictive power to discriminate between MSp and CON.
3. Results
3.1. Differences Between MSp and CON
CON were superior over MSp in results of all the cognitive tests (SDMT p ˂ 0.00008, DSF p = 0.0008, DSB p = ˂0.0014). Demographic data are in Table 1.

Table 1.
Demographic and basic information about the study groups.
| Characteristic | control, N = 22/14F | RR, N = 23 | p-value | q-value | Median diff (95% CI) |
|---|---|---|---|---|---|
| age | 30.00 (25.00, 34.00) | 34.00 (27.00, 41.00) | 0.2 | 0.4 | -3.0 (-9.0, 2.0) |
| EDSS | NA | 3.28 (1-5) | NA | NA | NA |
| RR (year) |
NA | 0.25 | NA | NA | NA |
| Disease Duration (months) |
NA | 76.5 (10-162) | NA | NA | NA |
| MRI activity (newT2/Gd+ lesions) |
NA | 3/22 (13.6%) | NA | NA | NA |
| DMT | NA | NAT 9/22(40.9%) DMF 3/22(13.6%) GA 3/22 (13.6%) FIN 2/22/(9.9%) ALEM 2/22 (9.9%) TERI 1/22(4.5%) None (2(9.9%) |
|||
| SDMT | 53.50 (47.00, 60.50) | 43.00 (35.50, 49.00) | <0.001 | 0.003 | 11 (6.0, 17) |
| DSF | 7,86 | 6,08 | 0.001 | 0.010 | |
| 3 | 0 (0%) | 1 (4.3%) | |||
| 4 | 0 (0%) | 4 (17%) | |||
| 5 | 1 (4.5%) | 6 (26%) | |||
| 6 | 1 (4.5%) | 3 (13%) | |||
| 7 | 5 (23%) | 4 (17%) | |||
| 8 | 8 (36%) | 3 (13%) | |||
| 9 | 7 (32%) | 0 (0%) | |||
| 10 | 0 (0%) | 1 (4.3%) | |||
| 11 | 0 (0%) | 1 (4.3%) | |||
| DSB | 7,14 | 5,09 | <0.001 | 0.003 | |
| 3 | 0 (0%) | 2 (8.7%) | |||
| 4 | 1 (4.5%) | 10 (43%) | |||
| 5 | 0 (0%) | 3 (13%) | |||
| 6 | 4 (18%) | 4 (17%) | |||
| 7 | 9 (41%) | 2 (8.7%) | |||
| 8 | 6 (27%) | 1 (4.3%) | |||
| 9 | 2 (9.1%) | 0 (0%) | |||
| 10 | 0 (0%) | 1 (4.3%) |
EDSS = Expanded Disability Status Scale, RR = Annualized Relapse Rate, MRI = Magnetic Resonance Imaging, T2 = T2 weighted lesions, Gd+ = gadolinium enhancing lesions, DMT = Disease Modyfing Treatment, DSF = Digit Span Forward, DSB = Digit Span Backward.
3.2. Correlations of Brain Metabolites with Cognitive Tests Are in Table 2, Table 3 and Table 4
Table 2.
Correlation of SDMT with brain metabolites in MSp.
| Thalamus R | tNAA/tCr | pval = 0.04 | cor = 0.43 |
|---|---|---|---|
| Hypothalamus L | Glx/tCr | pval = 0.032 | cor = 0.447 |
| Hippocampus L | mIns/tNAA | pval = 0.014 | cor = −0.507 |
| CC_splenium | tCho/tNAA | pval = 0.048 | cor = −0.417 |
| CC_rostral | GABA/tCr | pval = 0.038 | cor = 0.436 |
| CC_genu | tCho/tNAA | pval = 0.021 | cor = −0.479 |
tNAA = N-acetyl Aspartate, Glx = Glutamate and Glutamine, tCho = Choline, GABA = γ-amino butyric acid, mIns = Myoinositol, tCr = Creatine; CC = corpus callosum; R = right, L = Left, Welsh two-sample t-test, α ˂ 0.05.
Table 3.
Correlation of Digit Span Forward series with brain metabolites in MSp.
| Caudate R | mIns/tNAA | pval = 0.022 | cor = 0.474 |
|---|---|---|---|
| Caudate R | mIns/tCr | pval = 0.021 | cor = 0.477 |
| Hypothalamus R | Glx/tCr | pval = 0.01 | cor = −0.527 |
| Hypothalamus R | tNAA/tCr | pval = 0.04 | cor = −0.432 |
| Hypothalamus L | tCho/tNAA | pval = 0.012 | cor = 0.517 |
| Hippocampus L | GABA/tNAA | pval = 0.007 | cor = 0.545 |
| Hippocampus L | GABA/tCr | pval = 0.026 | cor = 0.464 |
| CC_splenium | mIns/tCr | pval = 0.041 | cor = −0.429 |
| CC_genu | NAA/tCr | pval = 0.021 | cor = −0.479 |
tNAA = N-Acetyl Aspartate, Glx = Glutamate and Glutamine, tCho = Choline, GABA = γ-Aminobutyric Acid, mIns = Myoinositol, tCr = cCreatine; Caudate = Caudate Nucleus, CC = Corpus Callosum; R = right, L = left, Welsh two-sample t-test, α ˂ 0.05.
3.3. Evaluation of the Most Significant Predictors of Multiple Sclerosis
RF as the significant predictors identified See Figure 1.
Figure 1.
Random Forest identification of multiple sclerosis patients. Backward = Digit Span Backward; caudate_mIns.tNAA = Caudate Nucleus Myoinositol/tN-Acetyl Aspartate; caudate_mIns.tCr = Caudate Nucleus Myoinositol/t-Creatinin; caudate_tCho.tNAA = Caudate Nucleus tCholin/tN-Acetyl Aspartate; SDMT = Single Digit Modality Test; forward = Digit Span Forward; corpus callosum_mIns.tNAA = Corpus Callosum Myoinositol/tN-Acetyl Aspartate; caudate_tNAA.tCr = Caudate Nucleus tN-Acetyl Aspartate/tCreatinin; caudate_GABA.tCr = Caudate Nucleus γ-Aminobutyric acid/tCreatinin.
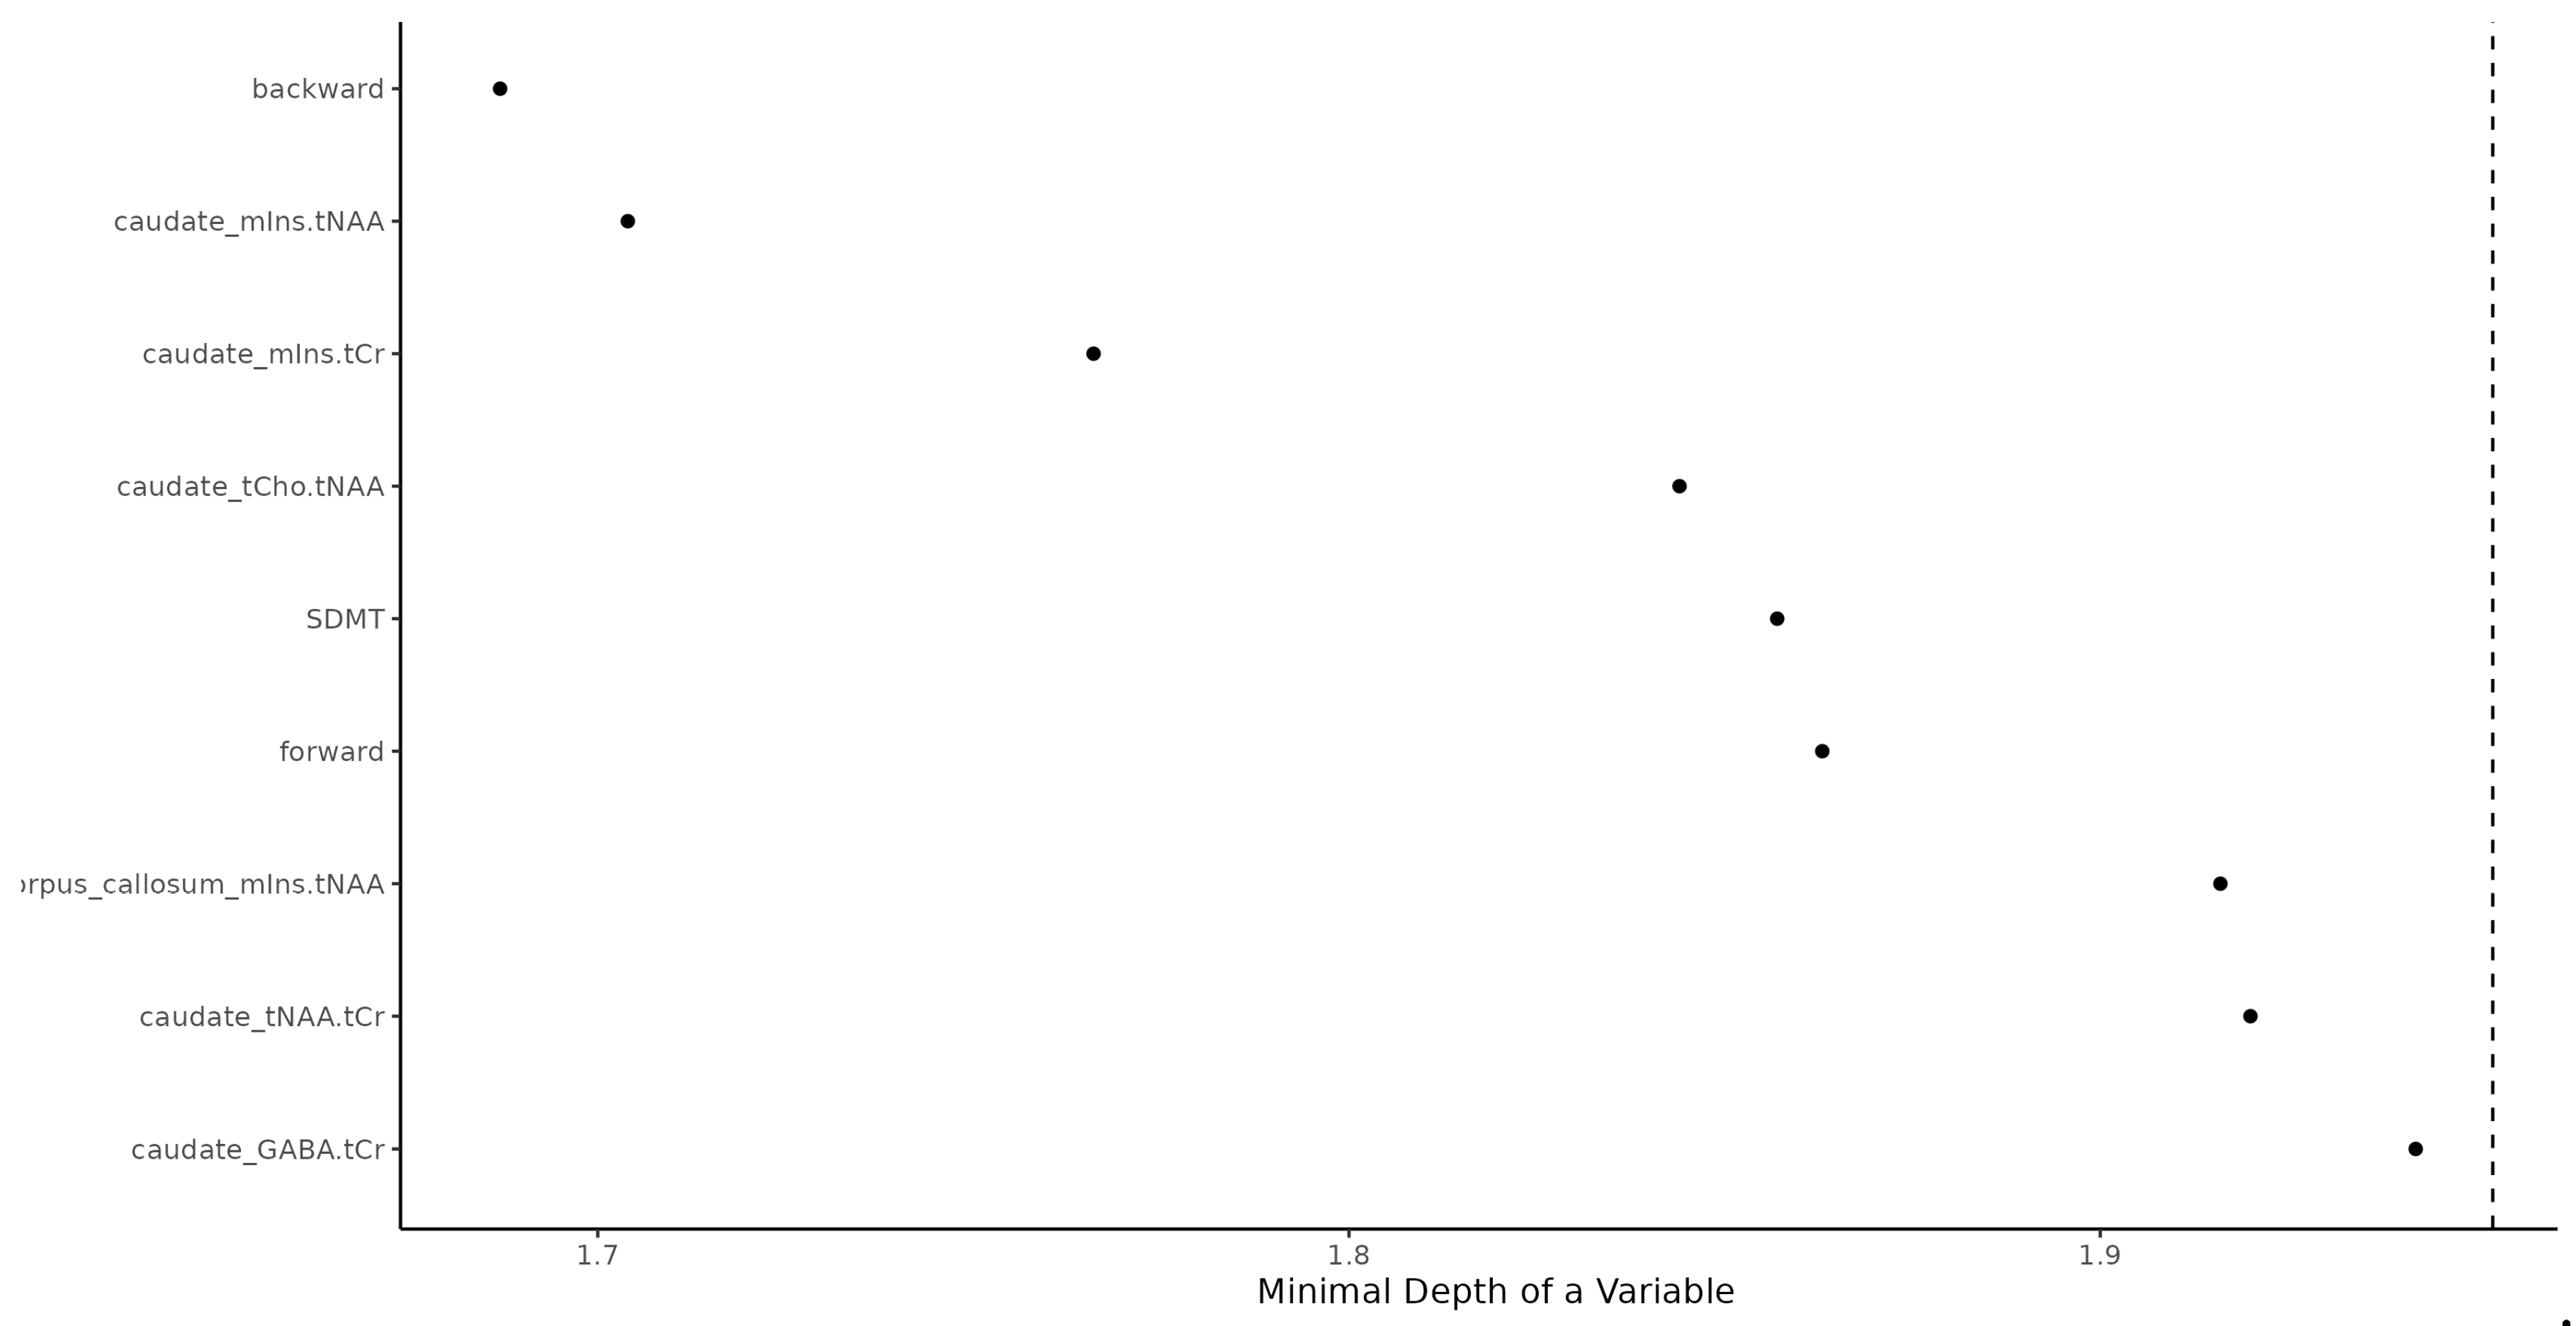
1. DSB series (Fisher exact test pval < 0.001),
2.caudate nucleus mIns/tNAA (Wilcoxon pval < 0.001; increased in MS),
3.caudate nucleus mIns/tCr (Wilcoxon pval < 0.001; increase in MS),
4.caudate nucleus tCho/tNAA (Wilcoxon pval < 0.001; increased in MS),
5.SDMT (Wilcoxon pval < 0.001; decreased in MS),
6.DSF forward series (Fisher exact test pval = 0.001),
7.corpus callosum mIns/tNAA (Wilcoxon pval = 0.001; increased in MS),
8.caudate nucleus tNAA/tCr (Wilcoxon pval = 0.016; decreased in MS),
9.caudate nucleus GABA/tCr (Wilcoxon pval = 0.001; decreased in RR).
Some 20% false positive and 20% false negative rate should be expected when using the RF machine learning algorithm (trained with the above predictors) when used for predicting whether a person is MS or CON. RF results prediction power was high, area under a curve was 86%.
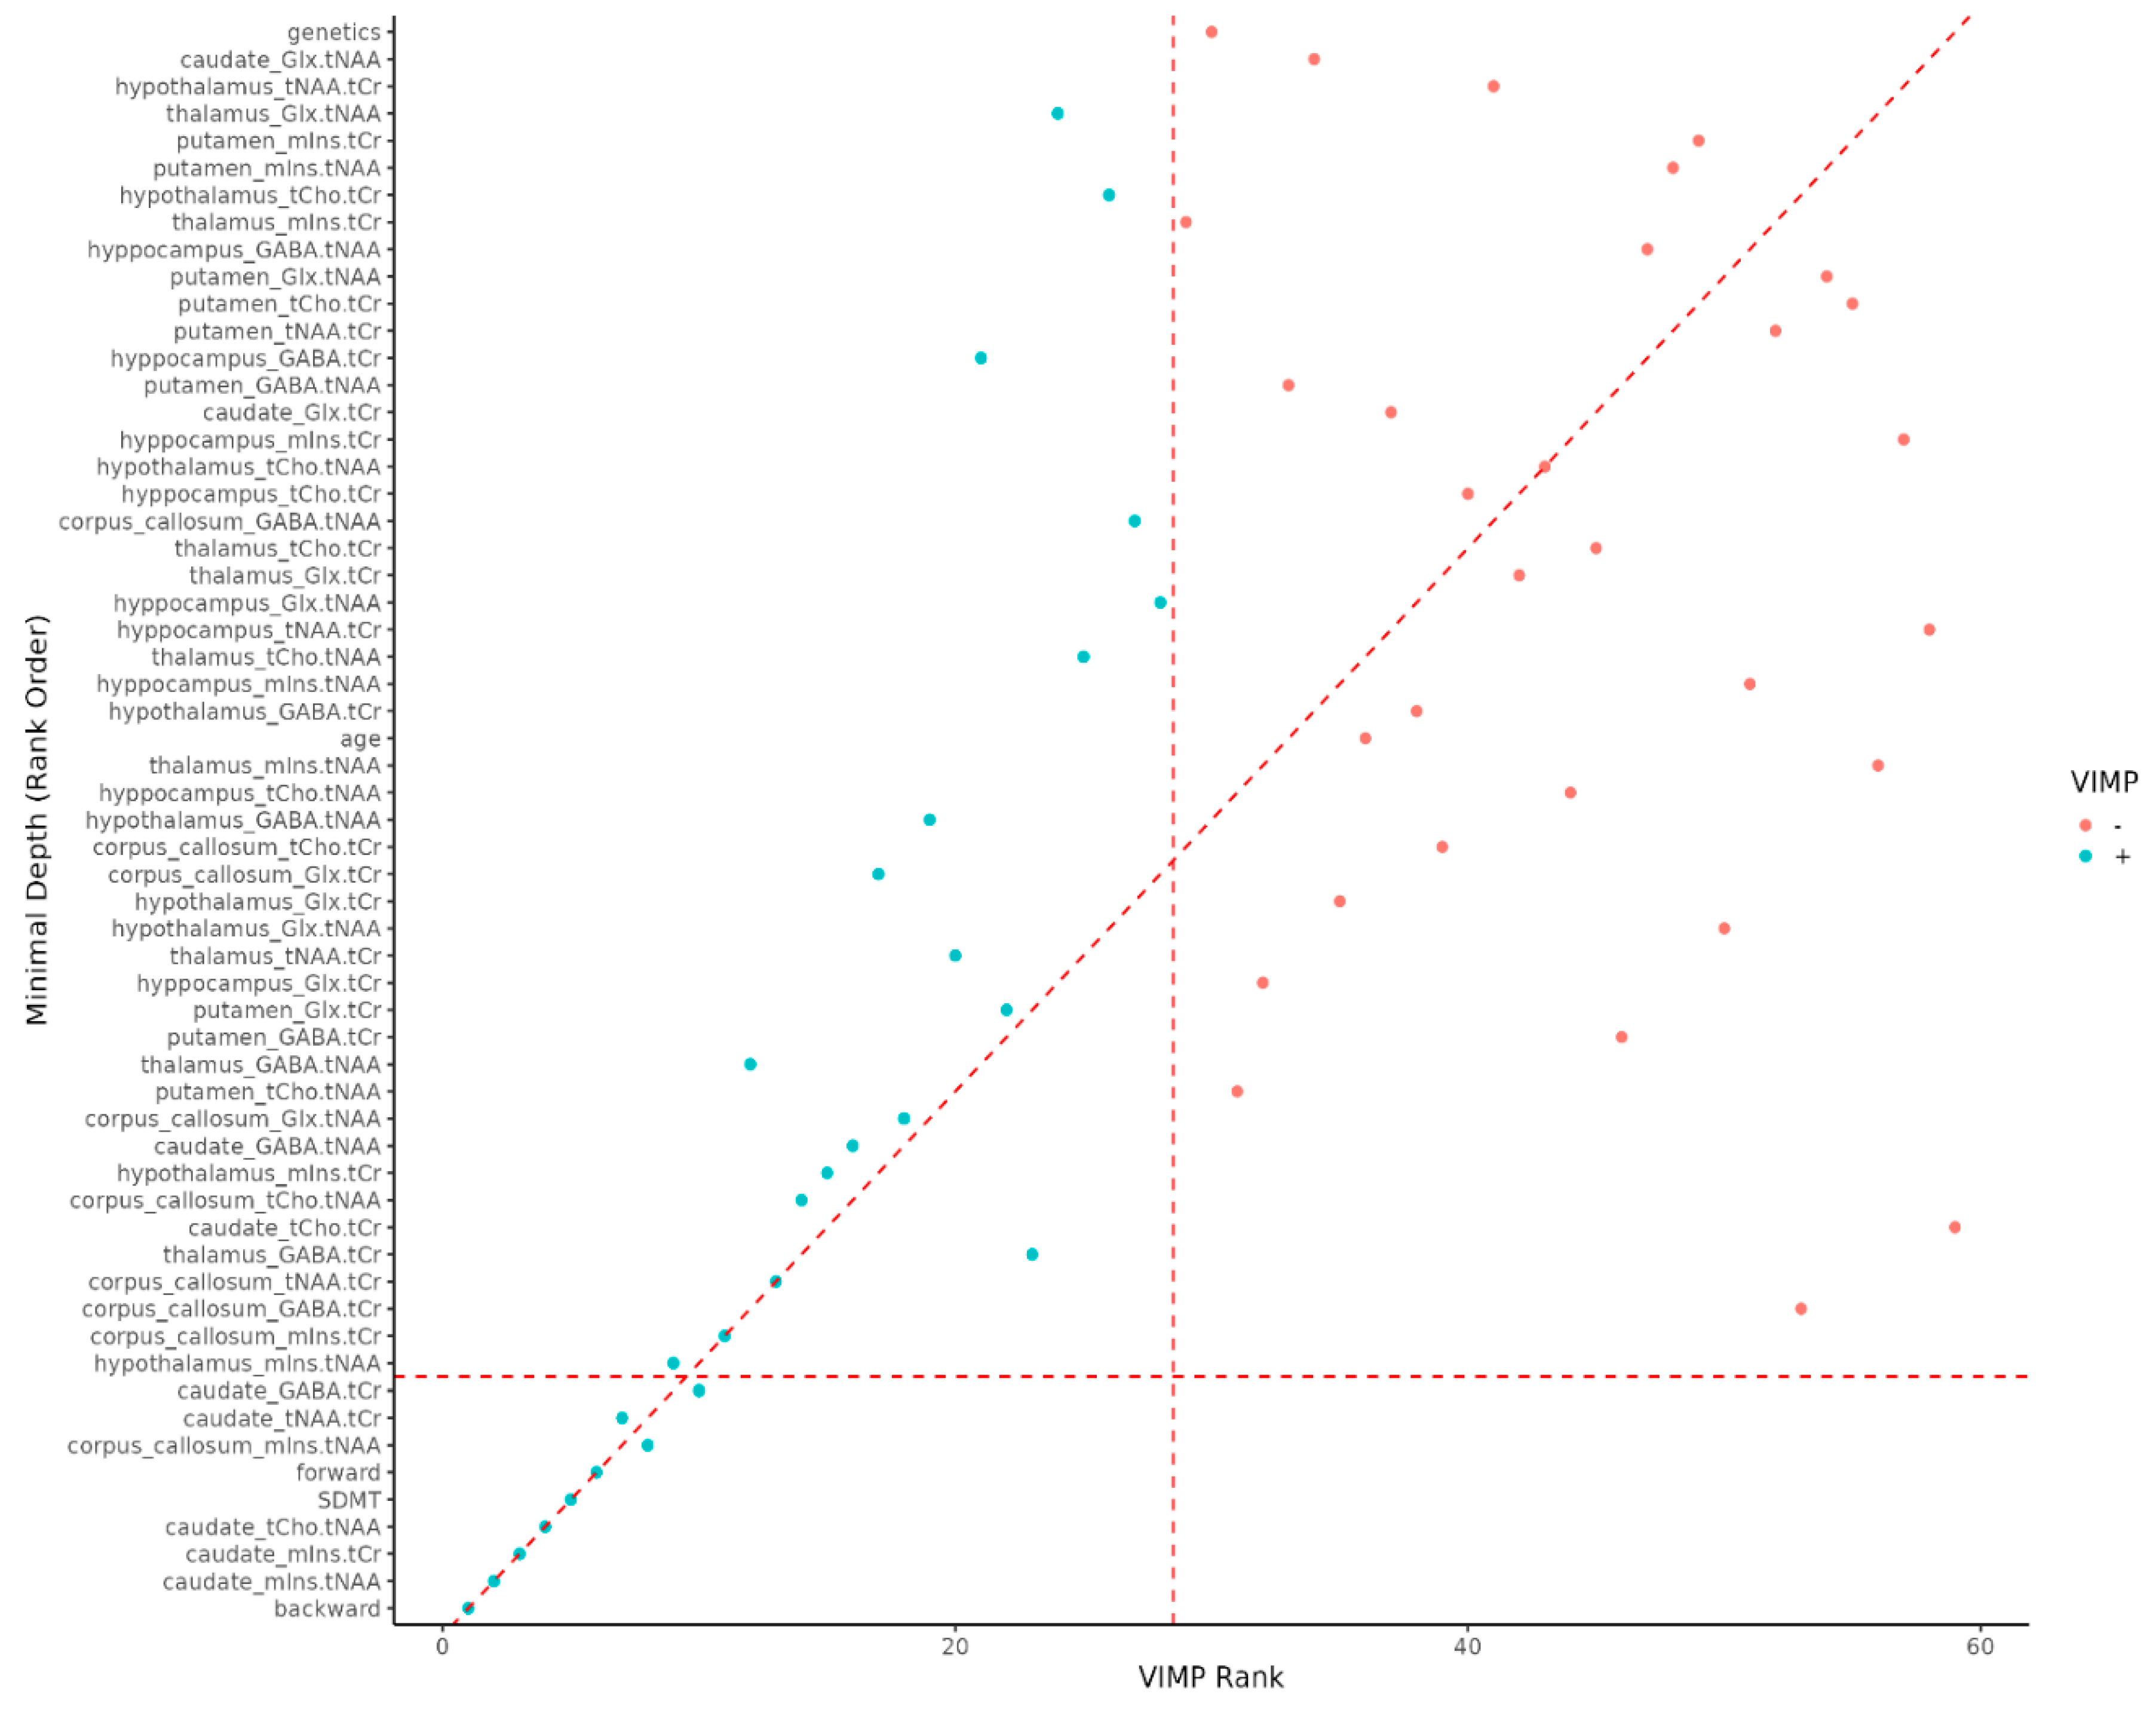
As the DSB and DSF series increases, the relative proportion of MSp decreases. It was hard to find MSp among people with high DSB and DSF series value (Figure 2).
Figure 2.
Variable importance rank. VIMP = variable importance, Backward = Digit Span Backward; caudate_mIns.tNAA = Caudate Nucleus Myoinositol/tN-Acetyl Aspartate; caudate_mIns.tCr = in Caudate Nucleus Myoinositol/t-Creatinin; caudate_tCho.tNAA = Caudate Nucleus tCholin/tN-Acetyl Aspartate; SDMT = Single Digit Modality Test; forward = Digit Span Forward; corpus callosum_mIns.tNAA = Corpus Callosum Cyoinositol/tN-acetyl aspartate; caudate_tNAA.tCr = Caudate Nucleus tN-Acetyl Aspartate/tCreatinin; caudate_GABA.tCr = Caudate Nucleus γ-Aminobutyric acid/tCreatinin.
4. Discusssion
Our results confirm that MS patients performed significantly worse than healthy controls on neurocognitive tests. The SDMT is currently considered the most sensitive instrument for evaluating processing speed in MS. Impairment in processing speed in MS has been shown to underlie deficits in working memory, executive function, and learning [13,14,15]. However, we also found substantial deficits in working memory and attention in MSp, as assessed by Digit Span tests. The Digit Span task assesses attention, encoding, auditory processing, and working memory capacity. Moreover, DSB was found as the most sensitive test to identify MSp. These results support Beatty’s [20] hypothesis that MS patients experience both a generalized difficulty in sustaining concentration and a more specific deficit in attentional resource allocation under multi-task demands.
To explore the neural correlates of cognitive dysfunction, we analyzed brain metabolites linked to performance on different cognitive tests.
4.1. SDMT
In our study, lower SDMT scores in GM of MS patients correlated with thalamic neuronal loss (decreased tNAA/tCr ratio reflects diminished neuronal integrity), hippocampal microglial activation (elevated mIns/tNAA was associated with poorer SDMT performance), and hypothalamic glutamate reduction ( decreased Glx/tCr correlated with lower SDMT scores).
In the corpus callosum (WM), SDMT impairment was associated with increased choline (tCho/tCr), indicating intensified demyelination, decreased GABA (GABA/tCr), suggesting reduced inhibitory neurotransmission.
SDMT performance has been previously linked to volumes of the thalamus, cerebellum, putamen, and occipital cortex [21,22]. Although we did not measure thalamic volume directly, metabolite-based findings (i.e., reduced tNAA/tCr) support the association between thalamic integrity and SDMT scores. In early-stage MS, we previously reported correlations between elevated tCho and mIns ratios and lower SDMT scores [23], suggesting that metabolic alterations may anticipate neuronal loss. Additionally, 7 T MRS studies in older versus younger individuals report higher glia-related metabolites (mIns, tCr, tCho) particularly in hippocampus and thalamus [24]. Our hippocampal mIns/tNAA findings align with those results, supporting a potential role of sustained microglial activity in metabolic dysfunction and neurotoxicity in MS.
Heightened hypothalamic glutamate levels correlated with higher SDMT scores, potentially reflecting increased excitatory neurotransmission to support attention and processing speed via cortico-subcortical pathways.
Higher tCho/tNAA ratios in the corpus callosum corresponded with lower SDMT scores—consistent with increased demyelination and axonal loss [8,25]. Morphometric and diffusion studies have reinforced the role of corpus callosum integrity in cognitive processing speed, including SDMT performance [26]. Moreover, we observed positive correlation between SDMT and GABA levels in the rostral corpus callosum. GABA is a key inhibitory neurotransmitter crucial for maintaining excitatory-inhibitory balance in cortical circuits. Previous GABA-focused MRS studies in MS did not specifically assess the corpus callosum [27,28,29], highlighting the novelty of our findings.
4.2. Digit Span Forward and Digit Span Backward Series
In contrast to SDMT scores, higher Digit Span Forward and Backward scores—indicating better working memory—were positively correlated with increased mIns ratios in the caudate nucleus, suggesting microglial activation. Although this association has not previously been reported in MS, parallel findings in Human Immunodeficiency Virus (HIV) patients show that working memory deficits are linked to elevated glial metabolites, including mIns in the caudate and associated white matter networks [30].
The caudate nucleus plays a vital role in strategic planning, goal-directed behavior, and both visual and verbal working memory via cortico–subcortical circuits [31,32,33,34]. Functional MRI studies show either caudate nucleus or hippocampus activation specifically during spatial working memory tasks [31,32]. Conversely, SDMT performance relies primarily on information processing speed and engages frontoparietal, visual-attention, and cerebellar networks, with minimal basal ganglia involvement [26].
In our cohort, higher DSF scores correlated with increased hippocampal GABA levels. Preclinical and clinical studies indicate that reduced GABAergic inhibition impairs memory and attention [35], and that lower GABA levels in the prefrontal cortex are linked to greater working memory decline under cognitive load [36]. Moreover, reduced hippocampal GABA has been observed in MS patients [27,28], and is associated with cognitive and motor deficits [23,37].
The GABAergic system is critical for synchronizing large neuronal populations. Inhibitory projections, such as those connecting the medial septum, hippocampus, and entorhinal cortex, are crucial for modulating oscillatory activity underlying episodic memory formation [38].
Additionally, both DSF and DSB scores were negatively correlated with hypothalamic tNAA/tCr and positively with tCho/tNAA, indicating neuronal loss and demyelination. Although comparable data are scarce, these findings align with the known role of the hypothalamus in cortico-subcortical pathways that support learning and motivated behavior [39].
Finally, our data extend findings by Llufriu et al. [40], who identified mIns/tNAA in normal-appearing white matter as predictive of disability in MS. We similarly observed correlations of mIns/tCr and tNAA/tCr in the corpus callosum with reduced DSF and DSB scores, reinforcing the use of these metabolite ratios as biomarkers of cognitive decline.
4.3. Limitation of the Study and Suggestion for Further Research
Our study has also several limitations. First, we tested relatively small number of participants. Second, from a technical perspective, employing absolute metabolite quantification rather than ratio-based analysis could provide more precise biochemical measurements. Additionally, advanced 1H-MRS protocols with higher spatial resolution (7T MRI systems) may improve the detection of localized pathological changes in the brain subregions and also brain cortex. fMRI studies could also bring better insights into functional connections between activated brain regions. These methodological refinements could significantly enhance future investigations of structure-function relationships in MS-related cognitive pathology.
5. Conclusions
We can conclude, SDMT but also DSB and DSF are the most reliable and sensitive neuropsychological test, leading to the idea that it may serve as a screen for neuropsychological impairment in MSp in daily bases. Moreover, DSB test was found to be the most sensitive in determining MS-related working memory impairment. Additionally, our data show unique metabolic changes in deep GM and WM of the brain in correlation with cognitive tests. The results confirm a hypothesis about SM as a whole brain disease.
.
Supplementary Materials
The following supporting information can be downloaded at the website of this paper posted on Preprints.org.
Author Contributions
EK, PH, WB contributed to the conception and design of the study; JG, PH, MG, LK contributed to the acquisition and analysis of data; JG, NK, PH, EK contributed to drafting the text or preparing the figures; EK, PH, MG revising it critically for important intellectual content; Authorship contribution statement:. Ján Grossmann: Writing – original draft, Visualization, Methodology, Investigation, Data curation, Conceptualization; Marián Grendár: Writing – review & editing, Supervision, Methodology, Funding acquisition, Conceptualization; Petra Hnilicová: Writing – review & editing, Supervision, Methodology, Funding acquisition, Conceptualization; Wolfgang Bogner: Supervision, Methodology, Funding acquisition, Conceptualization; Nina Kováčiková: Writing – original draft, Visualization, Methodology, Investigation, Data curation; Lucia Kotuľová: Methodology, Investigation, Data curation, Conceptualization; Ema Kantorová: Writing – review & editing, Supervision, Methodology, Funding acquisition, Conceptualization.
Funding
This work was supported by the Grant VEGA of The Ministry of Education, Research, Development and Youth of the Slovak Republic, No: 1/0092/22. The funding sources had no involvement in the study design, the collection, analysis, and interpretation of the data, or in the decision to submit this article for publication. The corresponding author had the final responsibility for the decision to submit for publication.
Institutional Review Board Statement
The study was conducted in accordance with the Declaration of Helsinki, and approved by the Institutional Ethics Committee of Jessenius Faculty of Medicine in Martin, Comenius University Bratislava No. EK1849/2016 and No. EK 27/2021, for studies involving humans.
Informed Consent Statement
Informed consent was obtained from all subjects involved in the study. Written informed consent has been obtained from the patients to publish this paper.
Data Availability Statement
Acknowledgments
Generative AI and AI-assisted technologies was used in the writing process to improve the readability and language of the manuscript.
Conflicts of Interest
Ján Grossmann has nothing to declare; Marián Grendár has nothing to declare; Petra Hnilicová has nothing to declare; Nina Kováčiková has nothing to declare; Lucia Kotuľová has nothing to declare; Wolfgang Bogner has nothing to declare; Ema Kantorová in the last five years, has had travel expenses or registration fees prepaid or reimbursed to present at international conferences.
Abbreviations
| MS: Multiple Sclerosis MSp: Multiple Sclerosis Patients DSF: Digit span forward DSB: Digit span backward SDMT: Single Digit Modality Test 1H-MRS: 1-Proton Magnetic Resonance Spectroscopy CD: cognitive dysfunction WM: white matter GM: gray matter Glx: Glutamine and Glutamate GABA: γ-Amino Butyric Acid CON: healthy volunteers MEGA-edited: Mescher-Garwood -edited tNAA: N-acetyl-aspartate mIns: myoinositol tCho: choline tCr: creatine ATP: adenosine triphosphate EDSS: Expanded Disability Status State IPS: information processing speed WAIS-IV: Wechsler Adult Intelligence Scale CSI: chemical shift imaging fMRI: functional Magnetic Resonance Imaging HIV: Human Immunodeficiency Virus 7 T: 7 Tesla |
References
- Bobholz, J.; Rao, S. . Cognitive dysfunction in multiple sclerosis: A review of recent developments. Curr Opin Neurol 2003, 16, 283–288. [Google Scholar] [CrossRef] [PubMed]
- Thompson, A.J.; Banwell, B.L.; Barkhof; et al. Diagnosis of multiple sclerosis: 2017 revisions of the McDonald criteria. Lancet Neurol 2018, 17, 162–173. [Google Scholar] [CrossRef] [PubMed]
- Sumowski, F.; Benedict, R.; Enzinger, Ch.; et al. Cognition in multiple sclerosis: State of the field and priorities for the future. Neurology 2018, 90, 278–288. [CrossRef]
- Oz, G.; Alger, J.R.; Barker, P.B.; et al. MRS Consensus Group. Clinical proton MR spectroscopy in central nervous system disorders. Radiology 2014, 270, 658–679. [CrossRef] [PubMed] [PubMed Central]
- Abreu, C.M.; Gama, L.; Krasemann, S.; et al. Microglia Increase Inflammatory Responses in iPSC-Derived Human BrainSpheres. Front Microbiol 2018, 9, 2766. [CrossRef] [PubMed] [PubMed Central]
- Cantero-Fortiz,Y; Boada, M. The role of inflammation in neurological disorders: A brief overview of multiple sclerosis, Alzheimer’s, and Parkinson’s disease’. Front Neurol 2024, 15, 1439125. [CrossRef]
- Musella, A.; Gentile, A.; Rizzo, F. R.; et al. Interplay Between Age and Neuroinflammation in Multiple Sclerosis: Effects on Motor and Cognitive Functions. Front Aging Neurosci 2018, 10, 238. [CrossRef]
- Hnilicová, P.; Štrbák, O.; Kolisek, M.; et al. Current Methods of Magnetic Resonance for Noninvasive Assessment of Molecular Aspects of Pathoetiology in Multiple Sclerosis. Int J Mol Sci 2020, 21, 6117. [CrossRef]
- Bogner, W.; Gagoski, B.; Hess, A.T.; et al. 3D GABA imaging with real-time motion correction, shim update and reacquisition of adiabatic spiral MRSI. Neuroimage 2014, 103, 290–302. [CrossRef]
- Hnilicová, P.; Považan, M.; Strasser, B.; et al. Spatial variability and reproducibility of GABA-edited MEGA-LASER 3D-MRSI in the brain at 3 T. NMR. Biomed 2016, 29, 1656–1665. [CrossRef]
- Rae,CD. A guide to the metabolic pathways and function of metabolites observed in human brain 1H magnetic resonance spectra. Neurochem Res 2014, 39, 1–36. [CrossRef]
- Hnilicova, P.; Kantorova, E.; Sutovsky, S.; et al. Imaging Methods Applicable in the Diagnostics of Alzheimer’s Disease, Considering the Involvement of Insulin Resistance. Int J Mol Sci 2023, 24, 3325. [CrossRef]
- Benedict, R.H.; Cookfair, D.; Gavett, R.; et al. Validity of the minimal assessment of cognitive function in multiple sclerosis (MACFIMS). J Int Neuropsychol Soc 2006, 12, 549–558. [CrossRef] [PubMed]
- Benedict, R.H.; DeLuca, J.; Phillips, G.; et al. Multiple Sclerosis Outcome Assessments Consortium. Validity of the Symbol Digit Modalities Test as a cognition performance outcome measure for multiple sclerosis. Mult Scler 2017, 23, 721–733. [CrossRef] [PubMed]
- Cagna, Ch. J.; Dobryakova, E.; Weber, E.; et al. Trait fatigue impacts Symbol Digit Modalities Test (SDMT) performance in multiple sclerosis: The role of working memory. Mult Scler Relat Disord 2025, 96, 106369. [CrossRef]
- Dusankova, J.B.; Kalincik, T.; Havrdova, E.; Benedict, R.H. Cross cultural validation of the Minimal Assessment of Cognitive Function in Multiple Sclerosis (MACFIMS) and the Brief International Cognitive Assessment for Multiple Sclerosis (BICAMS). Clin Neuropsychol 2012, 26, 1186–1200. [CrossRef]
- Papadopoulou, A.; Müller-Lenke, N.; Naegelin, Y.; et al. Contribution of cortical and white matter lesions to cognitive impairment in multiple sclerosis. Mult Scler 2013, 19, 1290–1296. [CrossRef]
- Balsimelli, S.; Mendes, M.F.; Bertolucci, P.H.; Tilbery, C.P. Attention impairment associated with relapsing-remitting multiple sclerosis patients with mild incapacity. Arq Neuropsiquiatr. [CrossRef]
- Baddeley, A. Working memory: Theories, models, and controversies. Annu Rev Psychol 2012, 63, 1–29. [CrossRef]
- Beatty, W.W.; Paul, R.H.; Blanco, C.R.; Hames, K.A.; Wilbanks, S.L. Attention in multiple sclerosis: Correlates of impairment on the WAIS-R Digit Span Test. Appl Neuropsychol. [CrossRef]
- Bisecco, A.; Stamenova, S.; Caiazzo, G.; et al. Attention and processing speed performance in multiple sclerosis is mostly related to thalamic volume. Brain Imaging Behav 2018, 12, 20–28. [CrossRef]
- Bergsland, N.; Zivadinov, R.; Dwyer, M.G.; Weinstock-Guttman, B.; Benedict, R.H. Localized atrophy of the thalamus and slowed cognitive processing speed in MS patients. Mult Scler J 2015, 22, 1327–1336. [CrossRef]
- Kantorová,E; Hnilicová, P.; Bogner, W.; et al. Neurocognitive performance in relapsing-remitting multiple sclerosis patients is associated with metabolic abnormalities of the thalamus but not the hippocampus– GABA-edited 1H MRS study. Neurol Res 2022, 44, 57–64. [CrossRef]
- Lind, A.; Boraxbekk, C.J.; Petersen, E.T.; Paulson, O.B.; Siebner, H.R.; Marsman, A. Regional Myo-Inositol, Creatine, and Choline Levels Are Higher at Older Age and Scale Negatively with Visuospatial Working Memory: A Cross-Sectional Proton MR Spectroscopy Study at 7 Tesla on Normal Cognitive Ageing. J Neurosci 2020, 40, 8149–8159. [CrossRef]
- Swanberg, K.M.; Landheer, K.; Pitt, D.; Juchem, C. Quantifying the Metabolic Signature of Multiple Sclerosis by in vivo Proton Magnetic Resonance Spectroscopy: Current Challenges and Future Outlook in the Translation From Proton Signal to Diagnostic Biomarker. Front Neurol 2019, 10, 1173. [CrossRef]
- Silva, P.H.R.; Spedo, C.T.; Baldassarini, C.R.; et al. Brain functional and effective connectivity underlying the information processing speed assessed by the Symbol Digit Modalities Test. Neuroimage 2019, 184, 761–770. [CrossRef] [PubMed]
- Gao, F.; Yin, X.; Edden, R.A.E.; et al. Altered hippocampal GABA and glutamate levels and uncoupling from functional connectivity in multiple sclerosis. Hippocampus 2018, 28, 813–823. [CrossRef]
- Cao, G.; Edden, R.A.E.; Gao, F.; et al. Reduced GABA levels correlate with cognitive impairment in patients with relapsing-remitting multiple sclerosis. Eur Radiol 2018, 28, 1140–1148. [CrossRef]
- Huiskamp, M.; Yaqub, M. ; van Lingen, M.R. ; et al. Cognitive performance in multiple sclerosis: What is the role of the gamma-aminobutyric acid system? Brain Commun 2023, 3, fcad140. [CrossRef]
- Ernst, T.; Chang, L.; Arnold, S. Increased glial metabolites predict increased working memory network activation in HIV brain injury. Neuroimage 2003, 19, 1686–1693. [CrossRef]
- Postle, B.R.; D’Esposito, M. Dissociation of human caudate nucleus activity in spatial and nonspatial working memory: An event-related fMRI study. Cogn Brain Res 1999, 16, 107–115. [CrossRef]
- Iaria, G.; Petrides, M.; Dagher, A.; Pike, B.; Bohbot, V.D. Cognitive strategies dependent on the hippocampus and caudate nucleus in human navigation: Variability and change with practice. J Neurosci 2003, 23, 5945–5952. [CrossRef]
- Grahn, J.A.; Parkinson, J.A.; Owen, A.M. The Cognitive Functions of the Caudate Nucleus. Prog Neurobiol 2007, 86, 141–155. [CrossRef]
- Monchi, O.; Petrides, M.; Strafella, A.; Worsley, K.; Doyon, J. Functional role of the basal ganglia in the planning and execution of actions. Ann Neurol 2006, 59, 257–264. [CrossRef] [PubMed]
- McGarrity, S.; Mason, R.; Fone, K.C.; Pezze, M.; Bast, T. Hippocampal Neural Disinhibition Causes Attentional and Memory Deficits. Cereb Cortex 2017, 27, 4447–4462. [CrossRef]
- Yong, V.W. Microglia in multiple sclerosis: Protectors turn destroyers. Neuron 2022, 21, 3534–3548. [CrossRef]
- Cawley, N.; Solanky, B.S.; Muhlert, N.; et al. Reduced gamma-aminobutyric acid concentration is associated with physical disability in progressive multiple sclerosis. Brain 2015, 138, 2584–2595. [CrossRef]
- Schmidt-Wilcke, T.; Fuchs, E.; Funke, K.; et al. GABA—From Inhibition to Cognition: Emerging Concepts. Neuroscientist 2017, 24, 501–515. [CrossRef]
- Averbeck, B.B.; Murray, E.A. Hypothalamic Interactions with Large-Scale Neural Circuits Underlying Reinforcement Learning and Motivated Behavior. Trends Neurosci 2020, 43, 681–694. [CrossRef]
- Llufriu, S.; Kornak, J.; Ratiney, H.; et al. Magnetic resonance spectroscopy markers of disease progression in multiple sclerosis. JAMA Neurol 2014, 71, 840–847. [CrossRef]
Disclaimer/Publisher’s Note: The statements, opinions and data contained in all publications are solely those of the individual author(s) and contributor(s) and not of MDPI and/or the editor(s). MDPI and/or the editor(s) disclaim responsibility for any injury to people or property resulting from any ideas, methods, instructions or products referred to in the content. |
© 2025 by the authors. Licensee MDPI, Basel, Switzerland. This article is an open access article distributed under the terms and conditions of the Creative Commons Attribution (CC BY) license (https://creativecommons.org/licenses/by/4.0/).
Copyright: This open access article is published under a Creative Commons CC BY 4.0 license, which permit the free download, distribution, and reuse, provided that the author and preprint are cited in any reuse.


