Submitted:
27 June 2025
Posted:
30 June 2025
You are already at the latest version
Abstract
Optical coherence tomography (OCT) is a leading imaging technique for diagnosing retinal disorders such as age-related macular degeneration and diabetic retinopathy. Its ability to detect structural changes, especially in the optic nerve head, has made it vital for early diagnosis and monitoring. This paper surveys techniques for ocular disease prediction using OCT, focusing on both hand-crafted and deep learning-based feature extractors. While the field has seen rapid growth, a detailed comparative analysis of these methods has been lacking. We address this by reviewing research from the past 20 years, evaluating methods based on accuracy, sensitivity, specificity, and computational cost. Key diseases examined include glaucoma, diabetic retinopathy, cataracts, amblyopia, and macular degeneration. We also assess public OCT datasets widely used in model development. A unique contribution of this paper is the exploration of adversarial attacks targeting OCT-based diagnostic systems and the vulnerabilities of different feature extraction techniques. We propose a practical, robust defense strategy that integrates with existing models and outperforms current solutions. Our findings emphasize the value of combining classical and deep learning methods with strong defenses to enhance the security and reliability of OCT-based diagnostics, and we offer guidance for future research and clinical integration.
Keywords:
Optical Coherence Tomography (OCT)
; Hand-crafted Features
; Deep Learning Models
; Adversarial Attacks
; Robustness in Medical Imaging
; Security in AI Model
; Glaucoma Detection
; Diabetic Retinopathy
; Clinical Decision Support Systems
1. Introduction
1.1. Optical Coherence Tomography
Optical Coherence Tomography (OCT) is a non-invasive imaging technology essential to the field of ophthalmology. Developed in the early 1990s, OCT utilizes light waves to capture high-resolution, cross-sectional images of the retina, the light-sensitive tissue at the back of the eye. This non-invasive technology makes it beneficial because it does not require contact with the eye, making it suitable for sensitive patients or those that need frequent assessments. Furthermore, the widespread availability of OCT has made it a standard tool in clinical settings. This allows clinicians to observe the retina’s layers in detail, enabling them to detect and monitor a range of ocular diseases [1,2,3]. These observations allow for the visualization of changes in the retina that might signify early disease stages. This is significant in diagnosing conditions such as glaucoma, where early detection can prevent the progression of vision loss. Moreover, OCT plays a vital role in monitoring the progression of diseases like age-related macular degeneration, diabetic retinopathy, and other ill conditions of the eye [4,5,6,7].
Age-related Macular Degeneration (AMD) comes in two forms: dry and wet. Dry AMD is the common type and develops when parts of the macula, a small area in the center of the retina that ensures sharp vision, get thinner with age and tiny clumps of protein called drusen grow. This causes a gradual loss of central vision. Wet AMD, also refers to as Choroidal Neovascularization (CNV), is less common but more severe and occurs when new, abnormal blood vessels grow under the retina, which can leak blood and fluids. This leakage can cause rapid damage to the macula, leading to quicker and more serious vision loss than dry AMD. Diabetic retinopathy (DR) occurs in people who have diabetes. High blood sugar levels cause damage to the blood vessels in the retina. These vessels can swell and leak, or they can close, stopping blood from passing through. These changes can cause central and peripheral vision over time. Diabetic macular edema (DME) is a subset of diabetic retinopathy. Similar to DR, high blood sugar levels damage the small blood vessels in the retina, leading them to leak fluid or bleed. When this fluid accumulates in the macula, it causes swelling, and the vision becomes blurred. DME is a major cause of vision loss in people with diabetes [8,9,10,11].
Other ill conditions of the eye include a macular hole (MH) and Central Serous Retinopathy (CSR). A macular hole is a small break in the macula, which leads to blurring and distortion of central vision. These holes can develop from the natural shrinking of the vitreous gel that fills the eye or from injuries or other eye diseases. CSR is a condition where fluid builds up under the retina, creating a detachment that specifically affects the macula, leading to distorted and blurred vision. The condition is often stress-related and is more common in men than women. CSR usually resolves on its own, but severe cases might require treatment to prevent lasting damage to the retina. The OCT images above in Figure 1 display visualizations of the ocular disorders mentioned [18].
Figure 2 presents a pair of fundus and OCT scans, emphasizing the complementary relationship between these two retinal imaging methods. Fundus images provide a wide-field photograph of the retina, which highlights key features like blood vessels and the optic disc. These features are essential for diagnosing diseases such as diabetic retinopathy and glaucoma. The OCT scan (below) offers a detailed cross-sectional view of the retina, which belongs to a specific portion of the fundus image. Together, these images are crucial for an eye health assessment, as the fundus image identifies surface-level abnormalities, while the OCT scan reveals deeper structural issues like retinal thickening or fluid accumulation [12].
Another utility of OCT in clinical settings lies in the ability to provide detailed images, which enables analysis of these images through a process known as feature extraction. Feature extraction involves identifying specific attributes or changes in the OCT images that are relevant for diagnosing eye conditions.
1.2. Feature Extraction Techniques
In OCT image classification for ocular disorders, two main types of methods are used to analyze images: hand-crafted features and deep learning approaches, including Convolutional Neural Networks and Vision Transformers.
Hand-crafted features involve manually designed techniques where specific details of an image are selected based on what is already known about eye diseases. For example, experts might choose to focus on certain patterns or textures in the image that typically indicate a problem. This method relies heavily on the knowledge and experience of specialists to identify which features are important for diagnosis. While it can be very effective when the disease markers are well understood, it’s less flexible and might not handle new or complex situations as well [23,24,25,26,27].
On the other hand, deep learning methods like CNNs and transformers automate the process of finding important features in images. CNNs work by processing images through multiple layers, each designed to recognize different features, from simple edges to more complex shapes. This allows the network to understand the image in a structured way, layer by layer. CNNs are particularly good at handling images where recognizing localized patterns is key to making a diagnosis. Transformers, which were originally designed for processing text, have been adapted to work with images. They look at the entire image at once, rather than piece by piece. This helps them understand the broader context and relationships within the image, which can be beneficial in complex diagnostic scenarios where the overall structure and layout of the image elements are important [38,39,40,41,42,43,44,45,46,47,48,49,50,51,52,53,54,55,56,57,58,59,60,61,62,63,64,65,66,67].
Both CNNs and transformers learn from examples rather than being programmed with specific rules about what to look for. They need a lot of data to learn effectively and can sometimes act like "black boxes," making it hard to understand how they’ve reached their conclusions. The choice between using hand-crafted features or deep learning approaches depends on factors like the availability of data, how decisions are made, and how accurate the results need to be. Understanding these algorithms’ reliance on data brings us to the importance of OCT datasets. These datasets are crucial for training and testing these models, determining their effectiveness and accuracy [65,66,67,68,69,70,71,72,73,74,75,76,77,78,79,80,81,82,83,84,85].
1.3. Other Survey Literature on OCT
Current survey literature on OCT in ocular disorders, such as [1,2,3] primarily concentrates on specific applications of deep learning and computer vision for diagnosing and analyzing retinal diseases. These studies explore topics like automatic segmentation, classification of retinal diseases through OCT images, and the use of deep learning for detecting conditions such as glaucoma and age-related macular degeneration. For example, surveys like [2] and [3] delve into the technical methodologies of image processing and the latest advancements in algorithmic approaches using OCT images. Other existing literatures such as [5,6,9] emphasize the results of applying these advanced computational techniques without discussing the foundational feature extraction methods that still play a crucial role in scenarios where training data is limited or specific diagnostic features. Similarly, [8,10] focus on the methodological aspect of aligning OCT images to enhance the accuracy of longitudinal studies and treatment monitoring. Table 1 compares our survey against others in the area of OCT image classification for ocular disorders.
In contrast, our survey presents a more holistic approach by bridging the gap between deep learning-based techniques and traditional hand-crafted feature extraction methods, a comparison largely absents in previous studies. While prior works such as [4,7,11] have explored deep learning approaches in various capacities, they lack in discussion on the comparative effectiveness of Convolutional Neural Networks (CNNs) and Vision Transformers (ViTs) versus traditional hand-crafted techniques. Moreover, our survey uniquely includes a comprehensive review of multiple OCT datasets, which is crucial for evaluating the generalizability of feature extraction methodologies.
Our survey also provides an extensive discussion on the datasets employed in OCT-based image analysis. The choice of datasets significantly impacts model performance, particularly in clinical settings where the variability in imaging conditions, disease prevalence, and patient demographics can affect the reliability of automated classification models. Many existing surveys rely on a limited set of public datasets, such as [13,14,15,16,17,18,19,20,21,22] datasets, without critically evaluating their applicability to real-world clinical scenarios. In contrast, our work examines the diversity of available datasets, highlighting their strengths and limitations in terms of sample size, and disease coverage. By doing so, we offer insights into how dataset selection influences model bias, generalization capability, and potential deployment in medical diagnostics.
Additionally, our survey does not merely summarize existing methods but critically evaluates their strengths, weaknesses, and applicability under different clinical and computational constraints. Unlike existing studies that primarily focus on retrospective analysis, our work also identifies key gaps in current research and suggests new directions, particularly in areas such as adversarial attacks on OCT image classification and the integration of Large Language Models (LLMs) into ocular disease diagnostics. These aspects have been largely overlooked in previous surveys, making our study a valuable contribution that extends beyond conventional literature reviews.
By addressing the intersection of deep learning and traditional feature extraction, our survey provides a comprehensive and balanced perspective, offering insights into the current capabilities and future directions of OCT image feature extraction technologies. This comparative analysis not only enhances understanding but also guides future research in a way that no other existing survey has attempted, making it a unique and essential reference for researchers in this domain.
- Provides a systematic review of the existing methods of feature extraction from OCT images, categorizing them into hand-crafted and deep learning-based approaches:
i. Evaluates these methods against various performance metrics, accuracy, precision, sensitivity, specificity and F1 score.
ii. Evaluates and highlights the evolution using Hand-Crafted Features to using deep learning techniques like CNNs and Transformers in enhancing feature extraction from OCT images.
- 2.
- Assesses the impact of dataset choice on the performance of feature extraction methods.
- 3.
- Explores the emerging field of adversarial conditions in medical imaging, particularly in OCT, to propose future directions for research that could lead to more robust, accurate, and clinically relevant feature extraction technologies.
This Survey has the following sections. “Review of OCT Datasets” section presents commonly used datasets in OCT classification. “Hand Crafted Feature Extraction Techniques” describes recent feature engineered techniques in OCT Ocular disease classifications. “Deep Learning Approaches” section describes neural network architects for OCT Ocular disorder detections using CNNs and Transformers. “Comparative Analysis” Compare the performance of hand-crafted features, CNNs, and transformers using data from various datasets. “Future Works” discusses the potential of adversarial samples to test and improve the robustness of OCT classification models. “Discussion” analyzes the findings from the comparative and dataset review sections. “Conclusion” recaps the major insights of the paper.
2. Review of OCT Datasets for Ocular Disorder Classification
As the OCT technology has advanced, there’s been a growing need for OCT datasets. These collections of eye images are crucial for training and testing the accuracy of models designed to spot eye problems. These models are used in deep learning to analyze images. Having a variety of high-quality OCT datasets is key to making these models as effective as possible. In this review, we will look at different OCT datasets used for identifying eye diseases. We will go over what makes each dataset unique and how they help improve the technology used in diagnosing eye conditions.
The first dataset, referred to as Dataset 1, includes volumetric scans from 45 patients, divided into three groups: 15 normal patients, 15 with dry Age-related Macular Degeneration (AMD), and 15 with Diabetic Macular Edema (DME). All SD-OCT volumes were collected using Spectralis SD-OCT equipment (Heidelberg Engineering Inc., Heidelberg, Germany) at Duke University, Harvard University, and the University of Michigan [13]. The second dataset, referred to as Dataset 2, comes from the Noor Eye Hospital dataset cited in reference. It includes 148 SD-OCT volumes, of which 48 are Age-related Macular Degeneration (AMD), 50 are Diabetic Macular Edema (DME), and 50 are normal volumes. These were captured using the Heidelberg SD-OCT imaging system at Noor Eye Hospital in Tehran (NEH). Each volume contains between 19 to 61 B-scans, with each B-scan having a resolution of 3.5 micrometers and the overall scan dimensions being 8.9 by 7.4 mm2 [14].
Creating a dataset with classes for Normal, Diabetic Macular Edema (DME), and Age-related Macular Degeneration (AMD) is beneficial because it covers two common and significant causes of vision impairment. Normal images help the model understand what a healthy retina looks like. DME images teach models to recognize the swelling caused by fluid accumulation from damaged blood vessels in diabetes. AMD images show changes in the retina due to aging, including drusen and other abnormalities. Datasets 1 and 2 are effective for general screening tools and simplify the training process by focusing on broader categories of eye health issues.
Dataset 3 was also obtained using the Heidelberg SD-OCT imaging system at Noor Eye Hospital (NEH) and is available on the Mendeley database website as referenced in [15]. It initially included 16,822 OCT images, covering 120 volumes of Normal images, 160 volumes of Drusen, and 161 volumes of CNV (Choroidal Neovascularization). For experiments, 12,641 images are selected, 3,234 CNV, 3,740 Drusen, and 5,667 Normal. The selected images focus only on the most severe case scenarios for each category. This dataset configuration aims on changes related to AMD. Drusen are the early indicators of AMD and separating them into their own class allows for early detection of the disease before it potentially progresses to more severe stages, CNV. This setup is useful for specialists focused on monitoring and treating AMD, allowing for early intervention strategies and careful monitoring of disease progression.
Dataset 4 is a publicly available dataset known as the UCSD Dataset [16]. This dataset contains 108,312 OCT images in the training set and 1,000 images in the test set. Within the training dataset, 37,206 images are CNV, 11,349 images are DME , 8,617 images are Drusen, 51,140 Normal images. A trimmed down version is also employed in some literature. The trimmed down version has the following class-count: 37,455 are CNV, 11,598 are DME, 8,866 are drusens, and 26,565 are normal, with a total of 84,484 OCT images. By expanding the dataset to include CNV, a major feature of wet AMD, adds a layer of specificity. This differentiation is crucial because CNV requires different treatment strategies from other types of AMD. Including CNV as a separate class helps the model to distinguish between the dry and wet forms of AMD alongside recognizing diabetic-related changes and normal conditions.
Dataset 5 has 384 thickness maps of the total retina from individual subjects, where 269 are subjects with intermediate AMDs and 115 subjects are free of any ocular diseases [17]. These volumetric rectangular scans were obtained from Bioptigen, Inc Research Triangle Park, NC, which was approved by the institutional review boards of Devers Eye Institute, Duke Eye, Center, Emory Eye Center, and National Eye Institute. A dataset with only normal and Intermediate AMD OCT images, narrows the focus of the diagnostic tool. It is a simpler dataset that enhances the model’s ability to detect stages of AMD, particularly the intermediate stage which is often difficult to diagnose.
Dataset 6 consists of 24,000 images and is divided equally into eight different categories: AMD, CNV, DME, MH, DR, CSR and one for healthy subjects [18]. This dataset allows for very precise diagnosis and is valuable in specialized care. For example, distinguishing between different types of AMD or recognizing characteristics of less common conditions like CSR can enable more targeted interventions. However, this model is required to learn from a larger volume of data, distinguishing subtle differences between more categories. It demands more sophisticated algorithms and greater processing power. Similar to Dataset 6, Dataset 7 includes 4 classes, which are Normal Macula, Macular edema, macular hole, and AMD [19]. Dataset 7 consists of 326 macular spectral-domain OCT scans collected from 136 subjects, encompassing a total of 193 eyes. The scans have an original resolution of either 200 x 200 x 1024 or 512 x 128 x 1024 in a 6 x 6 x 2 mm volume (width, height, and depth). This dataset was developed by the UPMC Eye Center, Eye and Ear Institute, Ophthalmology and Visual Science Research Center, Department of Ophthalmology. In a comparable dataset, [71], the Eye Center at Renmin Hospital of Wuhan University gathered 4,076 OCT images of DM patients, centered on the fovea, between 2016 and 2022. These images were obtained using an OCT device (Optovue RTVue, Optovue, Fremont, California, USA).
Dataset 8 is developed by the Singapore Eye Research Institute (SERI) were collected using the CIRRUS™ SD-OCT device from Carl Zeiss Meditec, Inc., located in Dublin, CA. This dataset includes 32 OCT volumes, divided into 16 cases of Diabetic Macular Edema (DME) and 16 normal cases. Each volume comprises 128 B-scans, with a resolution of 512 × 1024 pixels. All SD-OCT images were reviewed and assessed by trained graders who classified them as either normal or DME cases based on the evaluation of retinal thickening, hard exudates, intraretinal cystoid space formation, and subretinal fluid. Dataset 9 was obtained using a raster scan protocol with a 2mm scan length, featuring a resolution of 512x1024 pixels. These images were captured with a Cirrus HD-OCT machine (Carl Zeiss Meditec, Inc., Dublin, CA) at Sankara Nethralaya (SN) Eye Hospital in Chennai, India. For each volumetric scan, an experienced clinical optometrist (MKP) selected a fovea-centered image. Dataset 9 comprises 102 images of macular holes (MH), 55 images of age-related macular degeneration (AMD), 107 images of diabetic retinopathy (DR), and 206 normal retinal images.
Another dataset, D10, circular OCT B-scan images, collected using the swept-source OCT device (DRI-OCT, Topcon, Inc., Tokyo, Japan), focus on a 3.4mm diameter circle centered on the optic disc and are available in various sizes. This dataset consisting of 1395 samples (697 glaucoma and 698 non-glaucoma) from 641 participants, involving a total of 1015 eyes, with 135 eyes having follow-up data. Visual field tests and OCT images are provided for all participants. The dataset categorizes samples into Early, Moderate, and Advanced stages, with 447, 140, and 110 samples respectively. OD (right eye) samples include 201 in the Early stage, 82 in the Moderate stage, and 56 in the Advanced stage. OS (left eye) samples include 246 in the Early stage, 58 in the Moderate stage, and 54 in the Advanced stage [22]. Table 2 provides a summary of the information for each dataset.
Having explored the various datasets used in OCT for ocular disease predictions, we now shift our focus to how to effectively analyze this data. This brings us to two main techniques for extracting useful information from the images: hand-crafted features and deep learning.
3. Hand-Crafted Feature Extraction Techniques
This section aims to provide a thorough overview of various hand-crafted feature extraction methods that have been developed to analyze OCT images. We explore how these techniques operate by extracting specific, predefined features from images such as texture, shape, and intensity. These predefined features are known to be indicators of ocular disorders. These features are then used to classify, segment, and analyze OCT data in the context of diagnosing conditions. Specifically, articles that will be reviewed employ techniques such as Local Binary Patterns (LBP) and Dictionary Learning, which have been effective in extracting meaningful features from OCT images.
Local Binary Patterns (LBP) are a technique used to describe the local spatial patterns and texture of an image. In the context of OCT imaging, LBP helps in identifying fine-grained patterns within the retina that may indicate early signs of diseases such as macular degeneration or diabetic retinopathy. The method works by comparing each pixel with its neighbors and encoding these relationships into a binary code, which effectively captures the texture information. The classical Local Binary Patterns (LBP) is a texture image descriptor that emphasizes the center pixel and its neighboring pixels to encode structural texture information within an image. The generalized form of LBP is expressed as follows:
where IC represents the center pixel, Ii represents the adjacent surrounding pixels, f(i) = 2i, i = 0, …, 7 with R representing a region defined by the kernel size. The function s(Ii – IC) assigns a value of 1 if the difference between the surrounding pixel and the center pixel is greater than or equal to zero (T is set to zero); otherwise, it assigns a value of 0. Each kernel is placed over a pixel (IC) and compared to its surrounding neighbors (Ii) using the mentioned function. A binary sequence is generated based on these comparisons, and each sequence is assigned a corresponding to decimal weight of f(i). The following are works developed in the past ten or more years.
A machine learning method has been developed to classify OCT images for three retina-related diseases, macular hole (MH), age-related macular degeneration (AMD), and diabetic retinopathy (DR), and normal (NO) OCT images. This method employs LBP to extract features from the images and utilizes a classifier that operates on the random forests technique to differentiate between the disease states and normal conditions [23]. A low-complexity feature vector connection method, known as slice-sum, has been introduced to reduce the computational load required by the SVM classifier. The detector employs only the LBP and SVM classifier, which helps minimize the hardware resources needed for processing [24]. A method has been developed to extract global descriptors from the 2D feature image for LBP and from the 3D volume OCT image. As a result, the global-LBP mapping technique will extract d feature elements [25].
A method involves a standard classification process that includes initial preprocessing steps to eliminate noise and flatten each B-Scan. It utilizes features like Histogram of Oriented Gradients (HOG) and LBP, which are extracted and then merged to form various feature vectors. These vectors are then input into a linear Support Vector Machines (SVM) Classifier for further analysis [26]. A method local texture descriptor known as Multi-Kernels Wiener Local Binary Patterns (MKW-LBP) for the classification of eye diseases such as Aged Macular Degeneration, Diabetic Macular Edema, and Normal eyes. Optimize the accuracy of this descriptor using classification techniques such as Support Vector Machines (SVMs), Adaboost, and Random Forest. The experimental evaluations demonstrate that MKW-LBP achieves superior diagnostic and recognition performance when compared to recent developments in texture descriptors [27]. Similar methods develop local texture descriptor algorithms, Multi-Size Kernels ξcho-Weighted Median Patterns (MSKξMP) and Alpha mean Local Binary Patterns (AMT-LBP), to avoid speckle noise and classify eye diseases like DME and AMD. The methods also employ Singular Value Decomposition to achieve optimal accuracy with SVM and Random Forest classification techniques [28,29].
A method that presents an automatic detection method that combines discrete wavelet transform (DWT) image decomposition, local binary patterns (LBP) based texture feature extraction, and multi-instance learning (MIL). LBP is chosen for its ability to handle low contrast and low-quality images, minimizing the interference from the image itself on the detection method. DWT image decomposition supplies high-frequency components rich in details for extracting LBP texture features, removing redundant information unnecessary for diagnosing CSCR in the raw image [30]. Other hand-crafted feature extractors are also employed and are discussed below. Another method is a machine learning approach that utilizes global image descriptors derived from a multi-scale spatial pyramid. Local features are dimension-reduced local binary pattern histograms, which encode texture and shape information in retinal OCT images and their edge maps. This representation works at multiple spatial scales and granularities, resulting in robust performance. Two-class support vector machine classifiers to identify the presence of normal macula and three specific pathologies. Additionally, to distinguish sub-types within a pathology, we build a classifier to differentiate full-thickness holes from pseudo-holes within the macular hole category [31].
A two-feature-labeling method for the 3D OCT volume: the slice-chain labeling method and the slice-threshold labeling method. These methods are evaluated using SVM [32]. An approach utilizes retinal features like retinal thickness, individual retinal layer thickness, and volumes of pathologies such as drusen and hyper-reflective intra-retinal spots. The approach automatically extracts ten clinically important retinal features from segmented SD-OCT images for classification. The effectiveness of these features is evaluated using several classification methods, including Random Forest [33]. Another approach, a contrast enhancement-based adaptive denoising is used to eliminate speckle noise. Pixel grouping and iterative elimination, based on typical layer intensities and positions, are used to identify the RPE layer. Randomization techniques, followed by polynomial fitting and drusen removal, are then applied to estimate a baseline. Classification is determined by comparing the drusen height to the baseline [34]. A method for automated detection of retinal diseases in eyes uses Histogram of Oriented Gradients (HOG) descriptors and support vector machines (SVMs) to classify each image within a spectral domain (SD)-OCT volume as either normal, containing dry AMD, or containing DME [35].
Finally, the following last two methods are based on dictionary learning. An approach utilizing HOG features of pyramid images combined with three different dictionary learning methods—Separating the Particularity and the Commonality dictionary learning (COPAR), Fisher Discrimination Dictionary Learning (FDDL), and Low-Rank Shared Dictionary Learning (LRSDL) was investigated to achieve the highest classification accuracy of OCT images [36]. Another approach proposes a general framework for distinguishing normal OCT images from DME and AMD scans using sparse coding and dictionary learning. This includes a preprocessing and alignment technique for the retina to address the shortcomings of previous methods, which struggle to classify datasets with severely distorted retina regions. Additionally, sparse coding and structured preprocessing (SP) are employed, along with an SVM for classification [37]. Table 3 shows results of handcrafted-feature extractor work discussed.
4. Deep Learning Approaches
This section aims to provide a thorough overview of applications of CNNs in OCT image classifications. Various CNN architectures have been explored to enhance the feature extraction and accuracy. Typically, in CNNs the core operation is the convolution applied across multiple layers. The convolution at the l-th layer is mathematically expressed as:
where X(l) is the input feature map from the previous layer (or the raw image if it is the first layer, W(l) is the convolution filter at layer l, b(l) is the bias term at layer l, hij(l) is the output feature map at position (i,j) for layer l. A non-linear activation function, such as ReLU, is applied to the result of the convolution:
where this operation is repeated across multiple convolutional layers, allowing the network to extract more features. After the convolutional layers, pooling layers, reduce the spatial dimensions:
where the pooling window reduces the resolution of the feature map.
Next, augmentation CNNs leverage data augmentation techniques to artificially expand the training dataset, improving model robustness and performance. Standard augmentation techniques include rotation, flipping, and cropping. Image augmentation is often used to create diverse training samples, reduce overfitting, and improve the model’s generalization ability. The papers reviewed will include techniques beyond standard methods. CNNs with specialized augmentation using Generative Adversarial Networks (GANs) aim to augment the training data by generating synthetic but realistic images. This augmentation improves the network’s ability to generalize, especially when the training data is scarce or imbalanced. GAN-based augmentation can be formulated as:
where G(z) is the generator network of the GAN, which produces synthetic images from a noise vector z and Xaug is the generated augmented image. By training CNN on both real and GAN-generated images, the model becomes more robust to variations and improves generalization.
Additionally, regular CNNs enhanced with residual units and inception units have shown significant promise. Residual units help in mitigating the vanishing gradient problem, allowing for deeper networks that can learn more complex features. Residual Units in CNNs help to mitigate the vanishing gradient problem, allowing the network to train deeper architectures. The residual block is defined as:
where represents the transformations (convolutions, activations) applied to the input X(l) at layer l. X(l) is added directly to the output, forming a shortcut connection. Inception units, which consist of multiple convolutions with different kernel sizes, enable the network to capture hierarchy of features by processing the input in parallel. Together, these diverse CNN architectures form the backbone of state-of-the-art deep learning approaches for ocular disease prediction from OCT images. Inception Units process the input using multiple convolution filters with different sizes, enabling the network to capture features at multiple scales in parallel. The inception unit can be formulated as:
where f1×1(X), f3×3(X), and f3×3(X) represents convolutions with different filter sizes, Pooling X is an additional pooling operation that captures larger-scale information. By combining different filter sizes, the inception unit allows the network to capture both fine and coarse details from the input image.
Segmentation-based Attention CNNs incorporates attention mechanisms that focus on the most relevant regions of the OCT images, thus improving the detection of subtle pathological features. This approach often combines segmentation tasks with the primary classification task, ensuring that the network pays attention to critical areas while learning. The attention mechanism generates an attention map A(X), which weighs different regions of the feature map based on their relevance:
where σ is the generic function, typically is a sigmoid, that generates the attention weights, Wa is the attention filter, * denotes convolution. The attention map is applied to the feature map to emphasize the most relevant areas:
where Xatt is the attention-weighted feature map that focuses the network’s attention on critical regions of the OCT image.
Ensemble CNNs are another prominent strategy, where multiple CNN models are trained independently, and their predictions are combined to produce a final output. Let fi(X) represent the prediction of the i-th CNN in the ensemble. The final prediction y from the ensemble is computed as an average of all individual model outputs:
where N is the number of CNN models in the ensemble, fi(X) is the prediction from the i-th model. This method employs the strengths of different models, leading to improved predictive performance and reduced variance.
Multi-scale CNNs, on the other hand, process OCT images at various scales, capturing features at different levels of detail. This multi-resolution approach enables the network to identify both coarse and fine-grained features, which is particularly useful in detecting a wide range of ocular diseases. The multi-scale processing is defined as:
where fR1(X), fR2(X), … , fRK(X) represent the convolutions applied to the input image X at lower (R1) to higher (RK) resolutions. The outputs from different scales are then combined, allowing the network to analyze features across multiple resolutions in parallel. Figure 3 shows the different types of CNN structures discussed above.
4.1. CNNs
This section explores standard and advanced CNN techniques, including residual and inception units, which improve feature learning and network depth, forming the methods for ocular disease prediction from OCT images.
A hybrid Retinal Fine-Tuned Convolutional Neural Network (R-FTCNN) has been proposed for detecting retinal diseases such as diabetic macular edema, drusen, and choroidal neovascularization from OCT images. This study employs the R-FTCNN architecture alongside principal component analysis (PCA) as part of its methodology. PCA was used to transform the fully connected layers of the R-FTCNN into principal components, and the Softmax function was applied to these principal components to create a new classification model [38]. An approach introduces a deep learning framework that leverages dual guidance between two tasks. First, a Complementary Mask Guided Convolutional Neural Network (CM-CNN) is employed to classify OCT B-scans, distinguishing between normal scans and those with drusen or CNV. This classification is guided by masks generated from an auxiliary segmentation task. Second, a Class Activation Map Guided UNet (CAM-UNet) for segmenting drusen and CNV lesions, utilizing the CAM output from the CM-CNN [39]. Another work presents a framework for the automated detection of retinal disorders utilizing transfer learning. The model operates in three phases: deep fused and multilevel feature extraction using 18 pre-trained networks and tent maximal pooling, feature selection with ReliefF, and classification with an optimized classifier [40].
A technique that involves removing the final layers from the pre-trained Inception V3 model and utilizing the remaining portion as a fixed feature extractor. The extracted features are then fed into a CNN designed to learn the shifts in the feature space [41]. An automated CNN architecture, AOCT-Net, has been proposed for a multiclass classification system based on OCT. This system, incorporating a softmax classifier, is designed to classify five types of retinal diseases AMD, CNV, DME, drusen, and normal cases [42]. A method, iterative fusion convolutional neural network (IFCNN), adopts an iterative fusion strategy, which combines features from the current convolutional layer with those from all previous layers in the network. This approach enables the joint utilization of features from different convolutional layers, leading to accurate classification of OCT images [43]. A work introduced OCT Deep Net2 for classifying optical coherence tomography images. This study performed a four-class disease classification, with OCT Deep Net2 being an extension of OCT Deep Net1, expanding from 30 to 50 layers. OCT Deep Net2 is a dense architecture featuring three recurrent modules [44]. A model, based on a capsule network, is designed to enhance classification accuracy. Capsules, which are groups of neurons representing different properties of the same object, use vectors to learn positional relations between features in images. This reportedly offers higher generalization performance than traditional CNNs for small affine transformations of training data, thus requiring far fewer training samples [45].
A dictionary learning method to reduce image size, leveraging DAISY descriptors and Improved Fisher kernels to extract OCT image features. Similar to traditional downsampling methods, the approach functions as a form of intelligent downsampling, effectively reducing image size while preserving essential information [46]. A work introduced two methods for detecting retinal abnormalities from OCT images. The first method, termed S-DDL, offers a solution to the vanishing gradient problem in DDL and reduces training time. The second method utilizes the Wavelet Scattering Transform (WST), which incorporates predefined filters in network layers. The two methods are compared to each other [47]. Another method proposed a weakly supervised deep learning framework with uncertainty estimation to classify macula-related diseases from OCT images, utilizing only volume-level labels. First, a convolutional neural network (CNN) based instance-level classifier is iteratively refined through our proposed uncertainty-driven deep multiple instance learning (MIL) scheme. Then, a classifier is able to detect suspicious abnormal instances and create deep embeddings for those instances. Second, a recurrent neural network (RNN) uses features from those instances to make final predictions [48]. Another work proposed a two-stage approach for retinal OCT volume classification, which consists of: (1) volumetric feature extraction and (2) diagnostic classification. This approach utilizes a wavelet-based CNN (WCNN) feature learning subsystem in the feature extraction stage. The WCNN includes a spatial-frequency decomposition layer (SFD-layer) in the first hidden layer, which serves as feature learning in retinal OCT B-scans [49]. Table 4 presents the performance metrics for each of the CNN methods using the datasets discussed in this section.
This section reviews papers on Segmentation-based Attention CNNs, which enhance OCT image analysis by using attention mechanisms to focus on critical regions, improving subtle pathological feature detection and integrating segmentation with classification tasks for better learning.
A study introduced a method called lesion-aware CNN (LACNN) approach for retinal OCT image classification, utilizing retinal lesions within OCT images to guide the CNN for more accurate classification. The LACNN focuses on local lesion-related regions in the OCT images using a lesion detection network to create a soft attention map from the entire OCT image [50]. An approach integrates a dual-attention mechanism at multiple levels of a pre-trained deep convolutional neural network (CNN). It enhances focused learning by incorporating both multi-level feature-based attention, which targets salient coarse features, and a self-attention mechanism, which focuses on higher entropy regions of the finer features [51]. Another method proposes a deep architecture based on a perturbed composite attention mechanism, incorporating two attention modules: Multilevel Perturbed Spatial Attention (MPSA) and Multidimension Attention (MDA) for macular optical coherence tomography (OCT) image classification. MPSA enhances the salient regions of input images and the features from intermediate network layers by adding positive perturbations to the attention layers. Conversely, MDA encodes the normalized interdependency of spatial information across various channels of the extracted feature maps. This perturbed composite attention enables architecture to extract diagnostic features at different levels of feature representation [52].
A one-stage attention-based method was proposed for retinal OCT image classification and segmentation using bounding box level supervision. Specifically, the classification network generates a heatmap using Gradient-weighted Class Activation Mapping and incorporates the proposed attention block. Transformation consistency is employed to ensure that the predicted heatmap remains consistent for the same input after image transformation [53]. A study presents an efficient Global Attention Block (GAB) for feed-forward convolutional neural networks (CNNs). The GAB creates an attention map across three dimensions for any intermediate feature map and then computes adaptive feature weights by multiplying the attention map with the input feature map. This GAB can be integrated into any CNNs [54]. Another work proposes a B-scan attentive convolutional neural network (BACNN). BACNN is a CNN-based feature extraction module that is employed to extract spatial feature representations from the B-scans. Subsequently, a self-attention module aggregates these features according to their clinical relevance, resulting in a discriminative high-level feature vector for reliable diagnosis [55].
4.2. CNN with Attention
This section reviews papers on Segmentation-based Attention CNNs, which enhance OCT image analysis by using attention mechanisms to focus on critical regions, improving subtle pathological feature detection and integrating segmentation with classification tasks for better learning.
A study introduced a method called lesion-aware CNN (LACNN) approach for retinal OCT image classification, utilizing retinal lesions within OCT images to guide the CNN for more accurate classification. The LACNN focuses on local lesion-related regions in the OCT images using a lesion detection network to create a soft attention map from the entire OCT image [50]. An approach integrates a dual-attention mechanism at multiple levels of a pre-trained deep convolutional neural network (CNN). It enhances focused learning by incorporating both multi-level feature-based attention, which targets salient coarse features, and a self-attention mechanism, which focuses on higher entropy regions of the finer features [51]. Another method proposes a deep architecture based on a perturbed composite attention mechanism, incorporating two attention modules: Multilevel Perturbed Spatial Attention (MPSA) and Multidimension Attention (MDA) for macular optical coherence tomography (OCT) image classification. MPSA enhances the salient regions of input images and the features from intermediate network layers by adding positive perturbations to the attention layers. Conversely, MDA encodes the normalized interdependency of spatial information across various channels of the extracted feature maps. This perturbed composite attention enables architecture to extract diagnostic features at different levels of feature representation [52].
A one-stage attention-based method was proposed for retinal OCT image classification and segmentation using bounding box level supervision. Specifically, the classification network generates a heatmap using Gradient-weighted Class Activation Mapping and incorporates the proposed attention block. Transformation consistency is employed to ensure that the predicted heatmap remains consistent for the same input after image transformation [53]. A study presents an efficient Global Attention Block (GAB) for feed-forward convolutional neural networks (CNNs). The GAB creates an attention map across three dimensions for any intermediate feature map and then computes adaptive feature weights by multiplying the attention map with the input feature map. This GAB can be integrated into any CNNs [54]. Another work proposes a B-scan attentive convolutional neural network (BACNN). BACNN is a CNN-based feature extraction module that is employed to extract spatial feature representations from the B-scans. Subsequently, a self-attention module aggregates these features according to their clinical relevance, resulting in a discriminative high-level feature vector for reliable diagnosis [55].
4.3. CNN Ensembles and Multiscale
This section reviews papers on Ensemble CNNs and Multiscale approaches. Ensemble CNNs involve independently training multiple CNN models and combining their predictions to produce a final output. Multiscale approaches process OCT images at various scales, capturing features at different levels of detail.
An approach proposes a 6G-enabled IoMT method that minimizes human involvement in medical facilities while delivering rapid diagnostic results. This method utilizes transfer learning to extract features from medical images and is enhanced by feature selection by employing operators from the hunger games search [56]. Another work proposes a framework that leverages deep ensemble learning, wherein the input fundus and OCT scans are processed through a deep CNN. The deep CNN first recognizes and processes the scans, which are then fed into a second layer of the CNN model to extract essential feature descriptors from both images. These extracted descriptors are concatenated and passed to a supervised hybrid classifier such as support vector machines, and naïve Bayes models. These classifiers are combined to achieve accurate classification [57]. Another approach involves combining features from various resolutions, leading to the next discussion, multi-scale CNNs.
A method of employing a multi-scale deep feature fusion (MDFF) based classification approach using CNNs for reliable diagnosis. The MDFF technique captures inter-scale variations in the images, providing the classifier with discriminative information [58]. A proposed architecture is a multiscale and multipath CNN comprising six convolutional layers. The multiscale convolution layer enables the network to generate local structures capturing both sparse local and detailed global structures [59]. Another paper introduces multiscale (CNN) architecture for the accurate diagnosis of AMD. The proposed architecture consists of a multiscale CNN with seven convolutional layers designed to classify images as either AMD or normal. The multiscale convolution layer allows for the generation of numerous local structures with various filter sizes [60]. Finally, a method proposes a novel multi-scale CNN with a feature pyramid network (FPN). The model leverages multi-scale receptive fields to enhance the accurate detection of retinal pathologies of varying scales in OCT images [61]. Due to the advantages of utilizing both ensemble and multi-scaling techniques, the following papers implement a combination of these approaches.
A method proposes a multi-stage classification network based on a multi-scale (pyramidal) feature ensemble architecture. Initially, a scale-adaptive neural network generates multi-scale inputs for feature extraction and ensemble learning. Larger input sizes capture more global information, while smaller input sizes focus on local details. Subsequently, a feature pyramidal architecture is designed to extract multi-scale features, utilizing DenseNet as the backbone [62]. A similar approach presents a system based on a multi-scale convolutional mixture of expert (MCME) ensemble model. The proposed MCME modular model employs a new cost function for discriminative learning of image features by applying CNNs on multiple scales. MCME maximizes the likelihood function of the training data set and ground truth by using a Gaussian mixture model [63]. Finally, an approach proposed a Deep Multi-scale Fusion CNN (DMF-CNN) that encodes multi-scale disease characteristics. Specifically, multiple CNNs with different receptive fields are utilized to obtain scale-specific feature representations from the OCT images. These representations are then fused to extract cross-scale discriminative features for classification. Additionally, a joint multi-loss optimization strategy is employed to collectively learn scale-specific and cross-scale complementary information during training [64]. Table 5 presents the performance metrics for each of the specialized CNN methods discussed above.
4.4. CNN Augmentations
In this section, we review papers on CNN classification, focusing on how specialized augmentation enhances the model’s generalization by generating diverse training samples. A method proposes a surrogate-assisted classification method for automatically classifying retinal OCT images using convolutional neural networks (CNNs). The process involves image denoising, followed by thresholding and morphological dilation to extract masks, which are used to generate surrogate images for training the CNN model. The final prediction for a test image is determined by averaging the outputs from the CNN model on these surrogate images [65]. Another approach developed a semi-supervised classifier based on a GAN for automated diagnosis using limited labeled data. This framework includes a generator and a discriminator, where adversarial learning between the two helps creates a generalizable classifier capable of predicting progressive retinal diseases such as age-related macular degeneration and diabetic macular edema [66]. A work introduces an unsupervised framework using a GAN to achieve fast and reliable super resolution. Adversarial learning with cycle consistency and identity mapping priors ensures the preservation of spatial correlation, color, and texture details in the generated HR images, which are then used for classification tasks [67].
4.5. Transformers
While CNNs and their variations have significantly advanced image processing, transformers have elevated them to new heights. Vision Transformers (ViTs), derived from the transformer architecture in Natural Language Processing (NLP), achieve outstanding benchmark results on ImageNet datasets, representing a significant leap forward in computer vision.
In a standard ViT architecture, the input image is first divided into fixed-size patches, which are then flattened and linearly projected into embeddings. Let represent an input image of height H, width W, and C channels. The image is split into patches of size P × P, resulting in N = H ⋅ W / P2, patches, where each patch is a vector of . These patches are linearly embedded using:
where is the learnable embedding matrix, and represents the patch embeddings of dimension D. Next, a positional encoding is added to retain spatial information:
where is the positional encoding matrix. The sequence of patch embeddings is then fed into a standard transformer encoder, consisting of multiple layers of multi-head self-attention (MHSA) and feedforward networks (FFN). For each layer l, the self-attention mechanism is computed as:
, , and are the query, key, and value matrices, respectively, and Dk is the dimensionality of the key. The output of the self-attention mechanism is passed through a feedforward network:
After the final transformer layer, the class token (a learnable embedding added to the input sequence) is extracted and passed to a classifier for the final prediction. The following are reviews of papers in the application of Transformers to OCT images for predicting eye disorders.
An approach hybrid ConvNet-Transformer network (HCTNet) begins with a low-level feature extraction module, utilizing a residual dense block to generate features that facilitate network training. Following this, two parallel branches, one using a Transformer and the other a ConvNet are designed to capture the global and local contexts of the OCT images. Finally, a feature fusion module with an adaptive reweighting mechanism is employed to combine these global and local features for accurate OCT image categorization [68]. A method introduces an interpretable Swin-Poly ViT network for automated retinal OCT image classification. By shifting the window partition, the Swin-Poly Transformer establishes connections between adjacent nonoverlapping windows from the previous layer, allowing it to flexibly model multi-scale features. Additionally, the Swin-Poly Transformer adjusts the significance of polynomial bases to refine cross-entropy, enhancing the accuracy of retinal OCT image classification [69]. A study proposes Focused Attention, which uses iterative conditional patch resampling to generate interpretable predictions via high-resolution attribution maps, addressing the low-resolution issue of existing Transformer attribution methods. A survey involving four retinal specialists validated both the superior interpretability of Vision Transformers compared to CNN attribution maps and the relevance of Focused Attention as a lesion detector [70]. A method utilizing Vision Transformer can more effectively capture global information through its self-attention mechanism and exhibits less bias towards local texture features. The classifier is redesigned using logits eights and the loss function as the logit cross-entropy function with L2 norm [71].
A paper introduces a technique called the model-based transformer (MBT). This technique leverages pre-trained models, specifically the ViT and Swin Transformer for OCT image classification, and the Multiscale ViT for OCT video classification. The proposed method represents OCT data using an approximate sparse representation technique, then estimates the optimal features for classification [72]. Another paper introduces a framework called the Structure-Oriented Transformer (SoT) designed to enhance the relationship modeling between lesions and the retina regions. A model-oriented filter highlights the entire retina structure and guide relationship construction. Then employ a pre-trained ViT to model the relationships among all feature patches through transfer learning. Additionally, to optimize the use of all output tokens, a vote classifier is employed for obtaining final grading results [73]. Similarly, another approach proposes an OCT Multihead Self-Attention (OMHSA) block to process OCT image information using a hybrid CNN-ViT approach. OMHSA incorporates local information extraction into the self-attention calculation and adds local information to the transformer model. A neural network architecture, named OCTFormer, is employed by repeatedly stacking convolutional layers and OMHSA blocks at each stage [74]. Another study introduces a hybrid SqueezeNet-Vision Transformer (SViT) model, which leverages the strengths of both SqueezeNet and Vision Transformer (ViT). This model captures both local and global features of OCT images, enabling more accurate classification while maintaining lower computational complexity [75].
An article that proposes a Deep Relation Transformer (DRT) for glaucoma diagnosis by combining OCT and Vision Field (VF) information. This model introduces a deep reasoning mechanism to explore implicit pairwise relations between OCT and VF data both globally and regionally. Also, three successive modules are developed to extract and collect information for glaucoma diagnosis: the Global Relation Module, the Guided Regional Relation Module, and the Interaction Transformer Module [22]. A fusion model called ‘Conv-ViT’ employs transfer learning-based CNN models, such as Inception-V3 and ResNet-50, to process texture information by calculating the correlation of nearby pixels. Additionally, a vision transformer model is integrated to process shape-based features by determining the correlation between long-distance pixels [76]. Another article proposes a ViT-based cross-modal multi-contrast network for integrating color fundus photographs (CFP) and optical coherence tomography (OCT) images. The approach employs multi-contrast learning to extract features from cross-modal data for diagnosis. Subsequently, a channel fusion head captures the semantically shared information across different modalities and the similarity features among patients within the same category [77].
Another set of architects involves the following. An approach proposes a deep learning model based on the Swin Transformer V2 to diagnose fundus diseases swiftly and accurately. This method leverages the calculation of self-attention within local windows to reduce computational complexity and enhance classification efficiency. Additionally, the PolyLoss function was introduced to further boost the model’s accuracy [78]. A method called lesion-localization convolution transformer (LLCT) uses customized feature maps generated by a convolutional neural network (CNN) as the input sequence for a self-attention network. This design leverages CNN’s ability to extract image features and the transformer’s capacity to consider global context and dynamic attention. Part of the model undergoes backpropagation to calculate the gradient as a weight parameter, which is then multiplied and summed with the global features generated during the forward propagation process to accurately locate the lesion [79]. An proposed a stitching approach to find an optimal model by combining two MedViT family models. This method, known as stitchable neural networks, is an efficient architecture search algorithm. It creates a candidate model in the search space by inserting a linear layer between each pair of stitchable layers, with each layer in the pair being selected from one of the input models [80]. Finally in another study, a deep learning framework that utilizes the diagnostic potential of 3D OCT imaging for automated glaucoma detection. The framework integrates a pre-trained Vision Transformer on retinal data for slice-wise feature extraction and a bidirectional Gated Recurrent Unit (GRU) to capture inter-slice spatial dependencies. This dual-component approach allows for an analysis of both local details and global structural integrity [81]. Table 6 presents the performance metrics for each of the transformer methods discussed above.
The following are short works presented at conferences which are slight modification to ViT. A work proposed a CAD method using a base vision transformer to analyze OCT images and distinguish between AMD, DME, and normal eyes [82]. An approach aimed to develop a deep learning algorithm to distinguish between drusen and the double-layer sign (DLS) based on cross-sectional structural OCT B-scans, using a Vision Transformer (ViT) model trained on eyes images [83]. Another conference proposes an end-to-end Transformer-based framework designed to efficiently classify volumetric data of varying lengths. By randomizing the input volume-wise resolution (number of slices) during training, we enhance the learnable positional embedding’s ability to adapt to each volume slice [84]. Finally, another ViT is proposed using a symmetrical cross-entropy loss function can minimize the effect of noise on the training set and prevent overfitting [85].
5. Comparative Analysis
In this section, we discuss the performances of hand-crafted features, CNNs, and Transformer models in predicting ocular disorders using OCT data across a series of well-established datasets. Figure 4 presents an overview of various techniques discussed with their corresponding classification accuracies. Focusing first on Dataset D4, which is crucial for distinguishing between the dry and wet forms of Age-related Macular Degeneration (AMD) and recognizing diabetic-related changes and normal conditions, we observe a range of techniques with varying effectiveness. For example, the Multi-contrast Network achieves a high accuracy of 99.75%, indicating its robustness in handling the complexities of D4. Similarly, models like HCTNet and Conv-ViT also perform well, with accuracies of 91.56% and 94.46%, respectively. These high accuracies suggest that these techniques are well-suited for applications requiring precise differentiation between similar conditions, such as distinguishing dry AMD from wet AMD, which is critical for appropriate treatment planning.
In the context of D2 and D5, which cater to broader screening processes and more specialized monitoring for AMD, several techniques stand out. For instance, the LBP Slice + Sum & SVM technique applied to D5 achieves an accuracy of 87.3%, which is particularly useful for detecting intermediate stages of AMD which is a challenging task for many models. D2, which focuses on general screening, sees strong performances from CNN-based methods such as MPSA (99.62%) and D2FPN-DenseNet (90.9%). These techniques are valuable in clinical settings where quick and reliable screening is essential for early intervention. On the other hand, D3, designed for AMD monitoring, benefits from techniques like Interpretable Swin-Poly, which offers an accuracy of 99.8%. This high level of accuracy is crucial for specialists who require reliable tools to monitor disease progression and adjust treatment plans accordingly.
For the remaining datasets (D1, D6, D7, D8, and D9), the figure highlights a diverse set of techniques tailored to specific clinical needs. D1, for example, is well-served by traditional CNN approaches like R-FTCNN and CNN iterative ReliefF, both achieving perfect accuracies of 100%, making them highly effective for general screening purposes. D6, which involves distinguishing between different types of AMD and less common conditions like CSR, benefits from advanced models like Stitched Tiny MedViTs with an accuracy of 98.6%, offering doctors a reliable tool for targeted interventions. Meanwhile, D7*, which includes a variety of diabetic macular edema (DME) stages, finds MSK-EMP with an accuracy of 96.62% particularly suitable, aiding in precise diagnosis and treatment decisions. Finally, for D9, which covers a broader range of conditions, techniques like ViT with Logit Loss Function (87.3%) and Interpretable Swin-Poly (97.31%) offer substantial accuracy, providing clinicians with dependable tools for diagnosing diverse retinal conditions. Each technique’s suitability is closely tied to its ability to support doctors in making informed decisions, whether through accurate screening, detailed monitoring, or distinguishing between subtle variations in retinal diseases.
6. Future Work
Future research in ocular disorder predictions using OCTs should focus on two key areas: making deep learning models stronger against adversarial attacks in medical imaging and exploring how Large Language Models (LLMs) can be integrated into diagnostic processes.
6.1. Medical Imaging with Adversarial Samples
As the field of medical imaging continues to evolve, new challenges arise in improving ocular disorder diagnostic tools. One emerging concern is the susceptibility of deep learning models to adversarial samples, which is to intentionally crafted input data designed to fool models into making incorrect predictions. In OCT images, even slight perturbations can lead to misclassifications by models. This is dangerous in a clinical setting, where a misdiagnosis can have serious implications for patient outcomes. The growing recognition of these vulnerabilities has prompted researchers to explore defense mechanisms and adversarial training strategies to improve model resilience [27] and [86,87,88,89,90,91,92,93,94,95,96,97,98]. The following is a review of works related to adversarial samples in OCT and other medical imaging diagnostics.
The previously introduced MKW-LBP [27] has demonstrated robustness under adversarial conditions, including Gaussian noise. OCT images were tested with Gaussian noise at varying levels to evaluate the descriptor’s performance. A study explores the effects of image degradation on some DL models employed for skin cancer detection. First, pepper noises are introduced as an adversarial attack. Then, a texture descriptor, Ordered Statistics Local Binary Patterns (OS-LBP), is utilized for CNN models training. The models are employed to identify potential skin cancer areas to mitigate the effects of image degradations [86]. In a similar study, a work investigates the impact of contrast degradation on DL models for wireless capsule endoscopic (WCE) image analysis, highlighting the effects of contrast reductions on classification accuracy. To address this issue, Color Quaternion Modulus and Phase Patterns (CQ-MPP), is proposed, which extracts features from WCE images and identifies potential cancerous regions, even under reduced contrast [87]. A study demonstrates various medical image computing tasks employing DL models. Adversarial examples, such as Fast Gradient Sign Method (FGSM), are utilized to train and benchmark model robustness by comparing different architectures for tasks including skin lesion classification and whole brain segmentation [88]. A work employs adversarial examples, including Basic Iterative Method (BIM), Projected Gradient Descent (PGD), and FGSM, from clean examples by utilizing features from various DNN layers. It employs techniques such as detection subnetworks based on activations, logistic regression detectors using Kernel Density (KD) and Bayesian Uncertainty features, and the Local Intrinsic Dimensionality (LID) of adversarial subspaces [89].
Some works offer insights into medical image adversarial attacks from the viewpoints of both generating and detecting these attacks. Specifically, it examines whether existing medical deep learning models are susceptible to gradient-based adversarial attacks. It focuses on three representative medical image classifications, skin cancer detection from photographic images, referable diabetic retinopathy detection from OCT images, and pneumonia detection from chest X-rays. While evaluating the vulnerability of DNN models to both nontargeted and targeted attacks, as well as their robustness through adversarial retraining [90,91,92,93]. A study proposes a frequency constraint-based adversarial attack by injecting perturbations into high-frequency information while preserving low-frequency content. This technique is tested on four 3D CT, 2D chest X-ray, 2D breast ultrasound, and 2D thyroid ultrasound datasets with varying imaging modalities and dimensionalities [10]. A Model Ensemble Feature Fusion (MEFF) approach is designed to counter adversarial attacks by employing feature fusion by combining features extracted from different deep learning models. Subsequently trains machine learning classifiers using the fused features, utilizing a concatenation method to merge the extracted features [95].
A study introduces a robust multi-view classification method that uses a dissonance measure for adversarial samples. Specifically, the method applies the evidential dissonance measure in subjective logic to evaluate the quality of data views under adversarial attacks. The work proposes a dissonance-aware belief integration strategy for multi-view information fusion, incorporating an inter-view evidential gradient penalty in the learning objective [96]. A medical morphological knowledge-guided adversarial training strategy is proposed, where this approach involves training a surrogate model with an augmented dataset using guided filtering to capture the model’s attention. Then it is followed by a gradient normalization-based prior knowledge injection module to transfer this attention to the main classifier and concludes with a distributionally optimization-based strategy to enhance adversarial attack resistance in the main classifier [97]. A work which adds imperceptible noise to a 3D MRI brain image can introduce significant errors in predicting age, and this can be done even for large batches of images with a single perturbation. Furthermore, a hybrid model, which combines deep learning with image segmentation techniques, is designed to be robust to adversarial perturbations [98].
Given the challenges posed by adversarial attacks on OCT image-based deep learning models, enhancing their robustness is crucial for more reliable ocular disease predictions. One promising direction for future work involves integrating Large Language Models (LLMs) into the diagnostic process, potentially improving model interpretability and providing more accurate diagnoses. Table 7 summarizes the techniques discussed above.
6.2. Incorporation of Large Language Models
There is growing interest in using Large Language Models (LLMs) like GPT’s, BERT [99], and Llama [100] in medical diagnostics. Traditionally used for tasks involving language, LLMs are now being explored for their potential to interpret medical data and support clinical decisions. By combining LLMs with medical imaging, such as OCT scans, we hope to create advanced diagnostic systems that can analyze both visual and text-based information, making predictions more accurate. Several recent studies have started investigating how LLMs can be applied in medical diagnostics, and in the following sections, we will review works that discuss the use of LLMs in diagnostic models.
A work proposes DeepDR-LLM system comprises two modules: Module I (LLM module), which provides personalized recommendations for diabetes patients, and Module II (DeepDR-Transformer module), which handles image quality assessment, DR lesion segmentation, and DR/DME grading from fundus images. There are two integration modes for the modules within the system. In the physician-involved mode, Module II’s outputs assist physicians in generating DR/DME diagnoses, while in the automated mode, the results, including DR grade, DME grade, and lesion presence, are directly classified by Module II [101]. A digital ophthalmologist app was developed using GPT-4V and its performance was evaluated with a dataset containing 60 images across 60 ophthalmic conditions and 6 modalities, including slit-lamp, scanning laser ophthalmoscopy (SLO), fundus photography of the posterior pole (FPP), optical coherence tomography (OCT), fundus fluorescein angiography (FFA), and ocular ultrasound (OUS). The chatbot was tested with ten open-ended questions per image, addressing examination identification, lesion detection, diagnosis, and decision support [102].
In a study, 1226 fundus fluorescein angiography reports and their corresponding diagnoses written in Chinese were collected, and ChatGPT was tested with four prompting strategies: direct diagnosis, diagnosis with a step-by-step reasoning process, and in both Chinese and English [103]. Finally, a study highlights the exciting potential of using ChatGPT in ophthalmology, particularly in areas such as clinical decision-making, education, and research. However, it acknowledges the limitations, including the risk of generating incorrect outputs and concerns over data security. The study recommends vigilance, particularly in ensuring accuracy, addressing ethical considerations, and maintaining data privacy [104].
6.3. Proposals for Future Research
Future research in the application of (OCT) for ocular disorder prediction could benefit greatly from the inclusion of OCT images corrupted by various types of noise, such as Gaussian, salt and pepper, uniform, speckle or Rayleigh noise, shown in Figure 5. Incorporating these noisy images into datasets can help assess the robustness of deep learning models under less-than-ideal conditions, which are common in real-world clinical settings. Additionally, LLMs could be employed to assist in identifying different types of noise, enabling automated preprocessing techniques. This approach could complement traditional noise reduction strategies by providing more precise noise recognition, leading to model performance.
Another promising direction for future research involves the incorporation of adversarial testing into OCT feature extraction frameworks. Adversarial attacks, which involve small, carefully crafted perturbations to input data, can degrade model performance, particularly in medical imaging applications. Therefore, methods and frameworks designed to test the resilience of OCT models against these attacks are essential. Preprocessing techniques to remove adversarial samples could be developed to safeguard model integrity. These techniques might include adversarial training, where models are exposed to adversarial examples during training, or using denoising autoencoders to filter out perturbations. By addressing the challenge of adversarial robustness, future models can be made more reliable, maintain high accuracy and sensitivity even under clinical conditions.
7. Discussion
The findings of this paper highlight the progress made in the application of OCT for the diagnosis of ocular disorders. The comparative analysis of hand-crafted feature extraction methods and deep learning techniques reveals clear differences in their respective strengths and weaknesses. While traditional feature extraction methods rely heavily on domain knowledge and expert intervention, they tend to be more rigid and less adaptable to variations in data. In contrast, deep learning approaches, particularly CNNs, have demonstrated superior ability to automatically learn relevant features from raw data, making them more robust to data variations. The evaluation of various CNN architectures, including those incorporating attention mechanisms and multi-scale feature extraction, further underlines the potential of deep learning in improving the prediction of ocular disorders.
Despite the promising results from deep learning models, several challenges remain, especially in their application to real-world scenarios. One key concern is the vulnerability of deep learning models to adversarial noises and perturbations, which can degrade their performance. These adversarial conditions are a significant gap identified in this study. This highlights the need for further research into making these models more resilient to small, intentionally designed changes in input data. Additionally, while CNNs have shown potential for image analysis, their performance may vary depending on the dataset used, and their reliance on large-annotated datasets remains a limitation in clinical settings where data availability may be scarce.
Looking ahead, the integration of deep learning techniques with OCT imaging has potential for improving early detection of ocular disorders. The ability to automate feature extraction from OCT images not only reduces the need for manual intervention but also accelerates the diagnostic process. Future research should also focus on enhancing model robustness through techniques such as adversarial training and data augmentation to mitigate the impact of noisy or incomplete data. By overcoming current limitations, the use of OCT in conjunction with deep learning has the potential to improve ocular disorder diagnosis leading to better outcomes.
8. Conclusions
In conclusion, this paper presents a comprehensive review of the methodologies employed in OCT image analysis for the early diagnosis of ocular disorders, comparing traditional hand-crafted feature extraction techniques with emerging deep learning models. It is evident that while deep learning approaches, particularly CNNs, offer significant advantages in terms of automatic feature extraction and model robustness. However, there are still challenges related to data quality and adversarial attacks. The findings underscore the importance of advancing OCT image feature extraction methods, particularly through the integration of handcraft and deep learning, to enhance diagnostic accuracy. Future research should focus on improving model resilience, refining preprocessing techniques, and exploring innovative ways to handle noisy or adversarial data, which will contribute to the broader adoption of OCT imaging in clinical practice.
Author Contributions
Conceptualization, Alex Liew; methodology, Alex Liew; validation, Sos A. Agaian; formal analysis, Alex Liew; investigation, Alex Liew; writing—original draft preparation, Alex Liew; writing—review and editing, Sos. A. Agaian; visualization, Sos A. Agaian; supervision, Sos A. Agaian.
Funding
This research received no external funding.
Institutional Review Board Statement
None
Informed Consent Statement
None
Data Availability Statement
Please see citations of datasets.
Acknowledgments
We would like to acknowledge our Optometrist, Captain and Doctor Anna Liew Ramos, who is also currently serving in the Airforce, for providing insights into the various ocular diseases mentioned in our work.
Conflicts of Interest
The authors declare no conflicts of interest.
References
- Ignacio, A. Viedma, David Alonso-Caneiro, Scott A. Read, Michael J. Collins, Deep learning in retinal optical coherence tomography (OCT): A comprehensive survey. Neurocomputing 2022, 507, 247–264, ISSN 0925. [Google Scholar] [CrossRef]
- Usman, M. , Fraz, M. M. & Barman, S.A. Computer Vision Techniques Applied for Diagnostic Analysis of Retinal OCT Images: A Review. Arch Computat Methods Eng 2017, 24, 449–465. [Google Scholar] [CrossRef]
- Meiburger, K.M.; Salvi, M.; Rotunno, G.; Drexler, W.; Liu, M. Automatic Segmentation and Classification Methods Using Optical Coherence Tomography Angiography (OCTA): A Review and Handbook. Appl. Sci. 2021, 11, 9734. [Google Scholar] [CrossRef]
- L. Pan and X. Chen, "Retinal OCT Image Registration: Methods and Applications. in IEEE Reviews in Biomedical Engineering 2023, 16, 307–318. [Google Scholar] [CrossRef]
- Elsharkawy, M.; Elrazzaz, M.; Ghazal, M.; Alhalabi, M.; Soliman, A.; Mahmoud, A.; El-Daydamony, E.; Atwan, A.; Thanos, A.; Sandhu, H.S.; et al. Role of Optical Coherence Tomography Imaging in Predicting Progression of Age-Related Macular Disease: A Survey. Diagnostics 2021, 11, 2313. [Google Scholar] [CrossRef]
- Bharuka, R. Mhatre, D., Patil, N., Chitnis, S., Karnik, M. (2021). A Survey on Classification and Prediction of Glaucoma and AMD Based on OCT and Fundus Images. In: Raj, J.S. (eds) International Conference on Mobile Computing and Sustainable Informatics . ICMCSI 2020. EAI/Springer Innovations in Communication and Computing. Springer, Cham. [CrossRef]
- R. Kiefer, J. Steen, M. Abid, M. R. Ardali and E. Amjadian, "A Survey of Glaucoma Detection Algorithms using Fundus and OCT Images," 2022 IEEE 13th Annual Information Technology, Electronics and Mobile Communication Conference (IEMCON), Vancouver, BC, Canada, 2022, pp. 0191-0196. [CrossRef]
- M. Naveed, A. Ramzan and M. U. Akram, "Clinical and technical perspective of glaucoma detection using OCT and fundus images: A review," 2017 1st International Conference on Next Generation Computing Applications (NextComp), Mauritius, 2017, pp. [CrossRef]
- Ran, A.R. , Tham, C.C., Chan, P.P. et al. Deep learning in glaucoma with optical coherence tomography: a review. Eye 2021, 35, 188–201. [Google Scholar] [CrossRef]
- Muhammed Halil Akpinar, Abdulkadir Sengur, Oliver Faust, Louis Tong, Filippo Molinari, U. Rajendra Acharya, Artificial Intelligence in Retinal Screening Using OCT Images: A Review of the Last Decade (2013-2023). Computer Methods and Programs in Biomedicine 2024, 108253, ISSN 0169-2607. [CrossRef]
- K. A. Nugroho, "A Comparison of Handcrafted and Deep Neural Network Feature Extraction for Classifying Optical Coherence Tomography (OCT) Images," 2018 2nd International Conference on Informatics and Computational Sciences (ICICoS), Semarang, Indonesia, 2018, pp. 1-6. [CrossRef]
- S. K. Dash, P. K. Sethy, A. Das, S. Jena and A. Nanthaamornphong. Advancements in Deep Learning for Automated Diagnosis of Ophthalmic Diseases: A Comprehensive Review. 2024; 12, 171221–171240. [CrossRef]
- P. P. Srinivasan, L.A. Kim, P.S. Mettu, S.W. Cousins, G.M. Comer, J.A. Izatt, and S. Farsiu, "Fully automated detection of diabetic macular edema and dry age-related macular degeneration from optical coherence tomography images. BioMedical Optics Express 2014, 5, 3568–3577. [CrossRef]
- Rasti, R.; Rabbani, H.; Mehridehnavi, A.; Hajizadeh, F. Macular OCT Classification Using a Multiscale Convolutional NeuralNetwork Ensemble. IEEE Trans. Med Imaging 2017, 37, 1024–1034. [Google Scholar] [CrossRef]
- Sotoudeh-Paima, S. Labeled Retinal Optical Coherence Tomography Dataset for Classification of Normal, Drusen, and CNV Cases, Mendeley Data, 2021, V1. Available online: https://paperswithcode.com/dataset/labeled-retinal-optical-coherence-tomography.
- Kermany, Daniel; Zhang, Kang; Goldbaum, Michael (2018), “Labeled Optical Coherence Tomography (OCT) and Chest X-Ray Images for Classification”, Mendeley Data, V2. [CrossRef]
- S. Farsiu, SJ. Chiu, R.V. O’Connell, F.A. Folgar, E. Yuan, J.A. Izatt, and C.A. Toth "Quantitative Classification of Eyes with and without Intermediate Age-related Macular Degeneration Using Optical Coherence Tomography. Ophthalmology 2014, 121, 162–172. [CrossRef]
- O.S. Naren, Retinal OCT- C8, 2021, URL https://www.kaggle.com/datasets/obulisainaren/retinal-oct-c8.
- Yu-Ying Liu, Mei Chen, Hiroshi Ishikawa, Gadi Wollstein, Joel S. Schuman, James M. Rehg, Automated macular pathology diagnosis in retinal OCT images using multi-scale spatial pyramid and local binary patterns in texture and shape encoding. Medical Image Analysis 2011, 15, 748–759. [CrossRef]
- Lemaître G, Rastgoo M, Massich J, Sankar S, Mériaudeau F, Sidibé D. Classification of SD-OCT volumes with LBP: application to DME detection. Proceedings of the ophthalmic medical image analysis second international workshop, OMIA 2015, held in conjunction with MICCAI2015, Munich, Germany, 9 Oct 2015; 2015. p. 9–16. [CrossRef]
- P. Gholami, P. Roy, M.K. Parthasarathy, and V. Lakshminarayanan, “ OCTID: Optical Coherence Tomography Image365 Database. Comput. and Elec. Engin. 2020, 81. [CrossRef]
- D. Song et al., "Deep Relation Transformer for Diagnosing Glaucoma with Optical Coherence Tomography and Visual Field Function. in IEEE Transactions on Medical Imaging 2021, 40, 2392–2402. [CrossRef] [PubMed]
- Peyman Gholami, Mohsen Sheikh Hassani, Mohana Kuppuswamy Parthasarathy, John S. Zelek, and Vasudevan Lakshminarayanan "Classification of optical coherence tomography images for diagnosing different ocular diseases. Proc. SPIE 10487, Multimodal Biomedical Imaging XIII, 1048705 (16 March 2018); [CrossRef]
- Yu, Yao-Wen, Cheng-Hung Lin, Cheng-Kai Lu, Jia-Kang Wang, and Tzu-Lun Huang. Automated Age-Related Macular Degeneration Detector on Optical Coherence Tomography Images Using Slice-Sum Local Binary Patterns and Support Vector Machine. Sensors 2023, 23, 7315. [CrossRef]
- Guillaume Lemaître,1Mojdeh Rastgoo,1Joan Massich,1Carol Y. Cheung,2Tien Y. Wong,3Ecosse Lamoureux,3Dan Milea,3Fabrice Mériaudeau,1,4and Désiré Sidibé1, Classification of SD-OCT Volumes Using Local Binary Patterns: Experimental Validation for DME Detection. Hindawi 2016, 2016, 3298606. [CrossRef]
- K. Alsaih et al., "Classification of SD-OCT volumes with multi pyramids, LBP and HOG descriptors: Application to DME detections," 2016 38th Annual International Conference of the IEEE Engineering in Medicine and Biology Society (EMBC), Orlando, FL, USA, 2016, pp. 1344-1347. [CrossRef]
- Alex Liew "Multi-kernel Wiener local binary patterns for OCT ocular disease detections with resiliency to Gaussian noises. Proc. SPIE 13033, Multimodal Image Exploitation and Learning 2024, 2024, 130330H. [CrossRef]
- A. Liew, S. Agaian, S. Benbelkacem, Distinctions between Choroidal Neovascularization and Age Macular Degeneration in Ocular Disease Predictions via Multi-Size Kernels ξcho-Weighted Median Patterns. Diagnostics. 2023, 13, 729. [CrossRef]
- A. Liew, L. Ryan, and S. Agaian "Alpha mean trim texture descriptors for optical coherence tomography eye classification. Proc. SPIE 12100. Multimodal Image Exploitation and Learning 2022, 2022, 121000F. [CrossRef]
- Jianguo Xu, Weihua Yang, Cheng Wan, Jianxin Shen, Weakly supervised detection of central serous chorioretinopathy based on local binary patterns and discrete wavelet transform. Computers in Biology and Medicine 2020, 127, 104056. [CrossRef]
- Liu YY, Chen M, Ishikawa H, Wollstein G, Schuman JS, Rehg JM. Automated macular pathology diagnosis in retinal OCT images using multi-scale spatial pyramid and local binary patterns in texture and shape encoding. Med Image Anal. 2011, 15, 748–59. [CrossRef]
- Y. -W. Yu, C. -H. Lin, C. -K. Lu, J. -K. Wang and T. -L. Huang, "Distinct Feature Labeling Methods for SVM-Based AMD Automated Detector on 3D OCT Volumes," 2022 IEEE International Conference on Consumer Electronics (ICCE), Las Vegas, NV, USA, 2022, pp. 1-5. [CrossRef]
- Md Akter Hussain, Alauddin Bhuiyan,Chi D. Luu,R. Theodore Smith,Robyn H. Guymer,Hiroshi Ishikawa,Joel S. Schuman,Kotagiri Ramamohanarao, Classification of healthy and diseased retina using SD-OCT imaging and Random Forest algorithm, PLOS ONE, June 4, 2018. [CrossRef]
- Anju Thomas, A. P. Sunija, Rigved Manoj, Rajiv Ramachandran, Srikkanth Ramachandran, P. Gopi Varun, P. Palanisamy, RPE layer detection and baseline estimation using statistical methods and randomization for classification of AMD from retinal OCT. Computer Methods and Programs in Biomedicine 2021, 200, 105822. [Google Scholar] [CrossRef]
- Pratul, P. Srinivasan, Leo A. Kim, Priyatham S. Mettu, Scott W. Cousins, Grant M. Comer, Joseph A. Izatt, and Sina Farsiu, "Fully automated detection of diabetic macular edema and dry age-related macular degeneration from optical coherence tomography images. Biomed. Opt. Express 2014, 5, 3568–3577. [Google Scholar]
- Mousavi, Elahe; Kafieh, Rahele; Rabbani, Hossein. Classification of dry age-related macular degeneration and diabetic macular oedema from optical coherence tomography images using dictionary learning. IET Image Processing 2020, 14, 1571–1579, IET Digital Library, https://digital-library.theiet.org/content/journals/10.1049/iet-ipr.2018.6186. [CrossRef]
- Yankui Sun, Shan Li, and Zhongyang Sun Fully automated macular pathology detection in retina optical coherence tomography images using sparse coding and dictionary learning. Journal of Biomedical Optics 2017, 22, 016012. [CrossRef]
- İsmail Kayadibi, Gür Emre Güraksın, Utku Köse, A Hybrid R-FTCNN based on principal component analysis for retinal disease detection from OCT images. Expert Systems with Applications 2023, 230, 120617, ISSN 0957–4174. [CrossRef]
- Shengyong Diao, Jinzhu Su, Changqing Yang, Weifang Zhu, Dehui Xiang, Xinjian Chen, Qing Peng, Fei Shi, Classification and segmentation of OCT images for age-related macular degeneration based on dual guidance networks. Biomedical Signal Processing and Control 2023, 84, 104810, ISSN 1746–8094. [CrossRef]
- Barua, Prabal Datta, Wai Yee Chan, Sengul Dogan, Mehmet Baygin, Turker Tuncer, Edward J. Ciaccio, Nazrul Islam, Kang Hao Cheong, Zakia Sultana Shahid, and U. Rajendra Acharya. Multilevel Deep Feature Generation Framework for Automated Detection of Retinal Abnormalities Using OCT Images. Entropy 2021, 23, 1651. [CrossRef]
- Ji, Qingge, Wenjie He, Jie Huang, and Yankui Sun. Efficient Deep Learning-Based Automated Pathology Identification in Retinal Optical Coherence Tomography Images. Algorithms 2018, 11, 88. [CrossRef]
- Alqudah, AM. AOCT-NET: a convolutional network automated classification of multiclass retinal diseases using spectral-domain optical coherence tomography images. Med Biol Eng Comput. 2020, 58, 41–53. [Google Scholar] [CrossRef] [PubMed]
- Leyuan Fang, Yuxuan Jin, Laifeng Huang, Siyu Guo, Guangzhe Zhao, Xiangdong Chen. Iterative fusion convolutional neural networks for classification of optical coherence tomography images. Journal of Visual Communication and Image Representation 2019, 59, 327–333. [CrossRef]
- Ranjitha Rajan, S.N. Kumar, IoT based optical coherence tomography retinal images classification using OCT Deep Net2. Measurement: Sensors 2023, 25, 100652. [Google Scholar] [CrossRef]
- Tsuji, T. , Hirose, Y., Fujimori, K. et al. Classification of optical coherence tomography images using a capsule network. BMC Ophthalmol 2020, 20, 114. [Google Scholar] [CrossRef] [PubMed]
- Bridge, J. , Harding, S.P., Zhao, Y., Zheng, Y. (2019). Dictionary Learning Informed Deep Neural Network with Application to OCT Images. In: Fu, H., Garvin, M., MacGillivray, T., Xu, Y., Zheng, Y. (eds) Ophthalmic Medical Image Analysis. OMIA 2019. Lecture Notes in Computer Science(), vol 11855. Springer, Cham. [CrossRef]
- Baharlouei, Zahra; Shaker, Fariba; Plonka, Gerlind; Rabbani, Hossein (2023). Application of Deep Dictionary Learning and Predefined Filters for Classification of Retinal Optical Coherence Tomography Images. Optica Open. Preprint. [CrossRef]
- X. Wang et al., "UD-MIL: Uncertainty-Driven Deep Multiple Instance Learning for OCT Image Classification. in IEEE Journal of Biomedical and Health Informatics 2020, 24, 3431–3442. [CrossRef]
- Rasti R, Mehridehnavi A, Rabbani H, Hajizadeh F. , Automatic diagnosis of abnormal macula in retinal optical coherence tomography images using wavelet-based convolutional neural network features and random forests classifier. J Biomed Opt. 2018, 23, 1–10. [CrossRef]
- L. Fang, C. Wang, S. Li, H. Rabbani, X. Chen, and Z. Liu. Attention to Lesion: Lesion-Aware Convolutional Neural Network for Retinal Optical Coherence Tomography Image Classification. in IEEE Transactions on Medical Imaging 2019, 38, 1959–1970. [Google Scholar] [CrossRef]
- S. S. Mishra, B. Mandal and N. B. Puhan. Multi-Level Dual-Attention Based CNN for Macular Optical Coherence Tomography Classification. in IEEE Signal Processing Letters 2019, 26, 1793–1797. [CrossRef]
- S. S. Mishra, B. Mandal and N. B. Puhan. Perturbed Composite Attention Model for Macular Optical Coherence Tomography Image Classification. in IEEE Transactions on Artificial Intelligence 2022, 3, 625–635. [CrossRef]
- Xiaoming Liu, Yingjie Bai, Jun Cao, Junping Yao, Ying Zhang, Man Wang, Joint disease classification and lesion segmentation via one-stage attention-based convolutional neural network in OCT images. Biomedical Signal Processing and Control 2022, 71, 103087, ISSN 1746–8094. [CrossRef]
- Huang X, Ai Z, Wang H, She C, Feng J, Wei Q, Hao B, Tao Y, Lu Y, Zeng F. GABNet: global attention block for retinal OCT disease classification. Front Neurosci. 2023, 17, 1143422. [CrossRef] [PubMed] [PubMed Central]
- V. Das, E. Prabhakararao, S. Dandapat and P. K. Bora. B-Scan Attentive CNN for the Classification of Retinal Optical Coherence Tomography Volumes. in IEEE Signal Processing Letters 2020, 27, 1025–1029. [CrossRef]
- Abd Elaziz M, Mabrouk A, Dahou A, Chelloug SA. Medical Image Classification Utilizing Ensemble Learning and Levy Flight-Based Honey Badger Algorithm on 6G-Enabled Internet of Things. Comput Intell Neurosci. 2022, 2022, 5830766. [CrossRef] [PubMed] [PubMed Central]
- Hassan B, Hassan T, Li B, Ahmed R, Hassan O. Deep Ensemble Learning Based Objective Grading of Macular Edema by Extracting Clinically Significant Findings from Fused Retinal Imaging Modalities. Sensors (Basel). 2019, 19, 2970. [CrossRef]
- Vineeta Das, Samarendra Dandapat, Prabin Kumar Bora, Multi-scale deep feature fusion for automated classification of macular pathologies from OCT images. Biomedical Signal Processing and Control 2019, 54, 101605. [CrossRef]
- A. Thomas et al., A novel multiscale and multipath convolutional neural network based age-related macular degeneration detection using OCT images. Computer Methods and Programs in Biomedicine 2021, 209, 106294. [CrossRef] [PubMed]
- Anju Thomas, Harikrishnan P. M., Adithya K. Krishna, Palanisamy P., Varun P. Gopi. A novel multiscale convolutional neural network based age-related macular degeneration detection using OCT images. Biomedical Signal Processing and Control 2021, 67, 102538. [CrossRef]
- Saman Sotoudeh-Paima, Ata Jodeiri, Fedra Hajizadeh, Hamid Soltanian-Zadeh, Multi-scale convolutional neural network for automated AMD classification using retinal OCT images. Computers in Biology and Medicine 2022, 144, 105368. [CrossRef]
- Akinniyi O, Rahman MM, Sandhu HS, El-Baz A, Khalifa F. Multi-Stage Classification of Retinal OCT Using Multi-Scale Ensemble Deep Architecture. Bioengineering (Basel). 2023, 10, 823. [CrossRef]
- R. Rasti, H. Rabbani, A. Mehridehnavi and F. Hajizadeh. Macular OCT Classification Using a Multi-Scale Convolutional Neural Network Ensemble. in IEEE Transactions on Medical Imaging 2018, 37, 1024–1034. [CrossRef]
- V. Das, S. Dandapat and P. K. Bora. Automated Classification of Retinal OCT Images Using a Deep Multi-Scale Fusion CNN. in IEEE Sensors Journal 2021, 21, 23256–23265. [CrossRef]
- Y. Rong et al., "Surrogate-Assisted Retinal OCT Image Classification Based on Convolutional Neural Networks. in IEEE Journal of Biomedical and Health Informatics 2019, 23, 253–263. [CrossRef]
- V. Das, S. Dandapat and P. K. Bora. A Data-Efficient Approach for Automated Classification of OCT Images Using Generative Adversarial Network. in IEEE Sensors Letters 2020, 4, 7000304. [CrossRef]
- V. Das, S. Dandapat and P. K. Bora, "Unsupervised Super-Resolution of OCT Images Using Generative Adversarial Network for Improved Age-Related Macular Degeneration Diagnosis. in IEEE Sensors Journal 2020, 20, 8746–8756. [CrossRef]
- Z. Ma, Q Xie; P. Xie; F. Fan, X Gao, J. Zhu, HCTNet: A Hybrid ConvNet-Transformer Network for Retinal Optical Coherence Tomography Image Classification. Biosensors 2022, 12, 542. [CrossRef]
- He, J. , Wang, J. , Han, Z. et al. An interpretable transformer network for the retinal disease classification using optical coherence tomography. Sci Rep 2023, 13, 3637. [Google Scholar] [CrossRef] [PubMed]
- A. Playout, R. Duval, M. C. Boucher, F. Cheriet. Focused Attention in Transformers for interpretable classification of retinal images. Medical Image Analysis 2022, 82, 102608, ISSN 1361–8415. [CrossRef]
- Cai L, Wen C, Jiang J, et al, Classification of diabetic maculopathy based on optical coherence tomography images using a Vision Transformer model. BMJ Open Ophthalmology 2023, 8, e001423. [CrossRef]
- Badr Ait Hammou, Fares Antaki, Marie-Carole Boucher, Renaud Duval. MBT: Model-Based Transformer for retinal optical coherence tomography image and video multi-classification. International Journal of Medical Informatics 2023, 178, 105178. [CrossRef]
- Junyong Shen, Yan Hu, Xiaoqing Zhang, Yan Gong, Ryo Kawasaki, Jiang Liu, Structure-Oriented Transformer for retinal diseases grading from OCT images. Computers in Biology and Medicine 2023, 152, 106445, ISSN 0010–4825. [CrossRef]
- H. Wang et al. OCTFormer: An Efficient Hierarchical Transformer Network Specialized for Retinal Optical Coherence Tomography Image Recognition. in IEEE Transactions on Instrumentation and Measurement 2023, 72, 2532217. [CrossRef]
- Hemalakshmi, G.R. , Murugappan, M. , Sikkandar, M.Y. et al. Automated retinal disease classification using hybrid transformer model (SViT) using optical coherence tomography images. Neural Comput & Applic 2024, 36, 9171–9188. [Google Scholar] [CrossRef]
- Dutta, P.; Sathi, K.A.; Hossain, M.A.; Dewan, M.A.A. Conv-ViT: A Convolution and Vision Transformer-Based Hybrid Feature Extraction Method for Retinal Disease Detection. J. Imaging 2023, 9, 140. [Google Scholar] [CrossRef]
- Yang Yu, Hongqing Zhu, Transformer-based cross-modal multi-contrast network for ophthalmic diseases diagnosis. Biocybernetics and Biomedical Engineering 2023, 43, 507–527, ISSN 0208. [CrossRef]
- Li, Z.; Han, Y.; Yang, X. Multi-Fundus Diseases Classification Using Retinal Optical Coherence Tomography Images with Swin Transformer V2. J. Imaging 2023, 9, 203. [Google Scholar] [CrossRef] [PubMed]
- Huajie Wen, Jian Zhao, Shaohua Xiang, Lin Lin, Chengjian Liu, Tao Wang, Lin An, Lixin Liang, Bingding Huang, Towards more efficient ophthalmic disease classification and lesion location via convolution transformer. Computer Methods and Programs in Biomedicine 2022, 220, 106832, ISSN 0169–2607. [CrossRef]
- Mohammad Mahdi Azizi, Setareh Abhari, Hedieh Sajedi, Stitched vision transformer for age-related macular degeneration detection using retinal optical coherence tomography images, June 5, 2024, PLOS ONE. [CrossRef]
- Mona Ashtari-Majlan, Mohammad Mahdi Dehshibi, David Masip, Spatial-aware Transformer-GRU Framework for Enhanced Glaucoma Diagnosis from 3D OCT Imaging, arXiv, March 2024.
- Zhencun Jiang, Lingyang Wang, Qixin Wu, Yilei Shao, Meixiao Shen, Wenping Jiang, and Cuixia Dai. Computer-aided diagnosis of retinopathy based on vision transformer. Journal of Innovative Optical Health Sciences 2022, 15, 2250009.
- Yuka Kihara, Mengxi Shen, Yingying Shi, Xiaoshuang Jiang, Liang Wang, Rita Laiginhas, Cancan Lyu, Jin Yang, Jeremy Liu, Rosalyn Morin, Randy Lu, Hironobu Fujiyoshi, William J. Feuer, Giovanni Gregori, Philip J. Rosenfeld, Aaron Y. Lee. Detection of Nonexudative Macular Neovascularization on Structural OCT Images Using Vision Transformers. Ophthalmology Science 2022, 2, 100197. [CrossRef]
- Oghbaie, M. , Araújo, T., Emre, T., Schmidt-Erfurth, U., Bogunović, H. (2023). Transformer-Based End-to-End Classification of Variable-Length Volumetric Data. In: Greenspan, H., et al. Medical Image Computing and Computer Assisted Intervention – MICCAI 2023. MICCAI 2023. Lecture Notes in Computer Science, vol 14225. Springer, Cham. [CrossRef]
- Zenan Zhou, Chen Niu, Huanhuan Yu, Jiaqing Zhao, Yuchen Wang, and Cuixia Dai "Diagnosis of retinal diseases using the vision transformer model based on optical coherence tomography images. Proc. SPIE 12601, SPIE-CLP Conference on Advanced Photonics 2022, 1260102 (28 March 2023). [CrossRef]
- A. Liew, S. Agaian, L. Zhao "Mitigation of adversarial noise attacks on skin cancer detection via ordered statistics binary local features. Proc. SPIE 12526, Multimodal Image Exploitation and Learning 2023, 2023, 125260O. [CrossRef]
- Alex Liew, Sos S. Agaian, and Liang Zhao "Enhancing the resilience of wireless capsule endoscopy imaging against adversarial contrast reduction using color quaternion modulus and phase patterns. Proc. SPIE 13033, Multimodal Image Exploitation and Learning 2024, 130330I (7 June 2024). [CrossRef]
- Magdalini Paschali, Sailesh Conjeti, Fernando Navarro, Nassir Navab, Generalizability vs. Robustness: Adversarial Examples for Medical Imaging. arXiv:1804.00504v1.
- Puttagunta, M.K. , Ravi, S. & Nelson Kennedy Babu, C. Adversarial examples: attacks and defences on medical deep learning systems. Multimed Tools Appl 2023, 82, 33773–33809. [Google Scholar] [CrossRef]
- Xingjun Ma, Yuhao Niu, Lin Gu, Yisen Wang, Yitian Zhao, James Bailey, Feng Lu, Understanding adversarial attacks on deep learning based medical image analysis systems, Pattern Recognition 2021, 110, 107332, ISSN 0031-3203. [CrossRef]
- Finlayson SG, Bowers JD, Ito J, Zittrain JL, Beam L, Kohane IS. Adversarial attacks on medical machine learning emerging vulnerabilities demand new conversations. Sci (80- ) 2019, 363, 1287–1290. [CrossRef]
- Samuel, G. Finlayson et al., Adversarial attacks on medical machine learning. Science 2019, 363, 1287–1289. [Google Scholar] [CrossRef]
- Hirano, H.; Minagi, A.; Takemoto, K. Universal adversarial attacks on deep neural networks for medical image classification. BMC Med Imaging 2021, 21, 9. [Google Scholar] [CrossRef]
- Fang Chen, Jian Wang, Han Liu, Wentao Kong, Zhe Zhao, Longfei Ma, Hongen Liao, Daoqiang Zhang. Frequency constraint-based adversarial attack on deep neural networks for medical image classification. Computers in Biology and Medicine 2023, 164, 107248. [CrossRef] [PubMed]
- Laith Alzubaidi, Khamael AL–Dulaimi, Huda Abdul-Hussain Obeed, Ahmed Saihood, Mohammed A. Fadhel, Sabah Abdulazeez Jebur, Yubo Chen, A.S. Albahri, Jose Santamaría, Ashish Gupta, Yuantong Gu, MEFF – A model ensemble feature fusion approach for tackling adversarial attacks in medical imaging. Intelligent Systems with Applications 2024, 22, 200355. [CrossRef]
- Xiaodong Yue, Zhicheng Dong, Yufei Chen, Shaorong Xie, Evidential dissonance measure in robust multi-view classification to resist adversarial attack, Information Fusion 2025, 113, 102605, ISSN 1566-2535. [CrossRef]
- Shancheng Jiang, Zehui Wu, Haiqiong Yang, Kun Xiang, Weiping Ding, Zhen-Song Chen, A prior knowledge-guided distributionally robust optimization-based adversarial training strategy for medical image classification. Information Sciences 2024, 673, 120705. [CrossRef]
- Yi Li, Huahong Zhang, Camilo Bermudez, Yifan Chen, Bennett A. Landman, Yevgeniy Vorobeychik, Anatomical context protects deep learning from adversarial perturbations in medical imaging. Neurocomputing 2020, 379, 370–378. [CrossRef]
- Jacob Devlin, Ming-Wei Chang, Kenton Lee, Kristina Toutanova, BERT: Pre-training of Deep Bidirectional Transformers for Language Understanding, arXiv, Oct 2018 – 99.
- Hugo Touvron, Thibaut Lavril, Gautier Izacard, Xavier Martinet, Marie-Anne Lachaux, Timothée Lacroix, Baptiste Rozière, Naman Goyal, Eric Hambro, Faisal Azhar, Aurelien Rodriguez, Armand Joulin, Edouard Grave, Guillaume Lample, LLaMA: Open and Efficient Foundation Language Models, arXiv, Feb 2023.
- Li, J. , Guan, Z., Wang, J. et al. Integrated image-based deep learning and language models for primary diabetes care. Nat Med (2024). [CrossRef]
- Pusheng Xu, Xiaolan Chen, Ziwei Zhao, Danli Shi, Unveiling the Clinical Incapabilities: A Benchmarking Study of GPT-4V(ision) for Ophthalmic Multimodal Image Analysis, medRxiv 2023.11.27.23299056.
- Liu X, Wu J, Shao A, Shen W, Ye P, Wang Y, Ye J, Jin K, Yang J. Uncovering Language Disparity of ChatGPT on Retinal Vascular Disease Classification: Cross-Sectional Study. J Med Internet Res 2024, 26, e51926, URL: https://www.jmir.org/2024/1/e51926. [CrossRef]
- Dossantos J, An J, Javan R. Eyes on AI: ChatGPT’s Transformative Potential Impact on Ophthalmology. Cureus. 2023, 15, e40765. [CrossRef]
- Nikdel, Mojgan MD; Ghadimi, Hadi MD; Suh, Donny W. MD, FACS; Tavakoli, Mehdi MD, FICO. Accuracy of the Image Interpretation Capability of ChatGPT-4 Vision in Analysis of Hess Screen and Visual Field Abnormalities. Journal of Neuro-Ophthalmology.
Figure 1.
Shows OCT images of various ocular disorders: (top row) AMD, CNV, CSR, DME; (bottom row) DR, Drusen, MH and Normal. These images are taken from [18].
Figure 1.
Shows OCT images of various ocular disorders: (top row) AMD, CNV, CSR, DME; (bottom row) DR, Drusen, MH and Normal. These images are taken from [18].
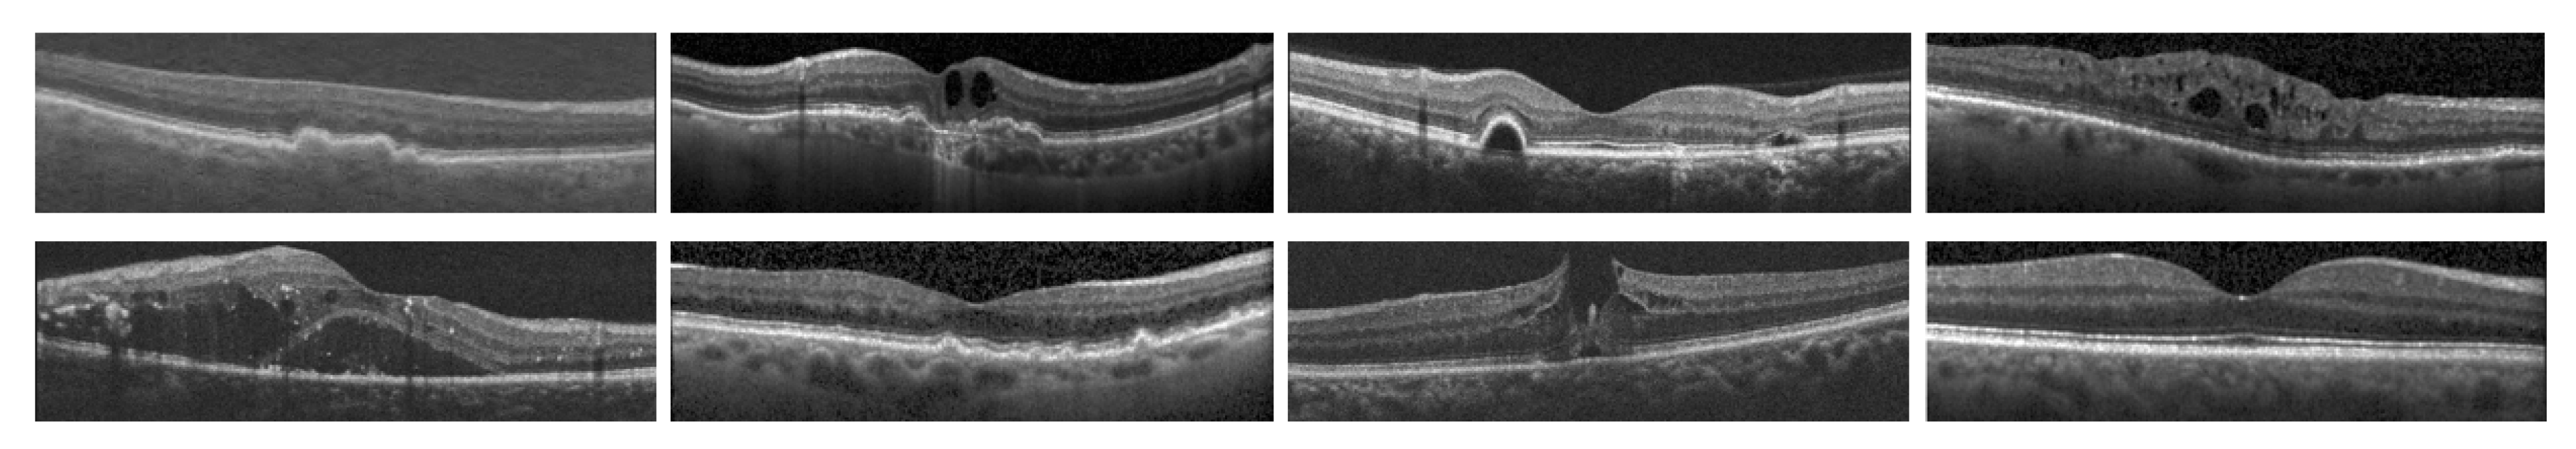
Figure 2.
Shows the corresponding relationship between OCT and Fundus image taken from [22].
Figure 2.
Shows the corresponding relationship between OCT and Fundus image taken from [22].
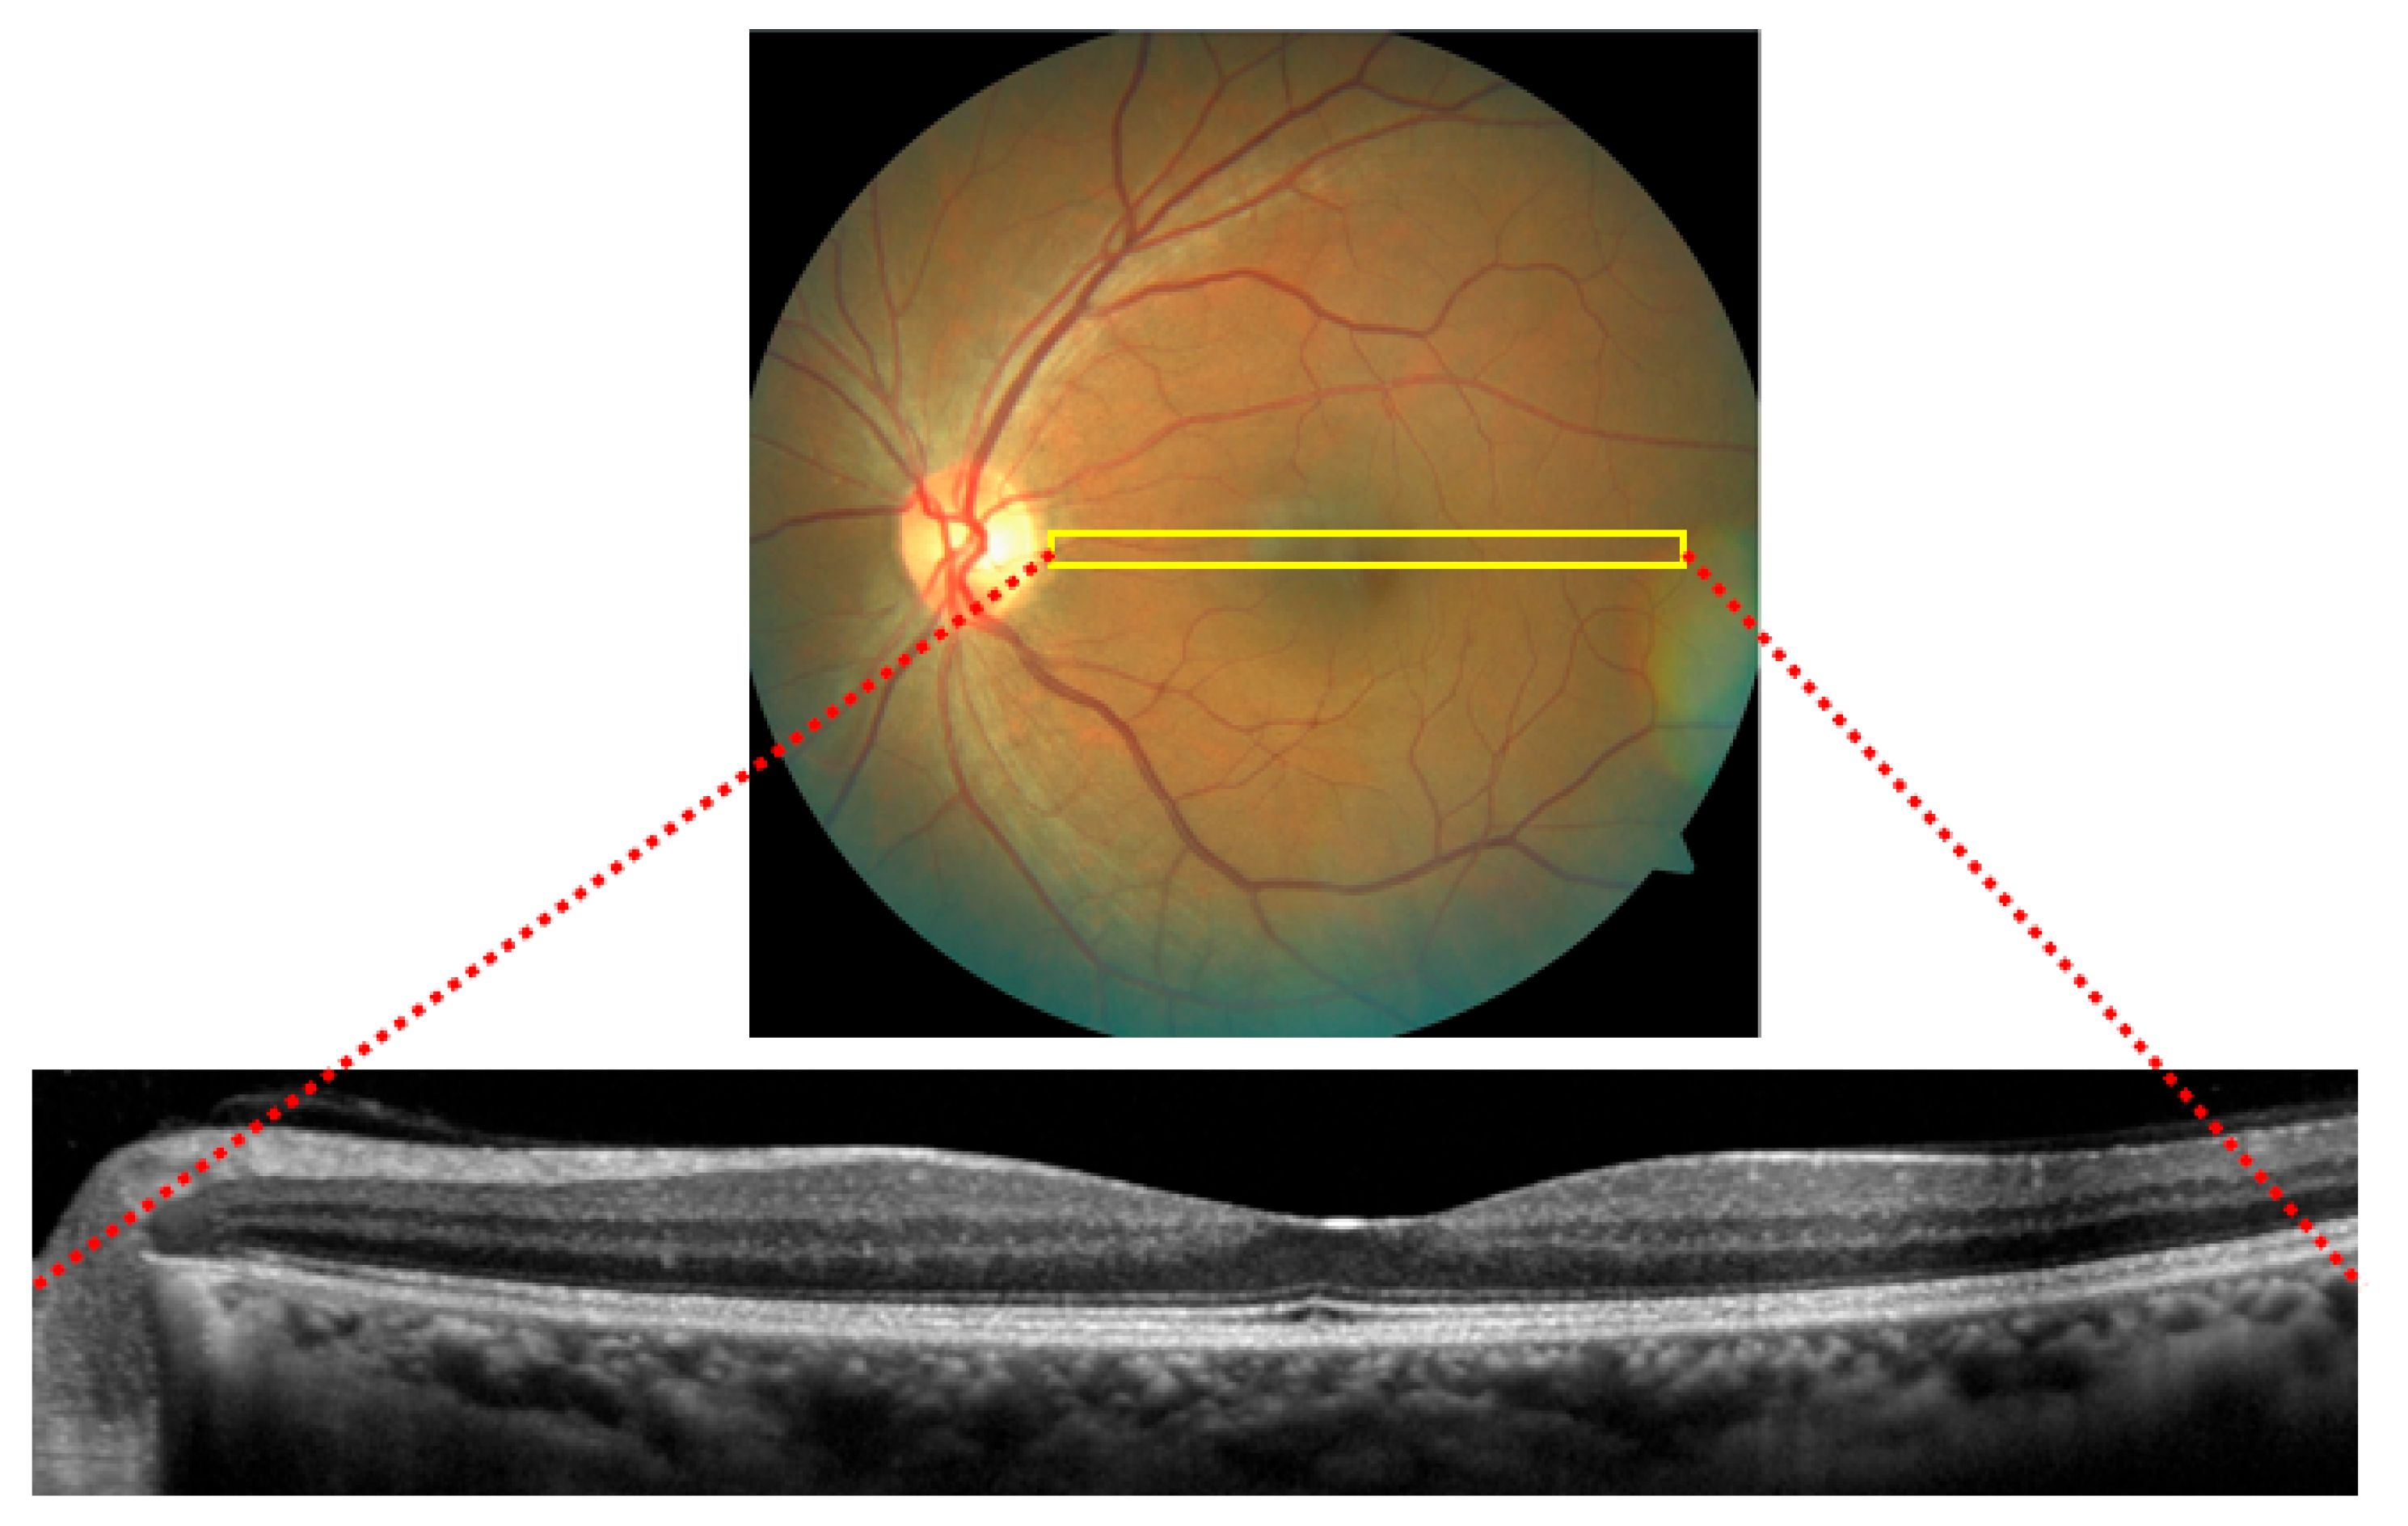
Figure 3.
Different types of CNN structures.
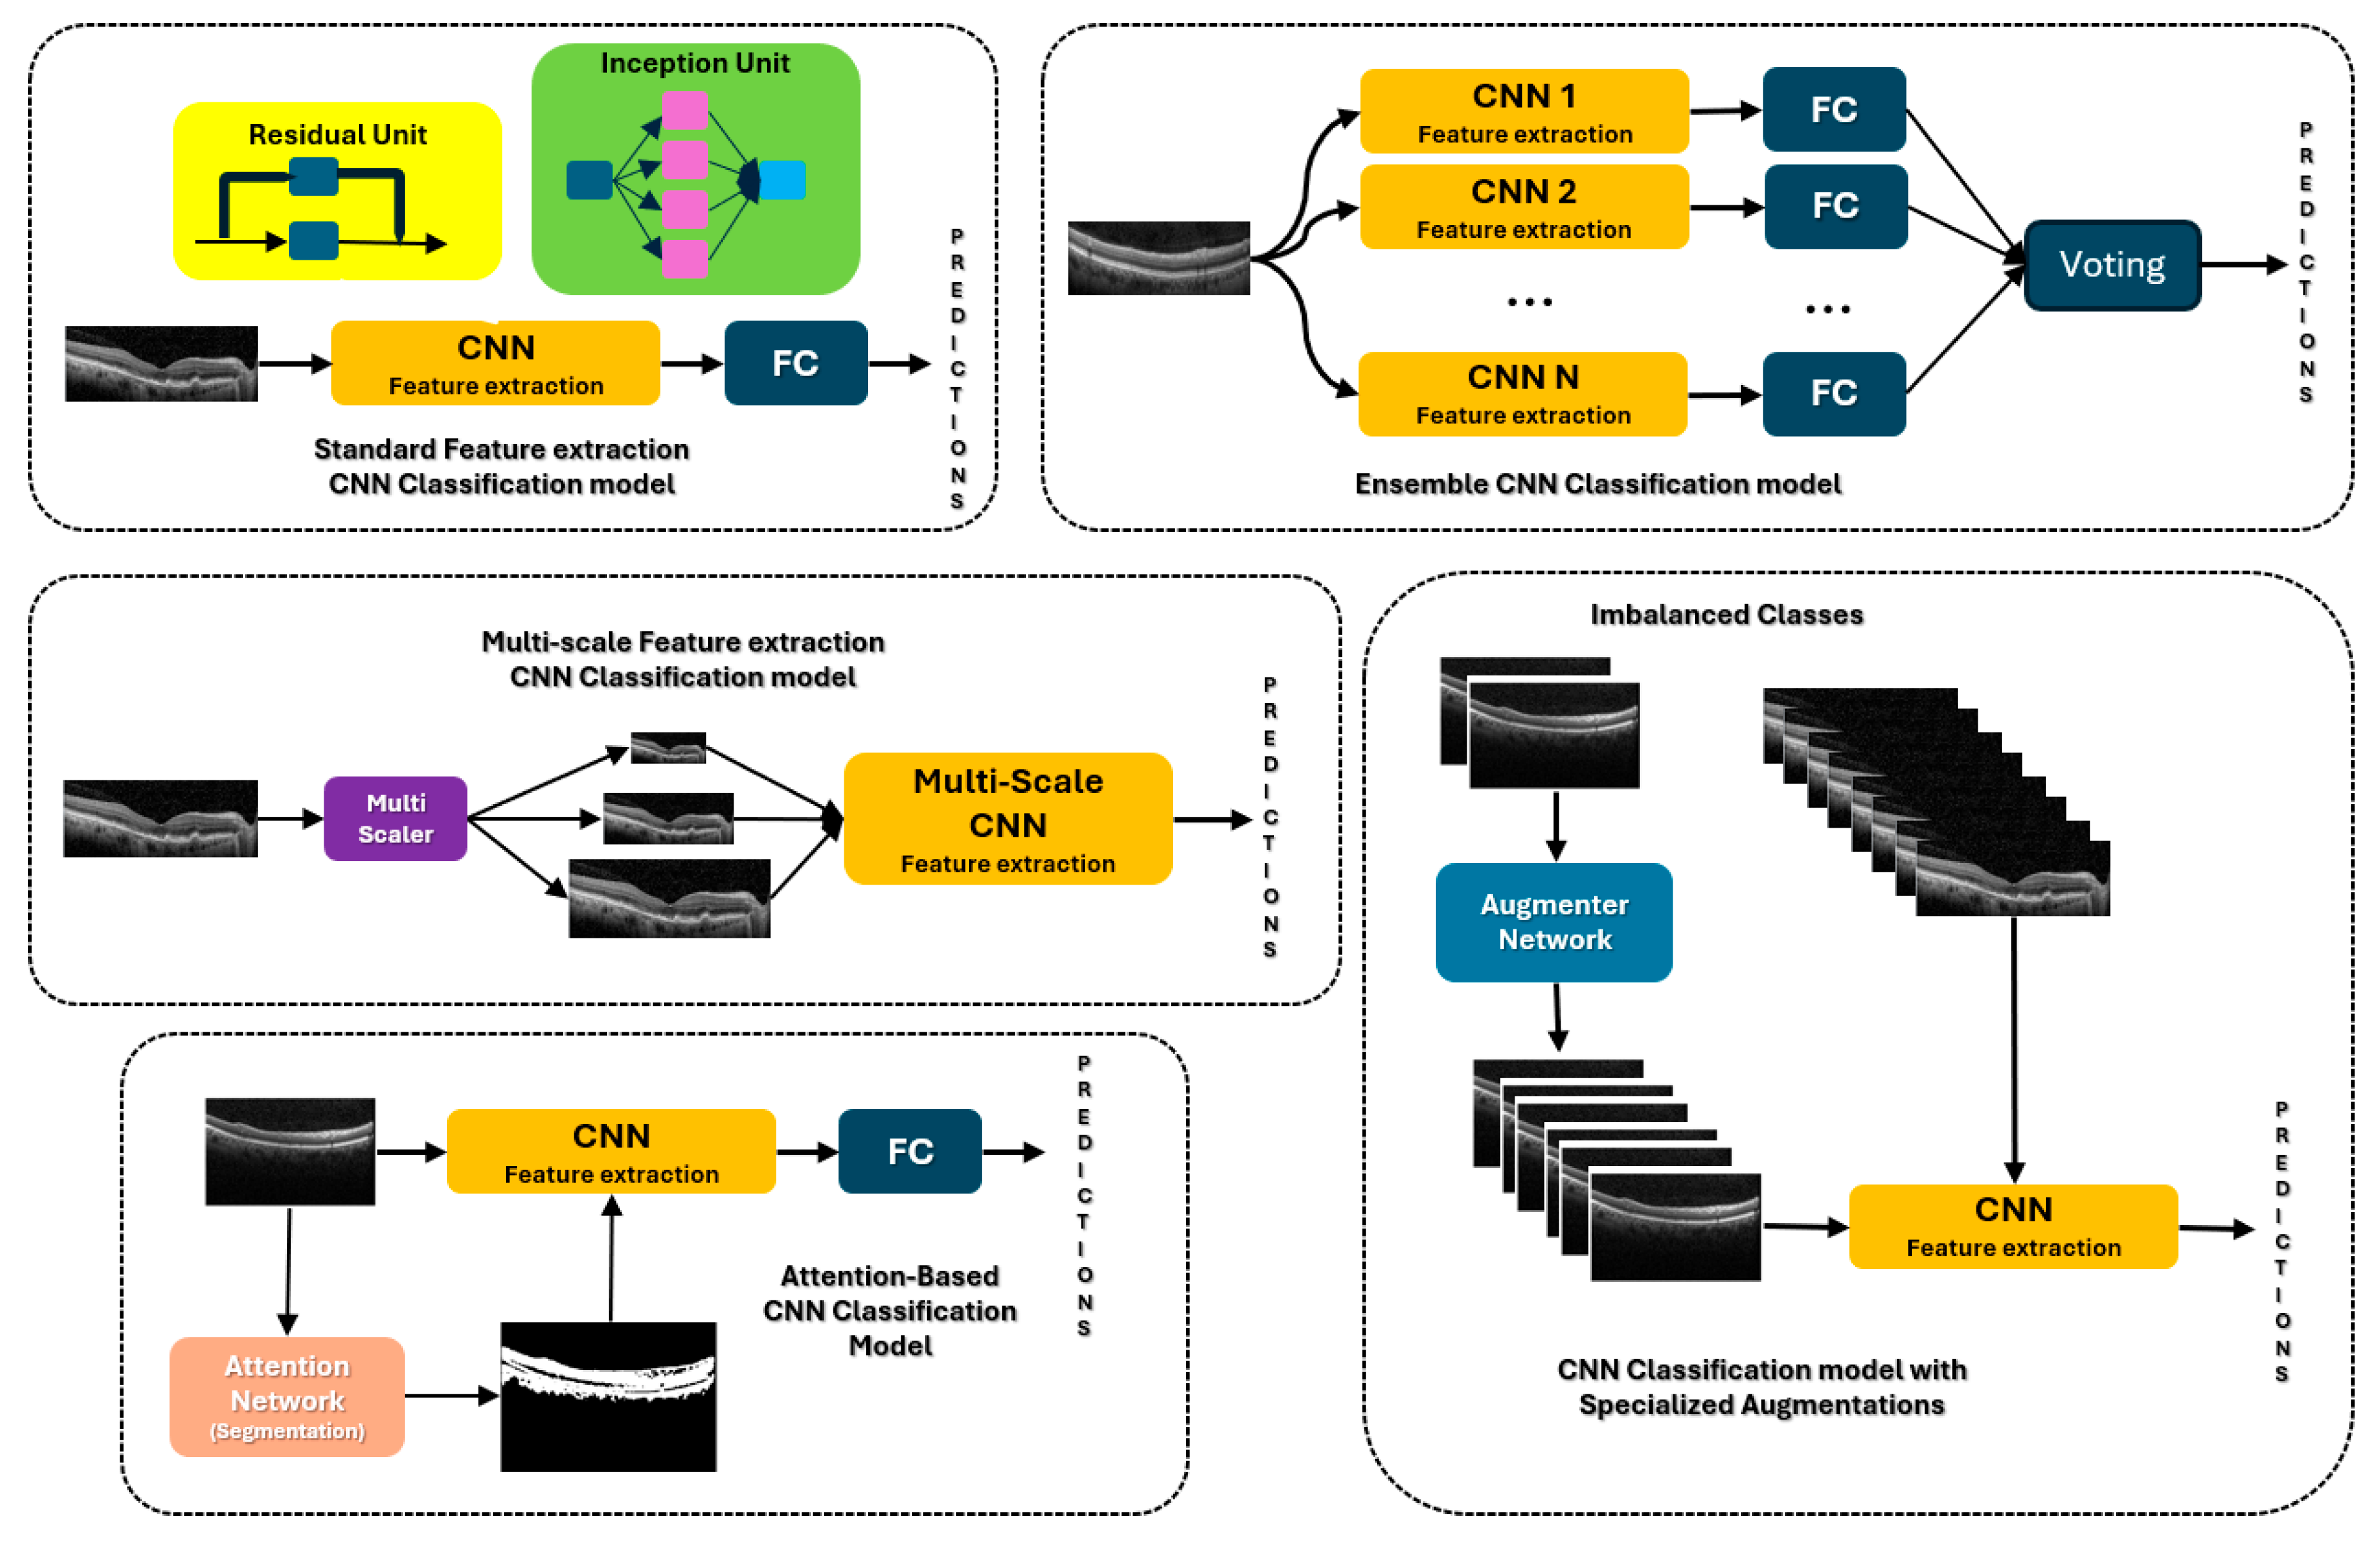
Figure 4.
presents a radial bar plot comparing the performance of various techniques used in OCT ocular disorder detection across multiple datasets, indicated as D1 through D9. Each bar represents a specific technique, with the length of the bar corresponding to the classification accuracy (%) achieved by that technique. The techniques are color-coded based on the type of method: Handcrafted Features are shown in red, CNNs in blue, and ViT in green.
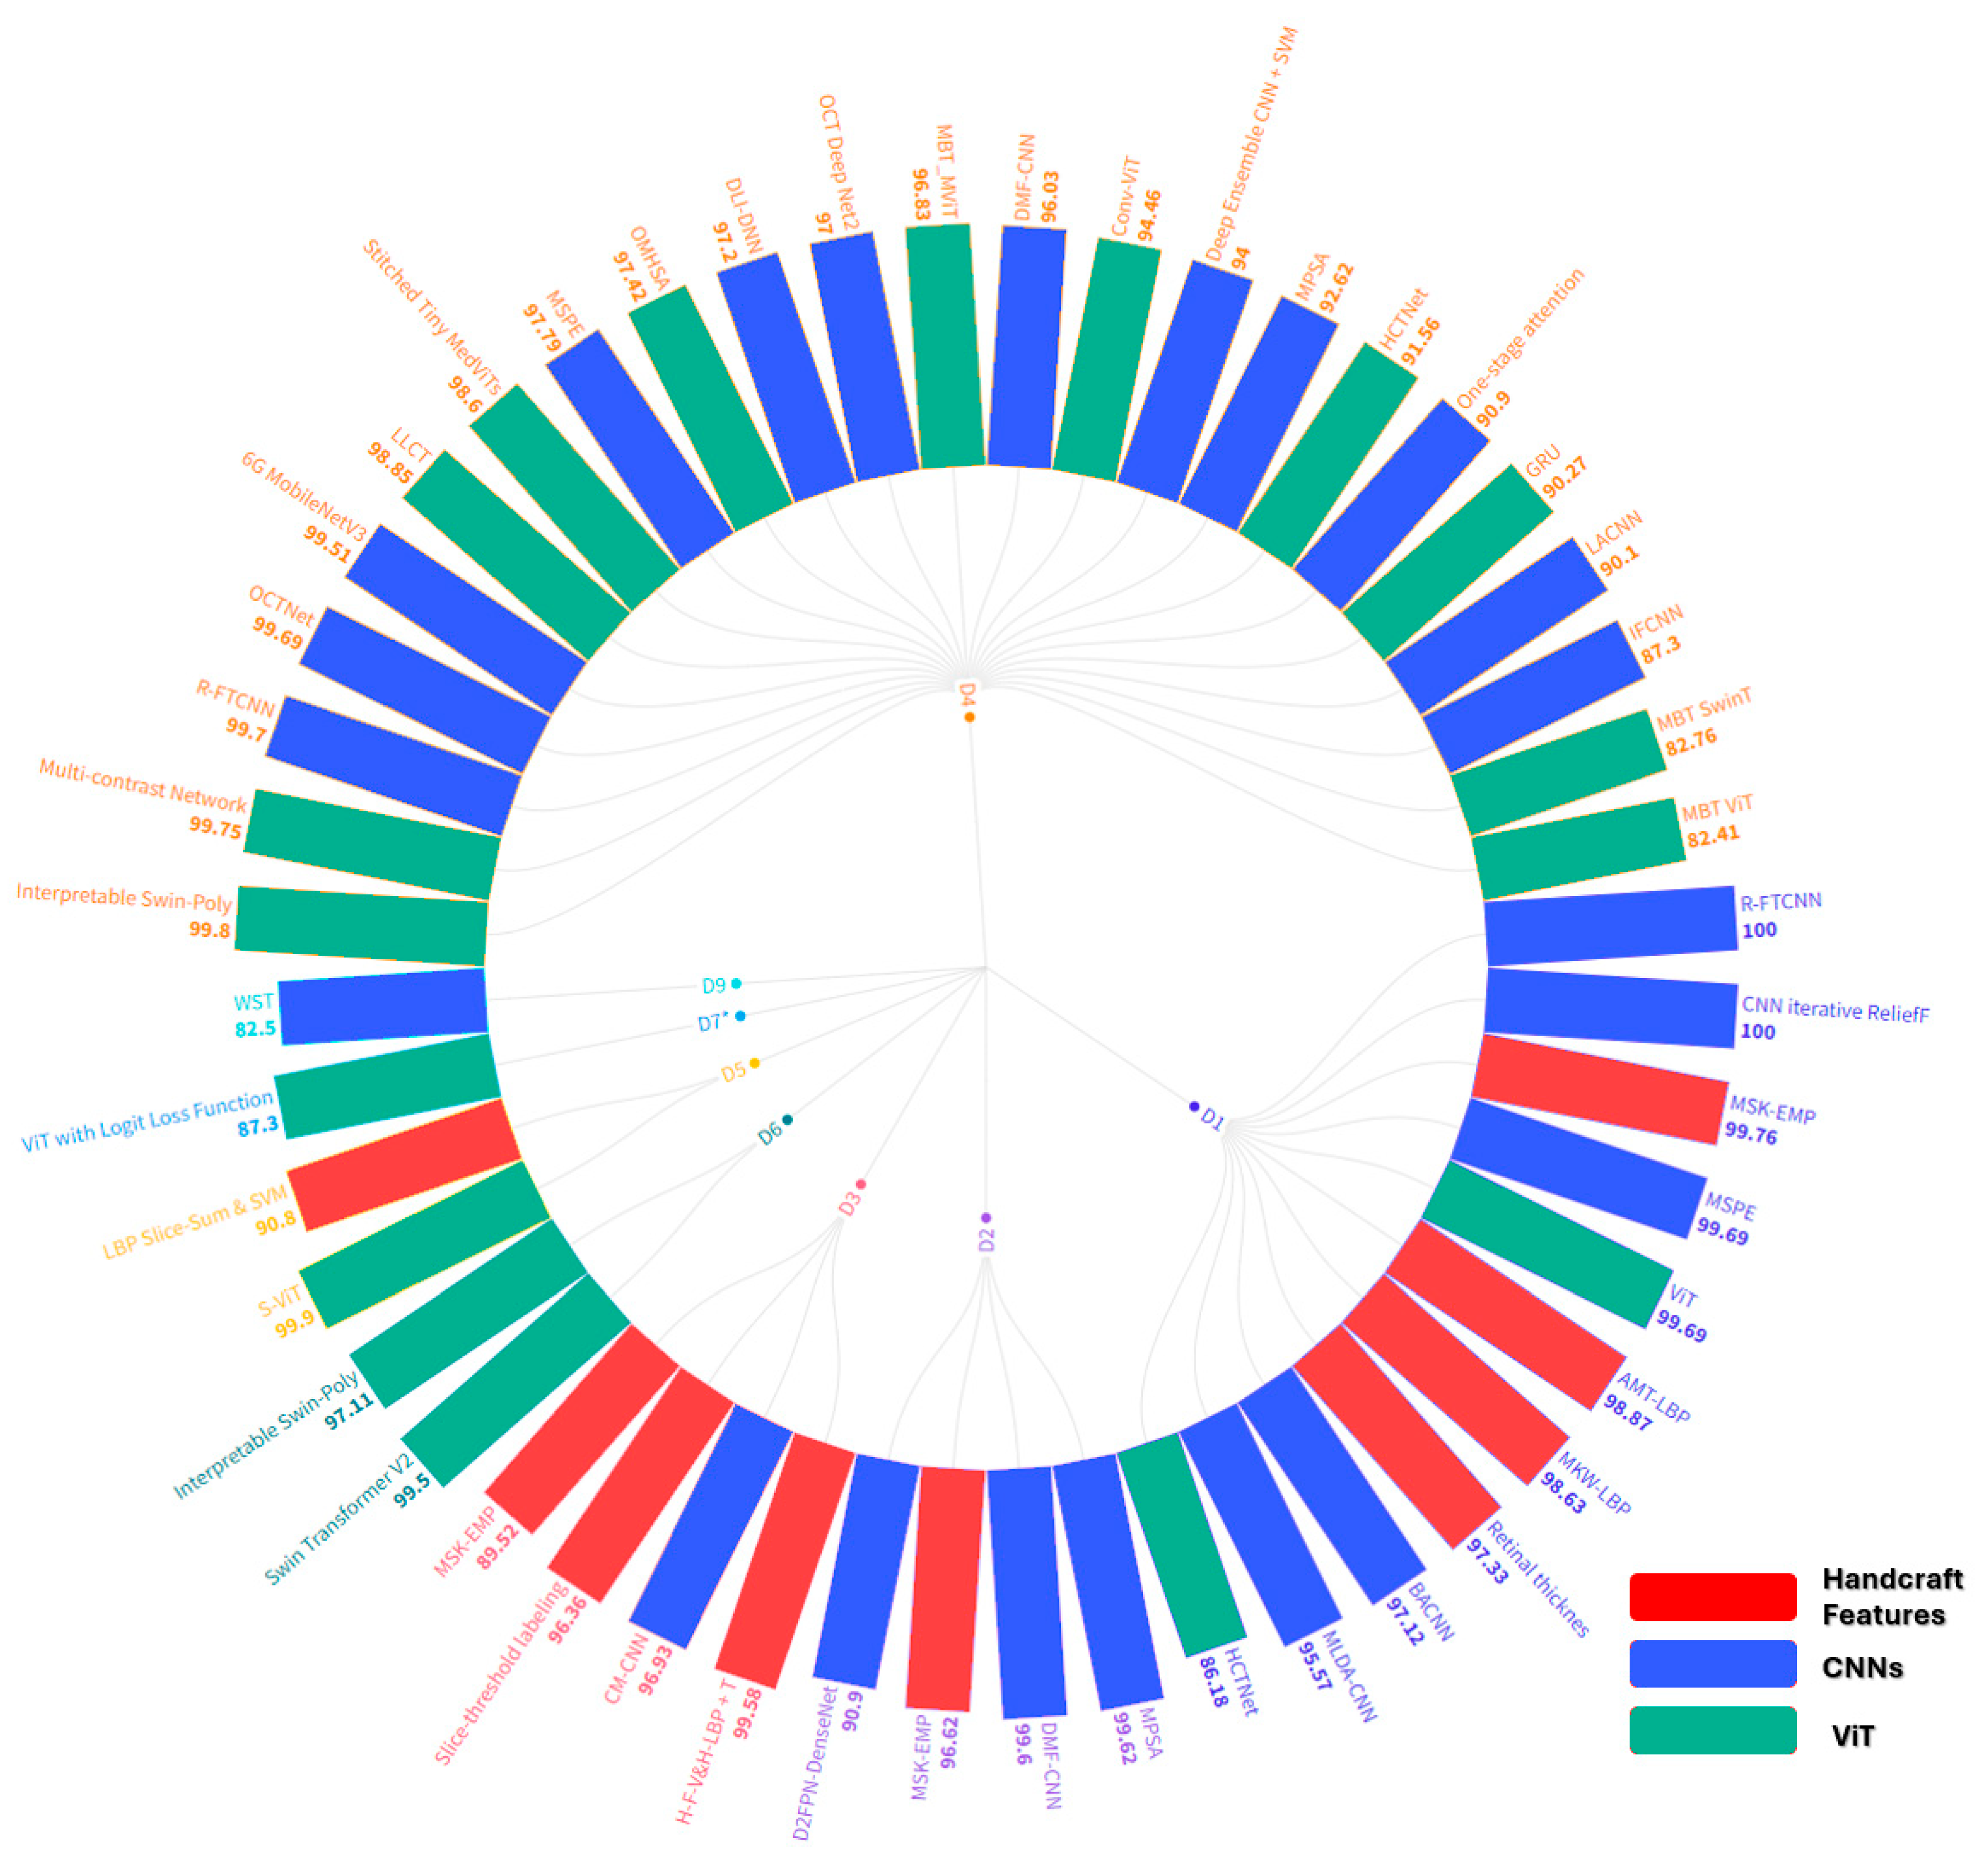
Figure 5.
Gaussian, salt and pepper, uniform, speckle and Rayleigh noise (by rows) are added to the Normal, AMD, and DME (by columns), where first column are the originals. Images taken from D1.
Figure 5.
Gaussian, salt and pepper, uniform, speckle and Rayleigh noise (by rows) are added to the Normal, AMD, and DME (by columns), where first column are the originals. Images taken from D1.
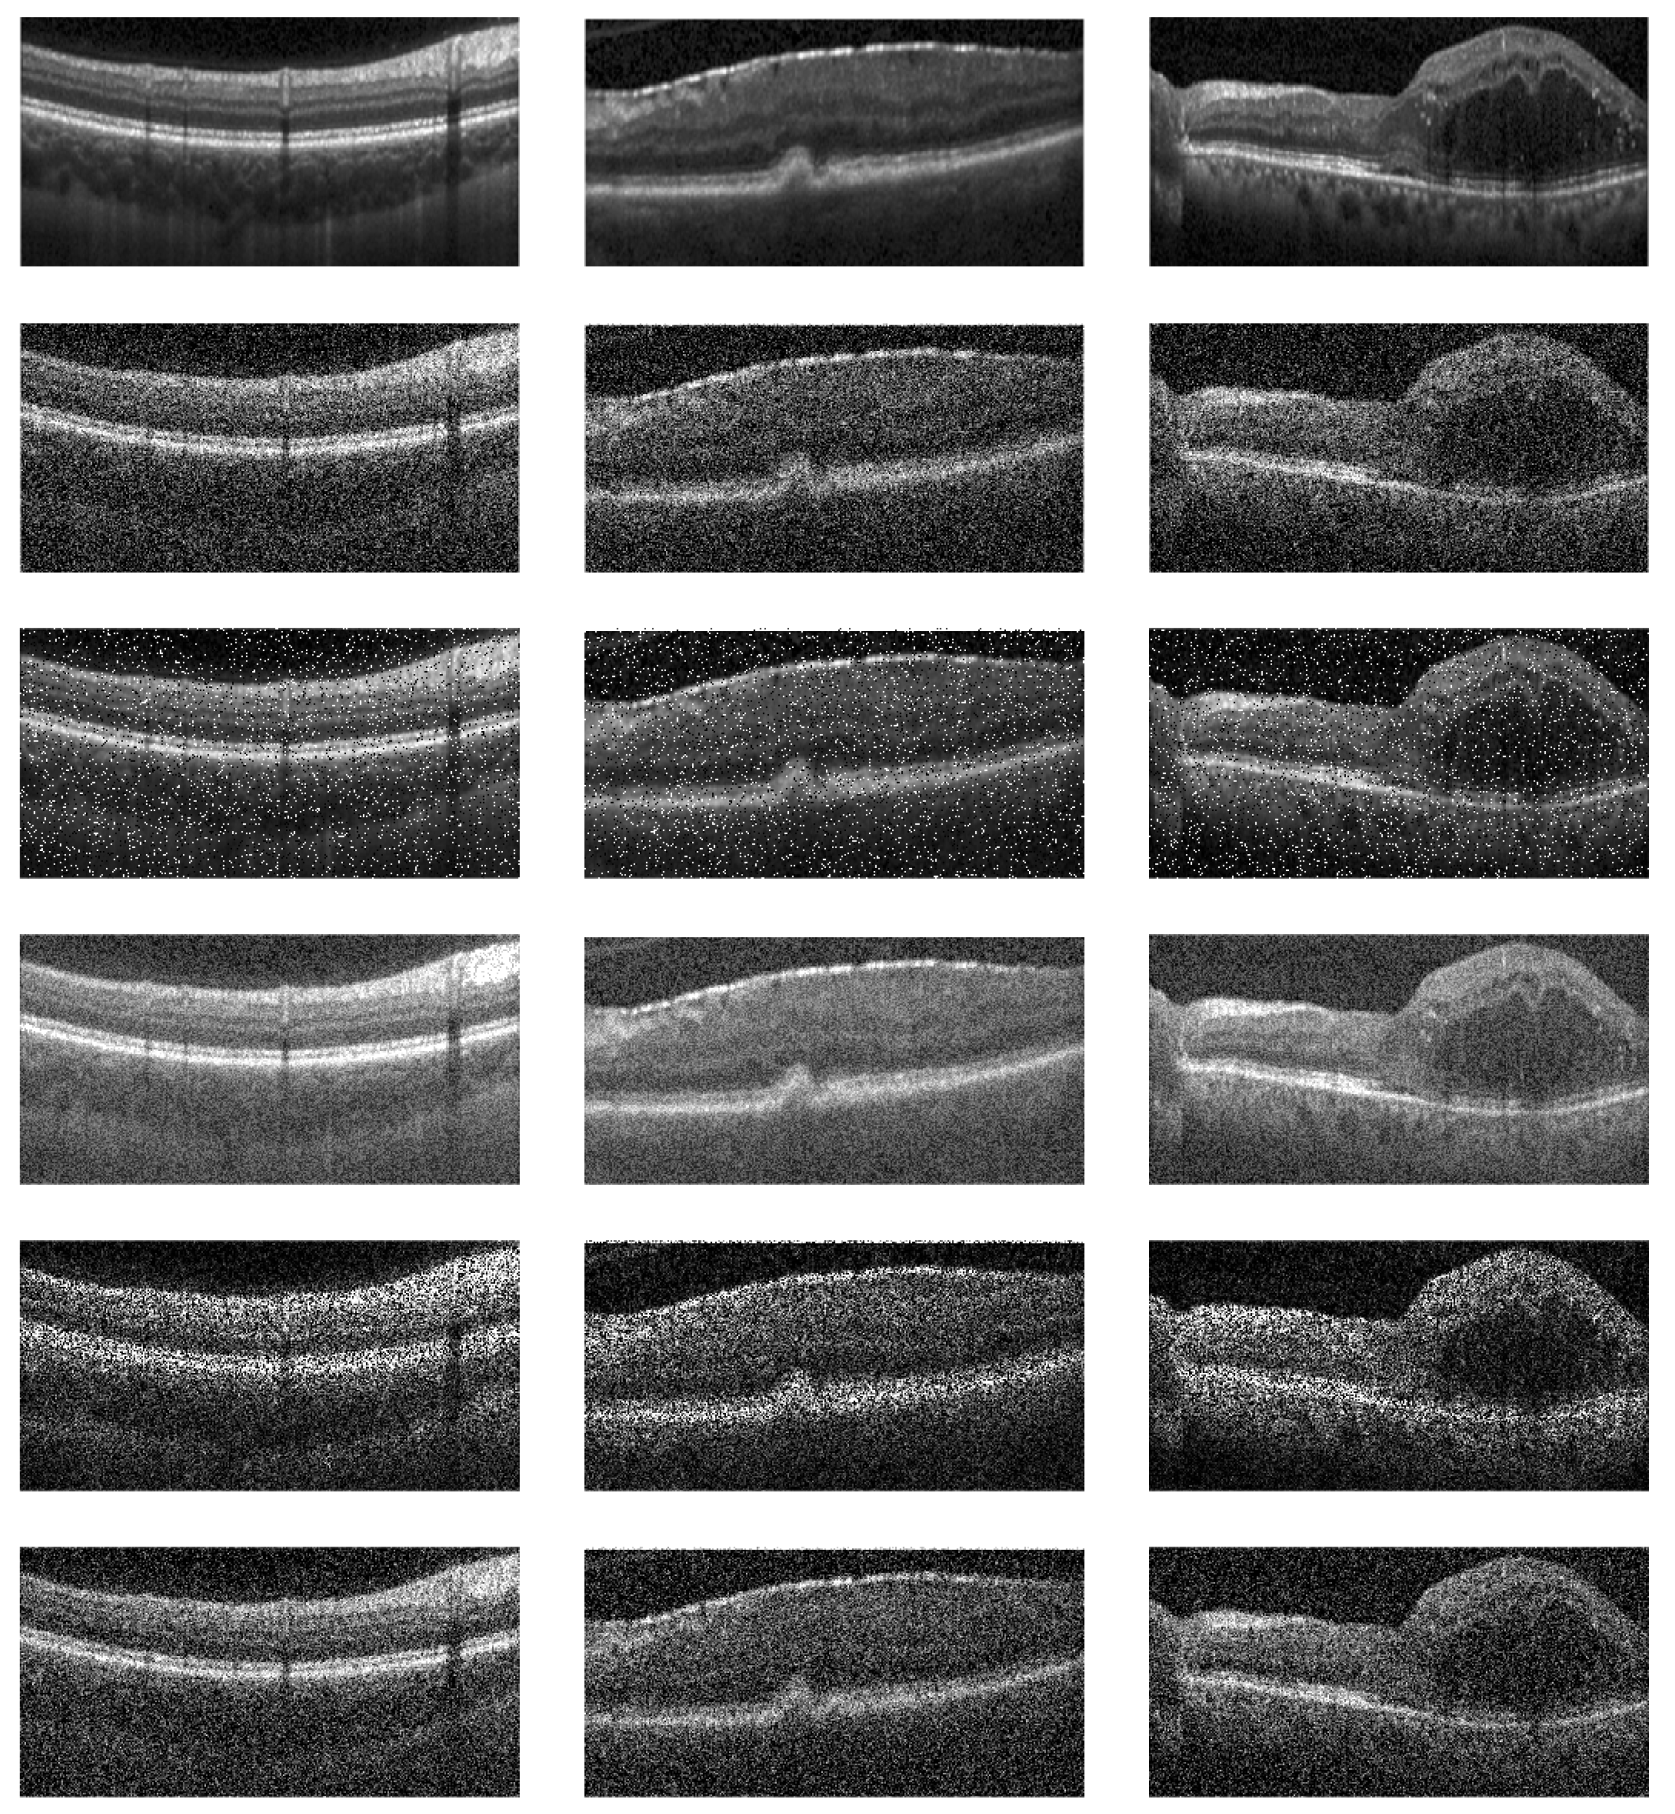

Table 1.
compares our survey against others in the area of OCT image classification for Ocular disorders.
Table 1.
compares our survey against others in the area of OCT image classification for Ocular disorders.
| Feature Comparison | [1] | [2] | [3] | [4] | [5] | [6] | [7] | [8] | [9] | [10] | [11] | [12] | OUR |
| Covers both DL and Hand-Crafted Features | - | - | - | - | - | - | - | - | - | - | ✓ | - | ✓ |
| In-depth discussion on Hand-Craft Features | - | - | - | - | - | - | - | ✓ | ✓ | - | - | - | ✓ |
| In-depth discussion on CNNs and its various types | ✓ | ✓ | ✓ | ✓ | ✓ | ✓ | ✓ | ✓ | ✓ | ✓ | ✓ | ✓ | ✓ |
| In-depth discussion on Vision Transformers | - | - | - | - | - | - | - | - | - | - | ✓ | - | ✓ |
| In-depth comparisons between types of CNNs | - | - | - | - | - | - | - | - | - | - | ✓ | ✓ | ✓ |
| Includes comparative analysis of DL and HCF | - | - | - | - | - | - | - | - | - | - | - | - | ✓ |
| Includes in-depth discussion of ocular disorders | - | - | - | - | - | - | - | - | - | - | ✓ | ✓ | - |
| Discusses latest advancements | - | ✓ | ✓ | ✓ | - | - | ✓ | ✓ | ✓ | - | ✓ | ✓ | ✓ |
| Review of multiple OCT datasets | - | - | - | - | - | - | - | - | - | - | ✓ | - | ✓ |
| Reviews specific OCT imaging technique | - | - | - | - | - | - | - | - | - | - | ✓ | ✓ | ✓ |
| Identifies gaps in current research | - | ✓ | ✓ | ✓ | ✓ | ✓ | ✓ | ✓ | ✓ | - | ✓ | ✓ | ✓ |
| Suggest future research into Adversarial Attacks | - | - | - | - | - | - | - | - | - | - | - | - | ✓ |
| Suggest future research in LLMs | - | - | - | - | - | - | - | - | - | - | - | - | ✓ |
This survey has the following contributions.
Table 2.
provides a summary of the information for each dataset.
| Dataset | Classes and Counts | Institutional Source or website |
|---|---|---|
| 1 | 15 DME volume images , 15 AMD volume images, and 15 Normal volume images | Duke University, Harvard University, and University of Michigan |
| 2 | 48 AMD volume images , 50 DME images, 50 normal images | Noor Eye Hospital in Tehran (NEH) |
| 3 | 120 Normal volume images, 160 Drusen volume images, and 161 CNV volume images, 16,822 3D OCT images Total | Noor Eye Hospital in Tehran (NEH) |
| 4* | 37,206 CNV 2D images, 11,349 DME images 8,617 Drusen 2D images, 51,140 Normal 2D images |
University of California San Diego, Guangzhou Women and Children’s Medical Center |
| 4 | Trimmed Down version of 4* referred to as OCT2017 37,455 CNV 2D images, 11,598 DME 2D images, 8,866 drusens 2D images, and 26,565 normal 2D images, total of 84,484 OCT images |
University of California San Diego, Guangzhou Women and Children’s Medical Center |
| 5 | 269 Intermediate AMD volume images and 115 Normal Volume images | Boards of from Devers Eye Institute, Duke Eye, Center, Emory Eye Center, and National Eye Institute |
| 6 | 3000 AMD images, 3000 CNV images, 3000 DME images, 3000 MH images, 3000 DR images, 3000 CSR images, 24,000 total 2D OCT images | Boards of from Devers Eye Institute, Duke Eye, Center, Emory Eye Center, and National Eye Institute |
| 7 | Normal Macular (316), Macular Edema (261), Macular Hole (297), AMD (284) | UPMC Eye Center, Eye and Ear Institute, Ophthalmology and Visual Science Research Center |
| 7* | 3319 OCT images Total, 1254 early DME, 991 advanced DME, 672 severe DME and 402 atrophic maculopathy |
Renmin Hospital of Wuhan University |
| 8 | 16 DME volume images & 16 normal volume images | Singapore Eye Research Institute (SERI) |
| 9 | Macular holes, MH (102), AMD (55), Diabetic retinopathy, DR (107), and Normal retinal images (206) | Cirrus HD-OCT machine (Carl Zeiss Meditec, Inc., Dublin, CA) at Sankara Nethralaya (SN) Eye Hospital in Chennai, India |
| 10 | 1395 samples (697 glaucoma and 698 non-glaucoma) | Zhongshan Ophthalmic Center, Sun Yat-sen University |
Table 3.
List of Hand-Crafted Methods.
| Refs | Method | Method’s Descriptions | Performance Summary |
|---|---|---|---|
| [24] | LBP Slice-Sum & SVM | Low-complexity feature vector slice-sum with SVM classifier |
D5Method: Accuracy (%), Sensitivity (%), LBP-RIU2: 90.80, 93.85, 87.72 |
| [25] | 3D-LBP | Global descriptors extracted from 2D feature image for LBP and from the 3D volume OCT image. Features are fed into classifier for predictions |
D9,VACC% F1% SE% SP% Global-LBP: 81.2 78.5 68.7 93.7 Local-LBP: 75.0 75.0 75.0 75.0 Local-LBP-TOP: 75.0 73.3 68.7 81.2 |
| [26] | HOG + LBP | Histogram of Oriented Gradients (HOG) and LBP features are extracted combined. These features are fed into linear SVM Classifier |
D9,VSens, Spec, Prec, F1, Acc. HOG: 0.69 0.94 0.91 0.81 0.78 HOG+PCA: 0.75 0.87 0.85 0.80 0.81 |
| [27] | Multi-kernel Wiener local binary patterns (MKW-LBP) | Image denoised using wiener filter. MKW-LBP descriptor calculates the mean and variance of neighboring pixels. SVMs, Adaboost, and Random Forest are used for classifications. |
D1Kernel / Classifier: Prec. (%), Sen. (%), spec. (%), Acc (%), 3 × 3 / SVM-Poly: 97.84, 97.48, 98.89, 97.86 3 × 5 / SVM-Poly: 98.84, 98.59, 99.41, 98.85 5 × 5 / SVM-Poly: 98.19, 98.05, 99.15, 98.33 |
| [28] | Multi-Size Kernels Echo-Weighted Median Patterns (MSK-EMP) | Image denoised using median filter and is flattened. MSKξMP is a variant of LBP which selects a weighted median pixel in a kernel and is applied to preprocessed image. Also employs Singular Value Decomposition and Neighborhood Component Analysis based weighted feature selection method. | Classifier: prec., sens., spec, acc D1SVM-Poly: 0.9976, 0.9971, 0.9989, 0.9978 D2SVM-Poly: 0.9662, 0.9663, 0.9833, 0.9669 D3SVM: RBF: 0.8952, 0.8758, 0.9395, 0.8887 |
| [29] | Alpha Mean trim Local Binary Patterns (AMT-LBP) | Image denoised using median filter and is flattened. AMT-LBP is a variant of LBP which encodes by averages all pixel values in a kernel omitting highest and lowest values. SVM is employed for classification |
D1SVM-Poly: tr1=0, tr2=2 || SVM-Poly: tr1=2, tr2=0 || SVM-Poly: tr1=2, tr2=2 precision 0.9796 || 0.9846 || 0.9710 sensitivity 0.9751 || 0.9813 || 0.9654 specificity 0.9887 || 0.9920 || 0.9854 accuracy 0.9774 || 0.9836 || 0.9700 F-measure 0.9773 || 0.9829 || 0.9680 AUC 0.9740 || 0.9802 || 0.9697 |
| [30] | H-F-V&H-LBP + T |
Combines discrete wavelet transform (DWT) image decomposition and LBP based texture feature extraction, and multi-instance learning (MIL). LBP is chosen for its ability to handle low contrast and low-quality images. | D3,BAcc.: 99.58% |
| [32] | Slice-chain labeling Slice-threshold labeling |
OCT B-scans of a volume image are employed where each slice is labeled and threshold, which extracts features. |
D3,BD5 – Acc.: 92.50% D3,BD5 – Acc.: 96.36% |
| [33] | Retinal thickness Method | The thickness of the retinal layers is measured, and each OCT image is classified according to the thickness. |
D3,BD1 – Acc.: 97.33%, Sen. 94.67%, Spec. 100%, F1: 97.22%, AUC: 0.99 |
| [34] | RPE layer detection and baseline estimation using statistical methods | Pixel grouping / iterative elimination, guided by layer intensities are employed to detect the RPE layer and is enhanced by randomization techniques. |
D1,VAMD Acc: 100% Normal Acc: 93.3% DME Acc: 96.6% |
| [35] | Histogram of Oriented Gradients (HOG) descriptors and SVM | Noise removal using sparsity-based block matching and 3D-filtering. HOG and SVM are employed for classification of AMD and DME. |
D1,VAMD Acc: 100% Normal Acc: 86.67% DME Acc: 100% |
| [36] | Dictionary Learning (COPAR), (FDDL), and (LRSDL) | Image denoising, flattening the retinal curvature, cropping, extracting HOG features, and classifying using a dictionary learning approach. |
D1,VD1 – AMD Acc: 100% Normal Acc: 100% DME Acc: 95.13% |
| [37] | Sparse Coding Dictionary Learning | Preprocessed retina aligning and image cropping, Then, image partitioning, feature extracting, dictionary training with sparse coding is applied to the OCT images. Linear SVM is utilized to classify images. |
D1,VD1 – AMD Acc: 100% Normal Acc: 100% DME Acc: 95.13% |
VVolume Classification, BB-scan classification, 2Two-Class Classification (Normal, DME), RI: Rotational Invariant, U2: Uniform Pattern, LBP: Local Binary Patterns, HOG: Histogram of Gradients: PCA: Principal Components Analysis: PCA, SVM-(kernel-type): Support Vector Machine (with kernel type), tr1 and tr2: Alpha Mean Trim Factors, D1D1, D2D2, D3D3, D4D4, D4*D4, D4-D4-(2750 each class), D5D5, D6D6, D7D7, D8D8, D9D9, D10D10.
Table 4.
List of CNNs Methods.
| Refs | Method | Method’s Description | Results |
|---|---|---|---|
| [38] | Hybrid Retinal Fine Tuned Convolutional Neural Network (R-FTCNN) | R-FTCNN is employed with Principal Component Analysis (PCA) used concurrently within this methodology. PCA converts the fully connected layers of the R-FTCNN into principal components, and the Softmax function is then applied to these components to create a new classification model. |
D1FC1 + PCA: Acc: 1.0000, Sen.: 1.0000, Spec.: 1.0000, Prec.: 1.0000, F1: 1.0000, AUC: 1.0000 D4FC1 + PCA: Acc: 0.9970, Sen.: 0.9970, Spec.: 0.9990, Prec.: 0.9970, F1: 0.9970, AUC: 0.99999 (61mil-parameters) |
| [39] | Complementary Mask Guided Convolutional Neural Network (CM-CNN) | CM-CNN classifies OCT B-scans by using masks generated from a segmentation task. A Class Activation Map Guided UNet (CAM-UNet) segments drusen and CNV lesions, utilizing CAM output from the CM-CNN |
D3AUC, Sen, Spe, Class Acc D3CNV: 0.9988, 0.9960, 0.9680, 0.9773 D3Drusen 0.9874, 0.9120, 0.9980, 0.9693 D3Normal 0.9999, 1, 0.9880, 0.9920 D3Overall Acc: 0.9693 |
| [40] | CNN iterative ReliefF + SVM |
DeepOCT employs multilevel feature extraction using 18 pre-trained networks combined with tent maximal pooling, followed by feature selection using ReliefF. |
D1Acc:1.00, Pre:1.00, F1:1.00, Rec:1.00, MCC:1.00 4**Acc: 0.9730, Pre: 0.9732, F1: 0.9730, Rec: 0.9730, MCC: 0.9641 |
| [41] | Inception V3 – Custom Fully Connected layers | Eliminating the final layers of a pre-trained Inception V3 model and using the remaining part as a fixed feature extractor. | D1,VAMD 15/15 = 100%, DME 15/15 = 100%, NOR 15/15 = 100% |
| [42] | AOCT-NET | Utilizes a softmax classifier to distinguish between five retinal conditions: AMD, CNV, DME, drusen, and normal cases |
4+5AMD: 100%, 100%; CNV: 98.64%, 100%; DME: 99.2%, 0.96; Drusen: 97.84%, 0.92; Normal: 98.56%, 0.97 |
| [43] | Iterative fusion convolutional neural network (IFCNN) | Employs iterative fusion for merging features from the current convolutional layer with those from all preceding layers in the network. |
D4Sensitivity., Specificity, Accuracy Drusen 76.8 ± 7.2, 94.9 ± 1.9, 93 ± 1.7 87.3 ± 2.2; CNV 87.9 ± 4.3, 96 ± 1.7, 92.4 ± 1.3, DME 81.9 ± 6.8, 96.3 ± 2, 94.4 ± 1, Normal 92.2 ± 4.7 96 ± 1.6 94.8 ± 1.2. |
| [44] | IoT OCT Deep Net2 | Expands from 30 to 50 layers and features a dense architecture with three recurrent modules |
D4Precision, Recall, F1-Score, Acc. 0.97 Normal:0.99, 0.93, 0.96, CNV: 0.95, 0.98, 0.98, DME: 0.96, 0.99, 0.98, Drusen: 0.99, 1.00, 0.99 |
| [45] | Capsule Network | Composed of neuron groups representing different attributes, utilizes vectors to learn positional relationships between image features. |
D4Sensitivity, Specificity, Precision, F1 CNV: 1.0, 0.9947, 1.0, 1.0, DME: 0.992, 0.9973, 0.992, 0.992, Drusen: 0.992, 0.9973, 0.992, 0.992, Normal: 1.0, 1.0, 1.0, 1.0 |
| [46] | Dictionary Learning Informed Deep Neural Network (DLI-DNN) | Downsampling by utilizing DAISY descriptors and Improved Fisher kernels to extract features from OCT images. | D4Accuracy: 97.2%, AUC: 0984, Sensitivity: 97.1%, Specificity: 99.1% |
| [47] | S-DDL – 4 classes Wavelet Scattering Transform (WST) – 5 classes |
S-DDL addresses the vanishing gradient problem and shortens training time. WST employs the Wavelet Scattering Transform using predefined filters within the network layers |
D9CSR-Acc: 0.7609, Sen: 0.2381, Spec: 0.9155 D9AMD-Acc: 0.9186, Sens: 0.8182, Spec: 0.9333 D9MH-Acc: 0.8, Sens: 0.7, Spec: 0.8308 D9NO-Acc: 0.9326, Sens: 0.9512, Spec: 0.9167 D9AMD-Acc: , Sens: 1.0, Spec: 0.9216 D9CSR-Acc: 0.9057, Sen: 0.7273, Spec: 0.9524 D9DR-Acc: 0.9038, Sens: 0.8889,Spec: 0.9060 D9MH-Acc: 0.9038, Sens: 0.6923, Spec: 0.9744 D9NO-Acc: 0.9792, Sens: 0.9545, Spec: 1.0, OA: 82.5% |
| [48] | Multiple instance learning (UD-MIL) | Employs instance-level classifier for iteratively deep multiple instance learning, where this enables the classifier. Then a recurrent neural network (RNN) utilizes the features from those instances to make the final predictions. |
D5Accuracy, F1, AUC μ=0.1, 0.971 ± 0.010, 0.980 ± 0.007, 0.955 ± 0.020 μ=0.2, 0.979 ± 0.018, 0.986 ± 0.012, 0.970 ± 0.027 μ=0.3, 0.979 ± 0.018, 0.986 ± 0.012, 0.970 ± 0.027 μ=0.4, 0.979 ± 0.011, 0.986 ± 0.007, 0.975 ± 0.020 μ=0.5, 0.979 ± 0.011, 0.986 ± 0.007, 0.975 ± 0.020 |
VVolume Classification, BB-scan classification, 2CTwo-Class Classification (Normal, DME), D1D1, D2D2, D3D3, D4D4, D4*D4, D5D5, D6D6, D7D7, D8D8, D9D9, D10D10.
Table 5.
List of CNN with Attention, Ensemble, Multi-scale and Augmentation Methods.
| Refs. | Method | Method’s Descriptions | Results | |||||||
|---|---|---|---|---|---|---|---|---|---|---|
| [50] | Lesion-aware convolutional neural network (LACNN) | LACNN concentrates on local lesion-specific regions by utilizing a lesion detection network to generate a soft attention map over the entire OCT image. | D4 | Acc | Prec | |||||
| Drusen | 93.6 ± 1.4 | 70.0 ± 5.7 | ||||||||
| CNV | 92.7 ± 1.5 | 93.5 ± 1.3 | ||||||||
| DME | 96.6 ± 0.2 | 86.4 ± 1.6 | ||||||||
| Normal | 97.4 ± 0.2 | 94.8 ± 1.1 | ||||||||
|
D4Overall ACC: 90.1 ± 1.4, Overall Sensitivity: 86.8 ± 1.3 D2Overall Sensitivity: 99.33 ± 1.49, Overall PR: 99.39 ± 1.36, F1, 99.33 ± 1.49, AUC: 99.40 ± 1.34 | ||||||||||
| [51] | Multi-Level Dual-Attention Based CNN (MLDA-CNN) | A dual-attention mechanism is applied at multiple levels a CNN and integrates multi-level feature-based attention emphasizes high-entropy regions within the finer features. |
D1Acc: 95.57, Prec: 95.29, Recall: 96.04, F1: 0.996 D2Acc: 99.62 (+/- 0.42), Prec: 99.60 (+/- 0.39), Recall: 99.62 (+/- 0.42), F1: 0.996, AUC: 0.9997 |
|||||||
| [52] | Multilevel Perturbed Spatial Attention (MPSA) & Multidimension Attention (MDA) | MPSA emphasizes key regions in input images and intermediate network layers by perturbating to the attention layers. MDA captures the information across different channels of the extracted feature maps. |
D1Acc: 100%, Prec: 100%, Recall: 100% D2Acc: 99.79 (+/- 0.43), Prec: 99.80 (+/- 0.41), Recall: 99.78 (+/- 0.43) D4Acc: 92.62 (+/- 1.69), Prec: 89.96 (+/- 3.16), Recall: 88.53 (+/- 3.26) |
|||||||
| [53] | One-stage attention-based framework weakly supervised lesion segmentation | One-stage attention-based classification and segmentation, where the classification network generates a heatmap through Grad-CAM and integrates the proposed attention block. | D4 | Acc | SE | Spec | ||||
| CNV | 93.6 ± 1.9 | 90.1 ± 3.8 | 96.5 ± 1.4 | |||||||
| DME | 94.8 ± 1.2 | 86.5 ± 1.5 | 96.4 ± 2.1 | |||||||
| DRUSEN | 94.6 ± 1.4 | 71.5 ± 4.8 | 96.9 ± 1.2 | |||||||
| NORMAL | 97.1 ± 1.0 | 96.3 ± 1.5 | 98.9 ± 0.3 | |||||||
| D4OA: 90.9 ± 1.0, OS: 86.3 ± 1.8, OP: 85.5 ± 1.6 | ||||||||||
| [54] | Efficient Global Attention Block (GAB) and Inception | GAB generates an attention map across three dimensions for any intermediate feature map and computes adaptive feature weights by multiplying the attention map with the input feature map. |
D4*Accuracy: 0.914, Recall: 0.9141, Specificity: 0.9723, F1: 0.915, AUC: 0.9914 |
|||||||
| [55] | B-scan attentive convolutional neural network (BACNN) | BACNN employs a self-attention module to aggregate extracted features based on their clinical significance, producing high-level feature vector for diagnosis. | D1Sen: 97.76 ± 2.07, Spec: 95.61 ± 4.35, Acc: 97.12 ± 2.78, | |||||||
| D2 | Sens. | Spec. | Acc. | |||||||
| AMD | 92.0 ± 4.4 | 95.0 ± 0.1 | 93.2 ± 2.7 | |||||||
| DME | 100.0 ± 0.0 | 98.9 ± 2.4 | 99.3 ± 1.5 | |||||||
| Normal | 87.8 ± 4.3 | 93.2 ± 2.3 | 92.2 ± 2.3 | |||||||
| [56] | 6G-enabled IoMT method – MobileNetV3 | Leverages transfer learning for feature extraction and optimized through feature selection using Hunger Games search algorithm. | D4 | Acc. | Recall | Prec | ||||
| SVM | 99.69 | 99.69 | 99.69 | |||||||
| XGB | 99.38 | 99.38 | 99.4 | |||||||
| KNN | 99.59 | 99.59 | 99.59 | |||||||
| RF | 99.38 | 99.38 | 99.4 | |||||||
| [57] | Deep Ensemble CNN + SVM, Naïve Bayes, Artificial Neural Network | A secondary layer within the CNN model to extract key feature descriptors, where they are subsequently concatenated and fed into a supervised hybrid classifier SVM and naïve Bayes models |
D4Sensivity, Specificity, Accuracy ANN: 0.96, 0.90, 0.93 || SVM: 0.94, 0.91, 0.91 NB: 0.93, 0.90, 0.91 || Ensemble: 0.97, 0.92, 0.94 |
|||||||
| [58] | Multi-scale deep feature fusion (MDFF) CNN | MDFF technique captures inter-scale variations in the images, providing the classifier with discriminative information | D4 | Sens. | Spec. | Acc. | ||||
| CNV | 96.6 | 98.73 | 97.78 | |||||||
| DME | 94.14 | 98.97 | 98.33 | |||||||
| DR | 90.49 | 98.32 | 97.52 | |||||||
| NO | 96.9 | 89.26 | 97.85 | |||||||
| [59] | Multiscale and multipath CNN with six convolutional layers | MDFF captures variations across different scales and are fed into a classifier | Precision | Recall | Accu. | |||||
| D1-2C | 0.969 | 0.967 | 0.9666 | |||||||
| D2-2C | 0.99 | 0.99 | 0.9897 | |||||||
| D4-2C | 0.998 | 0.998 | 0.9978 | |||||||
| [60] | Multiscale CNN with seven convolutional layers | The architecture consists of a multiscale CNN with seven convolutional layers allowing for the generation of numerous local structures with various filter sizes | Precision Recall F1-score Accuracy AUC D1-2C 0.9687, 0.9666, 0.9666, 0.9667, 1.0000 D2-2C 0.9803, 0.9795, 0.9795, 0.9795, 0.9816 D4-2C 0.9973, 0.9973, 0.9973, 0.9973, 0.9999 D9-2C 0.9810 0.9808 0.9809 0.9808 0.9971 |
|||||||
| [61] | Multi-scale CNN based on the feature pyramid network | Combines a feature pyramid network (FPN) and by utilizing multi-scale receptive fields providing end-to-end training | Accuracy (%) Sensitivity (%) Specificity (%) D2FPN-VGG16: 92.0 ± 1.6, 91.8 ± 1.7, 95.8 ± 0.9 D2FPN-ResNet50: 90.1 ± 2.9, 89.8 ± 2.8, 94.8 ± 1.4 D2FPN-DenseNet: 90.9 ± 1.4, 90.5 ± 1.9, 95.2 ± 0.7 D2FPN-EfficientNetB0: 87.8 ± 1.3, 86.6 ± 1.8, 93.3 ± 0.8 D4FPN-VGG16: 98.4, 100, 97.4 |
|||||||
| [62] | Multi-scale (pyramidal) feature ensemble architecture (MSPE) | A multi-scale feature ensemble architecture employing a scale-adaptive neural network generates multi-scale inputs for feature extraction and ensemble learning. |
D1Acc= 99.69%, Sen= 99.71%, Spec.= 99.87% D4Accy=97.79%, Sen=95.55%, Spec.=99.72% |
|||||||
| [63] | Multi-scale convolutional mixture of expert (MCME) ensemble model | MCME model utilizes a cost function for feature learning by applying CNNs at multiple scales. Maximizing a likelihood function for the training dataset and ground truth using a Gaussian mixture model. |
D2Precision: 99.39 ± 1.21, Recall: 99.36 ± 1.33, F1: 99.34 ± 1.34, AUC: 0.998 |
|||||||
| [64] | Deep Multi-scale Fusion CNN (DMF-CNN) | DMF-CNN uses multiple CNNs with varying receptive fields to extract scale-specific features which are then extract cross-scale features. Additionally, a joint scale-specific and cross-scale multi-loss optimization strategy is employed. |
D2Sensitivity (%), Precision (%), F1 Score, OS, OP/OF1 AMD: 99.62 ± 0.27, 99.54 ± 0.17, 99.58 ± 0.16, 99.58 ± 0.23 DME: 99.45 ± 0.59, 99.45 ± 0.38, 99.45 ± 0.35, 99.59 ± 0.20 Normal: 99.68 ± 0.22, 99.75 ± 0.41, 99.71 ± 0.20, 99.60 ± 0.22 OA: 99.60 ± 0.21, AUC: 0.997 ± 0.002 D4Sensitivity (%), Precision (%), F1 Score CNV: 97.33 ± 1.05, 97.05 ± 1.19, 97.18 ± 0.32 DME: 93.22 ± 3.22, 96.26 ± 2.17, 94.65 ± 1.09 Drusen: 89.29 ± 3.59, 87.73 ± 3.84, 88.34 ± 1.27 Normal: 97.62 ± 1.11, 97.49 ± 1.30, 97.55 ± 0.49, OS/OP/OF1/OA: 94.37 ± 1.16, 94.64 ± 0.90, 94.43 ± 0.59, 96.03 ± 0.43 |
|||||||
| [65] | Surrogate-assisted CNN | Denoising, thresholding and morphological dilation are performed on images to create masks, which produce surrogate images for training the CNN model. |
D1Denoised: Acc: 95.09%, Sen. 96.39%, Spec: 93.60% D1Surrogate: Acc: 95.09%, Sen. 96.39%, Spec: 93.60% |
|||||||
| [66] | CNN and Semi-supervised GAN | D2 | Sen (%) | Spec (%) | Acc (%) | |||||
| AMD | 98.38 ± 0.69 | 97.79 ± 0.68 | 97.98 ± 0.61 | |||||||
| DME | 96.96 ± 1.32 | 99.23 ± 0.36 | 98.61 ± 0.49 | |||||||
| Normal | 96.96 ± 0.73 | 99.12 ± 0.64 | 98.26 ± 0.67 | |||||||
| OS/OSp/OA: 97.43 ± 0.68, 98.71 ± 0.34, 97.43 ± 0.66 | ||||||||||
VVolume Classification, BB-scan classification, 2CTwo-Class Classification (Normal, DME), D1D1, D2D2, D3D3, D4D4, D4*D4, D5D5, D6D6, D7D7, D8D8, D9D9, D10D10, OA: Overall Accuracy, OS: Overall Sensitivity, OP: Overall Precision, OF1: Overall F1 1-2C#: Binary classifications with AMD and Normal classes, NB: Naïve Bayes, RF: Random Forest, Support Vector Machine: SVM.
Table 6.
List of Transformer Methods employed.
| Refs. | Method | Method’s Descriptions | Results | ||||||
|---|---|---|---|---|---|---|---|---|---|
| [68] | Hybrid ConvNet-Transformer network (HCTNet) | HCT-Net employs feature extraction modules via residual dense block. Next, two parallel branches, a Transformer and ConvNet are utilized to capture both global and local contexts in the OCT images. A feature fusion module with an adaptive reweighting mechanism integrates these global and local features. | D1 | Acc. (%) | Sen. (%) | Prec. (%) | |||
| AMD | 95.94 | 82.6 | 95.08 | ||||||
| DME | 86.61 | 80.22 | 85.29 | ||||||
| Normal | 89.81 | 93.39 | 85.22 | ||||||
| OA: 86.18%, OS: 85.40%, OP: 88.53% | |||||||||
| D4 | Acc (%) | Sen. (%) | Prec. (%) | ||||||
| CNV | 94.6 | 92.23 | 95.53 | ||||||
| DME | 96.14 | 87.96 | 84.42 | ||||||
| Drusen | 95.54 | 77.36 | 79.00 | ||||||
| Normal | 96.84 | 96.73 | 93.5 | ||||||
| OA: 91.56%, OS: 88.57%, OP: 88.11% | |||||||||
| [69] | Interpretable Swin-Poly Transformer network | Swin-Poly Transformer shifts window partitions and connects adjacent non-overlapping windows from the previous layer, allowing it to flexibly capture multi-scale features. The model refines cross-entropy by adjusting the importance of polynomial bases, thereby improving the accuracy of retinal OCT image classification. | D4 | Acc. | Prec. | Recall | |||
| CNV | 1.0000 | 0.9960 | 1.0000 | ||||||
| DME | 0.9960 | 1.0000 | 0.9960 | ||||||
| Drusen | 1.0000 | 0.9960 | 1.0000 | ||||||
| Normal | 0.9960 | 1.0000 | 0.9960 | ||||||
| Ave. | 0.9980 | 0.9980 | 0.9980 | ||||||
| D6 | Acc. | Prec. | Recall | ||||||
| AMD | 1.0000 | 1.0000 | 1.0000 | ||||||
| CNV | 0.9489 | 0.9389 | 0.9571 | ||||||
| CSR | 1.0000 | 1.0000 | 1.0000 | ||||||
| DME | 0.9439 | 0.9512 | 0.9457 | ||||||
| DR | 1.0000 | 0.9972 | 1.0000 | ||||||
| Drusen | 0.9200 | 0.9580 | 0.9114 | ||||||
| MH | 1.0000 | 1.0000 | 0.9971 | ||||||
| Normal | 0.9563 | 0.9254 | 0.9571 | ||||||
| Ave. | 0.9711 | 0.9713 | 0.9711 | ||||||
| [70] | Focused Attention Transformer | Focused Attention employs iterative conditional patch resampling to produce interpretable predictions through high-resolution attribution maps. | D4* | Acc. (%) | Spec. (%) | Recall (%) | |||
| T2T-ViT_14 | 94.40 | 98.13 | 94.40 | ||||||
| T2T-ViT_19 | 93.20 | 97.73 | 93.20 | ||||||
| T2T-ViT_24 | 93.40 | 97.80 | 93.40 | ||||||
| [71] | ViT with Logit Loss Function | Captures global features via self-attention mechanism reducing reliance on local texture features. Adjusting classifier’s logit weights and modified to a logit cross-entropy function with L2 regularization as loss function. | D7* | Acc (%) | Sen. (%) | Spec. (%) | |||
| Early DME | 90.87 | 87.03 | 93.02 | ||||||
| Advanced DME | 89.96 | 88.18 | 90.72 | ||||||
| Severe DME | 94.42 | 63.39 | 98.4 | ||||||
| maculopathy | 95.13 | 89.42 | 96.66 | ||||||
| OA: 87.3% | |||||||||
| [72] | Model-Based ViT (MBT-ViT), Model-Based ViT (MBT-SwimT), Multi-Scale Model-Based ViT (MBT-ViT) |
Approximate sparse representation MBT utilizes ViT Swin ViT and Multiscale ViT for OCT video classification. Then estimates key features before performing data classification. | D4 | Acc. | Recall | ||||
| MBT ViT | 0.8241 | 0.8138 | |||||||
| MBT SwinT | 0.8276 | 0.8172 | |||||||
| MBT_MViT | 0.9683 | 0.9667 | |||||||
| [73] | Structure-Oriented Transformer (SoT) |
SoT employs guidance mechanism that acts as a filter to emphasize the entire retinal structure. Utilizes Vote Classifier, which optimizes the utilization of all output tokens to generate the final grading results. | B-acc | Sen | Spe | ||||
| D1SoT | 0.9935 | 0.9925 | 0.9955 | ||||||
| D5 SoT | 0.9935 | 0.9925 | 0.9955 | ||||||
| [74] | OCT Multihead Self-Attention (OMHSA) | OMHSA enhances self-attention mechanism by incorporating local information extraction, where a network architecture, called OCTFormer and is built by repeatedly stacking convolutional layers and OMHSA blocks at each stage. | D4 | ACC | Prec. | Sen. | |||
| OCT Former-T |
94.36 | 94.75 | 94.37 | ||||||
| OCT Former-S |
96.67 | 96.78 | 96.68 | ||||||
| OCT Former-B |
97.42 | 97.47 | 97.43 | ||||||
| [75] | Squeeze Vision transformer (S-ViT) |
SViT combines SqueezeNet and ViT to capture local and global features, which enables more precise classification while maintaining lower computational complexity. |
D5 Acc.: 0.9990, Sen.: 0.9990, Prec.: 1.000 |
||||||
| [22] | Deep Relation Transformer (DRT) | DRT integrates both OCT and Vision Field (VF) data, where this model incorporates a deep reasoning mechanism to identify pairwise relationships between OCT and VF. | D10Ablation Study | ||||||
| Back-bone | Acc (%) | Sen (%) | Spec (%) | ||||||
| Light ResNet | 88.3±1.0 | 93.7±3.5 | 82.4±4.1 | ||||||
| ResNet-18 | 87.6±2.3 | 93.1±2.4 | 82.1±4.3 | ||||||
| ResNet-34 | 87.2±1.6 | 90.4±5.0 | 83.9±3.6 | ||||||
| [76] | Conv-ViT – inception V3 and ResNet50 | Integrates Inception-V3 and ResNet-50 to capture texture information by evaluating the relationships between nearby pixels. A Vision Transformer processes shape-based features by analyzing correlations between distant pixels. | D4 | Feature Level Concatenation |
Decision Level Conc. |
||||
| Acc. | 94.46% | 87.38% | |||||||
| Prec. | 0.94 | 0.87 | |||||||
| Recall | 0.94 | 0.86 | |||||||
| F1 Score | 0.94 | 0.86 | |||||||
| [77] | Multi-contrast Network |
ViT Cross-modal multi-contrast network integrates color fundus photographs (CFP), which utilizes multi-contrast learning to extract features. Then a channel fusion head then aggregates across different modalities. | D4 | Acc (%) | SE (%) | SP (%) | |||
| Normal | 99.5 | 99.38 | 100 | ||||||
| CNV | 100 | 100 | 100 | ||||||
| DR | 99.5 | 100 | 99.42 | ||||||
| AMD | 100 | 100 | 100 | ||||||
| All | 99.75 | 99.84 | 99.85 | ||||||
| [78] | Swin Transformer V2 with Poly Loss function | Swin Transformer V2-based leverages self-attention within local windows while using a PolyLoss function | D4 | Acc. | Recall | Spec. | |||
| CNV | 0.999 | 1.00 | 0.996 | ||||||
| DME | 0.999 | 1.00 | 1.00 | ||||||
| DRUSEN | 1.00 | 1.00 | 1.00 | ||||||
| NORMAL | 1.00 | 1.00 | 1.00 | ||||||
| D6 | Acc. | Recall | Spec. | ||||||
| AMD | 1.00 | 1.00 | 1.00 | ||||||
| CNV | 0.989 | 0.949 | 0.995 | ||||||
| CSR | 1.00 | 1.00 | 1.00 | ||||||
| DME | 0.992 | 0.977 | 0.995 | ||||||
| DR | 1.00 | 1.00 | 1.00 | ||||||
| DRUSEN | 0.988 | 0.934 | 0.995 | ||||||
| MH | 1.00 | 1.00 | 1.00 | ||||||
| NORMAL | 0.991 | 0.98 | 0.992 | ||||||
| [79] | Lesion-localization convolution transformer (LLCT) |
LLCT combines CNN-extracted feature maps with a self-attention network to capture both local and global image context. The model uses backpropagation to adjust weights, enhancing lesion detection by integrating global features from forward propagation. | D4 | Acc (%) | Sens (%) | Spec. (%) | |||
| CNV | 98.1 ± 1.9 | 99.4 ± 0.3 | 97.6 ± 2.7 | ||||||
| DME | 99.6 ± 0.2 | 99.6 ± 0.0 | 99.5 ± 0.3 | ||||||
| Drusen | 98.1 ± 2.3 | 92.8 ± 8.5 | 99.9 ± 0.2 | ||||||
| Norm | 99.6 ± 0.6 | 98.8 ± 1.7 | 99.9 ± 0.2 | ||||||
| [80] | Stitched MedViTs | Stitching approach combines two MedViT models to find an optimal architecture. This method inserts a linear layer between pairs of stitchable layers, with each layer selected from one of the input models, creating a candidate model in the search space. | D4 | Spec. | Acc. | ||||
| micro MedViT | 0.928 ± 0.002 | 0.828 ± 0.007 | |||||||
| tiny MedViT | 0.933 ± 0.002 | 0.841 ± 0.007 | |||||||
| micro MedViT | 0.987 ± 0.001 | 0.977 ± 0.002 | |||||||
| tiny MedViT | 0.986 ± 0.002 | 0.977 ± 0.004 | |||||||
| [81] | Bidirectional Gated Recurrent Unit (GRU) | Combines a pre-trained Vision Transformer for slice-wise feature extraction with a bidirectional GRU to capture inter-slice spatial dependencies, enabling analysis of both local details and global structural integrity. | D4 | ACC | SEN | SPE | |||
| ResNet34 + GRU | 87.39 (± 1.73) | 92.03 | 72.86 | ||||||
| ViT-large + GRU | 90.27 (± 1.44) | 94.25 | 78.18 | ||||||
VVolume Classification, BB-scan classification, 2CTwo-Class Classification (Normal, DME), D1D1, D2D2, D3D3, D4D4, D4*D4 (full set) D5D5, D6D6, D7D7, D7*D7*, D8D8, 4**D4 (2750 each class) , D9D9, D10D10, OA: Overall Accuracy, OS: Overall Sensitivity, OP: Overall Precision, OF1: Overall F1 1-2C#: Binary classifications with AMD and Normal classes, NB: Naïve Bayes, RF: Random Forest, Support Vector Machine: SVM.
Table 7.
Provides Adversarial Samples and Techniques employed in Medical Imaging.
| Ref | Adversarial Samples introduced | Modality | Technique Employed |
|---|---|---|---|
| [27] | Gaussian Distributed Noise with various noise levels | OCT images | MKW-LBP local descriptor with SVM and Random forest classifiers |
| [86] | Pepper Noises with various noise densities | Skin Cancer Images | OS-LBP codes skin cancer images and is used to train CNN models. Trained models are employed for identifying potential skin cancer areas and to mitigate the effects of image degradation. |
| [87] | Contrast Degradations | Endoscopic Images | Encodes WCE images using CQ-MPP and is used to train CNN models. Trained are employed for identifying areas of lesions and to mitigate the effects contrast degradations. |
| [88] | Fast Gradient Sign Method (FGSM) | Skin cancer images, MRI | Adversarial Training using Inception for skin cancer classification and Brain tumors segmentations |
| [89] | FGSM Perturbations, Basic Iterative Method (BIM), Projected Gradient Descent (PGD), Carlini and Wagner (CW) Attack | Eye Fundus, Lung X-Rays, Skin Cancer images | KD models normal samples within the same class as densely clustered in a data manifold, whereas adversarial samples are distributed more sparsely outside the data manifold. LID is a metric used to describe the dimensional properties of adversarial subspaces in the vicinity of adversarial examples. |
| [94] | Frequency constraint-based adversarial attack | 3D-CT, a 2D chest X-Ray image dataset, a 2D breast ultrasound dataset, and a 2D thyroid ultrasound | A perturbation constraint, known as the low-frequency constraint, is introduced to limit perturbations to the imperceptible high-frequency components of objects, thereby preserving the similarity between the adversarial and original examples. |
| [95] | Model Ensemble Feature Fusion (MEFF) | Fundoscopy, Chest X-Ray, Dermoscopy | MEFF approach is designed to mitigate adversarial attacks in medical image applications by combining features extracted from multiple deep learning models and training machine learning classifiers using these fused features. |
| [96] | Multi-View Learning | Natural RGB Images | A multi-view classification method with an adversarial sample uses the evidential dissonance measure in subjective logic to evaluate the quality of data views when subjected to adversarial attacks. |
| [97] | Medical morphological knowledge-guided | Lung CT Scans | This approach trains a surrogate model with an augmented dataset using guided filtering to capture the model’s attention, followed by a gradient normalization-based prior knowledge injection module to transfer this attention to the main classifier. |
Disclaimer/Publisher’s Note: The statements, opinions and data contained in all publications are solely those of the individual author(s) and contributor(s) and not of MDPI and/or the editor(s). MDPI and/or the editor(s) disclaim responsibility for any injury to people or property resulting from any ideas, methods, instructions or products referred to in the content. |
© 2025 by the authors. Licensee MDPI, Basel, Switzerland. This article is an open access article distributed under the terms and conditions of the Creative Commons Attribution (CC BY) license (http://creativecommons.org/licenses/by/4.0/).
Copyright: This open access article is published under a Creative Commons CC BY 4.0 license, which permit the free download, distribution, and reuse, provided that the author and preprint are cited in any reuse.


