Submitted:
25 June 2025
Posted:
27 June 2025
You are already at the latest version
Abstract
In recent years, respiratory infectious diseases have imposed limitations on facial and fingerprint recognition technologies. Consequently, iris recognition has garnered significant attention due to its non-contact operation, accuracy, and security. To address the computational complexity and slow speed of iris localization during recognition, this study proposes an object detection method based on an improved YOLOv7-tiny model. Enhancements to the Backbone, Neck, and loss function components of the YOLOv7-tiny model resulted in improved mean Average Precision (mAP), reduced parameter count, and decreased computational load. Additionally, to mitigate edge noise interference in texture feature extraction, we refined the Local Binary Pattern (LBP) algorithm by recalculating thresholds using a center-point-integrated adjacent pixel approach, thereby enhancing image clarity. The optimized iris recognition algorithm was deployed on a Jetson Xavier NX development board to establish an embedded iris recognition system. Experimental demonstrates that the system achieves robust iris matching performance, with notable improvements in recognition accuracy, efficiency, and operational effectiveness.
Keywords:
embedded system
; iris localization
; iris recognition
; LBP algorithm
; YOLOv7-tiny
Introduction
Iris recognition is a biometric identification technology based on iris texture features, offering advantages such as stability, uniqueness, and non-contact operation. To achieve iris recognition, two critical steps are required: iris localization (accurately segmenting the iris region from an image) and iris feature extraction (enabling final identity authentication).
In iris images, significant differences in pixel grayscale values exist among the pupil, iris, and sclera. Traditional iris localization algorithms distinguish these regions based on these differences to determine iris boundaries. However, conventional methods often suffer from long localization times and high computational costs [1]. To address these challenges, researchers have proposed iris localization methods based on texture segmentation, active contour models, and circular Hough transforms [2,3]. With the rise of deep learning, iris localization technologies have undergone revolutionary advancements. In [4], an enhanced YOLOv3-based iris localization framework was proposed, leveraging DenseNet-121 as the feature extraction backbone to improve detection accuracy by strengthening multi-scale feature reuse through dense connections. Meanwhile, [5] introduced a lightweight YOLOv4 variant integrated with MobileNetV3, which employs depthwise separable convolutions and channel attention mechanisms to optimize computational efficiency, achieving real-time performance in resource-constrained embedded systems.Although these YOLO-based detectors exhibit higher accuracy and speed, their complex network structures, high computational demands, and excessive parameters limit their application in embedded devices. To balance localization accuracy and efficiency, this study adopts the lightweight YOLOv7-tiny model as the foundation for iris localization.
For iris feature extraction, extensive research has been conducted globally. Daugman utilized Gabor filters [6] to extract spatial and frequency-domain local information as iris texture features. However, Gabor transforms [7] impose strict requirements on image clarity and completeness, limiting their applicability. To overcome these constraints, literature [8] proposed a wavelet transform-based zero-crossing algorithm for iris recognition, but its inability to capture directional texture information and sensitivity to grayscale variations introduced limitations. Donald applied Discrete Cosine Transform (DCT) [9] for iris feature extraction, but DCT remains sensitive to illumination changes. To reduce illumination interference, Local Binary Pattern (LBP) algorithms have been introduced for iris feature extraction. LBP focuses on relative grayscale relationships between pixels rather than absolute values, making it less susceptible to illumination variations. Thus, this study builds upon the LBP algorithm for iris feature extraction.
In this work, to address the limitations of the YOLOv7-tiny model in complex environments, improvements are made to its Backbone, Neck, and loss function. Additionally, an enhanced LBP algorithm [10] is proposed, which recalculates thresholds by integrating adjacent points with the center point. This modification mitigates extreme value issues caused by uneven grayscale gradients in images.
1. Methodology
1.1. Improved YOLOv7-tiny Model
To enhance computational efficiency and speed while maintaining accuracy, the YOLOv7-tiny model [11] is optimized in three key aspects. The network structure of the improved model is illustrated in Figure 1.
1.1.1. Backbone Optimization
The backbone component, responsible for feature extraction from input images, comprises the Conv-BatchNorm-LeakyReLU (CBL) layers, ELAN (Efficient Layer Aggregation Network) modules, and MP (Max Pooling) layers in the YOLOv7-tiny model. While these modules maintain reasonable accuracy, their lightweight characteristics remain suboptimal, and their capability to identify comprehensive features in complex images requires further enhancement through module replacement and activation function optimization [12]. Although the combination of CBL layers and ELAN modules performs adequately in feature extraction, their high computational complexity and parameter count hinder lightweight deployment. To address these limitations, the CBL-M module’integrating CBL with MP modules-is introduced to replace the original CBL-ELAN structure. This substitution reduces computational overhead while preserving spatial information more effectively, thereby improving feature extraction efficiency.
Furthermore,the ELAN-MP module combination is replaced with the Shuffle_Block module derived from ShuffleNetV2 [13], a lightweight network architecture. This modification addresses two critical challenges: the ELAN module’s insufficient capacity to extract complex and fine-grained features, and the MP module’s tendency toward localization inaccuracies in small-object or dense scenarios. To enhance the model’s nonlinear characteristics-enabling it to learn intricate patterns and relationships within data while strengthening its capacity to transform input data into discriminative features-the PReLU (Parametric Rectified Linear Unit) activation function [14] is integrated into the Shuffle_Block module. Compared to the original LeakyReLU [15] activation function, PReLU optimizes the precision of negative-value outputs by employing learnable linear operations in the negative region. This adaptive learning of negative-axis slopes facilitates more comprehensive and accurate feature representation and information extraction.
1.1.2. Neck Optimization
The Neck component facilitates multi-scale feature fusion to enhance detection capability for targets of varying sizes. While the Neck structure in the YOLOv7-tiny model achieves scale-aware feature fusion, it demonstrates limited adaptability in complex scenarios and computational efficiency constraints. To further optimize model performance, we propose improvements to this module.
Compared with conventional convolution, Group Shuffle Convolution (GSConv) delivers superior accuracy in object detection while accelerating convergence during training. This enables the model to achieve enhanced convergence effects with fewer training epochs. During inference, GSConv accelerates data processing for faster detection speeds. We therefore replace original CBL modules with GSConv, which incorporates the swish activation function [16]. This nonlinear transformation enhances the model’s sensitivity to subtle distinctions among various data types, thereby improving discriminative capability.The ELAN module introduces redundant information due to its lack of adaptive feature selection. We adopt the VoVGSCSP1 module to address this by reducing redundant computations and strengthening feature reuse, thereby enhancing the discriminative power of feature representations.The SPPCSPC module suffers from partial information loss when processing small targets, adversely affecting detection precision. To mitigate this limitation, we implement the AIFI module [17] as a replacement. AIFI adaptively selects multi-level features for fusion, enabling the model to concurrently focus on image details and comprehend global semantics. This dual attention mechanism effectively enhances the model’s analytical capacity for image content interpretation.
1.1.3. Loss Function Optimization
In the YOLOv7-tiny algorithm, the bounding box regression loss employs the CIOU loss function, which is designed to control the accuracy of target localization. The CIOU loss function primarily considers three crucial geometric factors: overlap area, center point distance, and aspect ratio. When considering the aspect ratio of the bounding boxes, if the width-to-height aspect ratios of the predicted box and the ground truth box exhibit a linear proportion, the width and height of the predicted box cannot be simultaneously increased or decreased. In such cases, further regression optimization becomes unfeasible. To address this issue of being unable to continue regression optimization, the EIOU loss function [18] is used to replace the original CIOU loss function in the model. EIOU improves upon CIOU by separately calculating the differences in width and height instead of the aspect ratio, and it minimizes the differences in width and height between the predicted box and the ground truth box, thereby accelerating convergence and enhancing regression accuracy. This ultimately optimizes the training model and achieves faster target recognition.
Furthermore, EIOU addresses the issue of sample imbalance by incorporating the Focal Loss (focus loss function), which directs the regression process to focus on high-quality anchor boxes. After introducing Focal Loss into the EIOU loss function, a new loss function, namely Focal-EIoU Loss, is obtained, as shown in Equation (1). This loss function increases the loss of the predicted box as its overlap with the ground truth box increases. This acts as a weighting mechanism, assigning a larger loss to better regression targets, which helps to improve the regression accuracy of the predicted box.
where is the parameter that controls the degree of outlier suppression.
1.1.4. Ablation Experiments
To adapt the YOLOv7-tiny model for deployment and application in resource-constrained environments, we implemented comprehensive optimizations. To validate the effectiveness of each module, ablation experiments between modules were conducted. Using the YOLOv7-tiny model as the baseline, we compared network parameters (including parameter count, computational load, and mAP) and iris detection performance after integrating additional modules. Networks incorporating different modules were trained on a custom-built dataset, with comparative analysis of their outcomes. The ablation experiment differences between modules are presented in Table 1.
1.2. Enhanced LBP Algorithm
The LBP (Local Binary Pattern) algorithm is a widely used method for texture feature extraction. It operates by selecting an 8-pixel neighborhood in a grid and encoding the comparison results between each neighboring pixel’s gray value and the central pixel’s gray value into a binary number, thereby describing local texture characteristics of images. However, the conventional LBP algorithm solely focuses on gray-level differences between the central pixel and its surrounding pixels when analyzing image textures. This approach leads to loss of texture information in smooth regions when processing images with significant color variations and non-uniform gray-level distributions.
To improve the LBP algorithm while maintaining the neighborhood encoding framework, we preserve the original binary determination method for the four adjacent pixels (up, down, left, right) due to their stronger correlation with the central pixel. Specifically, if a neighboring pixel’s gray value is greater than or equal to that of the central pixel, the corresponding binary bit is assigned 1; otherwise, it is set to 0, as expressed in Equation (2).
Herein, denotes the four neighboring pixel points,and represents the central pixel point. For the corner pixels, their relationships with adjacent points are more critical. Consequently, the average value of their two neighboring pixels is adopted as the threshold. If the value is greater than or equal to this threshold, the corresponding binary bit is set to 1; otherwise, it is set to 0, as formalized in Equation (3):
represent the four corner pixels, and denotes the average value of two adjacent pixels, as defined in Equation (4).
Subsequently, the LBP code is generated by traversing neighboring pixels in a predefined order, as formalized in Equation (5).
The improved LBP algorithm enhances texture feature extraction by refining the consideration of local pixel relationships. Specifically, distinct encoding rules are applied to the four corner pixels, enabling the algorithm to more sensitively capture local texture patterns and gray-scale variations. This refinement improves both the representativeness and discriminative power of the extracted features. Figure 2(a) illustrates the feature details obtained using the conventional LBP algorithm, while Figure 2(b) demonstrates the results from the improved LBP algorithm. Comparatively, the enhanced method effectively suppresses noise around edge contours, yielding sharper and more distinct boundaries.
2. Performance Evaluation.
2.1. Dataset
The model was trained using a combined dataset comprising the partially publicly available CASIA-IrisV4 dataset and a custom-built dataset. The custom dataset consists of 1,000 iris images, which were merged with 5,000 images from the CASIA-IrisV4 dataset to form the final composite dataset. The combined dataset was partitioned into training, testing, and validation sets at a ratio of 7:2:1, maintaining the same proportion from both constituent datasets.
The CASIA-IrisV4 dataset contains a large number of iris image samples from diverse populations, making it highly suitable for training and evaluating the accuracy and robustness of iris recognition algorithms. The custom dataset was acquired using an LRCP10620_1080P camera paired with two sets of infrared LED lights for image capture. Together, these datasets ensure a comprehensive evaluation of the embedded iris recognition system’s performance across varied data sources and acquisition conditions.
2.2. System Implementation
The embedded iris recognition system comprises three primary functions: user registration, authentication mode, and identification mode. The user registration process consists of four sequential components: iris image acquisition, iris image processing, feature extraction and encoding, and iris registration. In authentication mode, the system performs iris image acquisition, processing, and feature extraction/encoding to obtain the user’s biometric data, which is then compared with the corresponding iris template in the database using the Hamming distance matching algorithm. Similarly, the identification mode follows the same preprocessing workflow and sequentially matches the extracted features against all templates in the database through the Hamming distance algorithm.
As illustrated in Figure 3, the hardware architecture of this embedded iris recognition system primarily integrates five functional modules: image processing, image acquisition, human-computer interaction, data storage, and power management. The implemented hardware platform (shown in Figure 4) utilizes an NVIDIA Jetson Xavier NX development board as the central processing unit, operating on Ubuntu 20.04 LTS (a Linux distribution) for system validation. The image acquisition module employs an LRCP10620_1080P infrared industrial camera assembly, which captures grayscale iris images in JPG format with 640×480 pixel resolution.
2.3. Iris Feature Extraction
The iris image input of the system can be categorized into dataset input and camera input. For comparative convenience, this study adopts dataset input by selecting iris images from the CASIA-IrisV4 dataset, specifically from the CASIA-Iris-Thousand subset. Two iris images with identifiers S5769R02 and S5775R02 are randomly chosen for iris extraction.
First, the improved YOLOv7-tiny network model is employed to perform iris localization on the selected images (S5769R02 and S5775R02), generating corresponding positional files containing category information. The file data is then read, and the detected categories are plotted as bounding boxes on the respective iris images, as illustrated in Figure 5. The numerical value following each bounding box category represents the confidence score assigned by the model to that category. The confidence score, interpreted as a probabilistic measure, quantifies the likelihood of target presence within the bounding box. A value closer to 1 indicates higher confidence that the box contains the target object, while a value approaching 0 suggests lower confidence in target detection.
The processed iris images after localization undergo four sequential steps: iris image cropping, normalization, image enhancement, and feature encoding. The preprocessing results for iris images numbered S5769R02 and S5775R02 are illustrated in Figure 6. The iris images in group Figure 6(a) were obtained by cropping the original images, while group Figure 6(b) displays normalized unwrapped iris images. The enhanced iris images in group Figure 6(c) were generated through histogram equalization, and the binarized iris images in group Figure 6(d) were produced using an improved LBP algorithm.
Following this preprocessing pipeline, the two-dimensional iris data is flattened into one-dimensional data, which subsequently undergoes encryption via the SHA-256 algorithm to generate the final iris feature template. Upon obtaining the iris template, corresponding functional operations can be implemented based on application requirements.
2.4. Authentication and Identification Testing
In iris recognition systems, two operational modes exist: authentication mode and identification mode. The following tests were conducted specifically for these two authentication modes. Additionally, we calculated the time required for iris recognition to determine the system’s operational efficiency.
2.4.1. Authentication Mode
A total of 500 classes were randomly selected for testing from the CASIA-Iris-Thousand subset of the CASIA-IrisV4 dataset and a self-built dataset, with 4 samples per class, resulting in a total of 2,000 iris images. For intra-class testing, each class underwent 6 pairwise comparisons among its 4 samples, yielding 3,000 total tests. For inter-class testing, the first 50 classes were compared with the remaining 450 classes, resulting in 22,500 pairwise comparisons. The total number of matching attempts was 25,500.
To evaluate the one-to-one matching performance of the iris recognition system, metrics such as the False Acceptance Rate (FAR), False Rejection Rate (FRR), Equal Error Rate (EER), and Receiver Operating Characteristic (ROC) curve were employed. Statistical analyses were performed on the Hamming Distance (HD) values derived from intra-class matches and inter-class matches to determine their distribution patterns.
As illustrated in Figure 7, the blue curve represents the frequency distribution of intra-class HD values, where each occurrence of an HD value increments the count by 1. The orange curve corresponds to the inter-class HD distribution, where counts are incremented once for every 7 occurrences of a given HD value (values with fewer than 7 occurrences are discarded).
Based on the statistical distribution of HD values, the threshold interval of 10-47 was selected to test the iris images in the dataset for authentication patterns. Within this interval, overlapping HD values between intra-class matches and inter-class matches may generate certain false rejection rates in the system. The FAR and FRR curves under different thresholds are illustrated in Figure 8.
Analysis of Figure 8 verifies the inverse relationship between FAR and FRR: as the threshold increases, FAR rises while FRR declines. In scenarios with higher fault tolerance, it is advisable to select a threshold corresponding to lower FRR (i.e., a higher threshold value) to reduce authentication attempts and enhance user experience. Conversely, for scenarios demanding stringent reliability, a threshold with lower FAR (i.e., a smaller threshold value) should be prioritized to minimize recognition errors and improve system reliability.
Figure 8 reveals that the vertical coordinate of the intersection point between FAR and FRR curves is 2.8%, signifying an Equal Error Rate (EER) of 2.8%. This metric evaluates the system’s matching performance across thresholds, with the EER-corresponding threshold representing the optimal matching parameter. Furthermore, the Receiver Operating Characteristic (ROC) curve was plotted using FRR as the horizontal axis and the corresponding FAR as the vertical axis, as shown in Figure 9.
The ROC curve analysis demonstrates that the close proximity of the curve to the coordinate axes indicates excellent matching performance of the proposed iris recognition algorithm on the test dataset. This graphical representation effectively validates the system’s robust discriminative capability in distinguishing genuine and imposter samples.
2.4.2. Identification Mode
The experimental evaluation utilized 100 classes selected from the CASIA-IrisV4 dataset (specifically the CASIA-Iris-Thousand subset) and a self-constructed dataset, with 2 samples per class, resulting in a total of 200 iris images. The recognition mode testing adopted a one-class-versus-entire-dataset approach. For each of the 100 randomly selected classes, 100 independent tests were conducted, culminating in 10,000 total test iterations.
In one-to-many matching scenarios, the Correct Recognition Rate (CRR), defined as the frequency of authorized users being correctly identified, was employed as a key evaluation metric. Under authentication mode testing, the system achieved a CRR of 98.08% with an average processing time of 1.02 seconds per test, demonstrating feasibility for practical applications.
2.5. Efficiency Testing
The iris acquisition subsystem was evaluated using two input sources: live camera capture and pre-existing dataset images. 100 tests were performed (100 images total). System efficiency was quantified by averaging execution times over 100 trials to mitigate random fluctuations.
The original YOLOv7-tiny model exhibited an average detection time of 0.48 seconds per iris localization, while the optimized YOLOv7-tiny variant reduced this to 0.27 seconds, validating algorithmic improvements.
This module extracts clear images from video streams and inputs them into the neural network model. When iris detection is successful, the image is added to the screening group; if not detected, the image undergoes re-screening. Upon meeting the screening group criteria, sharpness detection is performed to select qualified iris images for subsequent processing. The test results for the iris image acquisition module are presented in Table 2.
This module performs preprocessing operations on iris images based on positional information output by the model, including cropping, normalization, and iris image enhancement. Subsequently, the processed iris image is encoded and matched against the iris template database. The test results for this module are shown in Table 3.
As summarized in Table 4, the average time for iris image acquisition is 2.94 seconds, iris localization averages 0.27 seconds, and iris matching requires 1.31 seconds. The total time for a complete iris recognition cycle is 4.52 seconds, which meets the application requirements.
3. Conclusion
This study aims to enhance the accuracy of iris localization and the effectiveness of iris feature extraction by improving the YOLOv7-tiny model and LBP algorithm, subsequently integrating the optimized algorithms into an embedded iris recognition system. Specifically, the iris localization method employs an enhanced YOLOv7-tiny model with improved network architecture and optimized loss functions, achieving higher computational efficiency, faster operational speed, and superior target localization performance. Compared to the original model, the modified version reduces parameters by 2.3 M and computational load by 6.7 G, while improving mAP by 0.8%. Additionally, the refined encoding strategy in the LBP algorithm yields clearer image contours after texture extraction, enabling more effective feature representation.
Experimental results demonstrate that the embedded iris recognition system achieves an Equal Error Rate (EER) of 2.8% in authentication mode with robust matching performance. The system attains a correct recognition rate of 98.08% in identification mode, indicating high practical applicability. With a processing time of 4.52 seconds per iris recognition cycle, the system efficiency satisfies routine operational requirements. Overall, this research provides a more flexible and convenient identity verification solution. Future work may focus on designing a GUI-based human-computer interaction interface and integrating multimodal biometric technologies to further enhance system utility.
References
- Meng, C.-N.; Zhang, T.-N.; Zhang, P.; Chang, S.-J. Fast and precise iris localization for low-resolution facial images. Optical Engineering 2012, 51, 077008–077008. [Google Scholar]
- Cui, J.; Wang, Y.; Tan, T.; Ma, L.; Sun, Z. A fast and robust iris localization method based on texture segmentation. In Biometric Technology for Human Identification; SPIE: Bellingham, WA, USA, 2004; Volume 5404, pp. 401–408. [Google Scholar]
- Koh, J.; Govindaraju, V.; Chaudhary, V. A robust iris localization method using an active contour model and hough transform. In 2010 20th International Conference on Pattern Recognition; IEEE: Piscataway, NJ, USA, 2010; pp. 2852–2856. [Google Scholar]
- YU, Z.-Z.; LIU, Y.; LIU, Y.-N. Improved Iris Locating Algorithm Based on YOLOV3. Journal of Northeastern University (Natural Science) 2022, 43. [Google Scholar]
- Ding, P.; Li, T.; Qian, H.; Ma, L.; Chen, Z. A lightweight real-time object detection method for complex scenes based on YOLOv4. Journal of Real-Time Image Processing 2025, 22, 1–13. [Google Scholar]
- Daugman, J. How iris recognition works. In The Essential Guide to Image Processing; Elsevier: Amsterdam, Netherlands, 2009. [Google Scholar] [CrossRef]
- Chen, Y.-Y.; Chen, Y.-Y.; Cheng, W.-H.; Xu, M.; Zhuang, J.-Y. Extraction information of moiré fringes based on Gabor wavelet. Optical Review 2022, 29, 197–206. [Google Scholar]
- Boles, W.W. A security system based on human iris identification using wavelet transform. Engineering Applications of Artificial Intelligence 1998, 11, 77–85. [Google Scholar]
- Naidu, V.P.S. Discrete cosine transform-based image fusion. Defence Science Journal 2010, 60. [Google Scholar]
- Lei, L.; Kim, D.-H.; Park, W.-J.; Ko, S.-J. Face recognition using LBP Eigenfaces. IEICE TRANSACTIONS on Information and Systems 2014, 97, 1930–1932. [Google Scholar]
- Terven, J.; Córdova-Esparza, D.-M.; Romero-González, J.-A. A comprehensive review of yolo architectures in computer vision: From yolov1 to yolov8 and yolo-nas. Machine Learning and Knowledge Extraction 2023, 5, 1680–1716. [Google Scholar]
- Wang, T.; Zhang, X.; Ma, Y.; Wang, Y.; Xie, H.; Zhu, M.; Su, B.; Yao, D. Research and application based on the improved YOLO V7 target detection algorithm. In Third International Conference on Image Processing, Object Detection, and Tracking (IPODT 2024); SPIE: Bellingham, WA, USA, 2024; Volume 13396, pp. 242–251. [Google Scholar]
- Zhang, X.; Zhou, X.; Lin, M.; Sun, J. Shufflenet: An extremely efficient convolutional neural network for mobile devices. In Proceedings of the IEEE Conference on Computer Vision and Pattern Recognition; IEEE: Piscataway, NJ, USA, 2018; pp. 6848–6856. [Google Scholar]
- Jiang, T.; Cheng, J. Target recognition based on CNN with LeakyReLU and PReLU activation functions. In 2019 International Conference on Sensing, Diagnostics, Prognostics, and Control (SDPC); IEEE: Piscataway, NJ, USA, 2019; pp. 718–722. [Google Scholar]
- Shen, F.; Gan, R.; Zeng, G. Weighted residuals for very deep networks. In 2016 3rd International Conference on Systems and Informatics (ICSAI); IEEE: Piscataway, NJ, USA, 2016; pp. 936–941. [Google Scholar]
- Ramachandran, P.; Zoph, B.; Le, Q.V. Searching for activation functions. arXiv Preprint 2017, arXiv:1710.05941. [Google Scholar]
- Sun, C.; Chen, Y.; Qiu, X.; Li, R.; You, L. Mrd-yolo: A multispectral object detection algorithm for complex road scenes. Sensors 2024, 24. [Google Scholar] [CrossRef] [PubMed]
- Zhang, Y.-F.; Ren, W.; Zhang, Z.; Jia, Z.; Wang, L.; Tan, T. Focal and efficient IOU loss for accurate bounding box regression. Neurocomputing 2022, 506, 146–157. [Google Scholar]
Figure 1.
Network structure of the improved YOLOv7-tiny model.
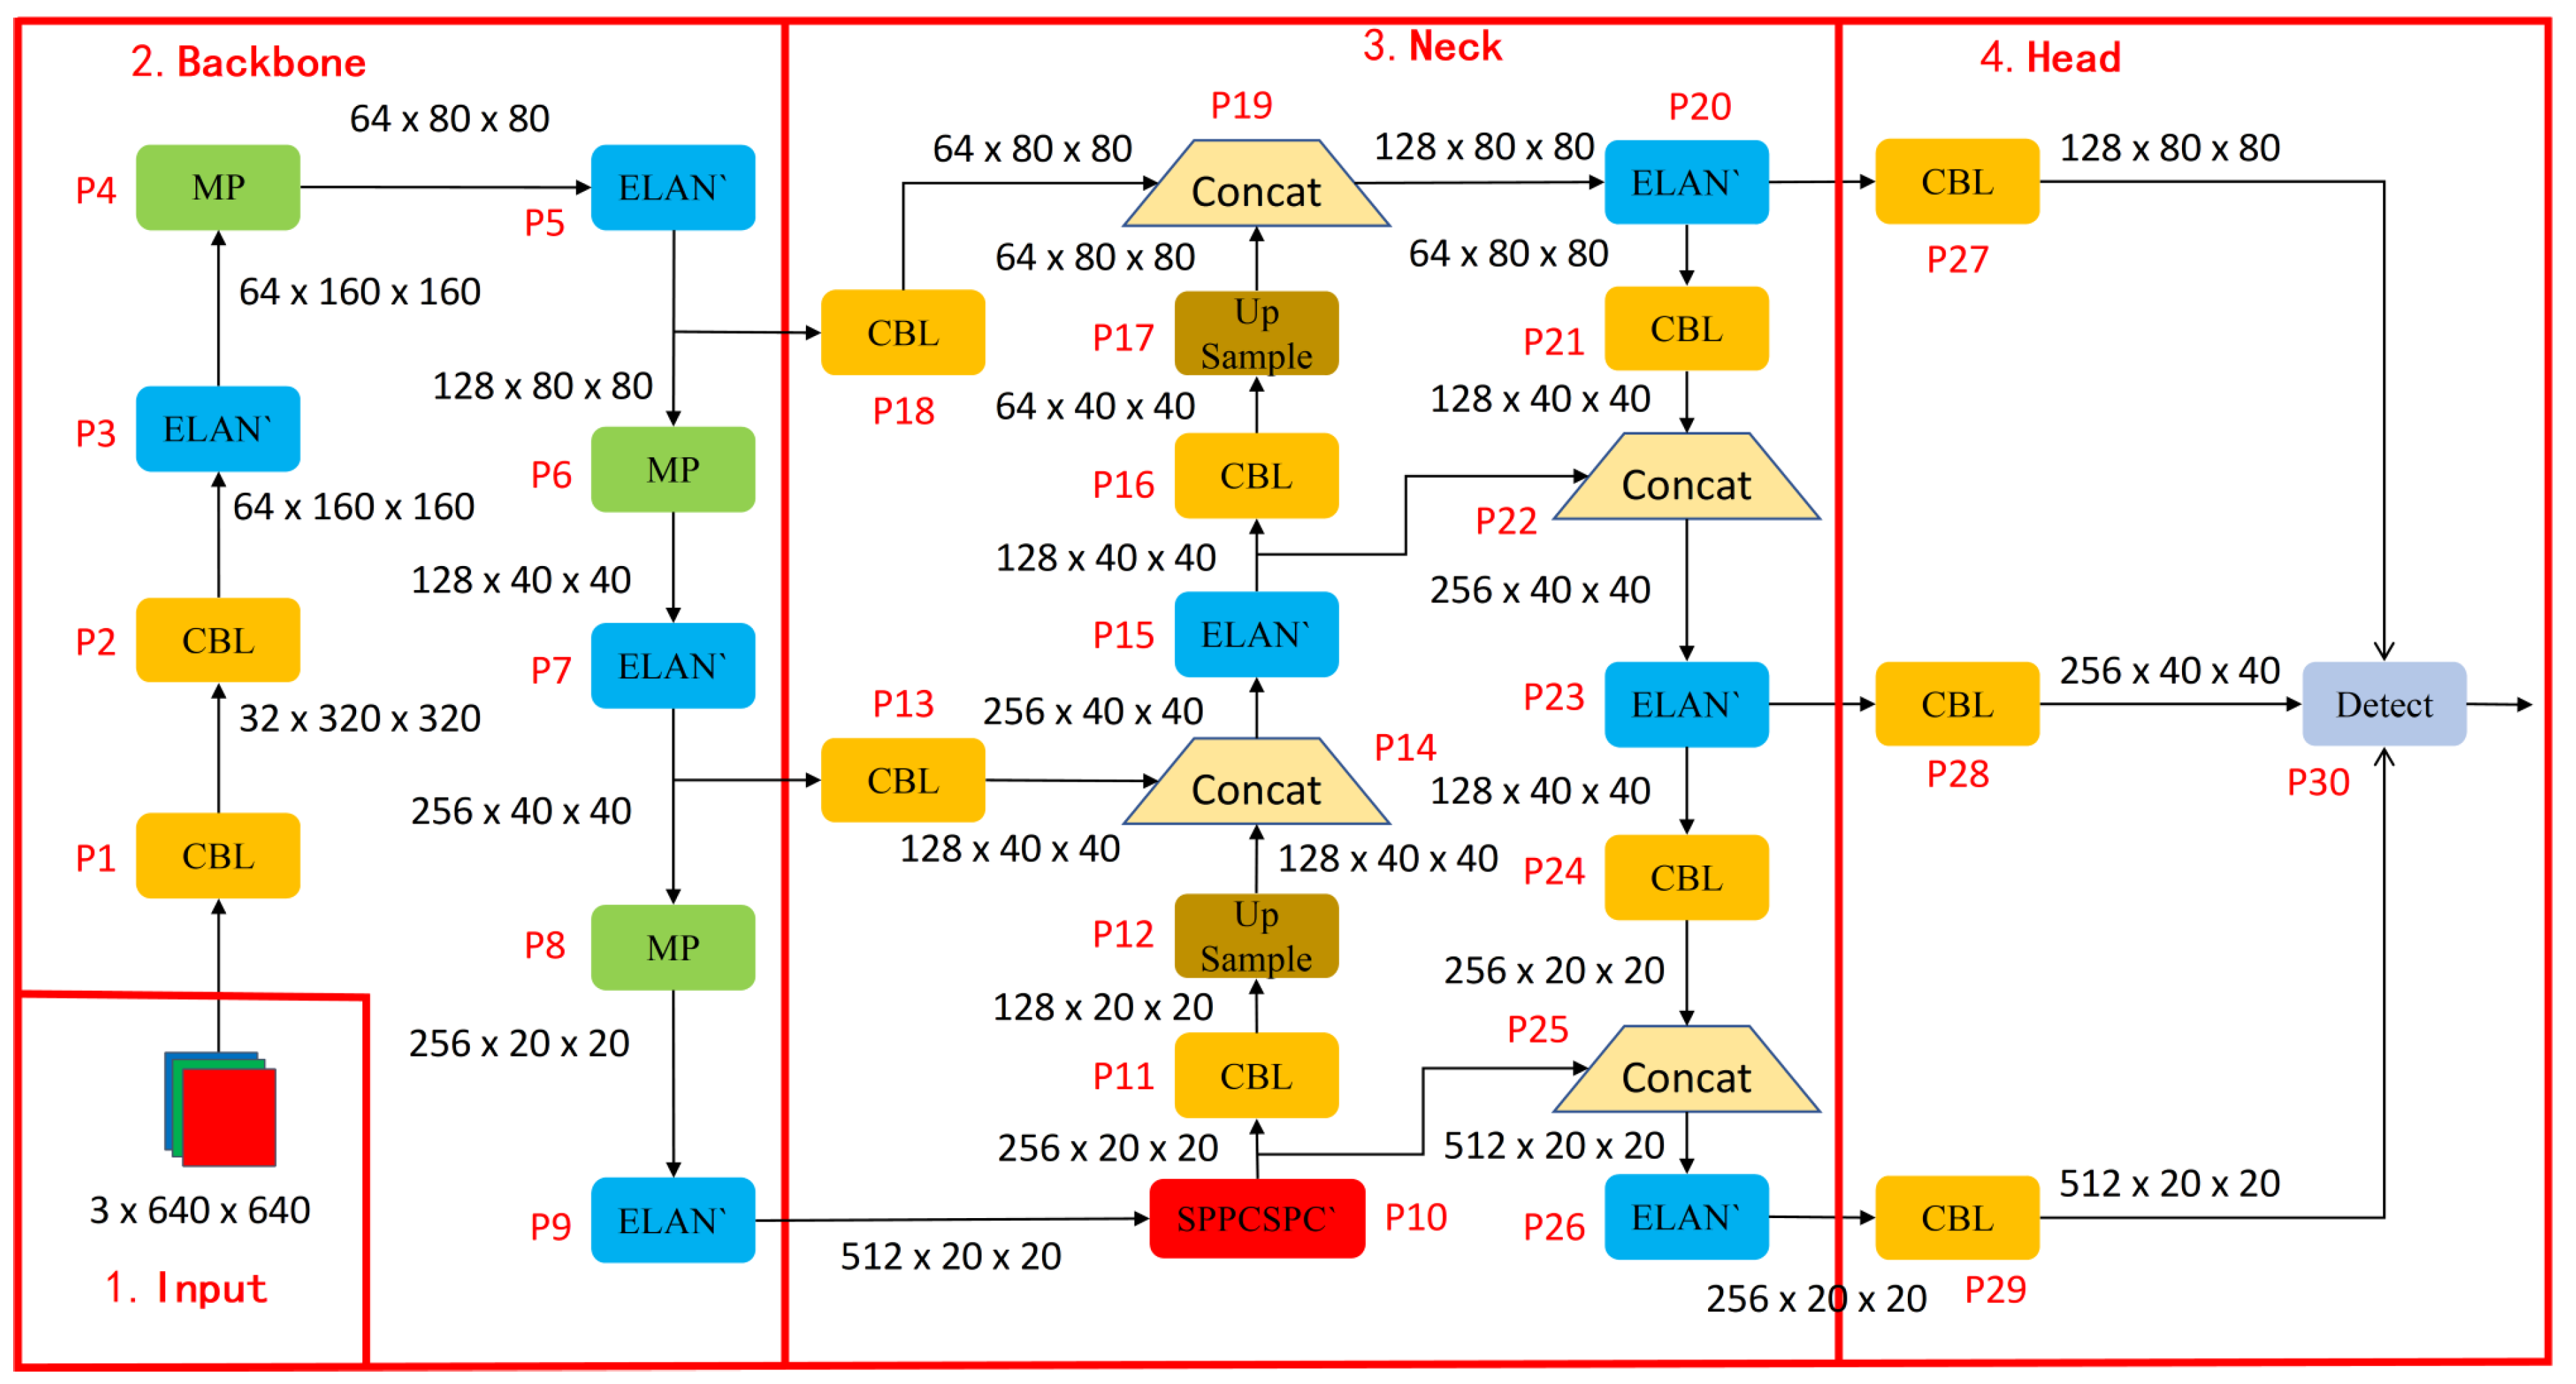
Figure 2.
LBP vs. improved LBP results.
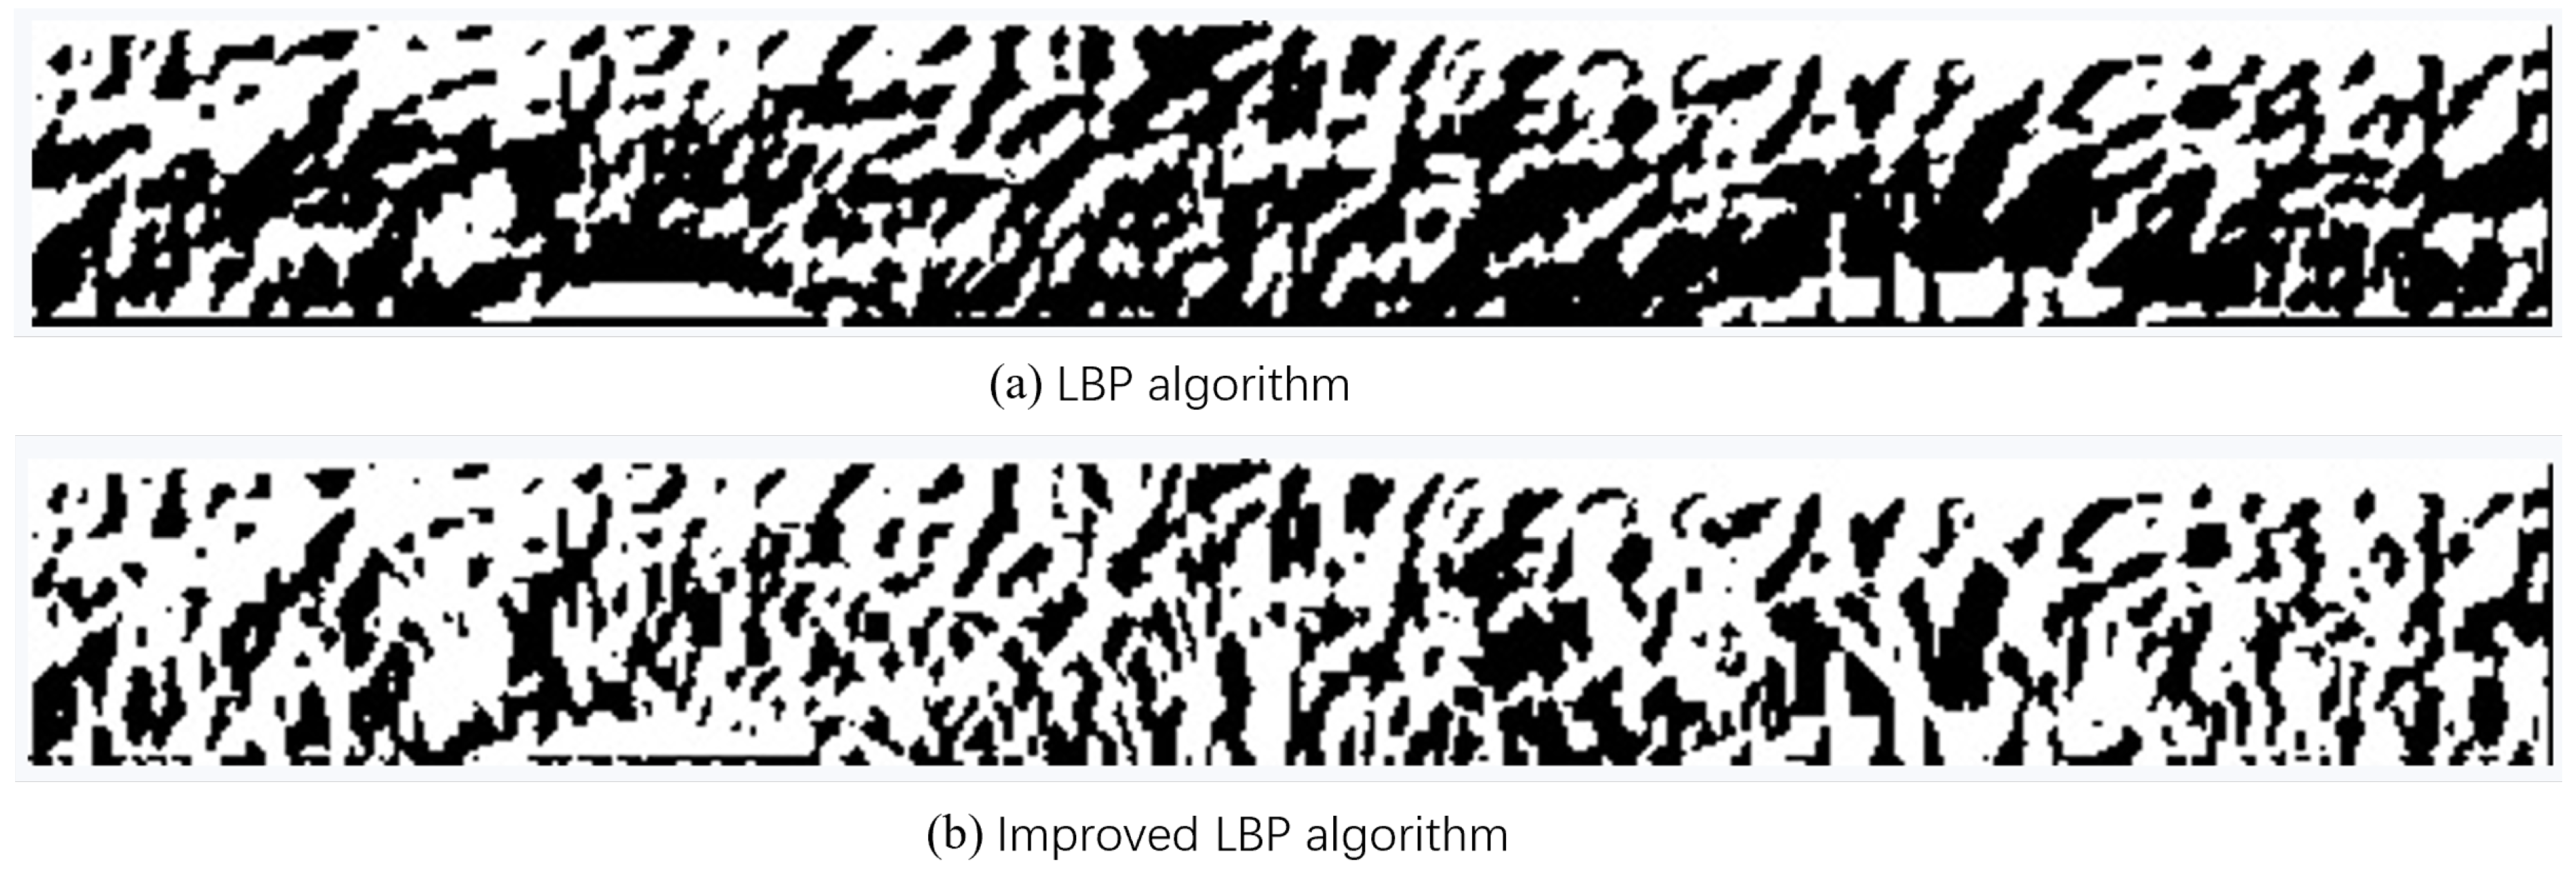
Figure 3.
Hardware architecture.
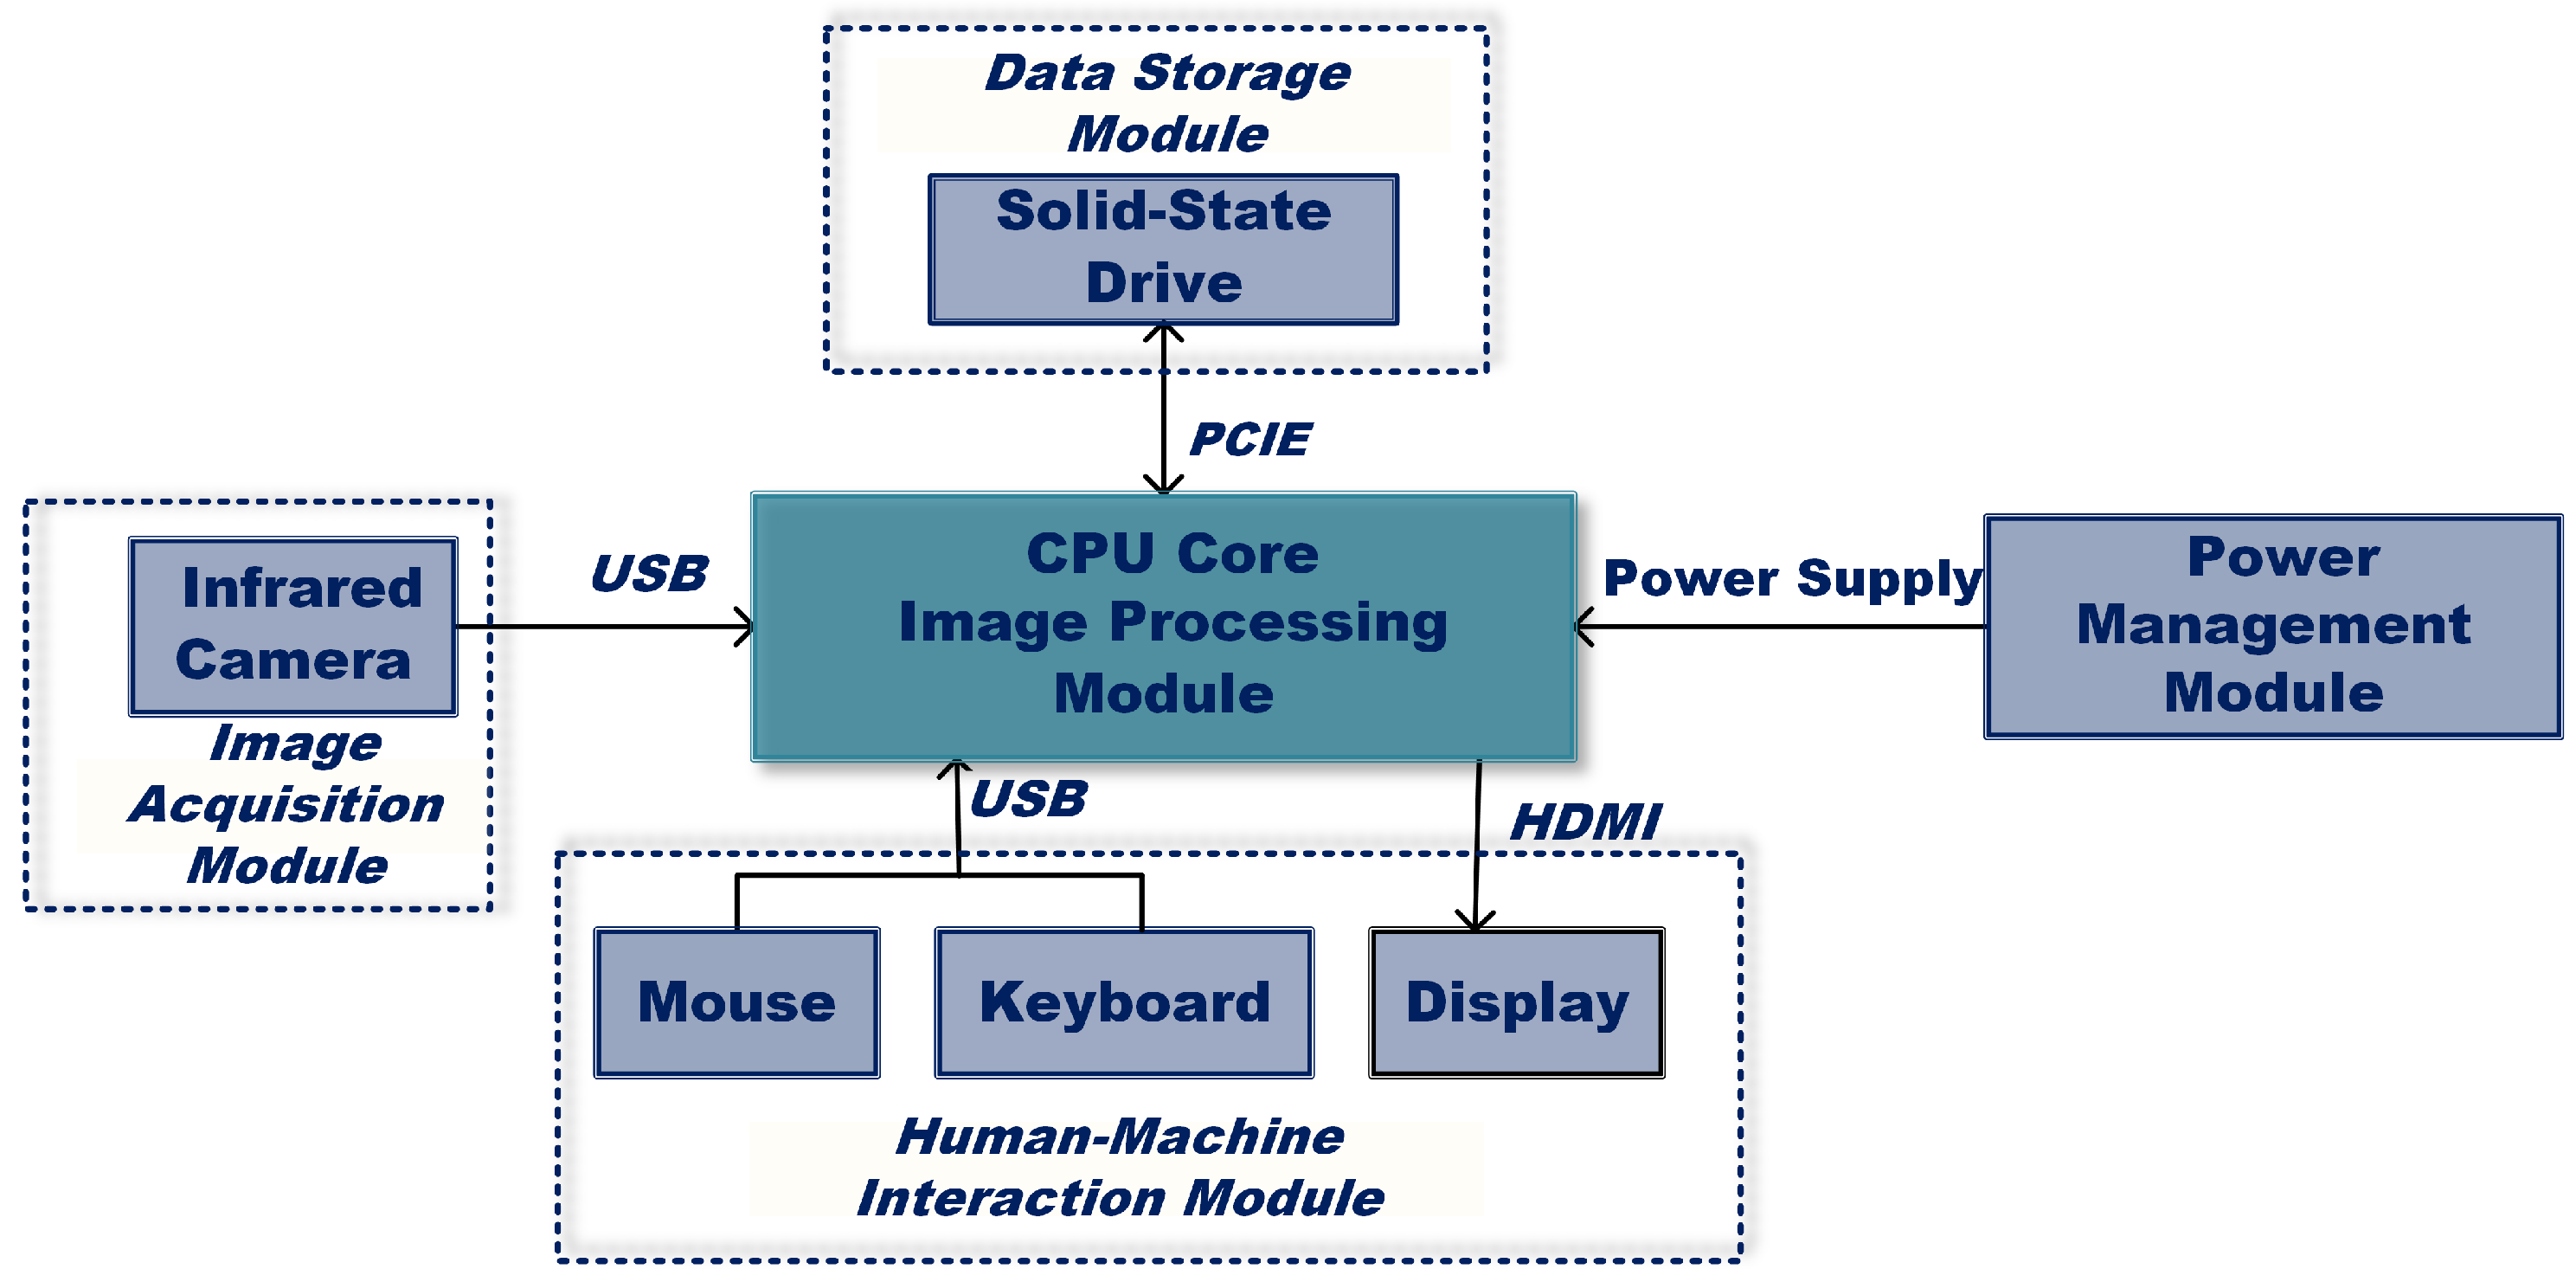
Figure 4.
System runtime environment.
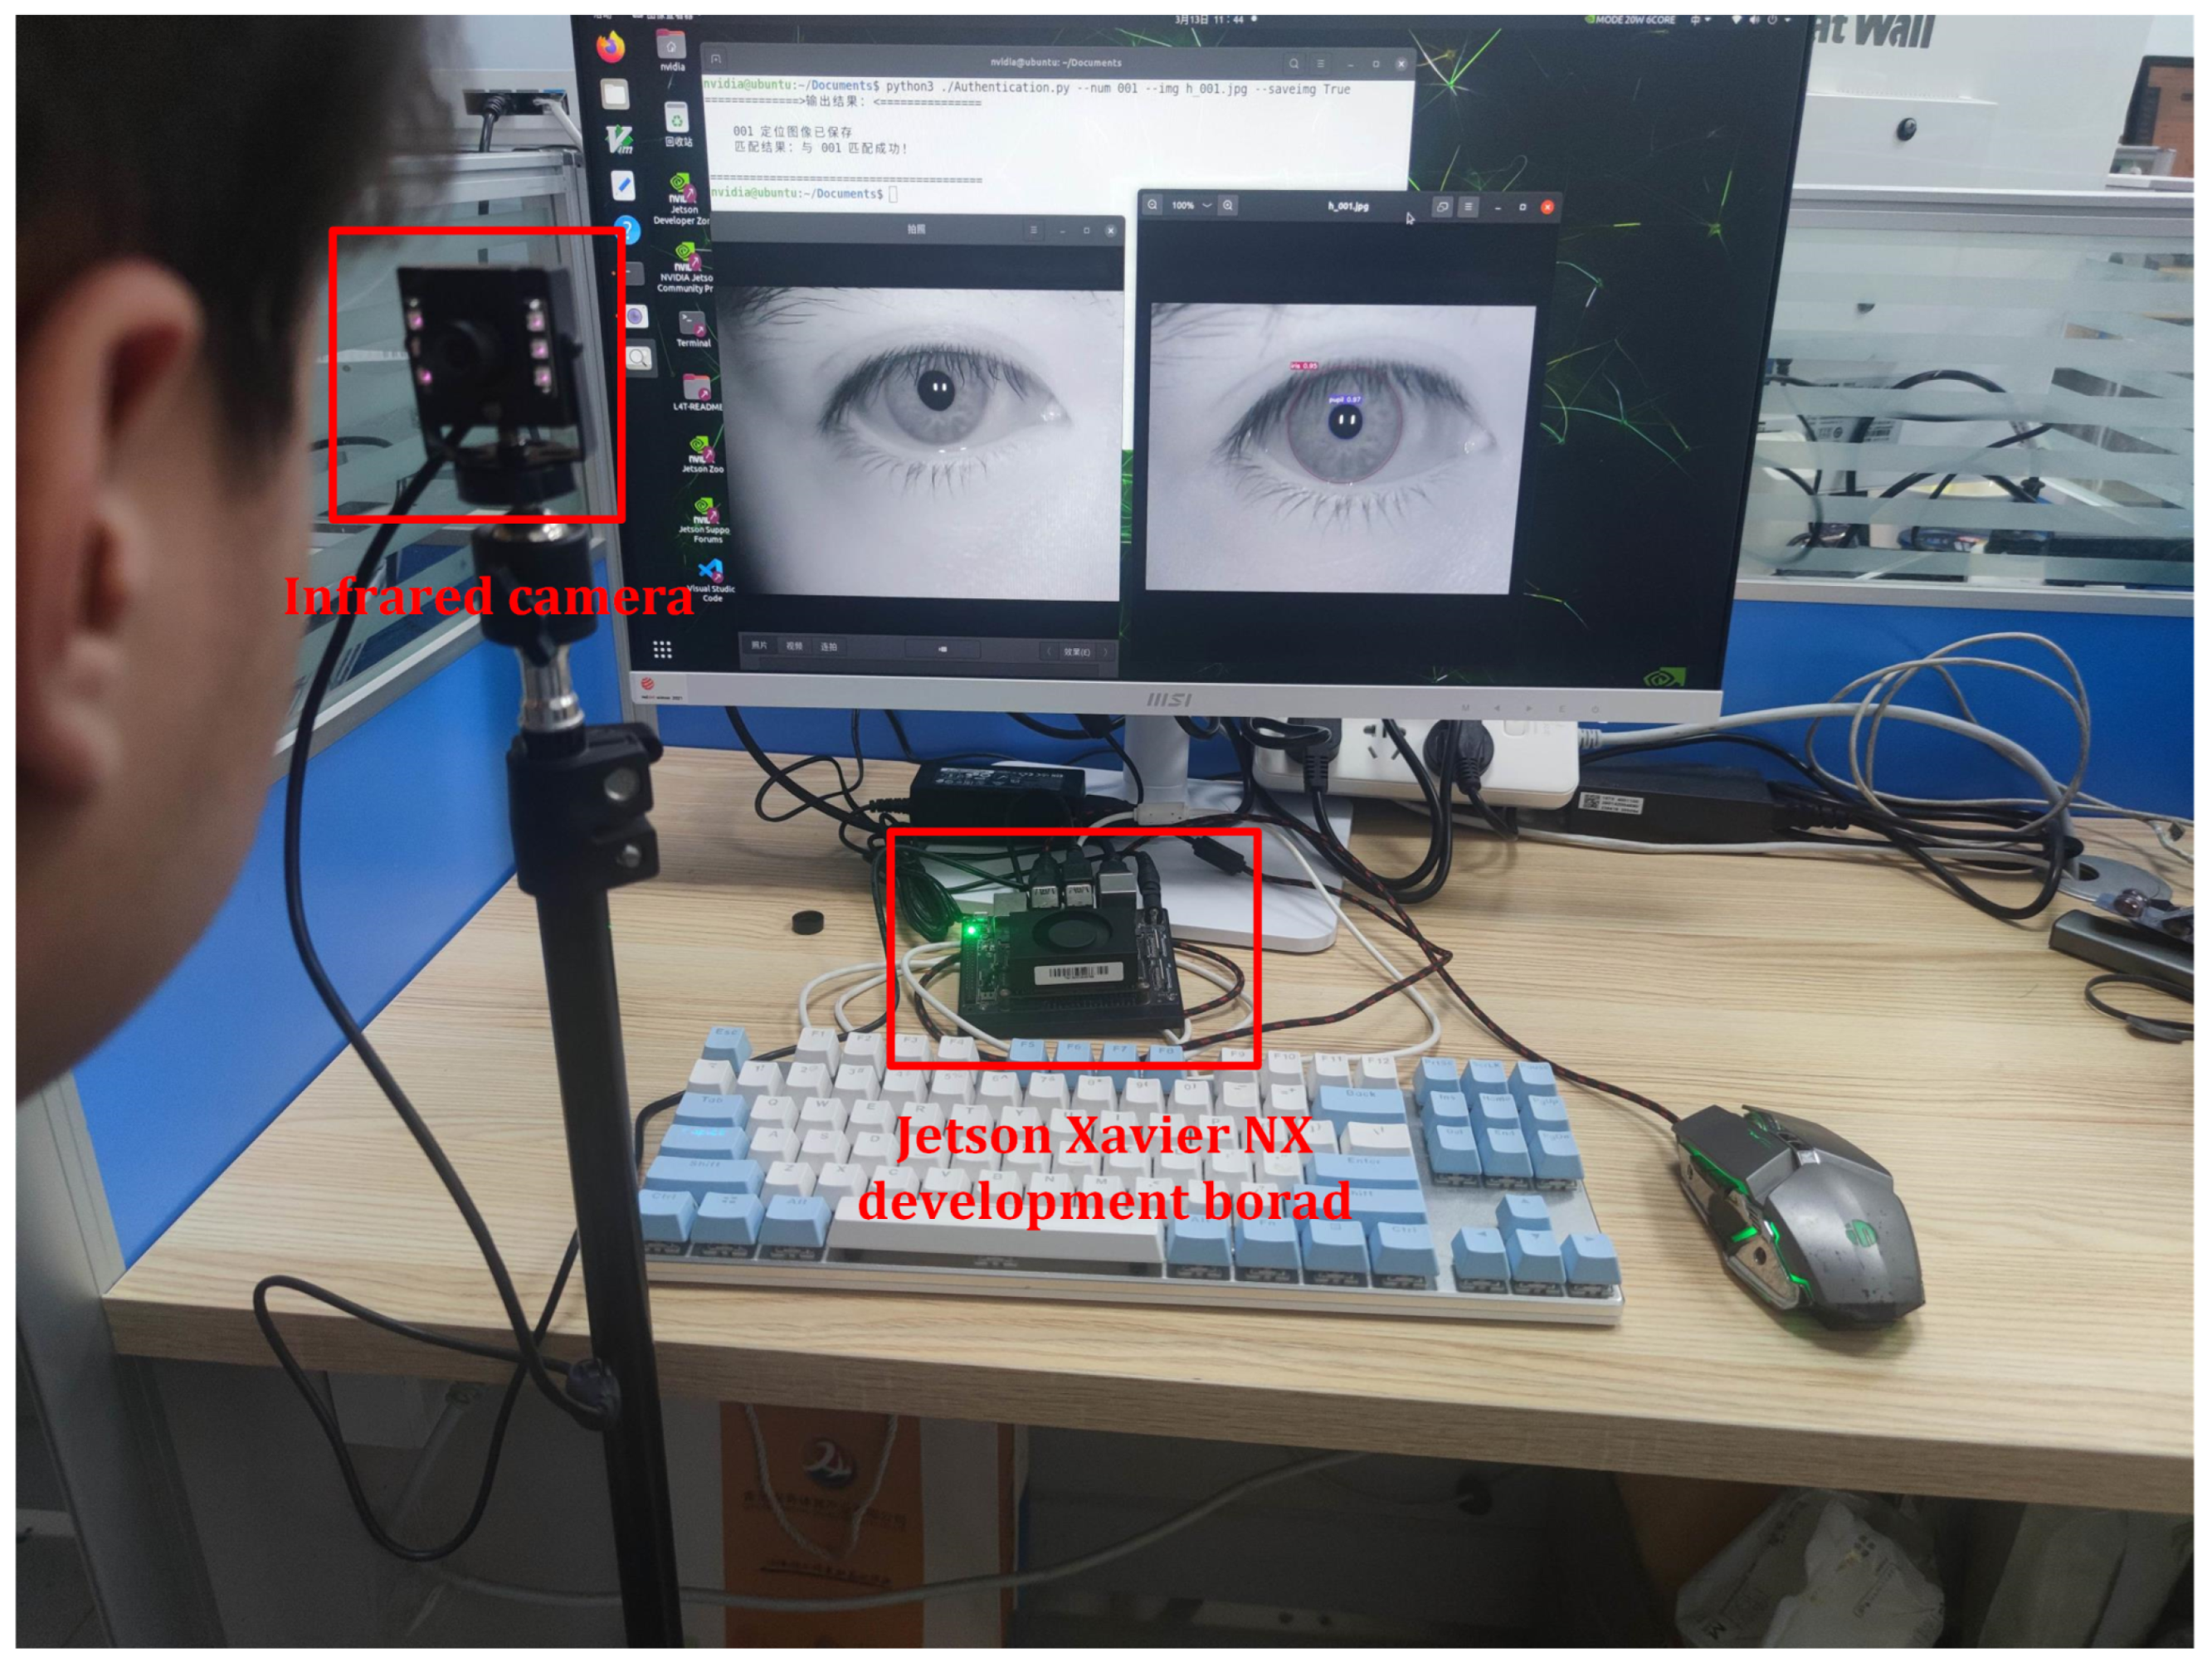
Figure 5.
Iris localization results.
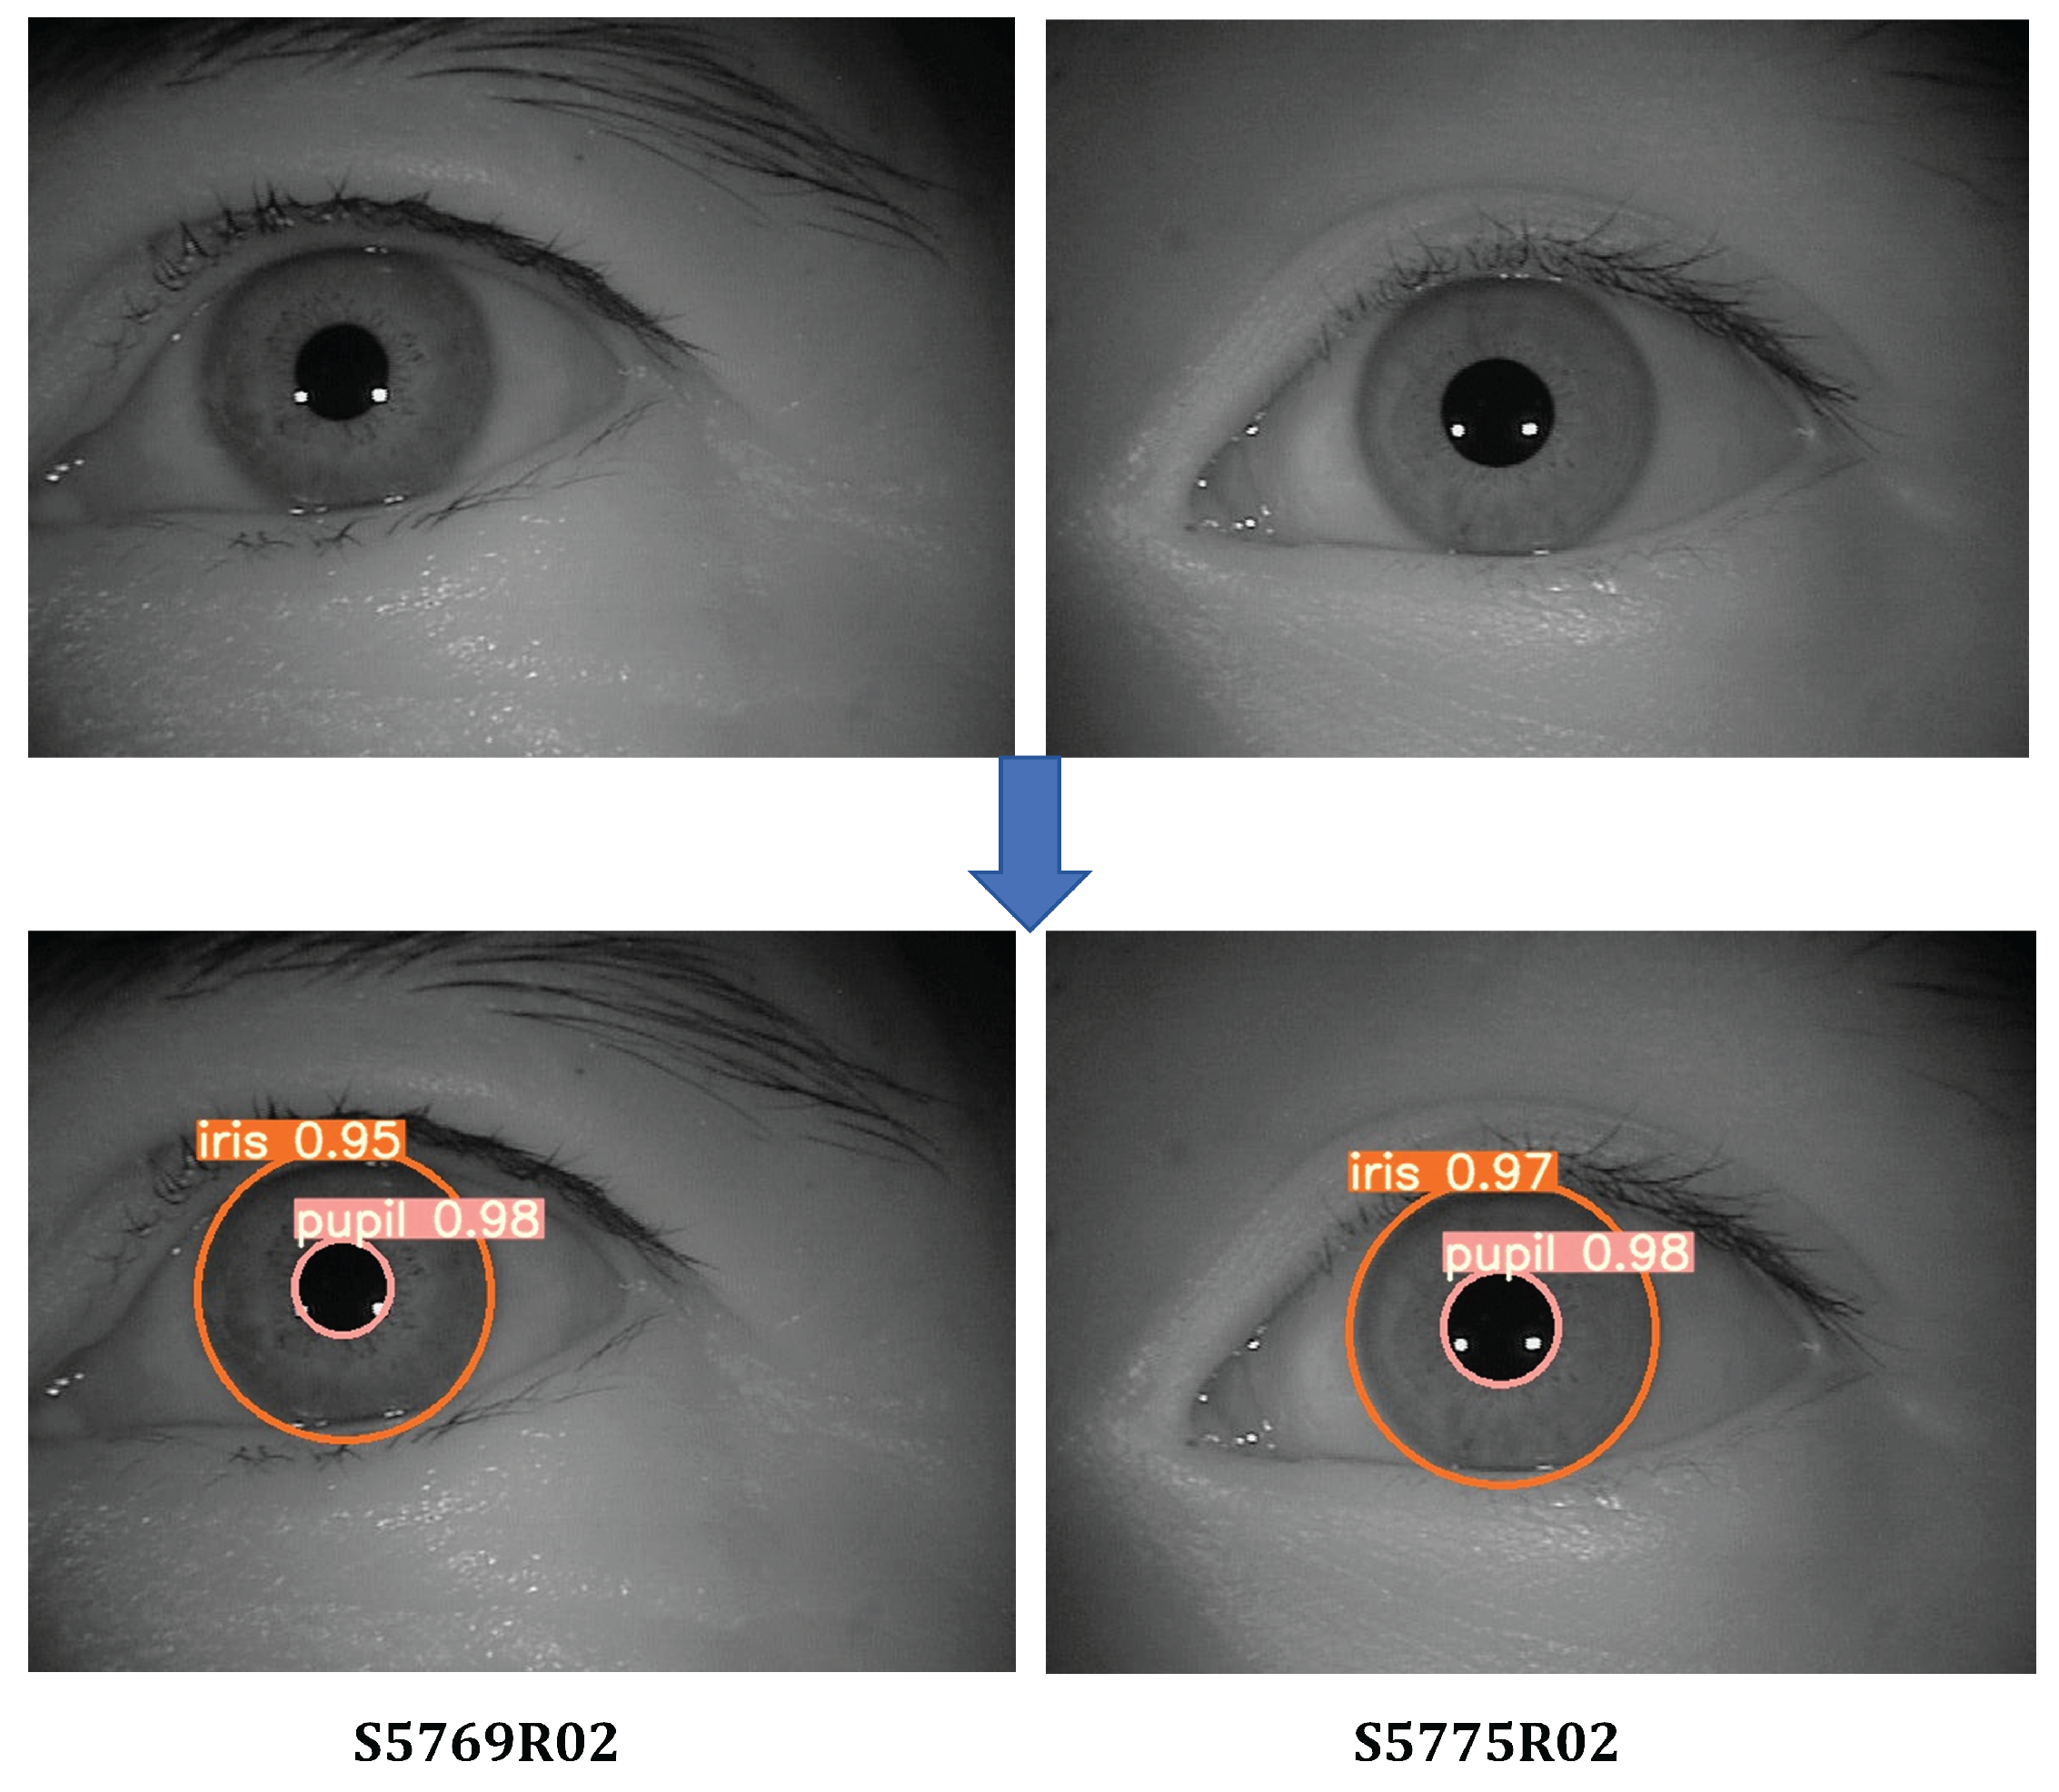
Figure 6.
Preprocessing stages.
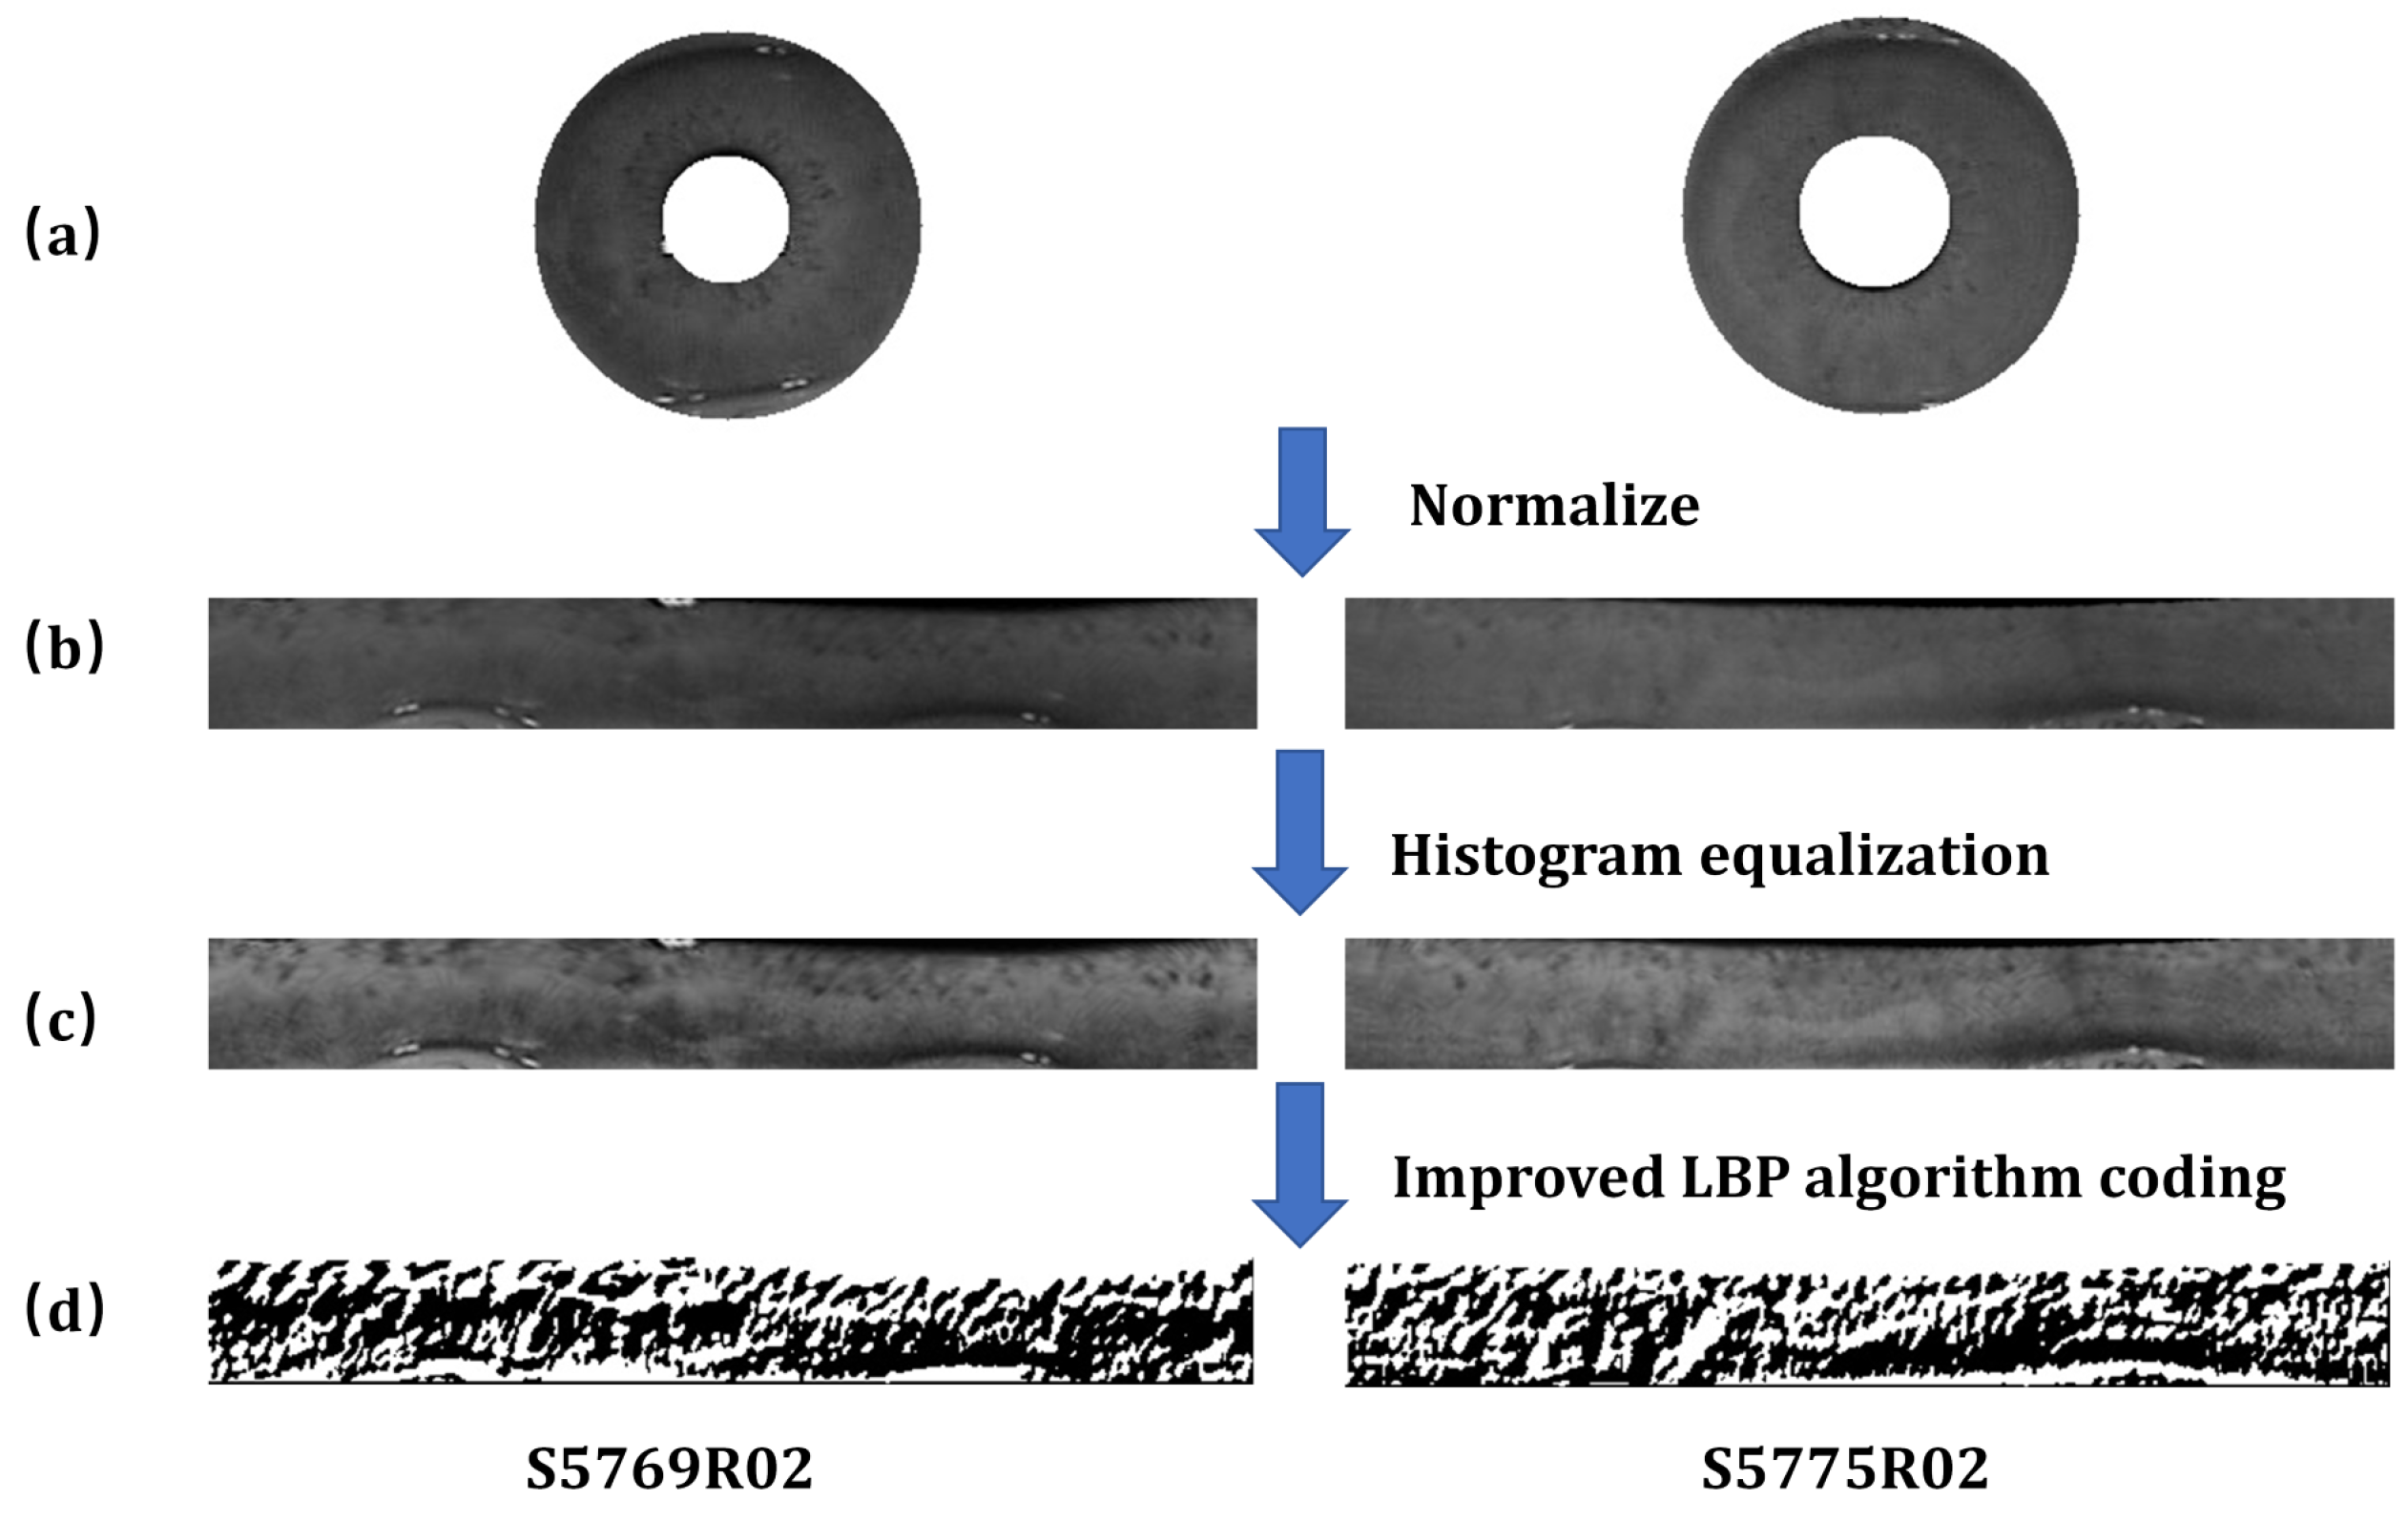
Figure 7.
HD value distribution.
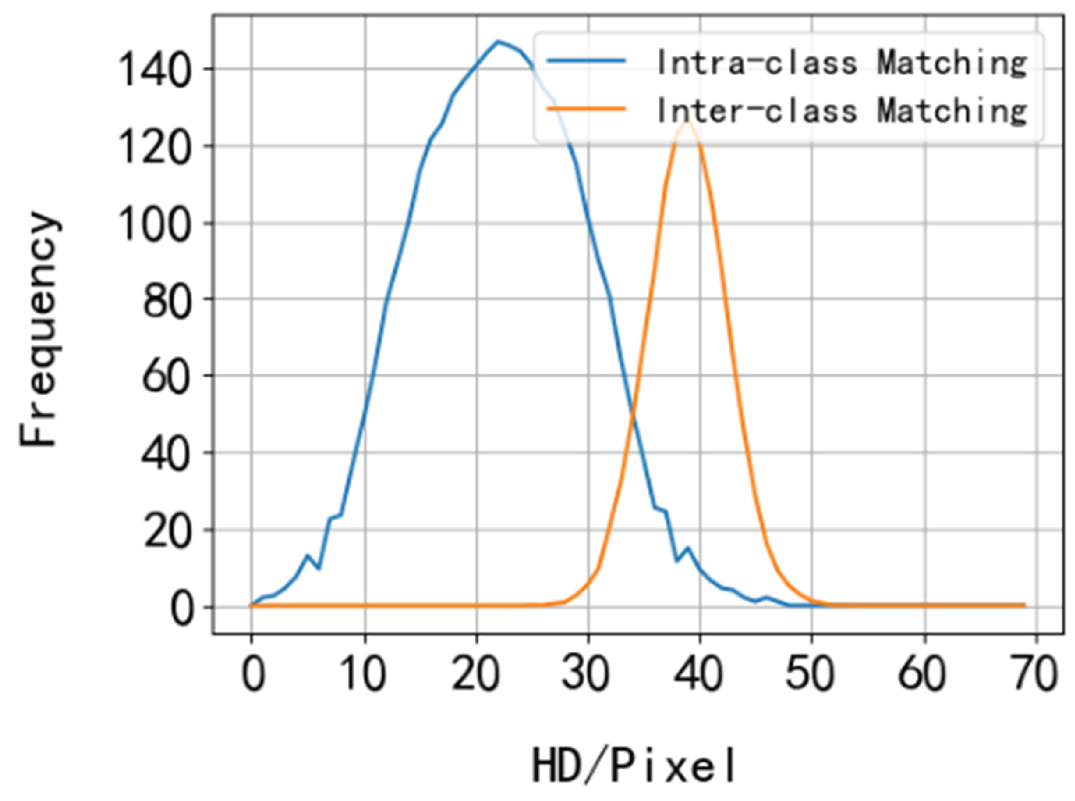
Figure 8.
FAR and FRR curves.
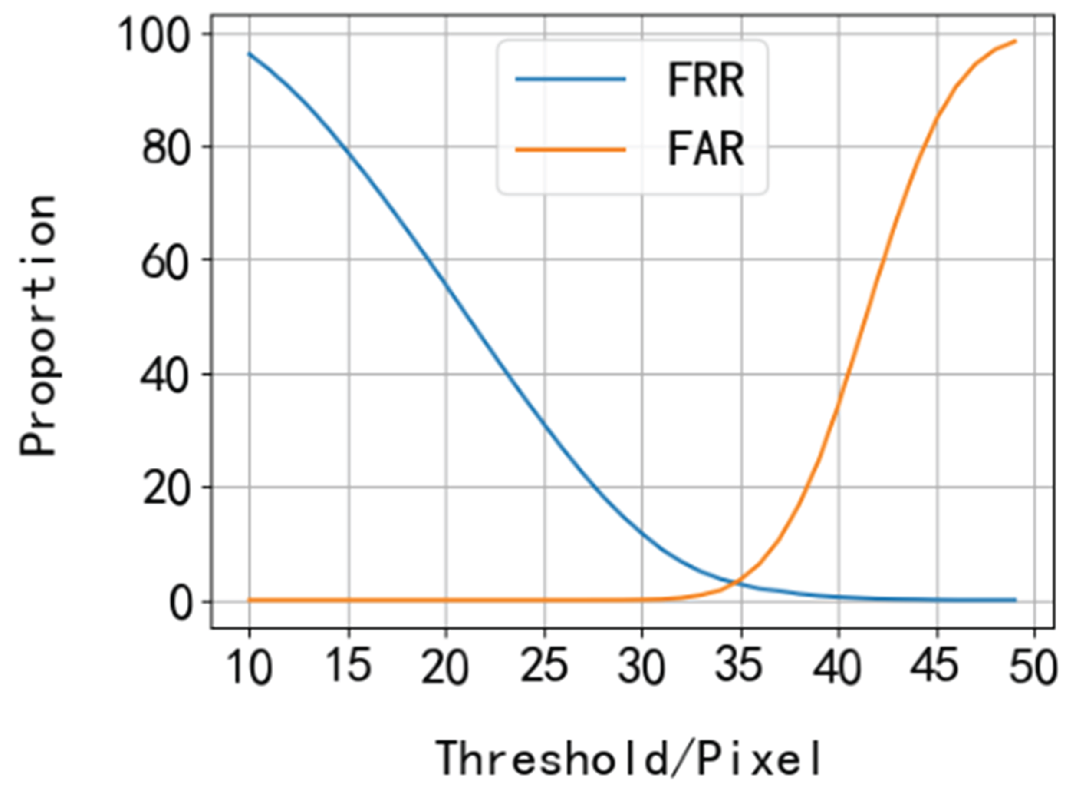
Figure 9.
ROC curve.
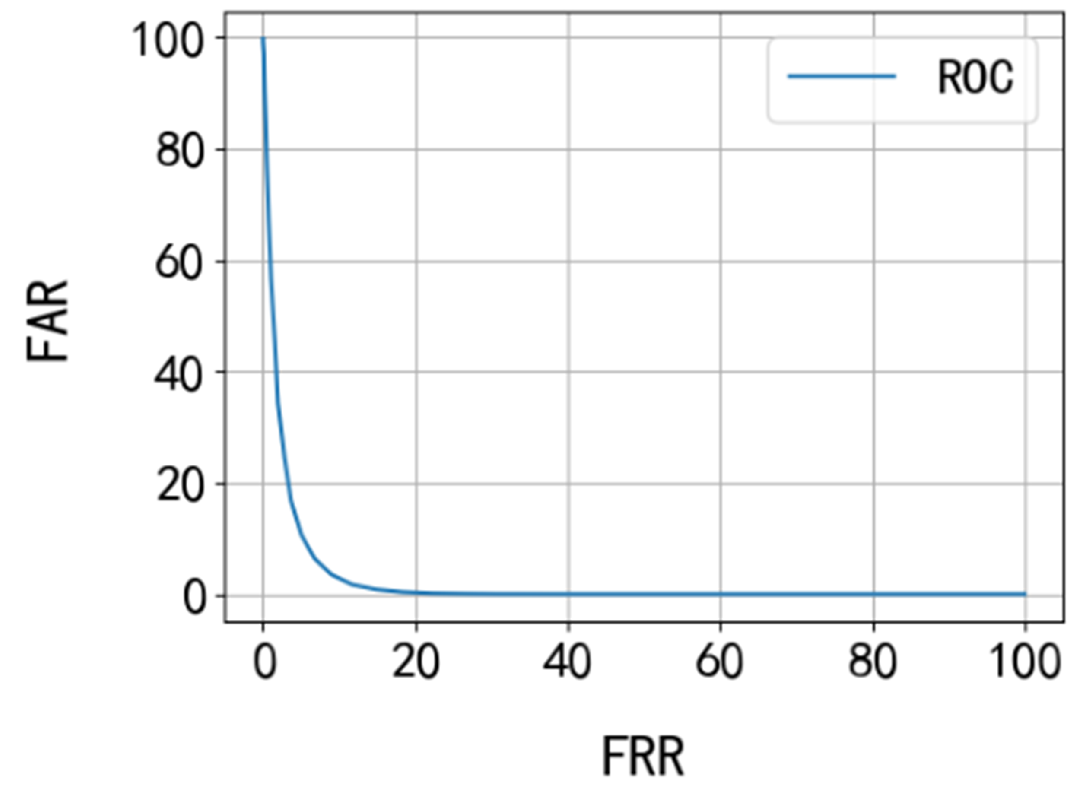

Table 1.
Ablation experiment results.
| Model | Params | FLOPs | mAP@0.5 |
|---|---|---|---|
| YOLOv7-tiny | 6.2 M | 13.9 G | 0.977 |
| + SlimNeck | 4.6 M | 9.9 G | 0.983 |
| + Shufflenetv2 | 4.2 M | 7.5 G | 0.984 |
| + AIFI | 3.9 M | 7.2 G | 0.984 |
| + EIOU | 3.9 M | 7.2 G | 0.985 |
Table 2.
Test results of the iris image acquisition module.
| Acquisition interval | Image clarity assessment | Iris detection | Number of capture attempts | Total time |
|---|---|---|---|---|
| 0.017s | 0.007 | 0.27s | 10 | 2.94s |
Table 3.
Efficiency Test Results of the Iris Recognition System.
| Iris image preprocessing | feature encodingt | Iris template matching | Total time |
|---|---|---|---|
| 0.78s | 0.1s | 0.43s | 1.31s |
Table 4.
Efficiency Test Results of Iris Recognition System.
| Iris image acquisition | Iris localization | Iris feature extraction and matching | Total time |
|---|---|---|---|
| 0.78s | 0.1s | 0.43s | 1.31s |
Disclaimer/Publisher’s Note: The statements, opinions and data contained in all publications are solely those of the individual author(s) and contributor(s) and not of MDPI and/or the editor(s). MDPI and/or the editor(s) disclaim responsibility for any injury to people or property resulting from any ideas, methods, instructions or products referred to in the content. |
© 2025 by the authors. Licensee MDPI, Basel, Switzerland. This article is an open access article distributed under the terms and conditions of the Creative Commons Attribution (CC BY) license (http://creativecommons.org/licenses/by/4.0/).
Copyright: This open access article is published under a Creative Commons CC BY 4.0 license, which permit the free download, distribution, and reuse, provided that the author and preprint are cited in any reuse.


