
Submitted:
12 June 2025
Posted:
12 June 2025
You are already at the latest version
Abstract
The New Zealand government has proposed a zero-carbon target by 2050. Electricity demand is also expected to double up to 88 TWh annually by 2050. Zero-carbon economy transition and growing electricity demand motivate us to explore the offshore wind to green hydrogen system potential in the New Zealand context, which has been studied in several European countries. Coupling offshore wind with hydrogen production will be one of the main pillars toward a fully decarbonized energy system by avoiding wind curtailment, mitigating electricity grid congestion, and producing green hydrogen used for energy storage, transportation fuel, steel and iron production, or replacing natural gas for residential customers.
This study systematically reviews offshore wind and hydrogen production retrieved from the empirical papers, reports from government, industries, and national and international organizations. Sources of cost estimates are further investigated based on assumption and scenario analysis according to Concept Consulting and Castalia modelling.
We find that offshore wind can and will play an important role in the decarbonization of New Zealand. New Zealand can take action to develop both these industries further to attain opportunities. In addition, current cost estimates for hydrogen in New Zealand are not cost-competitive with existing fossil fuels but may be in the future. More research is required for specific scenario cost estimations for New Zealand in order to provide insight into which projects will be more efficient or cost-effective. This will allow interested parties like energy companies to develop more concrete optimal plans for New Zealand. Lastly, Grants, subsidies, regulatory incentives, and higher carbon prices are some actions the government can take to bring costs down and incentivize development further.
This paper provides a pioneer study of assessing the feasibility of offshore wind and hydrogen production, including economic viability, challenges, and barriers and contributes to showing an alternative solution to achieve the New Zealand government’s zero-carbon target.
Keywords:
Green hydrogen
; offshore wind
; decarbonization
; New Zealand
1. Introduction
Due to emissions reduction obligations made under climate conference agreements and goals on climate change, countries around the world are looking into ways to significantly decarbonize their economies and reduce their reliance on fossil fuels. Achieving these objectives necessitates a shift towards low-carbon electricity generation, as electricity can replace conventional fuels in various sectors, including industry, transportation, commercial and residential. Offshore wind is emerging as a crucial player in the electrification of global economies due to its substantial untapped potential, which is essential to meet future energy demands. In scenarios where countries have limited renewable energy potential or sectors that cannot directly decarbonize with electricity, alternative low-carbon fuel sources become necessary. It is extremely costly for electricity to be transmitted across long distances without significant losses. In addition, with current battery technology, electricity cannot be stored in large quantities that meet large-scale demands. Therefore, green hydrogen, produced from renewable sources, will play a key role in decarbonizing as when ignited, hydrogen only produces water as a by-product and can be treated in similar ways to how natural gas is currently used in terms of shipping and supply chains.
Despite the advantages, renewable energy sources face challenges due to inherent intermittency, which can lead to fluctuations in energy availability. This variability demands robust solutions for energy storage and conversion to maintain a reliable and stable energy grid [1]. Unlike traditional energy sources that offer steady output, renewables depend on environmental conditions, leading to fluctuations in energy availability. This intermittency necessitates robust solutions for energy storage and conversion to ensure reliability and stability of the energy grid. Among the technologies advancing in response are battery storage systems and hydrogen energy, which provide means to store excess energy generated during peak production periods [2]. These storage options not only compensate for variability but also enhance the efficiency and integration of renewable energy into our energy systems. By converting electrical energy into chemical energy, hydrogen serves as a versatile carrier that can store large amounts of energy over time and redistribute it across various applications, including transportation, industry, and residential use, thus addressing the critical challenge of matching supply with demand in renewable-based systems.
Moreover, addressing the broader context of offshore wind and green hydrogen requires a multifaceted analysis encompassing policy frameworks, social acceptance, and environmental impacts. Policies significantly influence the deployment of these technologies; for example, government incentives and streamlined regulatory processes can expedite development, while stringent environmental reviews might slow it down [3]. Social acceptance is crucial, as community concerns about visual and noise impacts, and potential disruptions to marine ecosystems, can affect project implementation. Strategies to improve acceptance include community engagement and demonstrating economic and environmental benefits [4]. On the environmental front, while offshore wind and green hydrogen offer reductions in greenhouse gas emissions, they still pose risks to biodiversity and require careful siting and technology-specific impact assessments to mitigate effects on wildlife and habitats [5]. Integrating these aspects into project planning and public policy is essential for the sustainable expansion of these technologies.
The relationship between renewable energy and hydrogen, particularly in the context of offshore setups, is also explored in this study. Hydrogen’s role as a storage solution for renewable energy is particularly significant in scenarios where direct electrification is unfeasible due to geographical or infrastructural limitations. The economic and technical feasibility of offshore hydrogen production, involving complex multi-body systems, is discussed with insights from relevant literature [6].
New Zealand (NZ) has large renewable energy potential, but to combat low electricity generation from its hydropower plants during dry years and meet its stringent decarbonization goals, it will need more electricity generation to keep up with demand and reduce the need to supplement electricity to the grid using natural gas or other fossil fuels. This research provides a pioneer study of assessing the feasibility of offshore wind and hydrogen in NZ, showcasing current developments and objectives, including the economic viability, and challenges and barriers that the country may face. The objective of this study is to provide interested parties with an understanding of the critical role these technologies play in decarbonization efforts and to offer insights into potential applications and strategies that New Zealand could adopt to maximize the benefits of offshore wind and hydrogen in its economy. This study systematically reviews offshore wind and hydrogen production based on empirical papers, government reports, industry publications, and documents from national and international organizations, using the methodology outlined in [7]. Sources of cost estimates are further investigated based on assumption and scenario analysis according to Concept Consulting and Castalia modelling.
The rest of the study begins by introducing the methodology used in the analysis, followed by an overview of offshore wind and hydrogen. It then explores export potential, storage options, and cost considerations within the New Zealand context, and concludes with a discussion of regulatory requirements to support the development of these technologies.
2. Methodology
A systematic literature review was conducted to identify relevant academic articles, government publications, and organizational reports related to offshore wind energy and green hydrogen development in New Zealand, following the method outlined by Rueda-Bayona et al. [7]. The review adhered to a structured retrieval and screening process, as illustrated in Figure 1.
A preliminary search was performed using the keywords “offshore wind”, “green hydrogen”, and “New Zealand”. Searches were conducted across multiple databases and sources, including EconLit, Google Scholar, Scopus, Web of Science, and general Google searches to capture relevant grey literature, such as government and organizational reports.
The inclusion criteria encompassed studies, articles, and reports that: (1) discussed offshore wind and/or green hydrogen with specific relevance to New Zealand; (2) were published in English; and (3) presented original data, policy analysis, or market assessments.
The exclusion criteria included: (1) duplicates; (2) irrelevant content based on titles and abstracts; and (3) documents of poor quality or lacking sufficient analytical depth, as determined through full-text review.
The initial search returned to a total of 963 records. After removing duplicates, the remaining records underwent title and abstract screening to assess relevance. Articles and reports that did not meet the inclusion criteria were excluded at this stage. Full-text screening was subsequently conducted, leading to the exclusion of additional low-quality or non-substantive documents. This process resulted in a final set of 59 articles and reports included in the analysis.
3. Wind Power Potential
In 2020, the International Energy Agency (IEA) reported that 108 out of 698 GW total of global onshore wind were added that year, with forecasted additional offshore annual capacity much lower than that of 11 GW in 2021, but almost double relative to 2020 [8,9]. Offshore wind is in the early stages of development and is expected to grow rapidly in the future, with only 34GW of total global capacity, whilst onshore wind is already a relatively established source of energy [10]. Through the IEA’s forecast period of 2021-2026, the agency expects lower onshore wind growth of an average of 75GW annually, whilst offshore wind growth may reach up to 21 GW annually due to expansion outside current markets that are already investing heavily in this technology such as the United Kingdom, and European countries like Germany and Denmark [11]. Although 21 GW may not be significant comparatively, cumulatively in 2026, offshore capacity is forecasted to be more than triple, almost reaching 120GW, with the share of annual renewable additions to reach over 20% compared to just 5% in 2020 [12].
3.1. Comparing Characteristics Between Onshore Wind and Offshore Wind
Onshore wind is relatively inexpensive with low installation and maintenance costs compared to offshore wind but still has a few barriers even though it is an established technology. Challenges to onshore wind growth include acquiring permits, social acceptance (environmental and social impacts), and integrating and connecting with current grids [11]. Also, in the short term, rising steel and transportation costs have increased turbine prices substantially, with some areas seeing a 10-25% increase [11]. These problems stunt the growth of onshore wind farms and may even lead to inefficiencies within costs and profitability. Without these issues, global onshore capacity could be up to 30% higher [11].
Offshore wind farms share some of these issues affecting onshore wind growth but also alleviate some as well. Shared issues include the increased steel and transportation costs which affect offshore wind farming more due to the large amounts of infrastructure needed to establish a farm and integrate it into current grids. These problems are extended when farms move further offshore, which has been the case in recent years. Alleviations, however, include having fewer constraints on social acceptance due to these farms being mostly out of sight, allowing for more size and noise pollution to achieve higher capacities as wind farmers can use taller and larger turbines [13]. In 2016, compared to the average onshore wind turbine of 2.5-3 MW, the average offshore wind turbine was 3.6 MW, enough to power 1,500 and 3,300 average European households, respectively [14]. Recently, more countries are reporting offshore projects utilizing turbines of 8MW and up to 12 MW as technology advances. This is a benefit for the development of offshore wind farming as using higher capacity turbines has enabled capital costs to decrease as fewer foundations and cable systems are required to achieve similar energy outputs [13]. In addition, larger turbines allow for higher capacity factors as they can capture more of the high-speed offshore winds, and therefore runs its generator a greater percentage of the time [15].
3.2. Levelized Cost of Electricity of Onshore Wind and Offshore Wind
Currently, the cost of offshore wind farms can be up to 20% higher than onshore ones [16]. This considers the difficult nature of installing turbines over open water, integration costs, and the maintenance required compared to onshore farms. The integration costs are substantial as currently, offshore wind requires platforms and complex underwater cable systems that can transport electricity long distances with minimal power drop, in addition to increased safety features [16]. It is estimated that 15% of total costs for establishing an offshore wind farm is attributed to the electrical system [17]. The levelized cost of energy (LCOE) is a standard tool that is used to compare costs between different technologies. The LCOE is defined as the lifetime costs of an asset, based on average annual production, discounting the costs and energy over the lifetime of the asset, accounting for the time value of money [18]. Different studies indicate varying costs of onshore and offshore wind, but the figures are relatively close together. In 2017, UK offshore wind projects had a LCOE of £100/MWh (US$128.9/MWh), whilst offshore wind in the US had an LCOE of US$140/MWh [13,17]. This is relative to a minimum of US$30/MWh for onshore wind in 2017, with the world average at US$60/MWh ([17]. That year, offshore wind costs decreased due to modernizing technology, upscaling of wind turbines, decreased costs of financing (due to lower risks associated with projects), and competition within the industry [17]. A Wind Europe report forecasted the LCOE’s decline for offshore wind projects of up to 25-30% by 2030 [17]. This declining cost trend has been realized as in 2019, offshore wind’s LCOE fell 32% relative to 2018, with estimated costs at US$78/MWh [16]. Onshore wind costs have decreased as well with minimums costs of US$20/MWh [16]. Some studies suggest that offshore wind will be as affordable as fossil fuels in the near future. Some experts predict that by 2030, offshore wind LCOE levels will be approximately around US$56/MWh, with a range between US$44/MWh and US$72/MWh by 2050 [19].
3.3. Additional Benefits and Technological Advancements in Offshore Wind
Disregarding costs, offshore wind energy has other significant benefits over onshore wind farming. Offshore farms are viewed as more reliable and efficient. They produce a more constant generation of energy due to where these farms are located, as the wind is consistently more powerful and available [16]. As more countries around the world are adopting offshore wind farms and utilizing shallower waters for feasibility demonstrations and initial projects, they are now looking to expand farther from shore and into deeper waters. Conventional offshore turbines have fixed platforms that rest on the seabed in waters ranging from 18-50m deep, which means in most regions these types of turbines cannot be built more than 30km from shore. For many countries and specifically in the US and Europe, for example, 60% and 80%, respectively, of suitable offshore wind locations are in waters greater than 60m deep which would require a different design of turbines – floating structures [20]. Floating offshore wind’s LCOE is currently more than double a bottom-fixed turbine’s LCOE, but a report from Korea Science forecasts that by 2035, floating offshore wind could have an LCOE approximately equivalent [21].
Floating structures, of which have multiple forms, seen in the latter three structures in Figure 2, have the benefit of even faster and steadier wind speeds, with even lower environmental social costs as fixed offshore structure requires more compensation for civil complaints and impacts to the seabed ecosystem [21]. They can also be located in waters up to 1km deep [20]. However, as mentioned above, moving farms further offshore will only add to costs associated with electrical transport – a problem that can be alleviated by utilizing the production, transport, and storage of hydrogen gas.
4. Why Hydrogen Is Useful
Although offshore wind is generally a reliable source of energy, it is still labelled intermittent due to unpredictability of wind speeds. Therefore, intermittent power generation, in general, needs energy storage technologies that are able to balance supply and demand, and in the case for hydrogen, act as an intra-day and inter-seasonal storage, to be able to use the renewable electricity generated today, in the future [23]. Also, a plethora of literature assessing offshore wind energy envisions hydrogen as the main alternative for expensive and complex cable systems, where the gas acts as a carrier for storage and transmission [17]. This is feasible through implementing offshore electrolyzers that use the electricity generated from the wind turbines to create hydrogen gas. This is called green hydrogen as it uses renewable resources to produce hydrogen.
A Fitch Solutions forecast estimates that global hydrogen demand should grow from 80 million tons per year to 100 million tons in 2030, of which, in that year, the amount of green hydrogen that can be produced will be around 10 million tons per year [24].
4.1. Hydrogen Production
Current production of hydrogen involves the use of steam methane reformation (SMR), also known as Gas-to-gas (G2G), which is a process in which methane (natural gas) is heated with steam, and with a catalyst, produces a mixture of carbon monoxide and hydrogen that can be used as a fuel. This is called gray hydrogen as it emits harmful greenhouse gases, but less than brown hydrogen which is produced from coal. Major differences are seen in Figure 3. To lower the carbon footprint of SMR, blue hydrogen is produced by using carbon capture sequestration (CCS) technology, which is the process of capturing and storing atmospheric carbon dioxide [23]. This, however, increases the cost of production. Today, SMR is the most developed, established, and cheapest technology, producing 95% of the world’s hydrogen, whilst 4% is produced by the newer electrolysis method [23]. Currently, hydrogen is mostly used in oil refining and for production of fertilizers which gas produced straight from SMR is usable. In the future, as sectors such as transport and construction use hydrogen gas, it will need to be purified. For fuel cells in hydrogen powered vehicles, the hydrogen that can be used needs to be more than 99.999% pure hydrogen, to maintain the quality of the fuel cell catalyst, again, increasing costs to SMR [23]. Conversely, the hydrogen produced by electrolysis is already of high purity and can be directly used in these fuel cells [23]. In the short term, the US Department of Energy anticipates SMR will be the main source of hydrogen generation, but in the medium term, hydrogen will be created from wind-powered electrolysis [23].
4.2. Implementation of Green Hydrogen
Two main implementation strategies of green hydrogen - Power-to-gas (P2G) and Power-to-power (P2P) - are being developed and trialed today. Many believe that both are feasible within the short to medium term.
P2G strategy uses the electricity generated from renewable sources (offshore wind, for example) to generate hydrogen using electrolysis. After, the gas can be used in two ways. Firstly, the hydrogen generated can be injected into the existing gas distribution network, blending in with the natural gas already being piped through, which would significantly reduce greenhouse gas emissions [23]. Alternatively, hydrogen can undergo a methanation process in which it reacts with carbon oxides to create ‘synthetic’ methane, which can be used in any way that natural gas has been used previously [23]. Although the ‘synthetic’ methane, when used, emits CO2, using CCS technology has been discussed frequently, and the CO2 should be recycled to produce new methane or just captured and stored to reduce its carbon footprint [17].
Regarding offshore energy transportation, P2G, through either of the two methods, has been considered a feasible way to harvest far-out renewable energy resources where the transmission of electricity is either extremely costly or not available [17]. Granted, the second method of methanation would also enable easier transportation of energy in the form of ‘synthetic’ methane onto conventional ships and existing natural gas pipelines on and offshore [17]. Implementation would be smooth as pipeline infrastructures are established in most inhabited areas, both in small towns and large cities. Recently, P2G was regarded as a mature technology for storing and transporting intermittent renewables that also addresses both the issues of energy transmission and distribution [17].
However, there are still some barriers to the implementation of P2G. A transition to a hydrogen-based economy has often been regarded as a chicken-and-egg problem [23]. Hydrogen production and investment on such a large scale cannot start without a large demand for it, but on the other hand, demand is unlikely to pick up without the widespread availability of gas in a cost competitive manner [23]. This means that initial funding and development may be needed from the organizations (governments, development banks) to create initial availability and spark demand for more public or private investors to expand hydrogen networks. Blending hydrogen into existing pipelines would provide a boost to hydrogen availability without extremely high investment costs and risks associated with new hydrogen infrastructure (dedicated hydrogen gas lines) [12]. In literature that investigates the economic feasibility of P2G systems, transporting energy through pipelines has 4.5 times more energy transport capacity and 4 times lower transmission losses than the high-voltage transmission lines discussed above [17]. Regarding whether it is economical to build dedicated hydrogen gas lines or even feasible to use existing natural gas networks, a constraint with using existing ones for blending is the amount of hydrogen that can be injected into them. The energy density of hydrogen is a third of that of natural gas and therefore blending would reduce the energy content in a given volume [12]. A 3% hydrogen blend in natural gas pipelines would reduce the energy that the pipeline transports by 2%, which means end users would have to use higher volumes of gas to obtain similar energy needs [12]. This presents the biggest issue for the industrial sector where certain tasks have not been certified or trialed in detail for blending and would possibly require additional government regulation for safety. For households, the Netherland’s Ameland project found that hydrogen blending up to 30% was feasible and did not present difficulties for devices such as boilers, gas hobs, and cooking appliances [12]. In the future, some end-user appliances will need to be converted. Also, blending requires that the existing natural gas network has durability and tolerance for hydrogen. After around 20-30% blending, it may be necessary for pipes to be strengthened. Some metal pipes, when exposed to hydrogen over long periods, start to degrade, whilst materials such as polyethylene can handle up to 100% hydrogen [12]. Therefore, some countries are discussing dedicated hydrogen gas lines, which would be very costly, or modifying their existing natural gas lines to accommodate blending. The cost of dedicated hydrogen lines is around 6-10% higher than conventional gas lines [17]. Pipelines, however, are most likely to be the cost-effective and long-term choice for hydrogen distribution if there is demand for gas [12]. Methanation, on the other hand, mitigates most of these issues but has the added costs of CCS to make it have less of an environmental impact.
P2P strategy also uses the electricity generated from renewable sources (offshore wind, for example) to generate hydrogen using electrolysis. Hydrogen is then stored in pressurized tanks or underground caverns (intra-day or inter-seasonal storage) and when needed, re-electrified using a fuel cell or a hydrogen gas turbine [23]. This method can be thought of as a battery where electricity produced from renewable sources during high supply and low demand periods charges the battery and stores the electricity, then in times of low supply and high demand, the electricity can then be discharged [26]. Otherwise, renewable energy would just be wasted in time of low demand. This reduces the difference in demand peaks, providing stability to the power grid [26]. Fuel cells typically have slower response times compared to lithium batteries, which can rapidly adjust their output to meet immediate fluctuations in power demand. This makes lithium batteries suitable for handling quick power surges, while fuel cells are better suited for providing steady, continuous power [27]. Consequently, hybrid systems that combine both technologies are often used to capitalize on the strengths of each. In these systems, lithium batteries manage the rapid changes in load by quickly responding to increased power requirements, and fuel cells contribute sustained power for longer periods, ensuring overall system efficiency and reliability. This hybrid approach is particularly effective in applications requiring both dynamic response and enduring power supply.
However, a study in 2018, focusing on P2P reviewing main fuel cell technologies, concluded that since current fuel cells do not have great efficiencies (approximately 40% to 55%), the best way to use this method was to utilize the heat generated [27]. P2P systems for countries with ample availability of renewable energy sources and large alternative energy storage in hydro power plants would not be applicable and therefore would be better used in places where energy storage is an issue [28]. Although, hydrogen may present itself as a more efficient storage solution as relative to other largescale storage options (hydro). Gas can store large amounts of energy per unit volume with over 200 times the volumetric storage density of hydro pumps [23]. Notably, fuel cells also have a relatively short lifespan, which is a significant hindrance to their commercialization. The limited lifespan, often due to intricate operational conditions and component ageing, necessitates the implementation of effective prognosis and health management systems [29]. These systems are crucial for enabling proactive interventions that can prevent failures and extend the operational life of fuel cells [29].
For both methods, electrolysis requires high-purity water and electricity to produce hydrogen. Seawater contains salt and other impurities that could damage the electrolysis equipment. To use seawater, it must first be desalinated, which adds an extra step and associated costs to the hydrogen production process. Desalination, particularly through reverse osmosis, is an effective way to purify seawater. The energy requirement for desalinating seawater is about 3-4 kWh per cubic meter, translating to a cost of around USD$0.70 to $2.50 per cubic meter, depending on the technology and scale of operations [12]. While this is an additional cost, it is relatively low compared to the overall costs of hydrogen production. The IEA estimates that incorporating seawater desalination into the hydrogen production process would increase costs by only USD $0.01 to $0.02 per kilogram of hydrogen [12]. This minimal increase suggests that while the acid-based environment necessitates additional steps like desalination, the impact on overall hydrogen production costs is modest. Current electrolyzers have an efficiency of 60-80%, requiring about 9 liters of water to produce 1 kg of hydrogen [12]. Considering this, along with the by-product of 8 kg of oxygen which can be sold, the revenue from oxygen can offset some of the hydrogen production costs, including the cost of water purification. In regions where freshwater is scarce, the option to use seawater becomes even more attractive despite the additional desalination cost. The linkage of offshore wind farms with hydrogen production using seawater could be particularly synergistic, leveraging the location for both wind energy capture and water sourcing.
The best strategy for implementation of hydrogen into the economy depends on numerous factors, each with its own trade-offs associated. These include technological and implementation costs, efficiency, decarbonizing impact, practicality, social acceptance, and much more. For now, action has to be taken to scale up production and widespread use and availability to enable the snowball effect which would, in turn, allow for the transition into a hydrogen economy.
5. Economics of Hydrogen
As the world transitions into applying more low-carbon energy sources into economies, for increasing the widespread uptake in demand for hydrogen gas, costs still need to become on-par or even cheaper than existing fuel sources being utilized today. Various cases looking into the ideal costs of hydrogen are outlined below. Costs, rather than looking at carbon emissions, are just one variable to consider when considering the likeliness of switching fuel sources, but they are one of the most important factors to consider for business and household use.
Integrating offshore wind power with hydrogen production to support a hydrogen economy, particularly for combined heat and power (CHP) systems, involves using the high-energy output from offshore wind farms to power electrolyzers that produce hydrogen directly at the source. This hydrogen can then be stored and transported to shore where it can be utilized in fuel cell CHP systems to generate both electricity and heat efficiently. This setup leverages the constant and powerful offshore winds to maximize hydrogen output, reducing transmission losses and making use of hydrogen’s high efficiency in fuel cells to supply clean energy and heat with minimal environmental impact. This approach requires robust infrastructure, advanced technology, and supportive policies to be economically viable and sustainable. Using hydrogen fuel cells for CHP in residential and commercial buildings is a viable strategy as the gas is used to generate power, with residual heat being used for hot water, or space heating. It is projected, in North England, that this method will be viable in 2030, with a cost of hydrogen around US$1.9/kg H2 (NZ$2.86) [30]. Compared to cost estimates presented in multiple journals, this price is very low by 2030, as optimistic estimates and government goals project costs of US$2/kg H2 (NZ$3.01) by 2050.
Backup generators may also be potential end use for H2, and it is currently fueled with either diesel or natural gas. Using fuel cell generators may be viable and presents remote locations a carbon friendly alternative to fossil fuels where they do not have access to grid-electricity or batteries powered by renewables. To breakeven, however, delivered costs of US$6/kg H2 (NZ$9.03) will need to be obtained, with transportation to very remote locations being a large contributor to the delivered cost [30]. This emphasizes the importance of sound hydrogen transportation technologies and established supply chains as reducing these transmission costs will present large opportunities especially with the declining costs of the gas itself.
For large-scale grid power generation, this method would need to be as stable and resilient as current fossil fuel powered ones and some companies are looking into turbines that would combust 100% hydrogen for peaking, as well as baseload power generation. However, baseload power generation is only likely in areas where there is low potential for renewable energy, and other alternative fuel methods are not feasible [30]. The option for these regions is to import gas for an assumed price of US$3/kg H2 (NZ$4.51), of which the power produced from this would be US$140/MWh (NZ$210.79) [30]. Compared to the unsubsidized natural gas generation LCOE from Lazard above, US$44-73/MWh (NZ$65.85-109.26) is much cheaper [31].
A report by the Asian Development Bank stated that in East Asia, hydrogen should be as cheap as US$0.53-0.85/kg H2 (NZ$0.80-1.28) to compete with coal, and US$1.29-1.41/kg H2 (NZ$1.94-2.12) to compete with natural gas as shown in Figure 4 [32]. This only considers the cost, insurance, and freight costs of imported energy. For use in transportation, only considering the comparison of fuel costs, costs of US$4.24-5.00/kg H2 (NZ$6.38-7.53) are needed to compete with internal combustion engine vehicles (ICEV) [32]. The high capital costs of FCEV, in combination to the costs of hydrogen supply, make the per km costs of FCEV double that of ICEV [32].
6. The New Zealand Context
6.1. Opportunities
At 85%, New Zealand has the fourth highest renewable electricity percentage in the OECD and is looking to get to 100% by 2035 [33]. Other targets include a greenhouse gas emissions reduction of 30% by 2030, relative to 2005 levels, and net zero emission by 2050 [34]. Even though electricity is from mostly renewables, NZ’s total energy supply is only comprised of 40% renewables, with the rest from fossil fuels, to use during periods of peak and dry year demands [34]. There is still significant untapped renewable energy potential in the country such as wind, solar, and biomass, and will be needed to meet their ambitious target by 2035. In March 2020 the Ministry of Business, Innovation, and Employment released a report which identified potential 8GW of offshore wind capacity in NZ but noted that development to harness this, was unlikely before 2050 due to vast amounts of onshore site potential that still exists [35]. NZ notably has one of the best wind resources in the world due to its location where constant westerly winds travelling across the ocean are uninterrupted by other landforms [35]. According to the World Bank data [36], it is evident that NZ has extremely large potential for floating fixtures, relative to its potential for fixed foundations. It is also among the leaders of energy potential in the East Asian and Pacific region, just behind Australia and China.
Electricity demand in NZ is significantly increasing with Transpower, a state-owned electricity company, forecasting in 2018, that demand will grow from 43TWh/year to 88TWh/year by 2050 [37]. This includes the assumptions that many sectors in NZ will be electrified, such as transport and some industrial processes, also accounting for the fact that energy systems will become more efficient in the future [37]. As mentioned above, NZ experiences dry winters, which is where the energy output from hydro power plants (the majority of electricity generation) decreases during the winter whilst electricity demand for heating and lighting increases. With NZ scaling up to become 100% reliant on renewable electricity sources by 2035, the storage of excess electricity generation to counter seasonal shifts is important to give the country’s grid more reliability and not have to burn emergency fossil fuels as they have done before. Hydrogen is likely to be the answer to this problem.
In 2019, the NZ government released a green paper titled ‘A vision for hydrogen in New Zealand’ which looked into the potential for hydrogen production, export, and utilization in the economy. Like other countries that are looking into hydrogen, they envision hydrogen to act as a versatile energy carrier, using excess electricity from summer generation to produce hydrogen to be stored for use in winter, and also possibly using existing natural gas pipeline networks for transmission and distribution [33]. In addition, they will use existing oil and gas rigs to construct electrolyzers and offshore wind farms to be used in conjunction with one another [33]. With proximity to potential hydrogen importing countries such as Japan and South Korea, the government aims to develop green hydrogen as a potential export [33]. These countries may be good partners as when NZ’s lower energy consumption occurs during its summer months, major north Asian markets experience high winter demand and therefore NZ can use surplus electricity to produce hydrogen for export. They have noted that further studies should be undertaken to identify how hydrogen can realize these potential export earnings whilst creating jobs in the process ([33] “A vision for hydrogen in New Zealand”, 2019). A December 2021 Power-to-X report by Venture Taranaki, an economic development agency in New Plymouth, also explored using green hydrogen to produce green methane, to replace existing natural gas [38]. It regarded this process as a ‘simple substitute’ as it can easily replace current non-renewable natural gas by using existing infrastructure such as storage in Ahuroa Gas Storage Field, with an easy transition by using the same appliances and gas fired power stations currently being utilized today [38]. However, this report did not discuss the use of CCS, which is an important aspect of using natural gas and still achieving net zero emissions.
A particular site for potentially large projects in offshore wind and hydrogen is in Taranaki, located near the middle of the country, and its waters surrounding the area. Analysis from the Department of Civil and Natural Resources Engineering from the University of Canterbury showed that South Taranaki’s offshore wind is a very viable source of energy with 1065km2 of suitable area for fixed foundation turbines, with additional space for floating ones also being identified [39]. At existing gas fields in the area, Māui A and Māui B as seen in Figure 5, the mean 5-year wind speeds at these sites were 10.12 m/s and 10.73m/s, respectively, with Māui B being further offshore than A [39]. Ishwar and Mason [39] also expected capacity for offshore wind based on the wind speeds from Māui A to be 56.9% gross, and 46.3% accounting for downtime losses. This would mean that the site, accommodating a 7016MW wind farm using 877 x 8MW turbines, would produce approximately 28,456 GWh/year [39].
This analysis is backed up by an offshore wind discussion paper from Venture Taranaki who add that the region has significant areas of water with less than 50m depth and a flat seabed, which are suitable for fixed turbines [37]. Venture’s analysis suggests an even larger suitable area in South Taranaki for fixed turbines with 1,800km2, adding that 370km2 in North Taranaki are suitable as well [37]. When fully developed, the wind capacity in these areas could reach 12GW and 2.4GW, possibly doubling NZ’s current electricity supply from these farms alone [37]. Considering floating turbines, the report suggests another 14,000km2 of suitable area for this method, possibly adding 90GW to NZ’s grid, far surpassing the energy demand forecast for 2050 [37]. Whether or not it is feasible for offshore wind to meet its construction targets of 26,620 GWh/year between 2020 and 2050, Ishwar and Mason [39] found that a build rate of 0.0046 years/MW would be required. With build rates of less than 0.005 years/MW currently in operation in Europe, it may be feasible for NZ to follow suit and achieve their targets. Venture Taranaki, is partnership with the New Plymouth District Council and Hiringa Energy, has also released a report called ‘H2 Taranaki Roadmap’ which looks at a series of potential business scenarios for adopting hydrogen in the region. They envision Port Taranaki to become a hub for hydrogen export, with the port experienced in handling industrial chemicals [34]. They would use existing gas networks to cost-effectively transport hydrogen generated elsewhere back to the port, to be ready for export, with potential for integration with international supply chains established through the fossil fuel industry [34]. Current hydrogen production in Taranaki is 100% brown hydrogen, which is hydrogen generated from burning coal, but the report acknowledges the potential for large scale blue and green hydrogen [34]. Currently, with the position of natural gas reserves in NZ, one of the main purposes for the initial production of blue or green hydrogen would be to decarbonize the existing natural gas network but can also be applied to transport, remote or backup energy, export, and much more [34]. Lastly, the report projects the cost of green hydrogen electrolysis to fall to parity with installing new brown hydrogen generators due to economies of scale and the reduced cost of renewable energy, particularly from offshore wind in Taranaki [34].
Another large-scale project taking place in NZ regarding green hydrogen is First Gas’ plan to supply the gas through their existing natural gas network. First Gas Limited focuses on natural gas transmission and distribution in NZ and has over 2,500km of high-pressure gas transmission lines, receiving natural gas from Taranaki and supplying it all around the North Island [41]. They are currently undertaking a three-phase feasibility study, investigating whether they can use their existing pipes alongside the conversion of current equipment. From this study, they aim to have the first commercial pilot project of green hydrogen in NZ which will incorporate the full supply chain, from production to distribution and finally to end users [41]. The report outlines many benefits of incorporating hydrogen such as avoiding needing to compress the gas for transport, avoiding energy losses and additional costs, and also avoiding truck movement which has multiple safety and environmental implications [42]. In addition, like Australia, the company wants to create multi-use hydrogen ‘hubs’ which will enable demand across different sectors [42]. First Gas’s initial target is a 20% blend of hydrogen, then ramping it up to 100% starting in 2035 [42]. Early findings of the study found that their existing high-pressure, long distance transmission system has the capacity to transport the expected energy demand either blended or pure hydrogen, without significant capacity reinforcement [42]. Modification costs are estimated to be around NZ$270 million over the 30-year period to 2050, assuming the electrolyzers will inject hydrogen at high pressures into the network, requiring existing compressors to have to do less, saving on operating costs [42].
In terms of government support, the Power-to-X report also stated that offshore energy generate currently has no framework that enables or inhibits it, but consideration should be given to develop one to provide stakeholders with certainty, especially when dealing with such large-scale and long-term developments [38]. To help boost offshore wind and hydrogen in NZ it would require central government support and funding through legislation, targeted projects (green methane), feasibility studies and demonstrations, and more [38]. Many articles also recommend partnering with international specialized experts to solve logistical issues and apply their experience with more developed projects to ensure that NZ can implement these renewable energy sources in a timely manner to meet their international obligations.
6.1.1. Export
A factor which would pique interest from various parties, and subsequently further develop and invest in projects regarding hydrogen, is its export opportunities. As stated above, NZ, due to its geographical location and favorable negatively correlated seasonal patterns, can possibly be a large exporter of H2 to Asian countries that do not have adequate renewable potential to satisfy their green hydrogen demands. Countries around the world are looking into producing hydrogen, of which an international spot market is needed in order to truly see if exporting is economically feasible or what the associated opportunity costs from engaging in such activities [43]. Current H2 export initiatives are being explored by Brunei and Australia and Japan, but these countries are still using grey hydrogen to test their supply chains, and, in the future, green hydrogen should be used as a replacement to achieve carbon emission goals [43]. However, some studies have investigated the costs and methods of green H2 export potential, specifically for NZ, and have provided estimates and scenarios for interpretation.
A study in 2021 from Victoria University of Wellington reviewed the development of an export market of green hydrogen to Japan looking into difference between exports as ammonia or exports as liquid hydrogen. The paper looked into potential for two of the major electricity generators in NZ, Contact and Meridian, to build the world’s largest green hydrogen plant. This opportunity would arise in 2024 with the closure of the Tiwai Point aluminum smelter of which 600 MW of high-capacity energy previously used to produce the metal would be redirected into producing green hydrogen [44]. It was concluded that large scale imports in Japan would be unlikely before the late 2020s considering that the supply chain that Japan proposes is in very early stages of development with only one LH2 carrier protype (Suiso Frontier) constructed [44]. Looking into whether ammonia or LH2 would be the main type of export, it was noted that each has their own merits. LH2’s advantages include increased supply chain efficiency, easily meeting the purity levels required for fuel cell applications, lowest energy consumption for formation, and possibly the lowest shipping losses if a supply chain from Bluff, NZ to Yokohama, Japan were to arise [44]. Conversely, ammonia has the advantage in the short to medium term as there is already existing infrastructure for export of which many parties are familiar with, but the efficiency losses may be extensive if the end-user is to convert it back to hydrogen and not for agricultural purposes as fertilizer [44].
A report by Contact Energy and Meridian in July 2021 also looked into the two different options of export above and stated that it is currently not clear whether ammonia or LH2 will be preferred but added onto ammonia’s advantages [45]. These advantages include that over hydrogen, ammonia’s volumetric density is much better, with a liter of ammonia carrying 50% more energy than a liter of LH2, or 2.8 times the energy of compressed hydrogen [45]. Additionally, ammonia has an easier means of storage and transportation, with more versatility for its end-users [45]. 2030 cost estimates suggest NZ could achieve landed costs of NZ$5-6/kg (US$3.34-4.01) of green H2, with green ammonia costing NZ$800-830/ton [45]. Modelling provided in this report show that exports of NZ produced green hydrogen to, for example, Japan would be worth US$4.30-5.60/kg (NZ$6.60-8.60) by 2025 [45]. The report also suggests that at this cost, it would remain competitive against blue hydrogen produced in the Middle East up to 2030 or longer, depending on carbon capture technology and storage costs in that region [45]. In the long-term, green H2 from countries such as Chile or Australia from large domestic renewable sources would be internationally competitive, and NZ would need to reduce the cost of its own renewable generation and developments if competitiveness in the export market was desired. Figure 6 shows the landed (all-inclusive) costs of green hydrogen from multiple sources, of which the graph aims to show that an NZ supply of hydrogen is cost competitive with potential international producers, therefore being an exporter may be feasible.
Concept Consulting’s H2 report shows estimates for hydrogen production after being converted to either liquid H2 or ammonia. Figure 7 presents estimates for various contributing factors. LH2 delivered costs would be NZ$44/GJ (NZ$5.3/kg H2 [US$3.54]), and ammonia’s delivered cost would be NZ$54/GJ (NZ$6.48/kg H2 [US$4.33]) [43]. The economic feasibility of this price depends on alternative sources of these commodities and their respective input prices. Kawasaki Heavy Industries in Japan states that importing hydrogen would be commercially viable if landed costs would be around NZ$35/GJ (NZ$4.2/kg H2 [US$2.81]), of which Concept notes that their estimate price is comparable with this figure [43]. Also, current landed costs of liquified natural gas to Japan is approximately NZ$14/GJ and for NZ$44/GJ of LH2 to be economic, a NZ$550/tCO2 carbon price would have to be imposed in Japan [43]. NZ’s current carbon spot price is around NZ$76/tCO2 [46]. The report stipulates that to meet its own decarbonization requirements, before looking at exports, NZ would need to double its electricity generation [43]. On the other hand, Japan would need foreign renewable generation 125 times greater than the extra generation NZ would need, in order to decarbonize using imported green hydrogen [43]. Therefore, even with the potential for other nations to be large suppliers of green H2 to Japan, with lower costs as well, the scale of their decarbonization goals suggests that there would be a market for NZ produced hydrogen. As NZ already has significant penetration into renewable electricity generation, Concept states that NZ could be an ‘attractive partner’ for proof-of-concept trials in potential supply chain and export projects [43].
6.1.2. Storage
Preliminary studies have assessed the geostorage options of green hydrogen in NZ as the country already has an extensive petroleum infrastructure already installed. There are approximately 2500km of high-pressure gas pipelines, with 17,960km of gas distribution networks, and multiple depleted petroleum fields such as Ahuroa, Kapuni, and Maui [47]. Geological storage, technology being utilized since the 1970’s, is considered the best large-scale option for hydrogen storage globally, with four types being considered [47]. These types include: the construction of artificial rock caves, injection into sedimentary rocks, utilization of depleted natural oil and gas caves, and even a study looking at storage in porous and permeable volcanic rocks [47].
The Ahuroa Gas Storage facility located in central Taranaki stores natural gas from offshore sources until it is needed. Discovered in the 1980s, it was a natural gas reservoir which was largely depleted in 2008, then subsequently converted into a storage facility owned by Firstgas [48]. Currently, with specific valves and compressors, natural gas is injected and stored until required. Firstgas recently upgraded the capacity at Ahuroa but to make the gas reservoir capacble of storing hydrogen, more investment would be needed, including new compressors which are capable of injecting and extracting hydrogen rather than natural gas [43]. It is noted in a report by Concept Consulting that Ahuroa is not large enough to meet current demand for dry-year reserves, along with the fact that hydrogen is less energy dense than natural gas, therefore approximately only 1/3 of the energy would be stored by fully filling Ahuroa with hydrogen [43]. A study by Elemental Group and the NZ MBIE shows potential locations of geological storage in NZ and potential uses for each as shown in Table 1. These locations were chosen given their proximity to high voltage transmission cables and existing infrastructure for an efficient transition to inject electricity into the grid when needed through fuel cell technology.
Other studies overseas state that there is also potential reservoir leakage due to hydrogen being a smaller molecule than natural gas, adding onto energy losses [43]. Therefore, using this specific reservoir would only be a partial solution and more options would be needed for that future.
Other means of storage and transportation of hydrogen include:
- Ammonia (material-based storage), as the costs of storing and transporting this chemical are much cheaper than storing H2 itself. However, there are significant efficiency losses associated with this process as electrolyzer generated hydrogen would be converted into ammonia, then back to hydrogen when it is needed for power generation [43]. Whilst electrolyzer energy losses could be as low as 25%, the conversion and reversion will increase energy losses to 59% [43]. Therefore, storage and transportation of hydrogen as ammonia may present higher costs relative to using a natural gas reservoir such as Ahuroa. Currently, NZ only has one ammonia-urea manufacturing plant located in Taranaki, converting atmospheric nitrogen and hydrogen into ammonia, then subsequently to urea, both of which still have carbon emissions due to natural gas usage in the process [33]. There is an established export market for ammonia, and it could be essential as a near-term means of storage and transportation as established processes make it easier for a transition into a hydrogen economy.
- Compressed H2, by using specific compressors and stored in tanks. The volume of hydrogen is almost four times as large as natural gas, therefore, H2 needs to be compressed for practical purposes [50]. Also, FCEV uses highly compressed hydrogen and therefore if this was the main end-user application, then it will be beneficial to have the gas compressed and stored in this form after production [50].
- Liquified H2, if further compression of the gas is required. The current Japan-Australia hydrogen supply chain tests are using liquified hydrogen as the carrier method for overseas shipment but the process of liquifying and storing it is very complex and costly. As mentioned above, hydrogen liquifies at -253°C and needs to be stored in insulated tanks for minimal temperature and evaporation losses [50]. Economies of scale may make liquefaction more feasible in the future.
Overall, to combat dry-years and include inter-seasonal hydrogen storage, further research is required for potential sites of geological reservoirs in NZ, and some studies have focused on areas around proposed renewable energy and hydrogen generation, but it may be needed to expand this criterion to sites nationwide. It is evident that for a wide range of purposes, different means of storage and transportation may be required, and it will be imperative to know which is most efficient for specific purposes.
6.2. Employment
A research project from the University of Auckland analyzes the future employment opportunities that arise through the development of offshore wind farms in NZ. The study [49] assumes that 9.9 out of the 90 potential GW (from a Venture Taranaki report) of offshore wind is realized, looking at the medium-term and up to 2050. Important terms in the project include looking job creation either directly or indirectly. Direct jobs are those involved specifically in wind farming itself, employed by developers and operators, whilst indirect jobs are employed by the providers of suppliers or services to the windfarm activities [51].
Assuming the 9.9GW of offshore wind generation is to be developed within 20 years, the industry is expected to scale up, with improving supply chains over the years expected to boost the development of wind farms [51]. Figure 8 shows the potential ‘full-time equivalent’ (FTE) positions that will be generated across various sectors over the span of 20years. In terms of total FTEs, the maximum total FTEs are due to direct, indirect and induced impacts of offshore industry under green vision scenario whereas the minimum total FTEs is observed to be under Electrification scenario.
6.3. Costs
An ideal scenario for using renewable energy for green hydrogen in NZ is to connect electrolyzers to the electricity distribution grid for peak utilization as grid power is not intermittent unlike most renewable sources. An assumption for this, however, is that renewable electricity will reach a certain capacity, where it is certain that the hydrogen produced from the grid will still be green. The aim is to produce hydrogen in times of low industry and household demand to take advantage of surpluses in electricity supply. This way, the minimum electricity input costs (of which has the most impact on H2 production costs) are effectively close to zero because otherwise the excess electricity generated from renewables would just go unused. At a maximum, a hypothesis for the cost estimation of electricity input would be how much it costs to add new electricity capacity to the grid as mass produced hydrogen would likely only be feasible once costs and economies of scale of renewable energy are prevalent. This section analyzes modelling done by Concept Consulting that investigates the cost estimates of a similar plan, including other scenarios. In addition, these figures will be compared with other pieces of literature, including modelling done by NZ’s Ministry of Business, Innovation, and Employment (MBIE) and Castalia, for the future hydrogen supply and demand. As each piece of modelling assumes different scenarios and accounts for different variables, it would be unfair to simply compare them side-by-side. However, it is interesting to compare and note estimated variables such as wholesale electricity costs and the range of final cost projections produced by each model.
Concept’s core model assumes that green hydrogen will be produced through a grid electricity distribution network using electrolyzers, then compressed, and lastly, stored in bulk. The model looks at the all-inclusive costs of doing so, including components such as wholesale electricity, network costs, efficiency losses throughout the process, CAPEX, storage, and OPEX costs. The electrolyzer utilization factor estimated is 85%, and is relatively high when compared to Castalia’s modelling as its base case in 2020 shows an electrolyzer utilization factor of 41.5% ([43];[53]). The electrolyzer utilization factor is the ratio of the demand that the electrolyzer is in use relative to the total time that it could be in use [52].
Castalia’s model identifies key variables that affect the estimated future levelized cost of green hydrogen production, demands for the gas, CO2 emissions reductions, and includes an indicator of what role hydrogen is likely to play in the NZ economy. This model accounts for variables such as electricity costs and electrolyzer utilization factors in NZ and internationally, natural gas and diesel price changes, and even the percentage that hydrogen can be blended into the existing gas network, among others. Given all these variables, the model agrees that the levelized cost of hydrogen is most sensitive to wholesale electricity costs [53]. Some figures represented in the base case are a NZ$61/MWh electricity cost for 2020 with a -0.25% expected annual decrease in prices both in NZ and internationally, whereas Concept estimates a NZ$75/MWh current (2019) and future (2039) electricity cost [43,53]. A separate report by MBIE in 2019 on electricity demand and generation scenarios projects wholesale prices in 2050 to stay the same in real terms, incorporating the assumption that majority of new electricity generation is from wind power, with its long-run marginal cost projected to fall over the projected period [54].
Figure 9 breaks down the factors considered in calculating the cost of green hydrogen. Figure 10 further shows the breakdown cost of current (2019) and future (2039) hydrogen production. Concept reports an estimated NZ$8.91/kg H2 (US$5.95) current production costs and NZ$6.94/kg H2 (US$4.64) in 2039 of which is relatively high, compared with estimates from other literature. Castalia’s base case estimates that the levelized cost of hydrogen currently (2020) is US$3.83/kg H2 (NZ$5.72) and in 2039, around US$2.68/kg H2 (NZ$4) [53].
It is not clear whether Castalia had accounted for some of the costs that Concept had, but the difference is significant given the fact that for hydrogen to be an economical fuel source for the future, the cost needs to be driven as low as existing widespread fuel sources such as fossil fuels.
Concept Consulting also provided modelling for alternative uses of hydrogen potentially to alleviate some of the larger costs stemming from hydrogen storage. Figure 11 shows the key variables influencing hydrogen production costs and includes justifications for why certain costs are relatively large or small. One example that avoids storage costs is P2G. However, it is worth noting that the model does not account for end-user transportation costs, which may increase total costs.
Two types of P2G scenarios include Gas Dx injection and Gas Tx injection. The differences between the two are that Dx injection goes directly to the gas distribution network, avoiding compression losses, whilst Tx injection going to the gas transmission network and has compression losses [43]. Compared to the bulk storage scenario, compression losses are halved, including other assumptions such as lower electricity network costs, less electricity distribution losses, and lower electrolyzer costs from an assumed larger scale production facility. A caveat with Tx injections is that it may be hard to control hydrogen concentrations to a regulated and safe level if the large scale H2 production is being injected at a single point [43]. This problem may be alleviated by co-locating natural gas and hydrogen production, which could be done in, for example, in Taranaki, or by using dedicated pure hydrogen pipelines. Other options include:
- Service stations: For uses in fuel cell electric vehicles (FCEV), where high compression is needed, leading to double compression losses compared to bulk storage. This also includes service station overhead costs, similar to building a petrol station.
- Off-grid: Similar to the bulk storage case but avoids network costs as hydrogen is produced with an off-grid energy supply. A caveat to this, however, is that it will incur large storage costs and lower electrolyzer utilization factors. Lower utilization factors are due to the intermittent nature of renewable electricity supplied compared to using grid electricity, leading to larger capital recovery costs per kg of produced H2. In Figure 10, an assumed utilization factor for this scenario is based off solar generation which is much lower than that of offshore or onshore wind. Also, this scenario may lead to higher wholesale electricity costs if local renewable generation is not able to achieve the same economies of scale and grid generation. Currently, if we were to apply the cost of generating more MWs from offshore wind as the electricity cost variable, it would be uneconomical as offshore wind is very expensive. However, in the future if projections for lower offshore wind costs are to be realized, this method may become more cost effective, given the higher electrolyzer utilization factors associated with this type of renewable generation. Concept’s assessment, however, is that the cost effectiveness of off-grid method is only realized when the electricity network costs from connecting to the grid are higher than what is shown in Figure 11 [43].
- Grid-gen & gas-grid overlap: Similar scenario to Gas Tx injection, however, in this case the grid connected renewable energy generators are located close to a gas transmission line. Additionally, with an electrolyzer placed behind the renewable generation plant, incremental electricity network costs can be avoided. This scenario is cost effective and is evident as in Figure 10 this gives the lowest hydrogen production costs compared to the other scenarios. Possibilities for this method in NZ would be in, for example, Taranaki, where established gas transmission lines and potential for large renewable generation is in the same proximity.
Other studies have looked specifically into the economic viability of combing hydrogen production specifically with onshore and offshore wind energy, and produced cost estimates based off case studies, of which would be most similar to the off-grid scenario:
- One study investigated the potential of green hydrogen production from wind-generated electricity in Pakistan using 660kW wind turbines and results concluded that production costs of green hydrogen were US$4.304/kg H2 (NZ$6.48), with supply costs withing a range of US$5.30-5.80kg/H2 (NZ$7.98-8.73) [55]. These estimates included costs such as CAPEX, storage, configuration, OPEX, water supply, and even considered the selling price of oxygen to offset some of the costs. They reported that at the four sites the examined in Pakistan, 10.5 tonnes/day of hydrogen can be produced, with potential for optimization in summer when country wide electricity demand is lower [55].
- A study conducted in Ireland looked specifically at offshore wind in their country with their case study comprising of a hypothetical 101.3 MW total capacity on Ireland’s East coast. Their model considers a specific type of electrolyzer (PEM), varying wind speeds in the area, electrolysis plant size, wind power out, and includes cost-effective underground means of storage. They concluded that the farm would be profitable at €5/kg H2 (NZ$8.48 [US$6.76]) (with all estimated variables using 2030 costs from various literatures), with underground storage potential ranging from 2 to 45 days with the latter becoming less economical due to the larger capital costs associated with underground storage [56].
Referring back to Figure 11, to achieve lower costs in each scenario, wholesale electricity prices must decrease in order to be competitive with existing fuel options. This may be possible with high penetrations of wind, solar, and geothermal energy in the future, which will lead to periods of surplus energy in order to collapse electricity prices. Concept also incorporates electricity network costs and suggests that to lower these costs, end-users who can avoid peak time consumption should be rewarded with lower costs to achieve lower network bills [43]. However, with these costs falling, other ones arise. With the level of demand for hydrogen to increase one it becomes economical; production facilities would require larger electrolyzers and storage to meet this demand. These higher capital costs are spread over a smaller amount of hydrogen produced, which means that per-unit costs will be higher [43]. This effect may be mitigated if technological advancements reduce CAPEX costs of both electrolyzers and storage.
The report by Concept also analyzes the impact that renewable penetration has on wholesale electricity prices and how they arrived at their cost estimate in Figure 12. The model provided in Figure 11 shows potential future electricity prices given NZ’s current renewables mix and a change to higher proportions of renewables, accompanied by high carbon prices in the future. With higher penetration of renewables there may be periods of lower wholesale electricity prices due to surplus production, which are also offset by times of scarce supply, which is how Concept reached their time weighted average wholesale cost of NZ$75/MWh, stating that this is the level that is ‘required to support new baseload generation’ [43]. The reduction in electricity prices can be attributed to the merit order effect, which suggests that integrating large-scale renewable energy sources such as wind and solar into the grid lowers electricity prices by prioritizing these low-cost generation options [57]. Figure 12 shows the price-duration curves for current mix (Original), high renewable penetration causing a price collapse of 25% of the time (Scen 2) and high renewable penetration causing a price collapse 55% of the time (Scen 1). Price collapses occur with major surpluses in electricity supply, so it is pivotal for renewable generation to exceed projected electricity demands in the future.
Figure 12 shows that in both scenarios with high renewable penetration, price collapses allow wholesale prices to fall below NZ$50/MWh. This is significant as Lazard estimates that the unsubsidized LCOE for gas combined cycle generation is between US$44-73/MWh (NZ$65.85-109.26) ([29] Lazard, 2020). This shows that a future with high renewable penetration can be potentially cheaper and will be environmentally friendlier than using natural gas in NZ. It is important to note that this modelling assumes small scale hydrogen production, potentially for use in decarbonizing certain sectors (not for export), as it assumes that the increased electricity demand from using the cheaper electricity to produce hydrogen does not reduce the surplus to the extent that the price collapse does not occur. If a future strategy is to use the surplus electricity to minimize H2 production costs, then there should be an incentive to dramatically increase new renewable generation for a large surplus to occur, for larger scale production purposes.
The case of high renewables penetration is reiterated with modelling comparing P2G scenarios with varying levels of renewable energy. The two P2G scenarios in Figure 11 (Dx and Tx injection) are two of the least costing strategies as storage costs are eliminated. Figures 13a,b show the modelled future hydrogen production costs for P2G, with Figure 11 showing costs with current levels of renewables, and Figure 13b showing an opportunistic high renewables penetration. From these graphs, it is evident that the average per unit cost of hydrogen production is lower at sites operating with higher renewable energy utilization. Specifically, the cost is approximately NZ$1/kg cheaper—about NZ$4/kg as shown in Figure 13a compared to NZ$3/kg in Figure 13b. This shows that renewable penetration has a significant impact on the H2 production costs. Due to trade-offs between wholesale electricity costs and higher capital and network costs, results in the shape of the total cost curve showing little cost variation between operating at a wide range of electrolyzer utilization factors. Concept notes that the price for opportunistic P2G production is similar to an estimate provided by the Commonwealth Scientific and Industrial Research Organization (CSIRO) for future estimates for H2 production in Australia [41]. When looking into large-scale hydrogen uptake and production, costs will increase significantly. This scenario is where the assumption for small-scale production is likely to collapse and wholesale electricity price collapses might happen less frequently or not at all, leading to higher costs. This is also on top of the added storage costs if the goal was to provide intra-day or inter-seasonal storage to alleviate dry-year demand. Figure 13c shows how storage costs play an important role in this cost estimation and it is interesting to see how the wholesale electricity cost component curve increases more than Figure 13b at still relatively low utilization factors. This suggests that the trade-offs between lower wholesale prices with higher capital, storage, and network costs lead to an optimal utilization of around 80%, at which the average per unit cost of hydrogen production is approximately NZ$5/kg.
Minimum costs are approximately almost NZ$2/kg H2 more than P2G with high renewables, however, this price is similar to other cost estimates in other studies and whether this future price will be economical depends on multiple variables such as the future prices of natural gas and carbon taxes.
Hydrogen should be deployed strategically, prioritizing sectors where it offers the greatest decarbonization benefits. Otherwise, the energy system will face significantly higher renewable generation requirements due to the substantial energy losses associated with using hydrogen for transport or heating, compared to direct electrification options [43]. These losses arise from firstly converting electricity to hydrogen, and secondly from FCEV, hydrogen fueled boilers and heaters having lower efficiencies that electric powered ones. Due to hydrogen’s energy density, almost three and two times as much renewable energy is required to power a FCEV and industrial process heat, respectively, relative to its electrical versions [43]. It is also stated that building more generations with have a positively correlated effect on wholesale electricity prices. Concept projects an average price increase of almost 10% in a scenario where hydrogen-based decarbonization is the driver for renewable development [43]. This emphasizes that hydrogen alone will not fix dry-year and electricity demand problems, but to decarbonize the NZ economy, there needs to be a careful combination of direct electric-based and for some sectors, hydrogen-based, depending on optimal efficiencies sustainable practices.
From a regulatory perspective, the New Zealand government has actively engaged in designing a framework that addresses the specific needs and challenges associated with offshore wind and hydrogen production. The Offshore Renewable Energy Bill in New Zealand establishes a legislative regime to govern the construction, operation, and decommissioning of offshore renewable energy projects, including wind farms [58]. Introduced to Parliament in December 2024, the Bill aims to fill gaps in the existing legislative framework by providing the necessary certainty for potential developers to invest in offshore renewable energy. This includes setting standards for environmental protection, stakeholder engagement, and ensuring that these projects align with New Zealand’s long-term energy needs and its commitment to transitioning to net-zero carbon emissions by 2050. The Bill is part of a broader strategy to harness New Zealand’s significant offshore wind resources and enhance the country’s energy security and sustainability. Concurrently, the Hydrogen Action Plan, released by the Ministry of Business, Innovation, and Employment in December 2024, outlines the steps the government is taking to support the development and integration of hydrogen technologies into the country’s energy system [59]. This plan is part of New Zealand’s broader goal to transition to a low-emissions economy and highlights hydrogen’s role in decarbonizing hard-to-abate sectors, enhancing energy security, and supporting economic growth through innovative energy solutions. However, this framework should also consider the integration of both emerging technologies.
7. Conclusions
In conclusion, the offshore wind and hydrogen energy sectors are poised to play a pivotal role in New Zealand’s decarbonization efforts. Looking forward, New Zealand can position itself as a leader in green energy by not only fostering economic growth through new job opportunities and meeting its own energy needs sustainably but also by becoming a net exporter of clean energy and technology. However, to capitalize on these opportunities, clear short- and long-term strategies aligned with New Zealand’s energy policy framework are essential.
In the short term, New Zealand should focus on establishing financial and regulatory support mechanisms that can jump-start initial investments in these technologies, overcoming the ‘chicken-and-egg’ dilemma of supply and demand. This includes implementing grants, subsidies, and incentives such as higher carbon pricing through the emissions trading scheme to make green technologies more competitive against fossil fuels. The government could also play a pivotal role in developing necessary infrastructure through public-private partnerships, particularly for hydrogen distribution networks and offshore wind logistics.
For long-term implementation, New Zealand must focus on integrating these technologies into the national grid and broader energy market. This integration requires developing a robust regulatory framework that not only supports the growth of hydrogen and offshore wind but also ensures their compatibility with the existing energy infrastructure. It’s crucial that this framework includes demand incentives and public procurement policies that encourage both the supply and use of green energy.
Additionally, continuous research into cost optimization and technological advancements must be prioritized. Investigating specific scenarios, such as direct hydrogen production from offshore wind farms, will provide deeper insights into the most efficient and cost-effective project configurations.
By adopting these strategies, New Zealand can effectively navigate the transition to a low-carbon economy, setting a precedent for sustainable energy development on both a national and international scale.
Acknowledgments
This work was supported financially by the University of Auckland Summer Scholarship (grant number: BUS018) and the Ministry of Business, Innovation and Employment (MBIE) Endeavour Fund (grant number: C05X2004).
References
- Hassan, Q. , Sameen, A. Z., & Salman, H. M. (2024). Hydrogen energy horizon: balancing opportunities and challenges. Energy Harvesting and Systems, 2201; 11, 20220132. [Google Scholar]
- Li, X. , Ye, T., Meng, X., He, D., Li, L., Song, K.,... & Sun, C. (2024). Advances in the Application of Sulfonated Poly (Ether Ether Ketone)(SPEEK) and Its Organic Composite Membranes for Proton Exchange Membrane Fuel Cells (PEMFCs). Polymers 16(19), 2840. [CrossRef] [PubMed]
- Wang, B. , Wang, Q., Wei, Y., & Li, Z. (2020). Regulatory frameworks for offshore wind power: Comparative analysis between China and the US. Energy Policy, 138, 111224.
- Díaz, P. , Ruiz, C., & Romero, J. (2021). Social acceptance of offshore wind energy: A review of academic research and future directions. Energy Research & Social Science, 80, 102212. [CrossRef]
- Sørensen, B. , Mortensen, L. G., & Flourentzou, N. (2021). Environmental life cycle assessment of green hydrogen production via offshore wind powered electrolysis. Journal of Cleaner Production 293, 126144. [CrossRef]
- Megía, P. J. , Vizcaíno, A. J., Calles, J. A., & Carrero, A. (2021). Hydrogen production technologies: from fossil fuels toward renewable sources. A mini review. Energy & Fuels, 35, 16403–16415. [CrossRef]
- Rueda-Bayona, J. G. , Eras, J. J. C., & Chaparro, T. R. (2022). Impacts generated by the materials used in offshore wind technology on Human Health, Natural Environment and Resources. Energy 261, 125223. [CrossRef]
- IEA. (2021b). Renewables 2021 - analysis and forecast to 2026. Retrieved from https://iea.blob.core.windows.net/assets/5ae32253-7409-4f9a-a91d-1493ffb9777a/Renewables2021-Analysisandforecastto2026.pdf.
- Statistica. (2021b). Global onshore wind energy capacity from 2009 to 2020. Retrieved from https://www.statista.com/statistics/476306/global-capacity-of-onshore-wind-energy/.
- Statistica. (2021a). Global offshore wind energy capacity from 2009 to 2020. Retrieved from https://www.statista.com/statistics/476327/global-capacity-of-offshore-wind-energy/#:~:text=As%20of%202020%2C%20the%20capacity,to%20generate%20onshore%20wind%20energy.
- IEA. (2021a). Global hydrogen review 2021, OECD Publishing: Paris. [CrossRef]
- IEA. The future of hydrogen. Retrieved from https://iea.blob.core.windows.net/assets/9e3a3493-b9a6-4b7d-b499-7ca48e357561/The_Future_of_Hydrogen.pdf. 2019. [Google Scholar]
- Bosch, J. , Staffell, I., & Hawkes, A. D. (2019). Global levelised cost of electricity from offshore wind. Energy (Oxford) 189, 116357. [CrossRef]
- Small, L. , Beirne, S. & Gutin, O. (2016). Offshore wind: Can the United States catch up with europe? Retrieved from https://www.eesi.org/papers/view/factsheet-offshore-wind-2016.
- Wiser, R. , Millstein, D., Bolinger, M., Jeong, S., & Mills, A. (2021). The hidden value of large-rotor, tall-tower wind turbines in the united states. Wind Engineering, 45, 4, 857–871. [CrossRef]
- Huerta, C. (2021). Onshore vs offshore wind power. Retrieved from https://www.semprius.com/onshore-vs-offshore-windpower/.
- Gondal, I. A. (2019). Offshore renewable energy resources and their potential in a green hydrogen supply chain through power-to-gas. Sustainable Energy & Fuels, 3, 6, 1468–1489. [CrossRef]
- Hevia-Koch, P. , & Klinge Jacobsen, H. (2019). Comparing offshore and onshore wind development considering acceptance costs. Energy Policy 125, 1–27. [CrossRef]
- Musial, W. Spitsen, P., Beiter, P., Duffy, P., Marquis, M., Cooperman, A., . . . Shields, M. (2021). Offshore wind market report: 2021 edition. (). United States: Retrieved from https://www.energy.gov/sites/default/files/2021-08/Offshore%20Wind%20Market%20Report%202021%20Edition_Final.pdf.
- Hockenos, P. Is wind power’s future in deep water? Retrieved from https://www.bbc.com/future/article/20201013-is-wind-powers-future-in-deep-water.
- Pham, T. Q. M. , Im, S., & Choung, J. (2021). Prospects and economics of offshore wind turbine systems. 한국해양공학회지, 35, 5, 382–392. [CrossRef]
- Gallardo, Y. , Tampier, G., Palma, V., Cifuentes, C., Ahumada, J. M., Troncoso, C., & Mendoza, M. Y. (2024). An Early-Stage Structural Design of a Semi-Submersible Platform for Floating Offshore Wind Turbines in Chilean Waters. Journal of Marine Science and Engineering, 12, 11, 1951. [CrossRef]
- Brandon, N. P. , & Kurban, Z. (2017). Clean energy and the hydrogen economy. Philosophical Transactions of the Royal Society of London. Series A: Mathematical, Physical, and Engineering Sciences, 375, 6040. [Google Scholar] [CrossRef]
- The combined development of green hydrogen with offshore wind power projects. (2021). Retrieved from https://vietnamenergy.vn/the-combined-development-of-green-hydrogen-with-offshore-wind-power-projects-26875.html.
- DiChristopher, T. (2021). Experts explain why green hydrogen costs have fallen and will keep falling. Retrieved from https://www.spglobal.com/marketintelligence/en/news-insights/latest-news-headlines/experts-explain-why-green-hydrogen-costs-have-fallen-and-will-keep-falling-63037203. 6303. [Google Scholar]
- Widera, B. (2020). Renewable hydrogen implementations for combined energy storage, transportation and stationary applications. Thermal Science and Engineering Progress, 16. [CrossRef]
- Calado, G. , & Castro, R. (2021). Hydrogen production from offshore wind parks: Current situation and future perspectives. Applied Sciences, 11. [CrossRef]
- Weidner, S. , Faltenbacher, M., François, I., Thomas, D., Skùlason, J. B., & Maggi, C. (2018). Feasibility study of large scale hydrogen power-to-gas applications and cost of the systems evolving with scaling up in germany, belgium and iceland. International Journal of Hydrogen Energy, 43, 1563. [Google Scholar] [CrossRef]
- Meng, X. , Sun, C., Mei, J., Tang, X., Hasanien, H. M., Jiang, J.,... & Song, K. (2025). Fuel cell life prediction considering the recovery phenomenon of reversible voltage loss. Journal of Power Sources 625, 235634. [CrossRef]
- Patel, S. (2020). How much will hydrogen-based power cost? Retrieved from https://www.powermag.com/how-much-will-hydrogen-based-power-cost/.
- Lazard. (2020). Lazard’s levelized cost of energy analysis (“LCOE”) - version 14, Unpublished.
- Li, Y. , & Taghizadeh-Hesary, F. (2020). Energy prices and the economic feasibility of using hydrogen energy for road transport in the people’s republic of china, Asian Development Bank Institute: Tokyo, Japan.
- A vision for hydrogen in new zealand: Green paper. (2019). New Zealand Government, Retrieved from https://static1.squarespace.com/static/5c350d6bcc8fedc9b21ec4c5/t/5e69854d3a8ab94d06252d1d/1583973748134/a-vision-for-hydrogen-in-new-zealand-green-paper.pdf.
- H2 taranaki roadmap. Venture Taranaki, Retrieved from https://www.venture.org.nz/assets/H2-Taranaki-Roadmap.pdf.
- Wind energy resources in new zealand. Retrieved from https://www.windenergy.org.nz/wind-energy-resources-in-nz.
- The World Bank data. Retrieved from https://www.worldbank.org/en/topic/energy/overview?intcid=ecr_hp_trendingdata_en_ext.
- Offshore wind. Venture Taranaki, Retrieved from https://www.venture.org.nz/assets/Offshore-Wind-Discussion-Paper.pdf.
- Power to, X. (2021). Venture Taranaki, Retrieved from https://www.venture.org.nz/assets/Power-to-X-Report-Nov-2021.pdf.
- Ishwar, C. A. & Mason, I. G. (2019). Offshore wind for new zealand. Retrieved from https://www.researchgate.net/publication/334129180_Offshore_Wind_for_New_Zealand.
- Lewis, K. (2006). Engineering on the sea floor - drilling the māui gas field. Retrieved from https://teara.govt.nz/en/map/6640/mining-the-maui-gas-field.
- Current hydrogen projects in New Zealand. Retrieved from https://www.nzhydrogen.org/nz-hydrogen-projects.
- Bringing zero carbon gas to aotearoa. First Gas, Retrieved from https://firstgas.co.nz/wp-content/uploads/Firstgas-Group_Hydrogen-Feasibility-Study_web_pages.pdf.
- Hydrogen in new zealandreport 2 – analysis. (). Retrieved from https://www.concept.co.nz/uploads/1/2/8/3/128396759/h2_report2_analysis_v4.pdf.
- Hinkley, J. T. (2021). A new zealand perspective on hydrogen as an export commodity: Timing of market development and an energy assessment of hydrogen carriers. Energies (Basel), 14, 16, 4876. [CrossRef]
- Contact Energy,; Meridian Energy. The new Zealand hydrogen opportunity. (). Retrieved from https://www.datocms-assets.com/49051/1626295071-the-nz-hydrogen-opportunity.pdf. 2021. [Google Scholar]
- Carbon prices. Retrieved from https://www.carbonnews.co.nz/tag.asp?tag=Carbon+prices. 2022. [Google Scholar]
- Bischoff, A. Adam, L., Dempsey, D., Nicol, A., Beggs, M., Rowe, M. C., . . . Villenueve, M. (2021). Underground hydrogen storage in sedimentary and volcanic rock reservoirs: Foundational research and future challenges for new zealand. Retrieved from https://www.researchgate.net/publication/349226344_Underground_hydrogen_storage_in_sedimentary_and_volcanic_rock_reservoirs_Foundational_research_and_future_challenges_for_New_Zealand.
- Harvie, W. (2021). Hydrogen storage may be key to zero carbon NZ. Retrieved from https://www.stuff.co.nz/environment/climate-news/124969171/hydrogen-storage-may-be-key-to-zero-carbon-nz.
- Yates, E. Bischoff, A., Beggs, M., & Jackson, N. (2021). Green hydrogen geostorage in aotearoa - new zealand. ().Unpublished. https://doi.org/10.13140/rg.2.2.36303.82083 Retrieved from https://search.datacite.org/works/10.13140/rg.2.2.36303.82083.
- Willige, A. (2020). 4 ways of storing hydrogen from renewable energy. Retrieved from https://spectra.mhi.com/4-ways-of-storing-hydrogen-from-renewable-energy.
- National Impact Study: New Zeland offshore Wind Industry. Retrieved from: https://www.pwc.co.nz/pdfs/2024/national-impacts-report-new-zealand-offshore-wind-industry-mar-2024.pdf.
- Jiguparmar. (2011). Demand factor-diversity factor-utilization factor-load factor. Retrieved from https://electrical-engineering-portal.com/demand-factor-diversity-factor-utilization-factor-load-factor.
- Ministry of Business, Innovation; Employment (MBIE). Electricity demand and generation scenarios. Wellington: Ministry of Business, Innovation & Employment, Hīkina Whakatutuki. Retrieved from https://natlib-primo.hosted.exlibrisgroup.com/primo-explore/search?query=any,contains,9918850397802836&tab=catalogue&search_scope=NLNZ&vid=NLNZ&offset=0. /: Ministry of Business, Innovation & Employment, Hīkina Whakatutuki. Retrieved from https, 2019. [Google Scholar]
- Ministry of Business, Innovation,; Employment (MBIE),; Castalia Advisors. Hydrogen supply and demand spreadsheet. Retrieved from https://www.mbie.govt.nz/building-and-energy/energy-and-natural-resources/energy-strategies-for-new-zealand/a-vision-for-hydrogen-in-new-zealand/roadmap-for-hydrogen-in-new-zealand/. 2020. [Google Scholar]
- Mohsin, M. , Rasheed, A. K., & Saidur, R. (2018). Economic viability and production capacity of wind generated renewable hydrogen. International Journal of Hydrogen Energy 43(5), 2621–2630. [CrossRef]
- Dinh, V. N. , Leahy, P., McKeogh, E., Murphy, J., & Cummins, V. (2021). Development of a viability assessment model for hydrogen production from dedicated offshore wind farms. International Journal of Hydrogen Energy 46(48), 24620–24631. [CrossRef]
- Wen, L. , Sharp, B., & Sbai, E. (2020). Spatial Effects of Wind Generation and Its Implication for Wind Farm Investment Decisions in New Zealand. The Energy Journal, 41, 2. [CrossRef]
- Parliamentary Counsel Office: New Zealand Legislation. Offshore Renewable Energy Bill. Retrieved from https://www.legislation.govt.nz/bill/government/2024/0102/latest/LMS992002.html?search=ts_act%40bill%40regulation%40deemedreg_offshore+renewable+energy+bill_resel_25_a&p=1. 2024. [Google Scholar]
- Ministry of Business, Innovation,; Employment (MBIE). Hydrogen Action Plan. Retrieved fromhttps://www.mbie.govt.nz/assets/hydrogen-action-plan-november-2024.pdf. 2024. [Google Scholar]
Figure 1.
Systematic literature review retrieval process for identifying articles and reports in the analysis.
Figure 1.
Systematic literature review retrieval process for identifying articles and reports in the analysis.
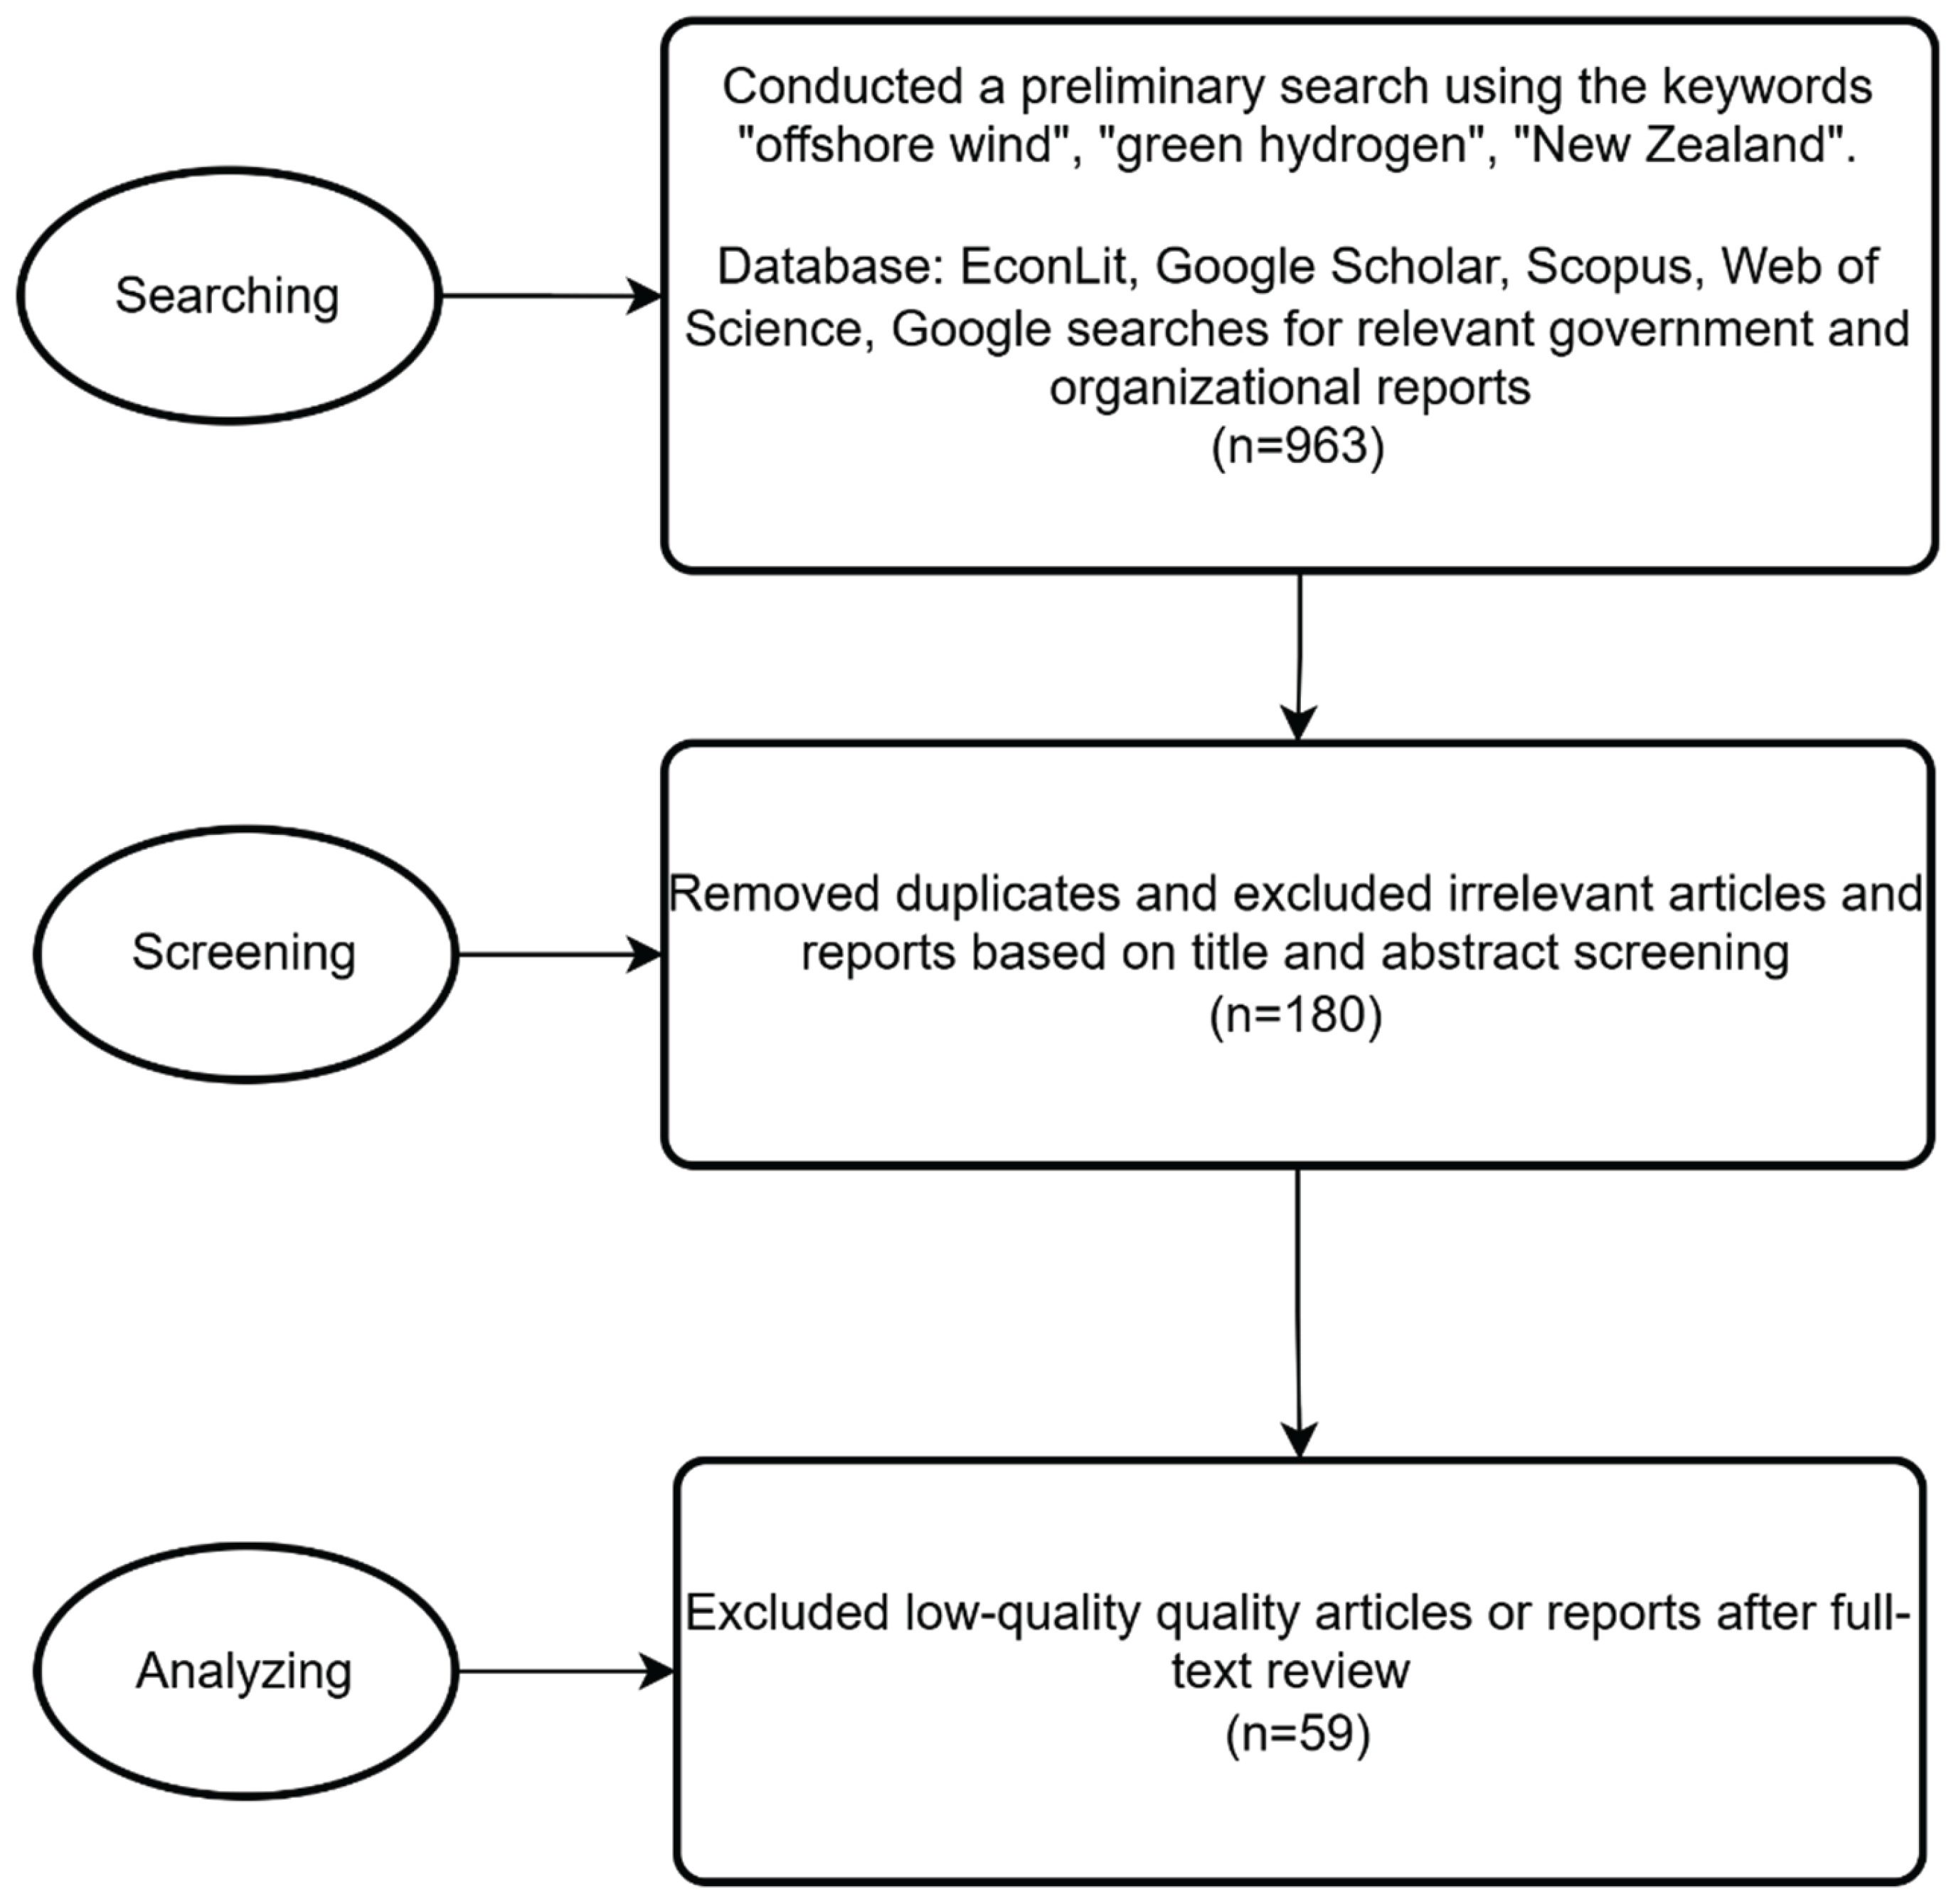
Figure 2.
Different types of fixed and floating wind turbines. Note: Authors’ elaboration based on [22].
Figure 2.
Different types of fixed and floating wind turbines. Note: Authors’ elaboration based on [22].
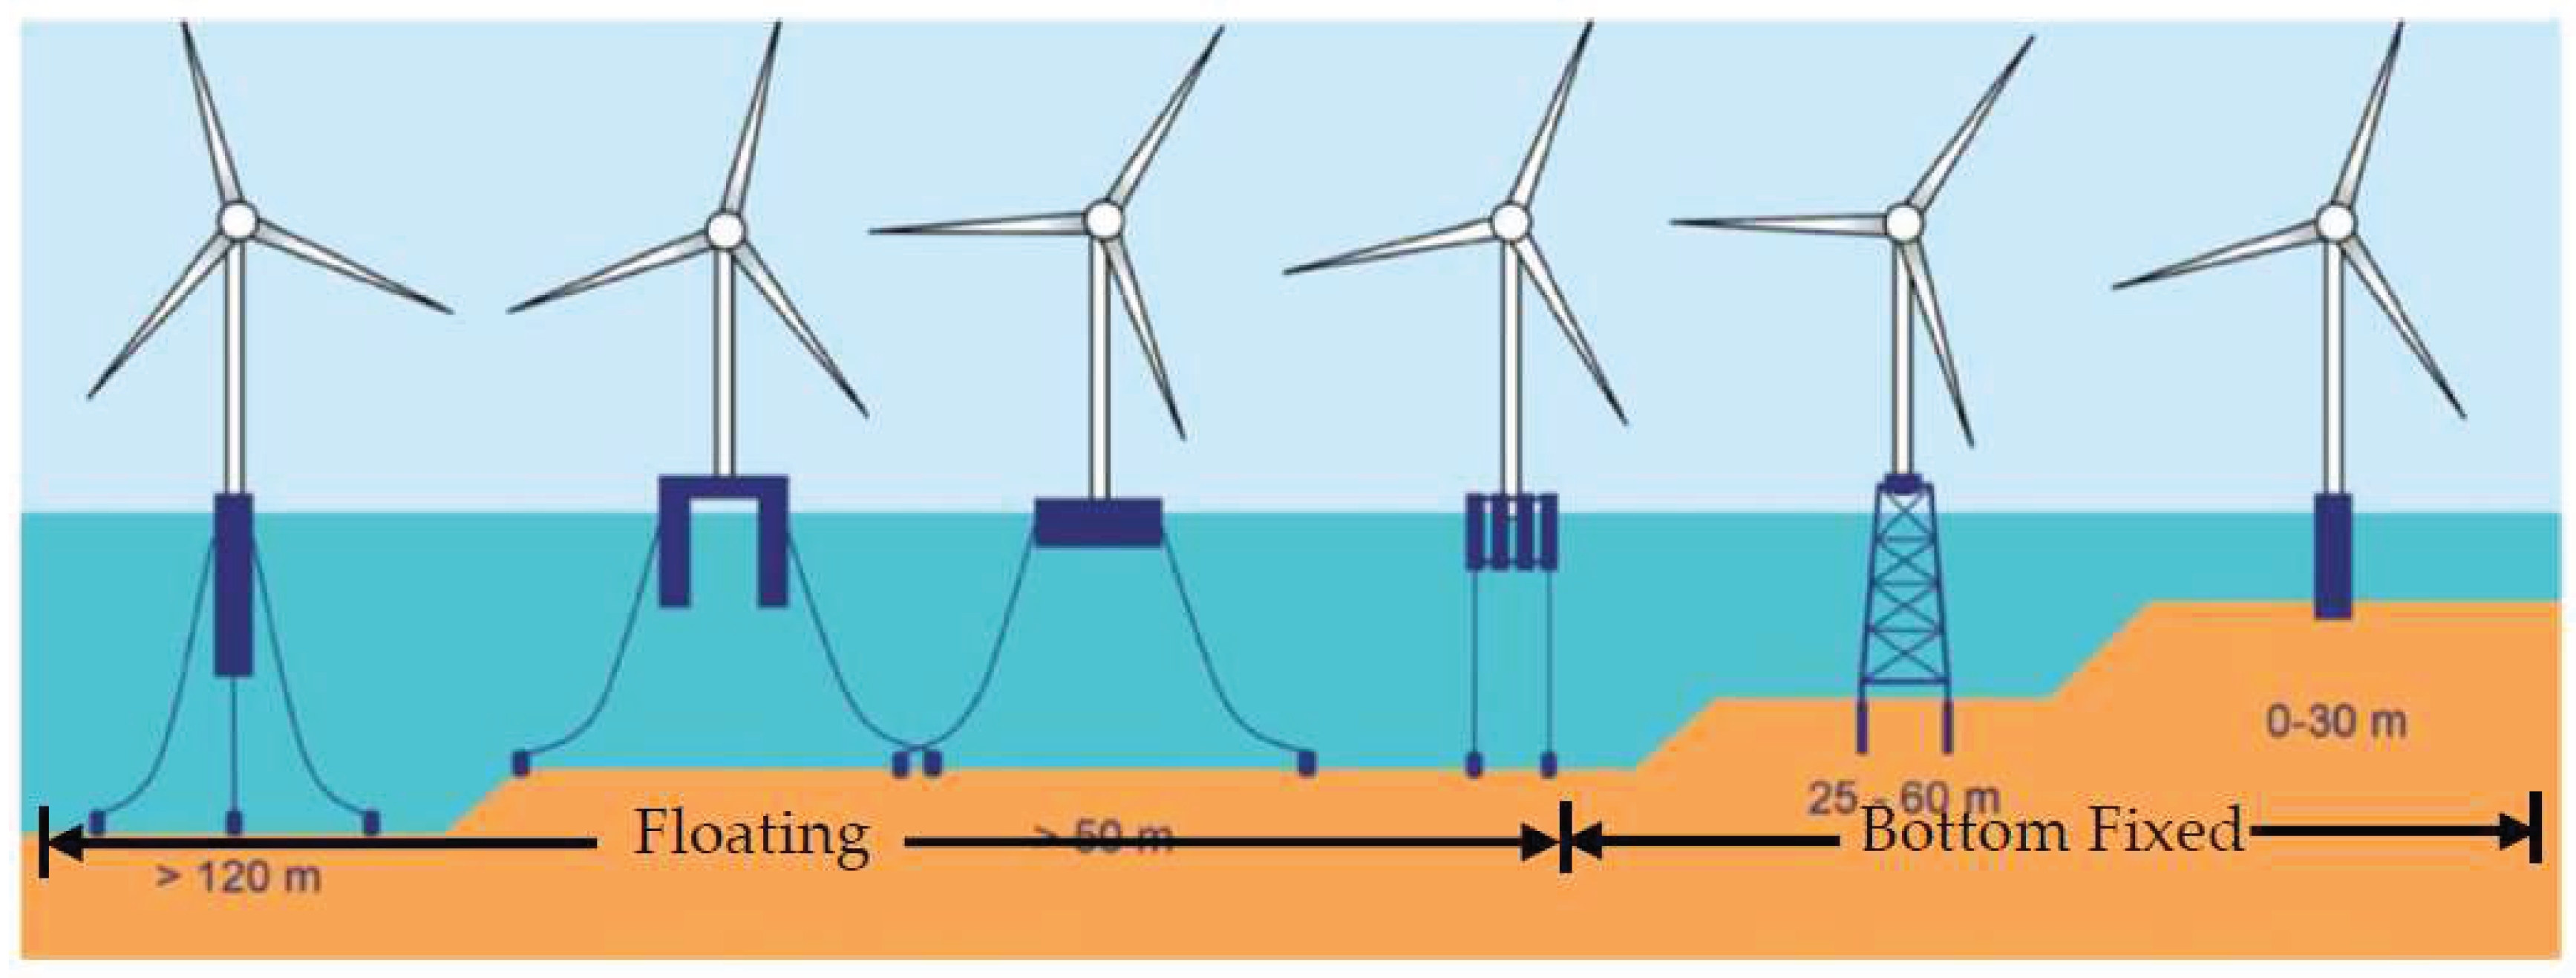
Figure 3.
Different types of hydrogen production (Source: [25]).
Figure 3.
Different types of hydrogen production (Source: [25]).
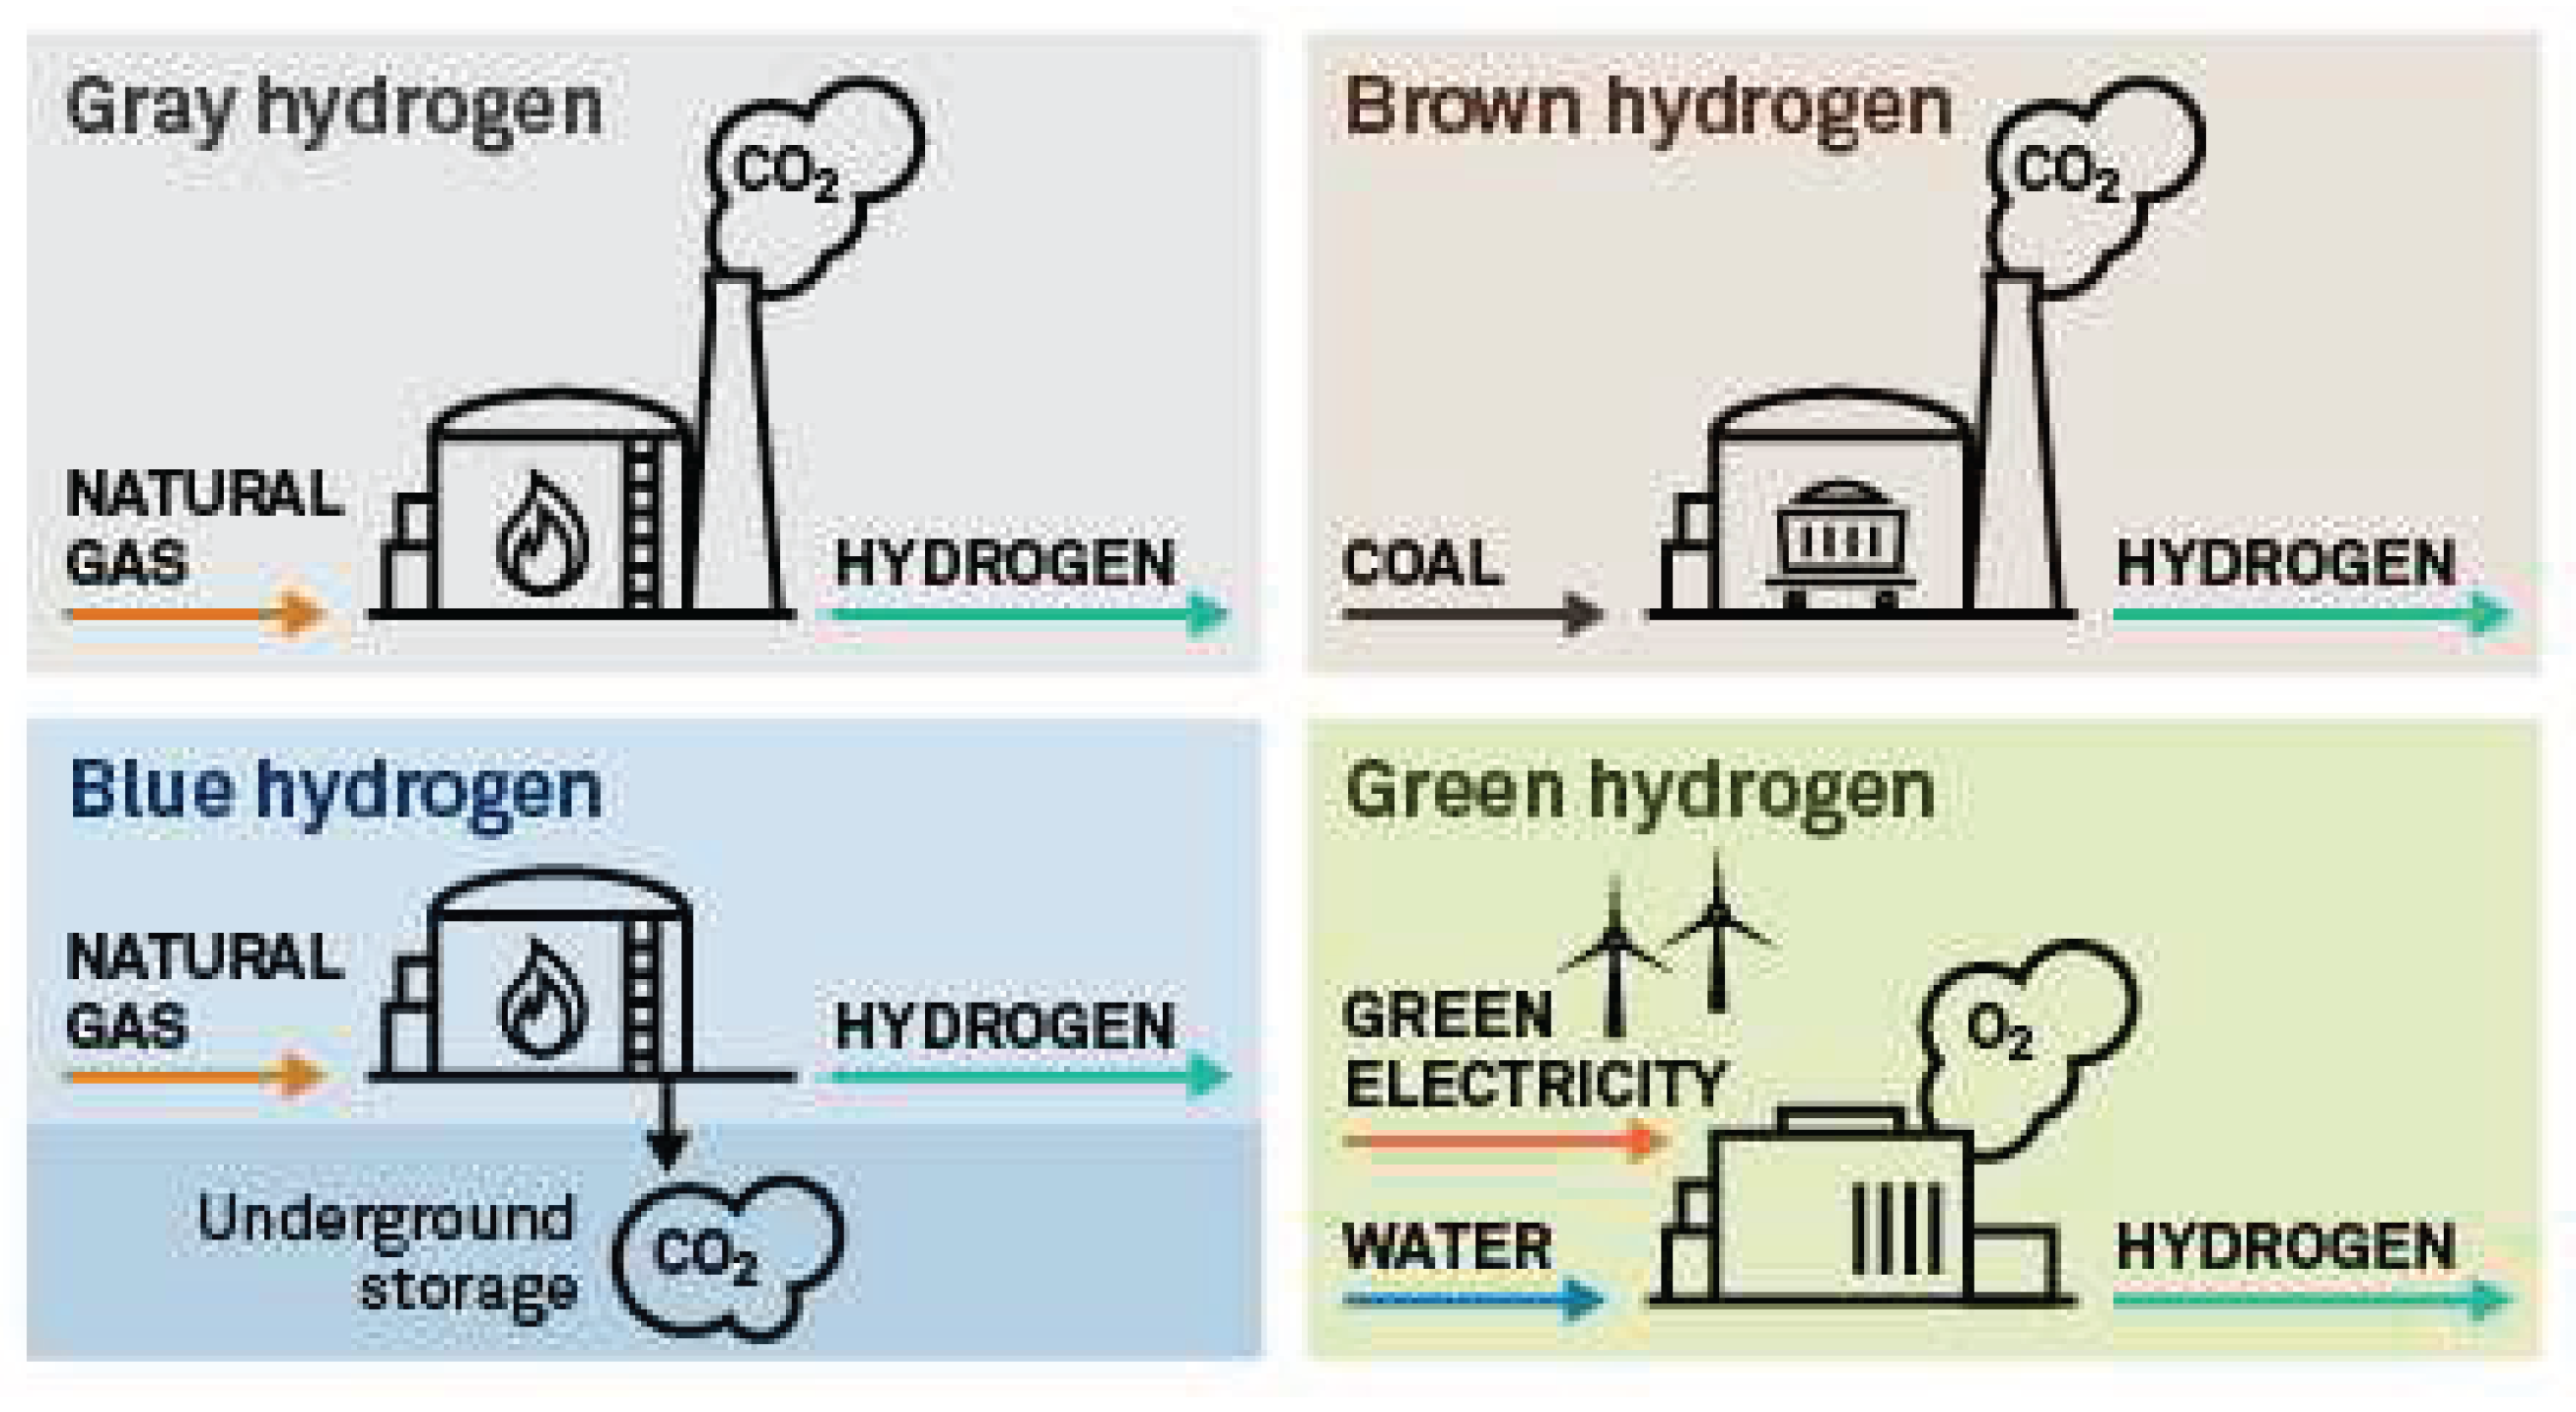
Figure 4.
Variation in LCOH in comparison to coal and natural gas. Note: Authors’ elaboration based on [32].
Figure 4.
Variation in LCOH in comparison to coal and natural gas. Note: Authors’ elaboration based on [32].
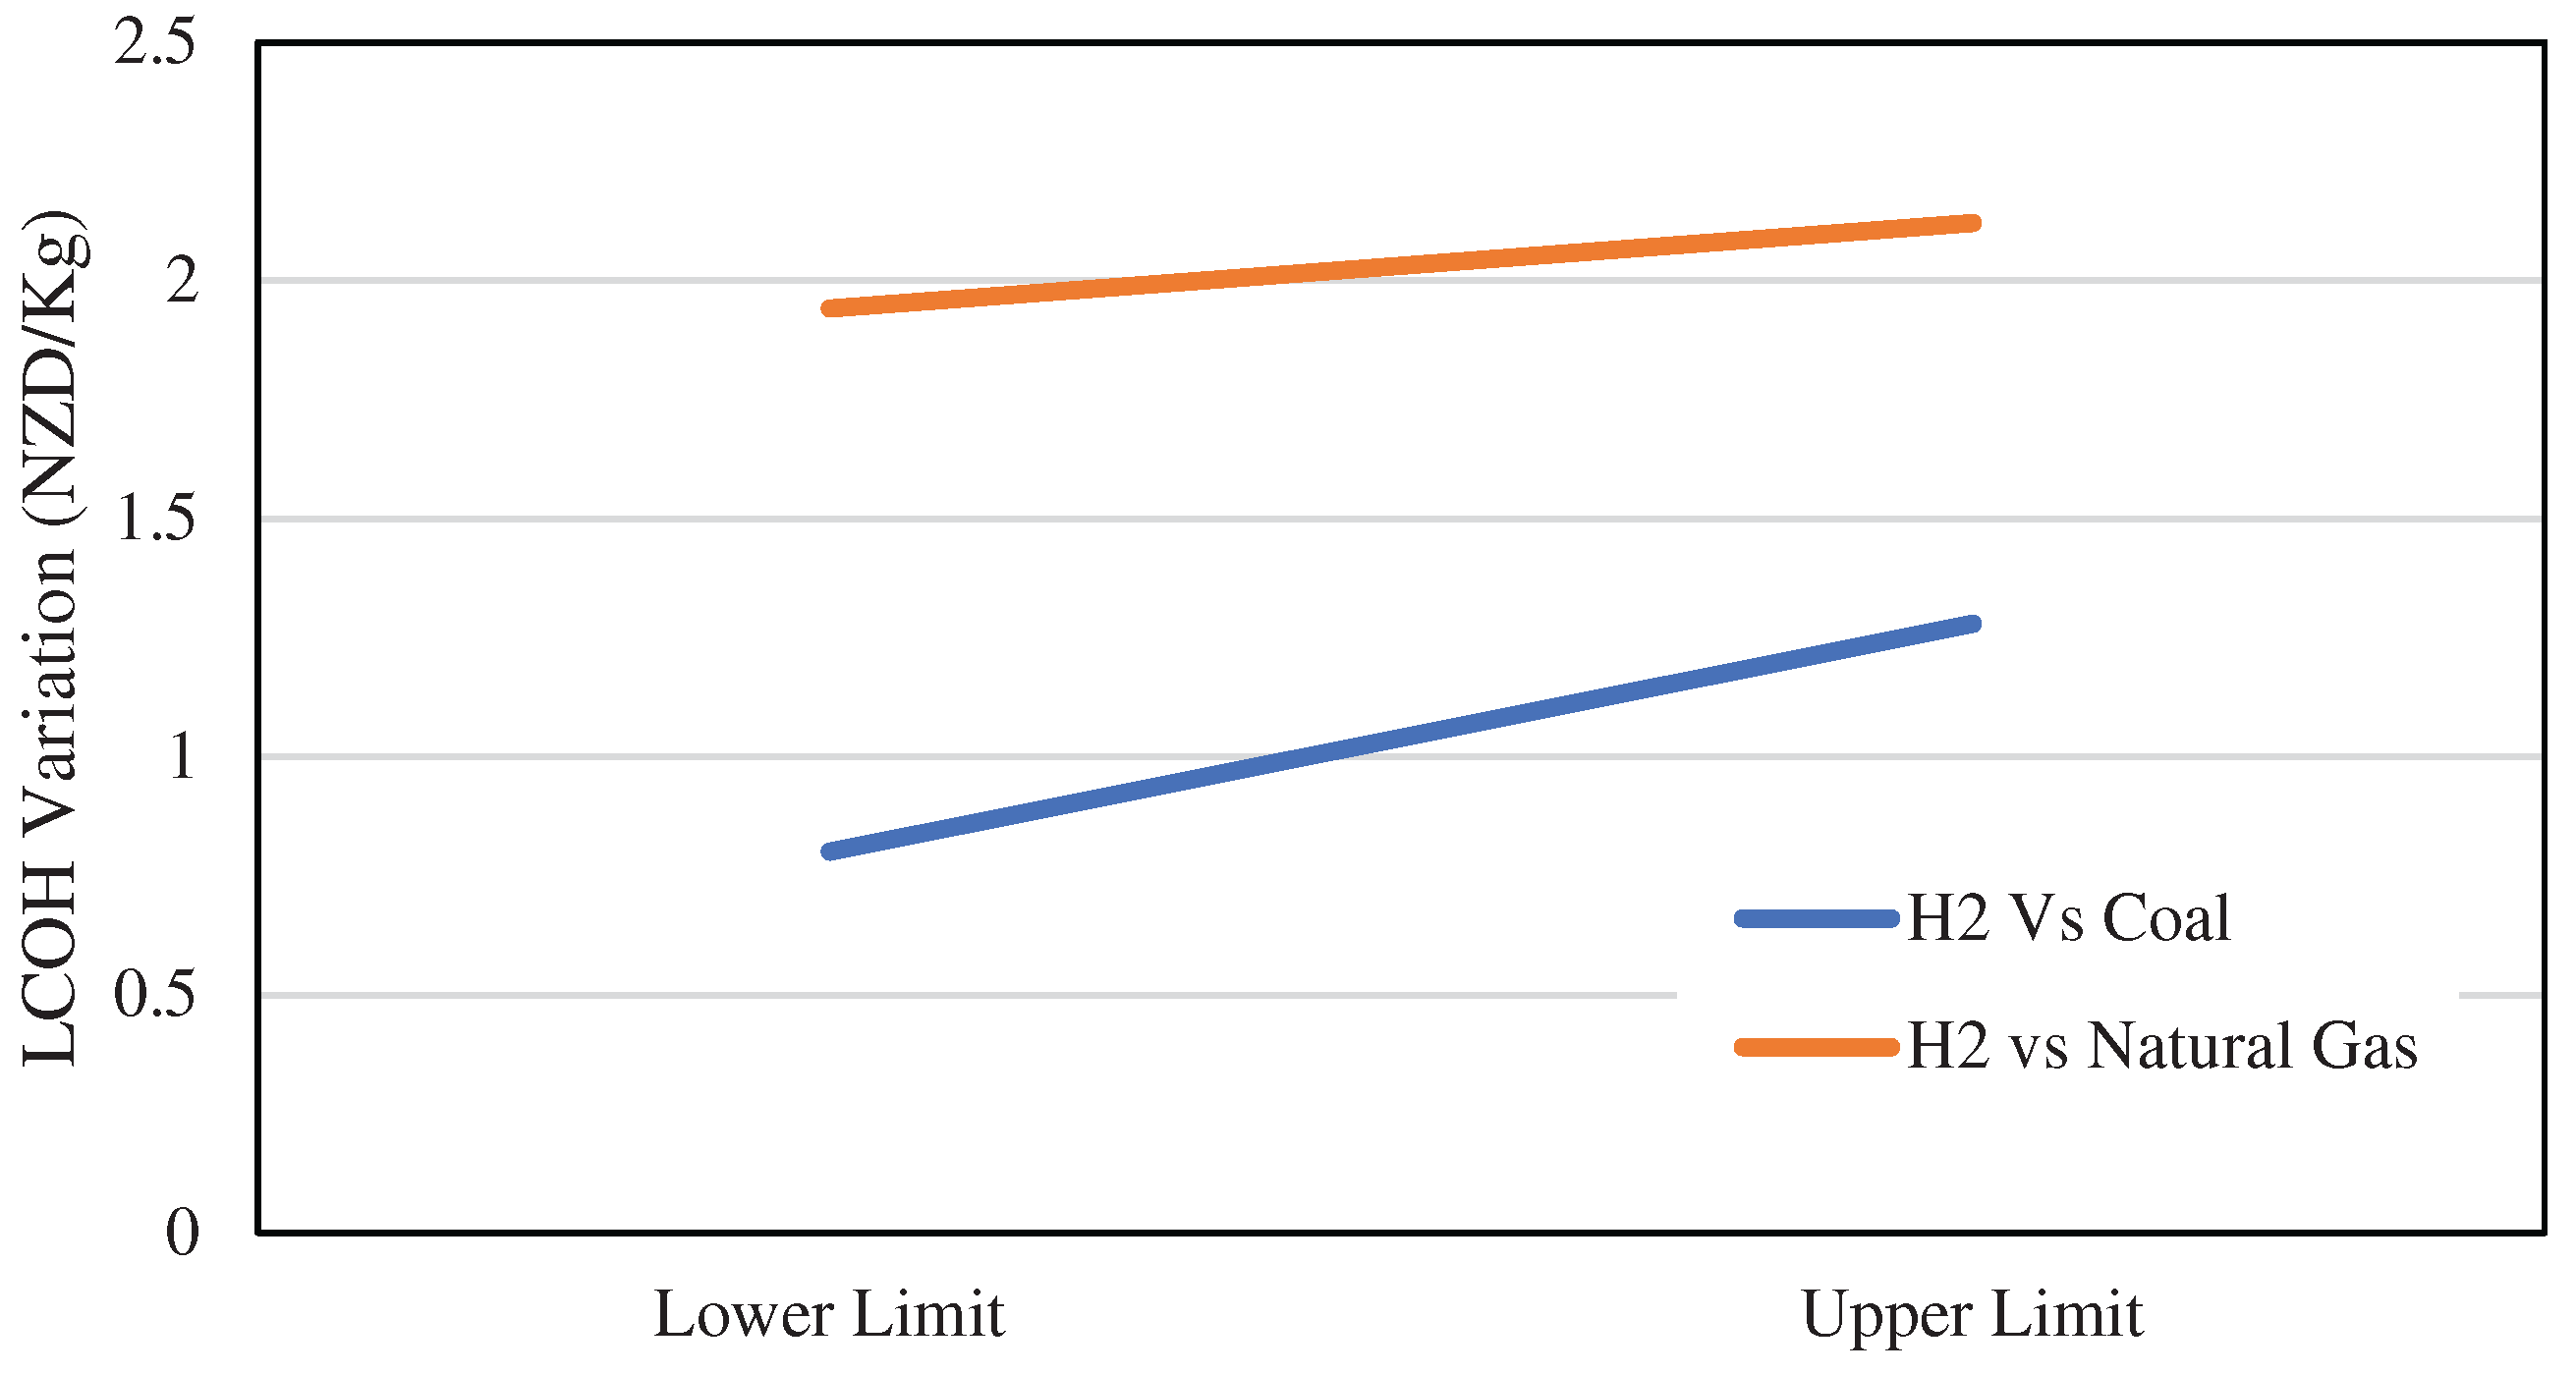
Figure 5.
Map of Maui A & B sites in Taranaki (Source: [40]).
Figure 5.
Map of Maui A & B sites in Taranaki (Source: [40]).
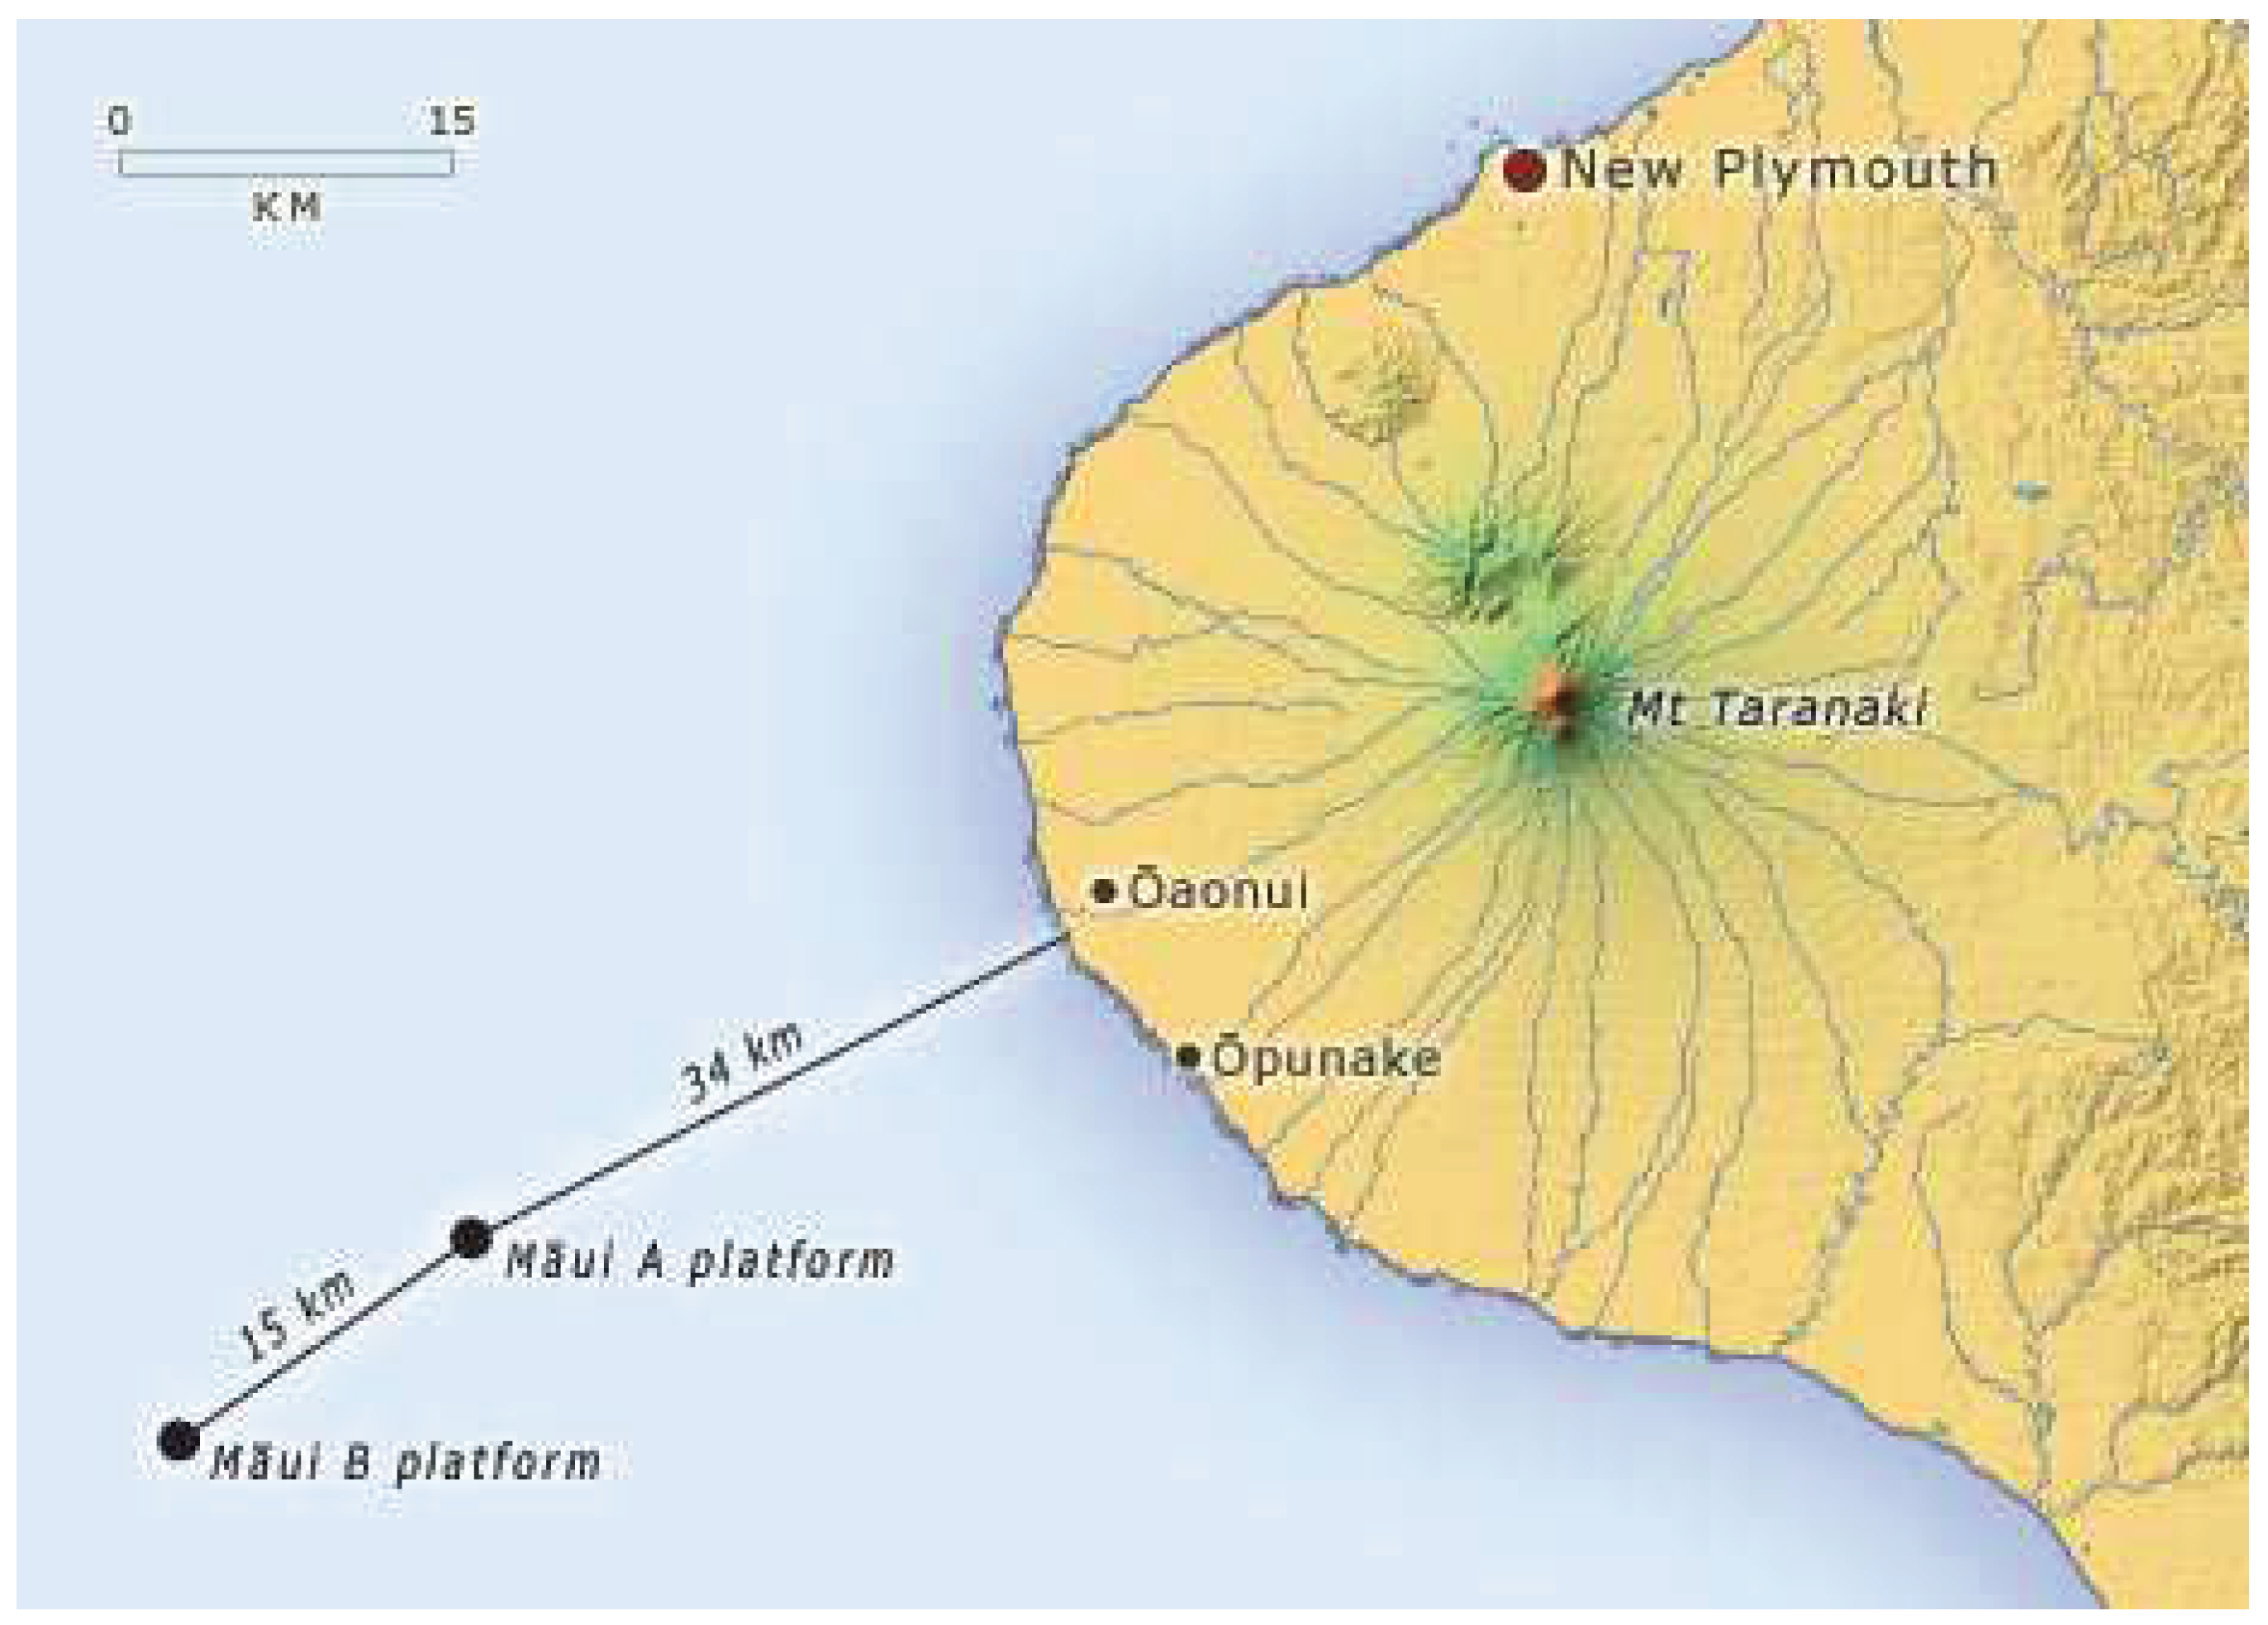
Figure 6.
Green hydrogen landed costs from different production methods. Note: Authors’ elaboration based on [45].
Figure 6.
Green hydrogen landed costs from different production methods. Note: Authors’ elaboration based on [45].
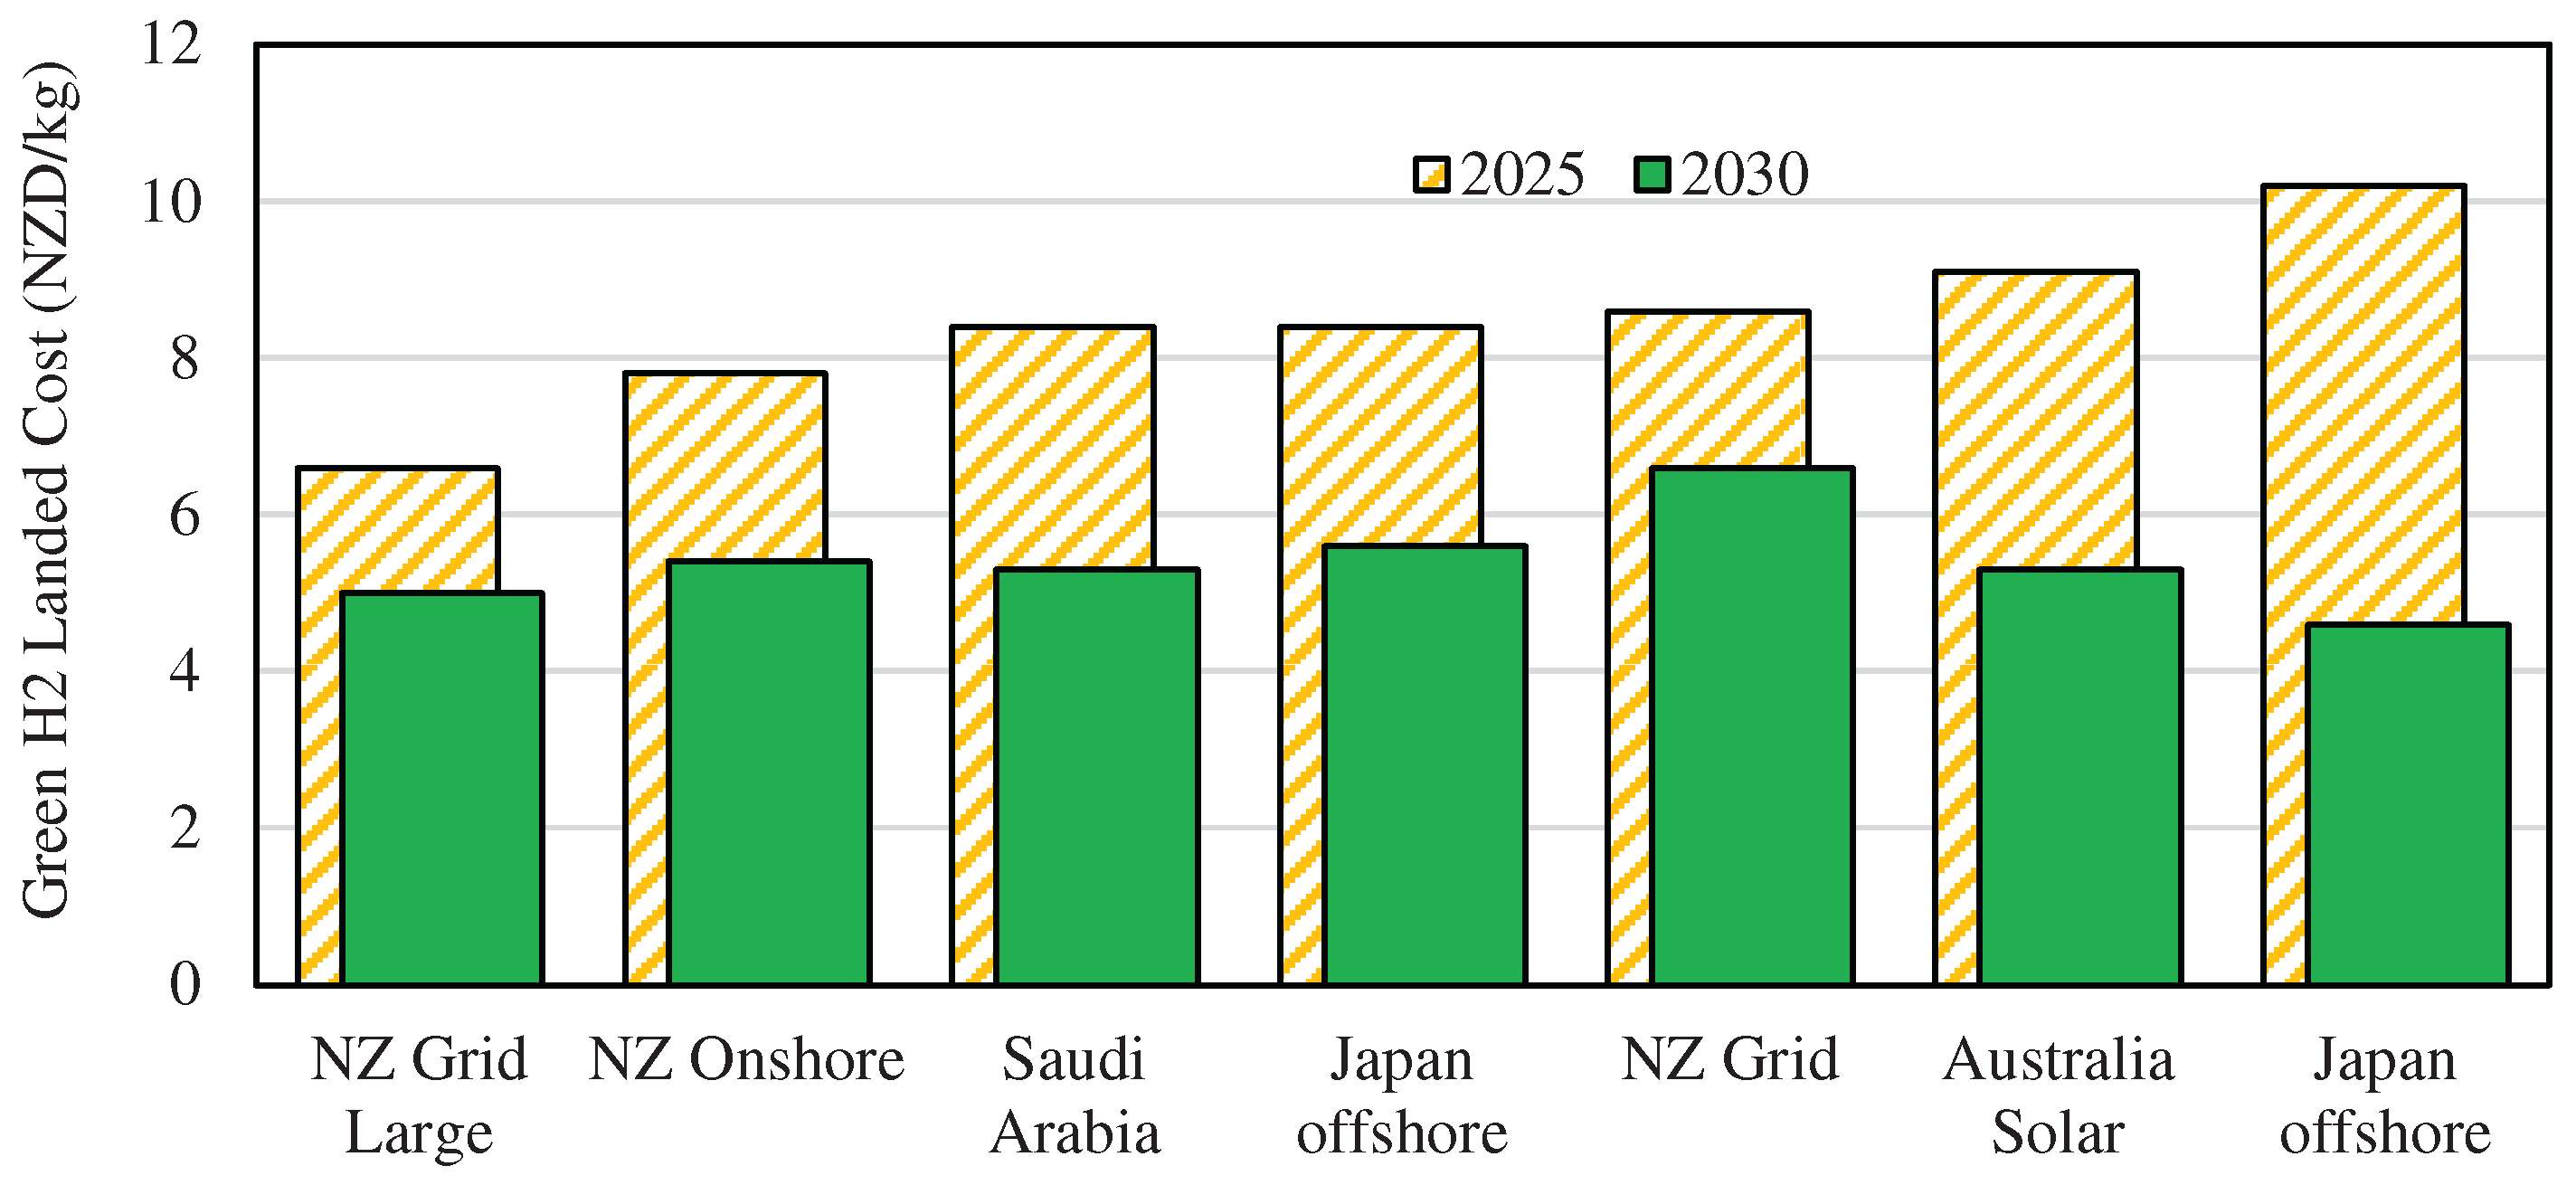
Figure 7.
Breakdown of delivered costs of LH2 vs Ammonia. Note: Authors’ elaboration based on [43].
Figure 7.
Breakdown of delivered costs of LH2 vs Ammonia. Note: Authors’ elaboration based on [43].
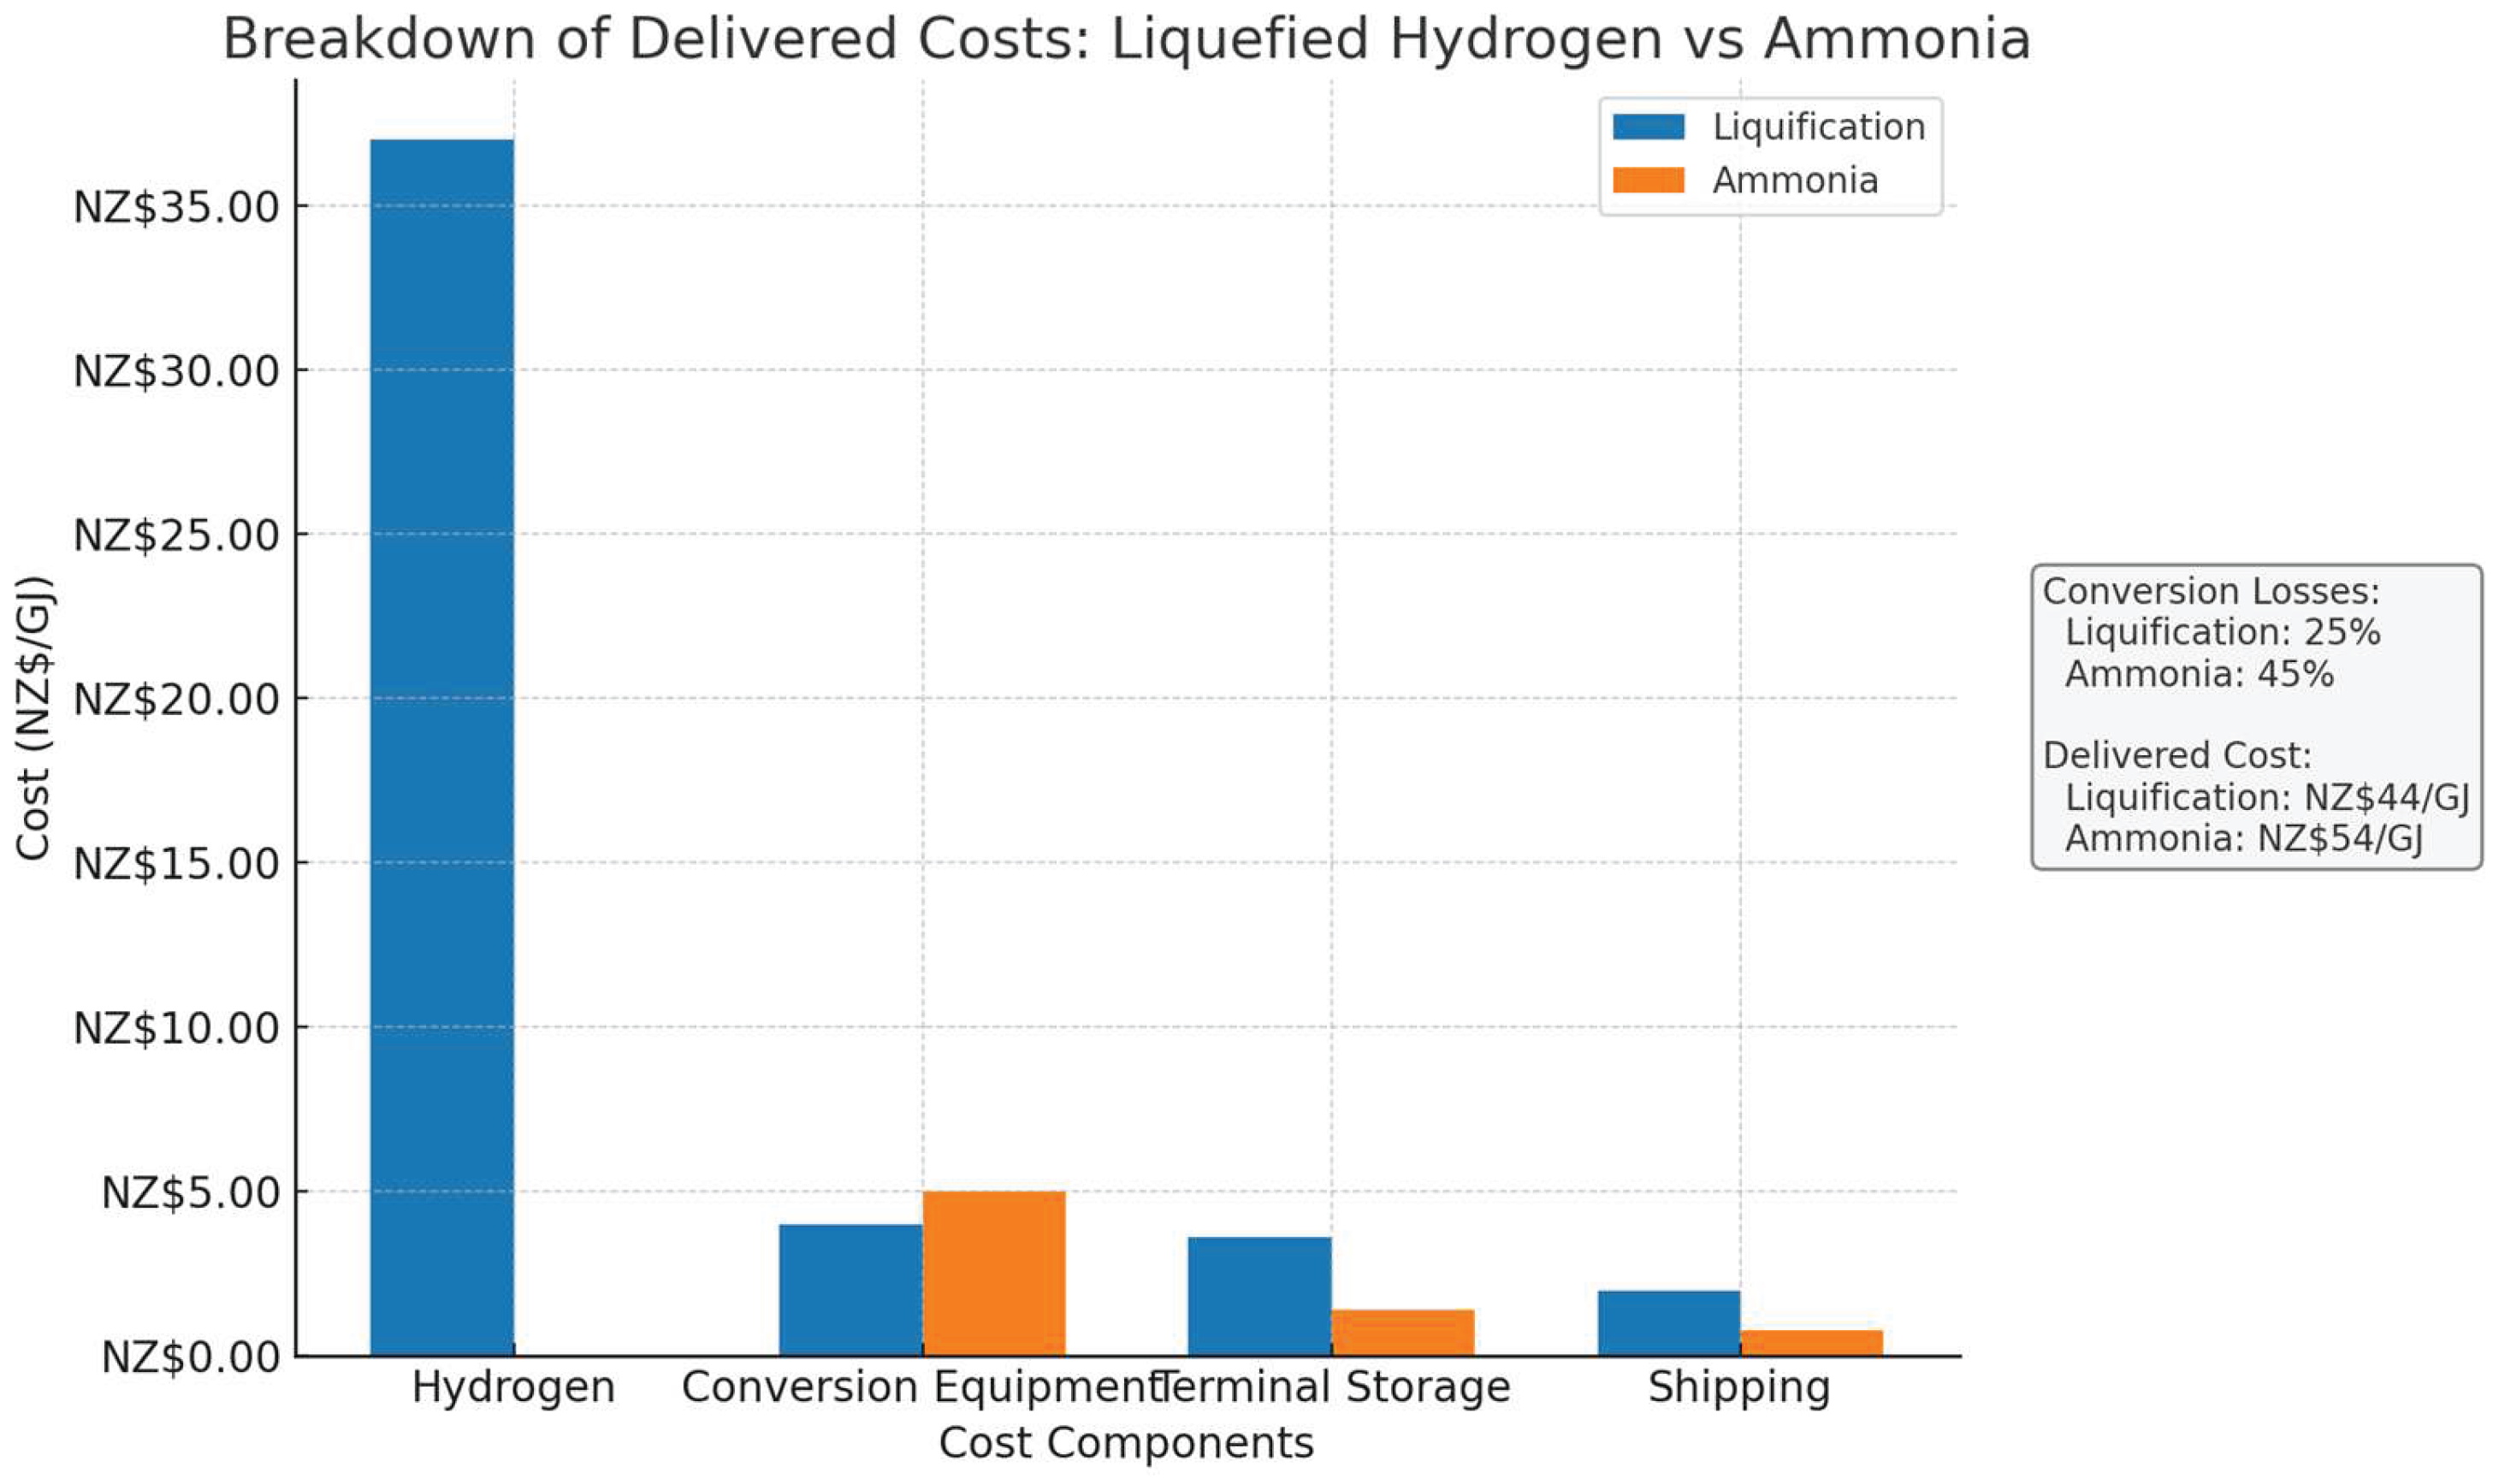
Figure 8.
Average annual offshore wind impact on FTEs compared across various sectors (averaged over 2030-2050). Note: Authors’ elaboration based on [51].
Figure 8.
Average annual offshore wind impact on FTEs compared across various sectors (averaged over 2030-2050). Note: Authors’ elaboration based on [51].
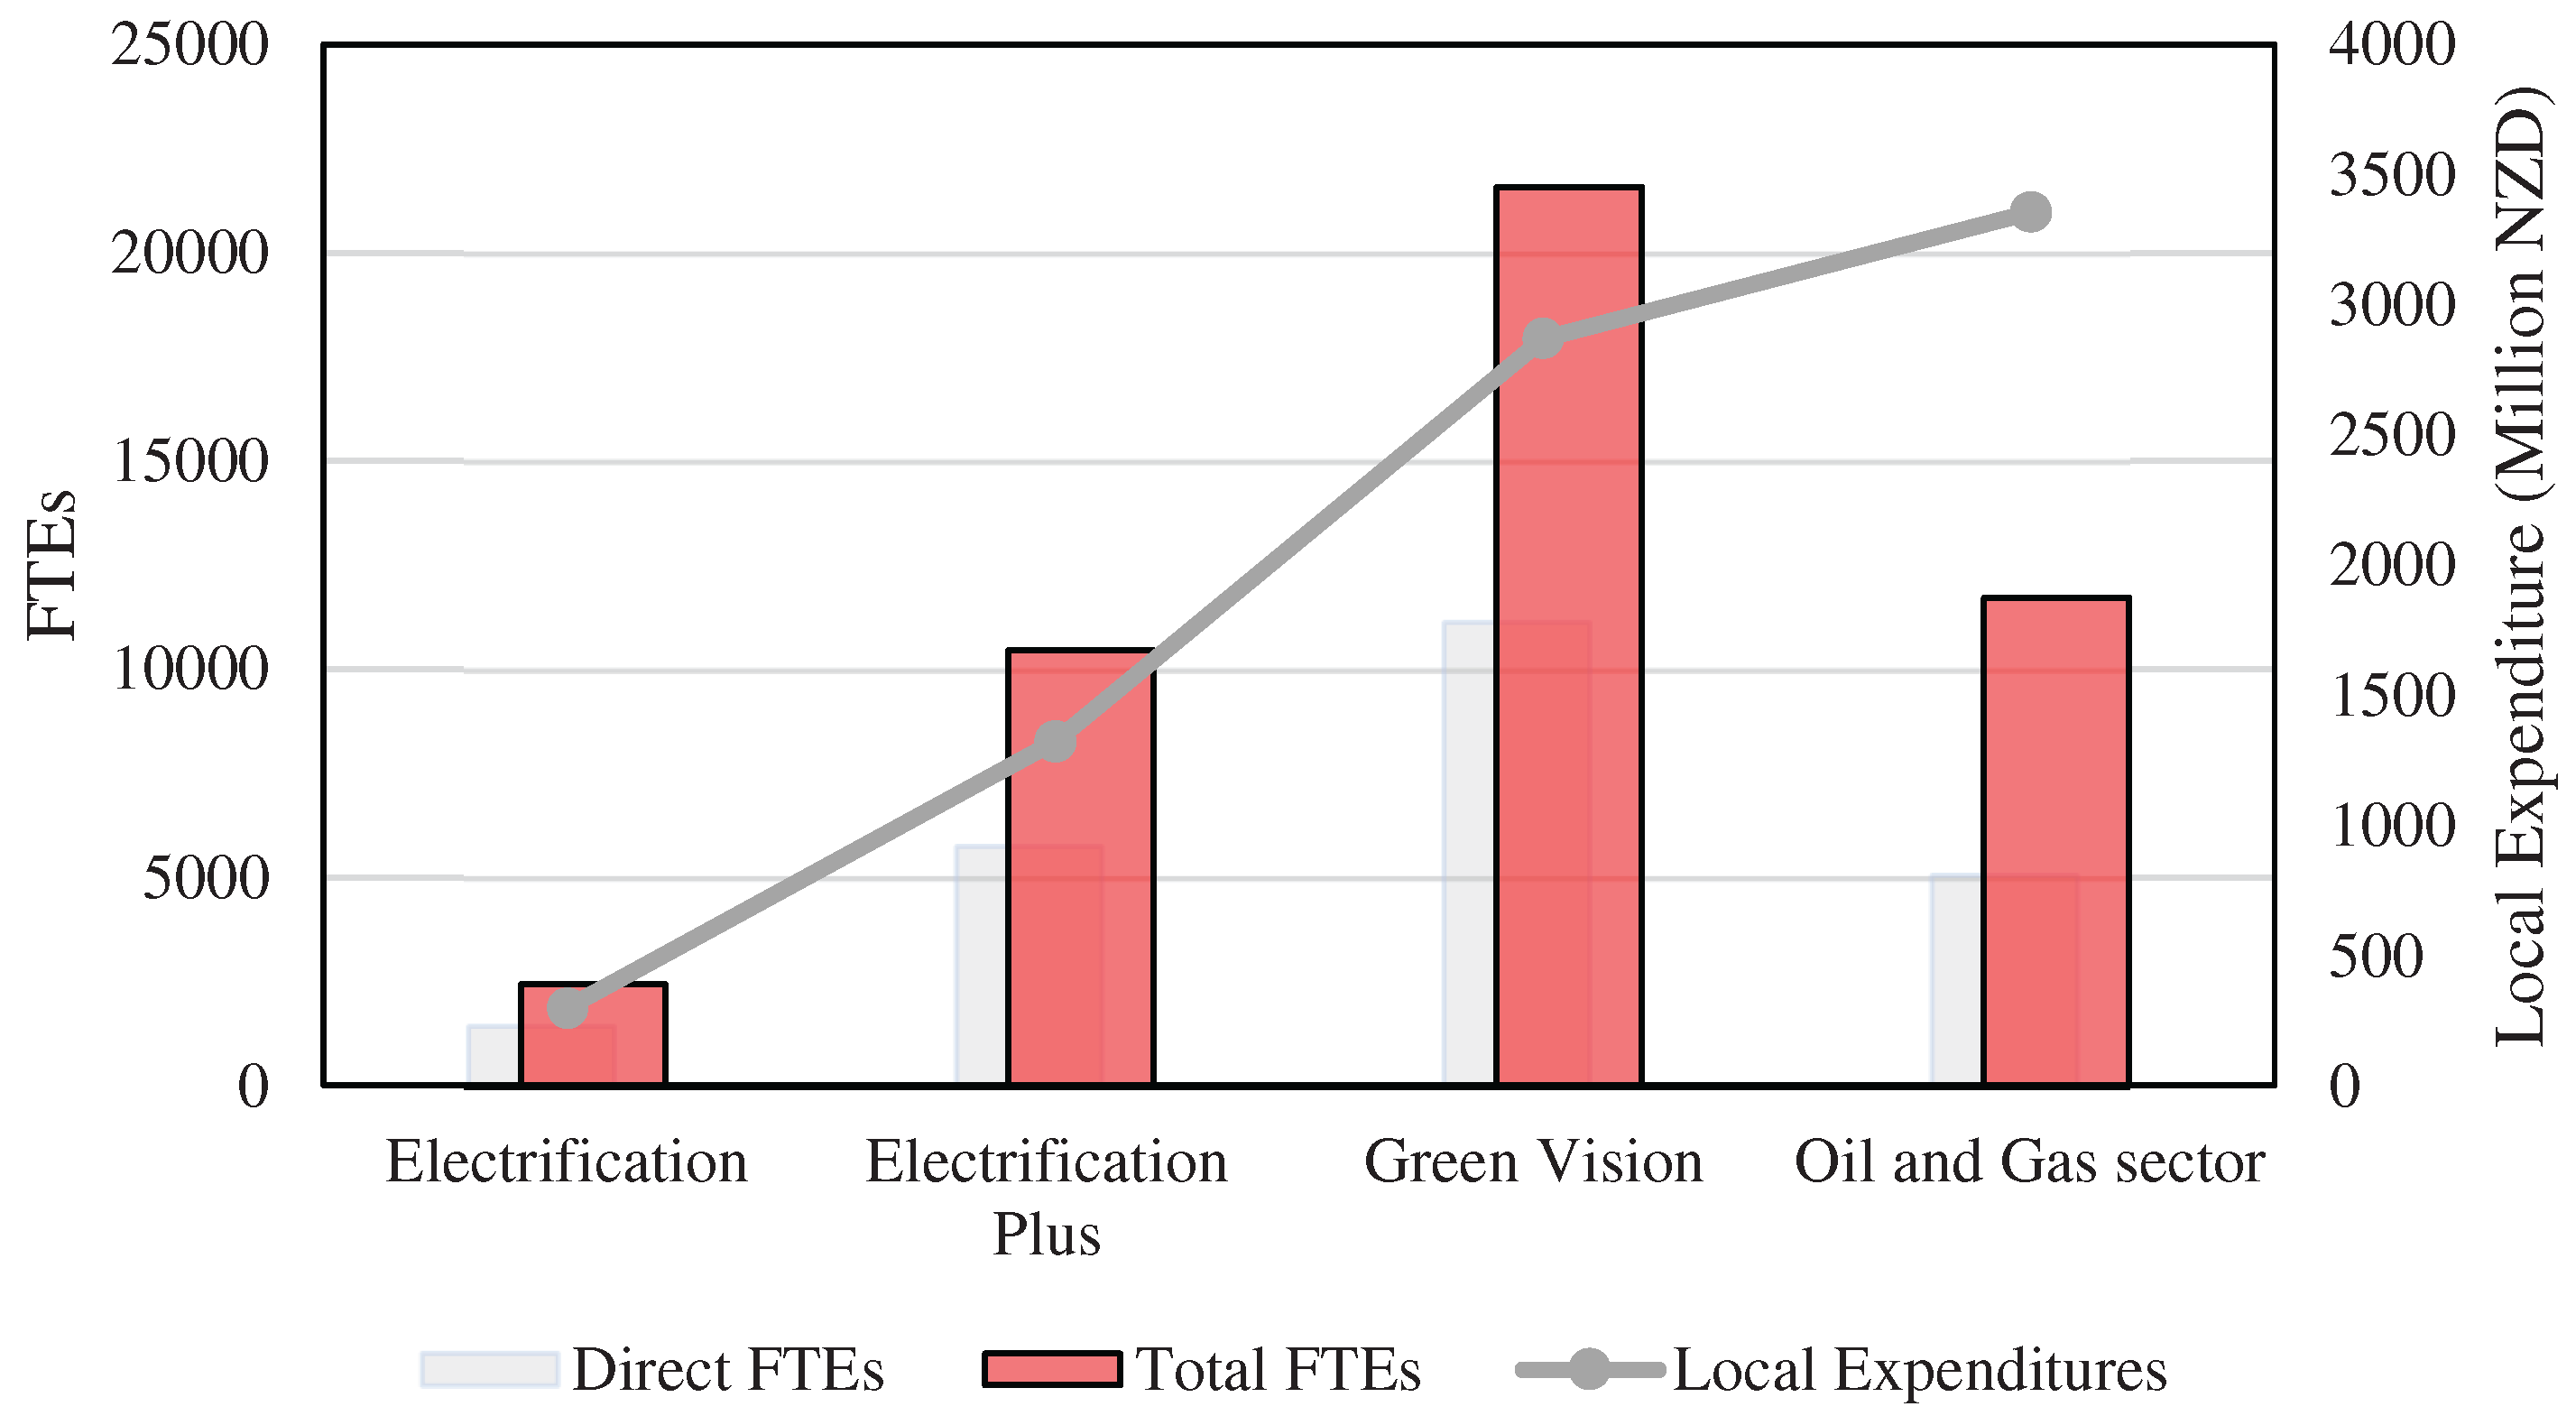
Figure 9.
Breakdown of Total Green Hydrogen Costs. Note: Authors’ elaboration based on [43].
Figure 9.
Breakdown of Total Green Hydrogen Costs. Note: Authors’ elaboration based on [43].
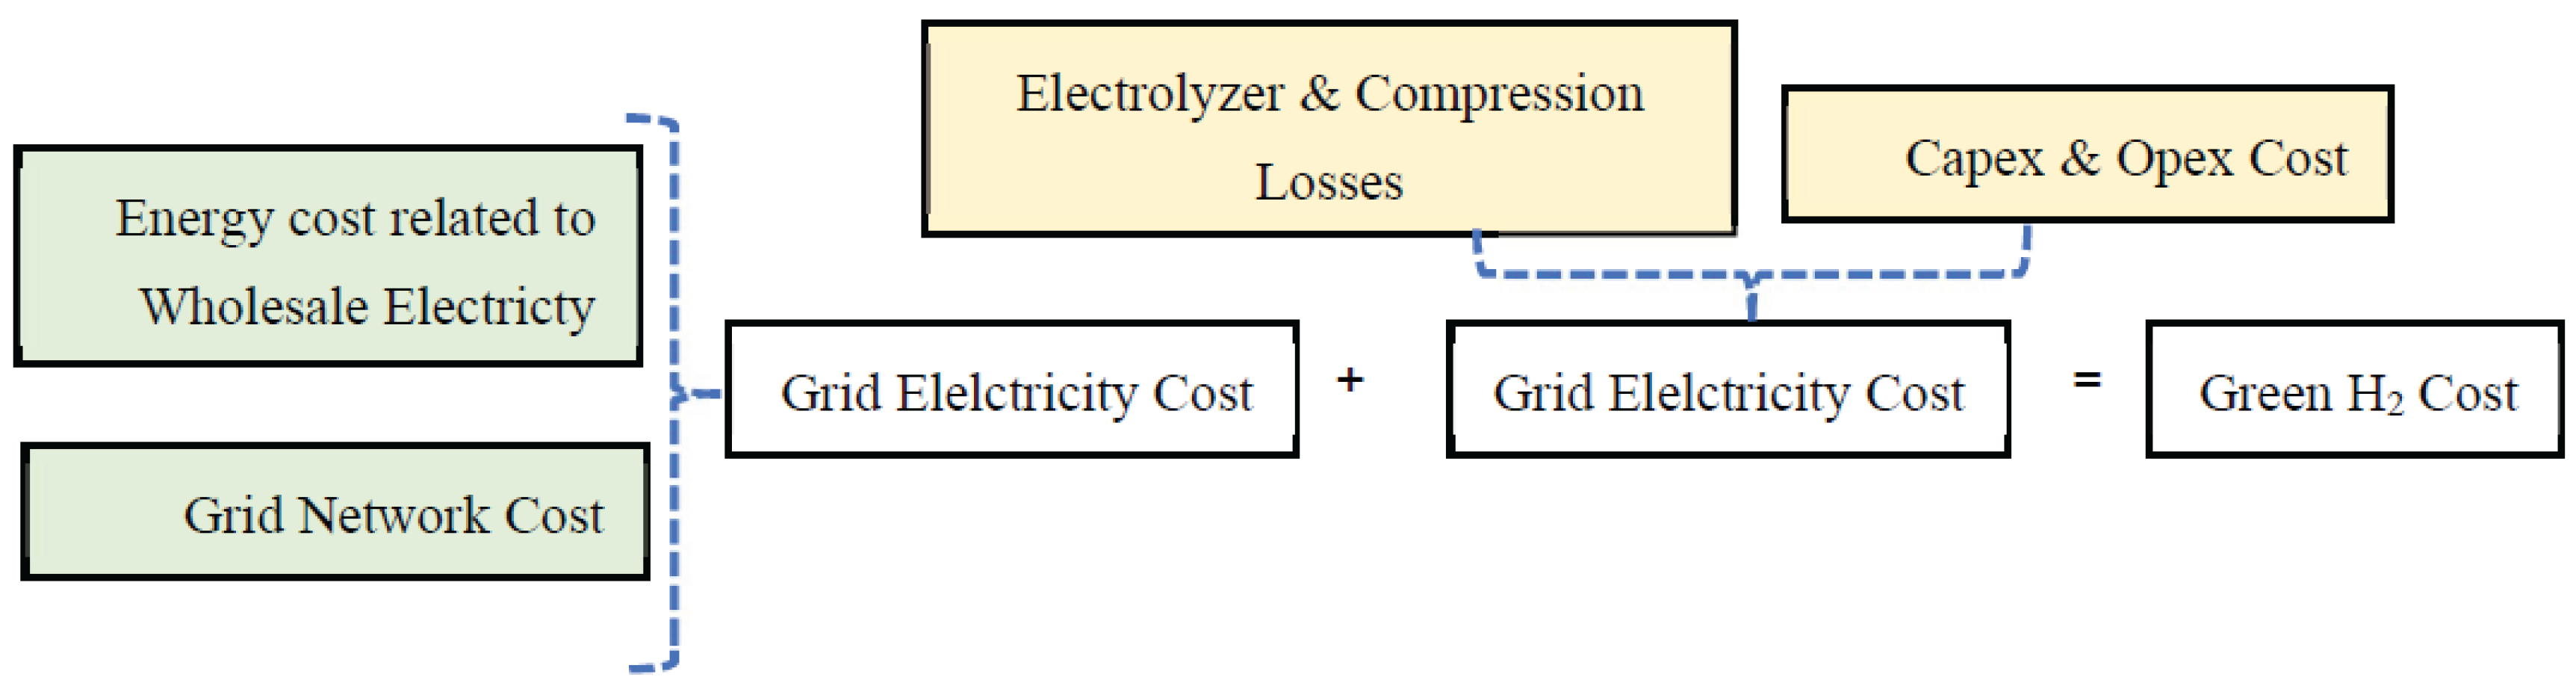
Figure 10.
Cost breakdown of current and future green hydrogen production. Note: Authors’ elaboration based on [43].
Figure 10.
Cost breakdown of current and future green hydrogen production. Note: Authors’ elaboration based on [43].
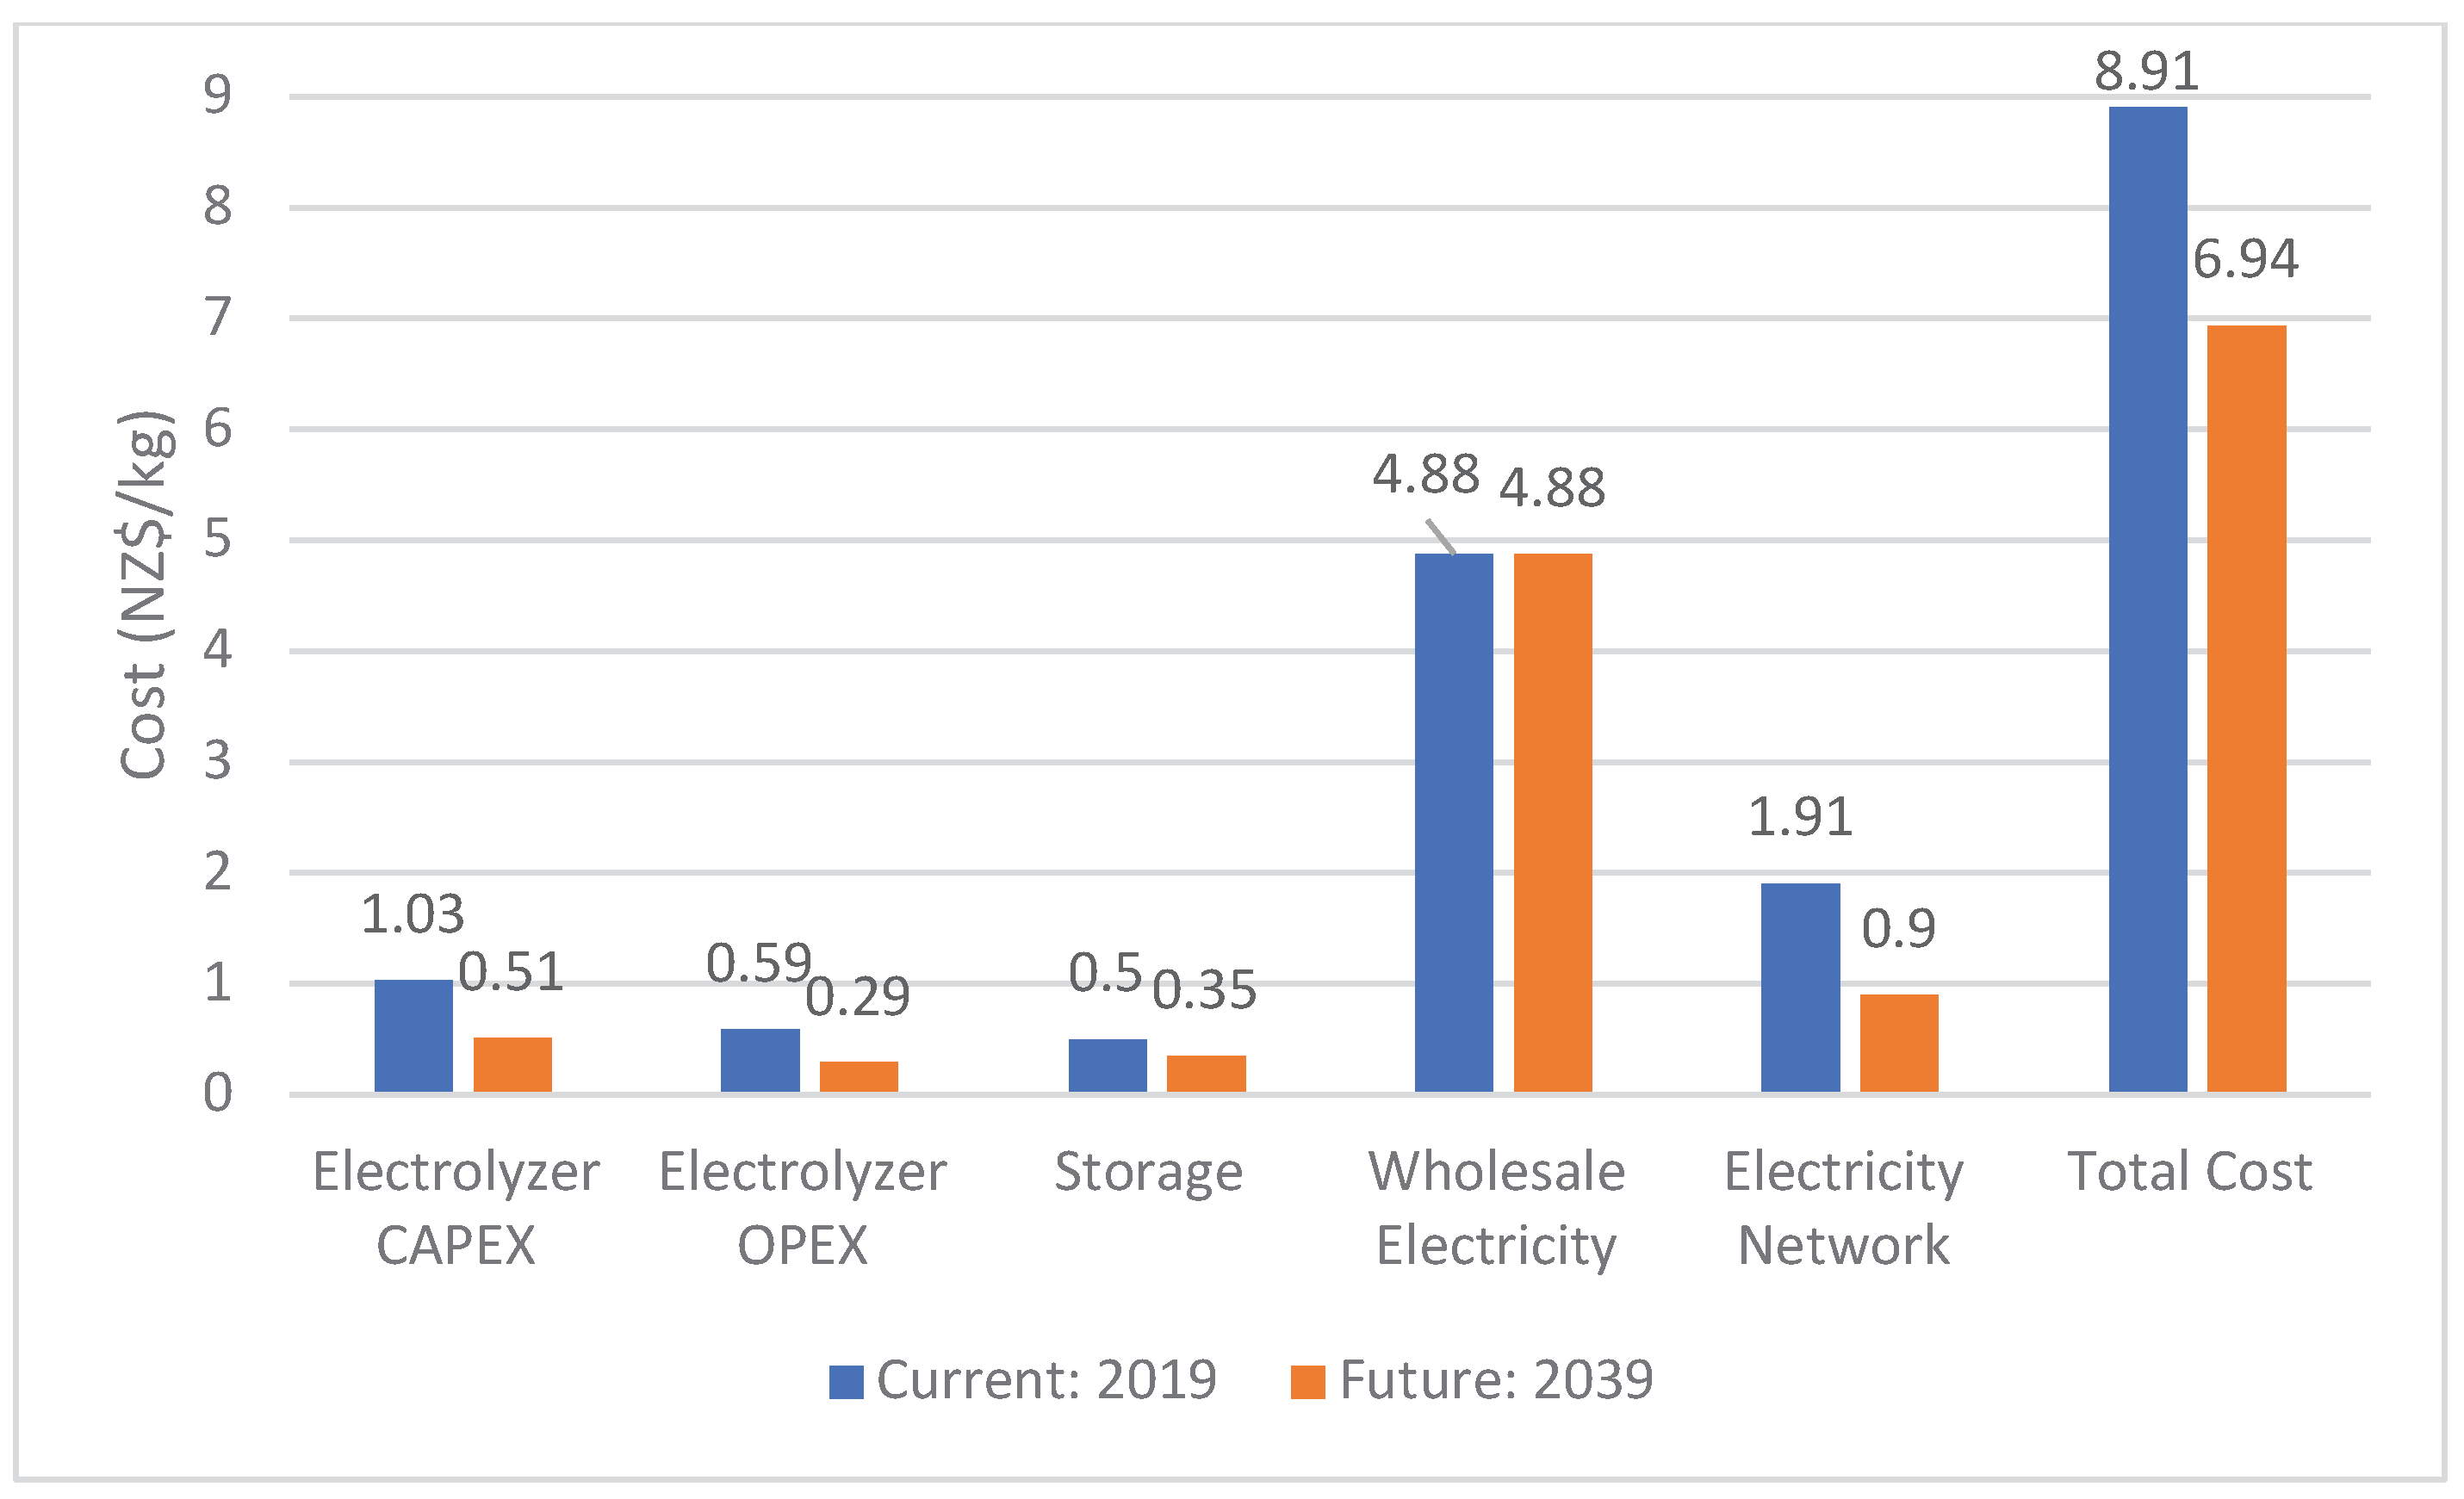
Figure 11.
Modelled current cost estimates for H2 in various scenarios. Note: Authors’ elaboration based on [43].
Figure 11.
Modelled current cost estimates for H2 in various scenarios. Note: Authors’ elaboration based on [43].
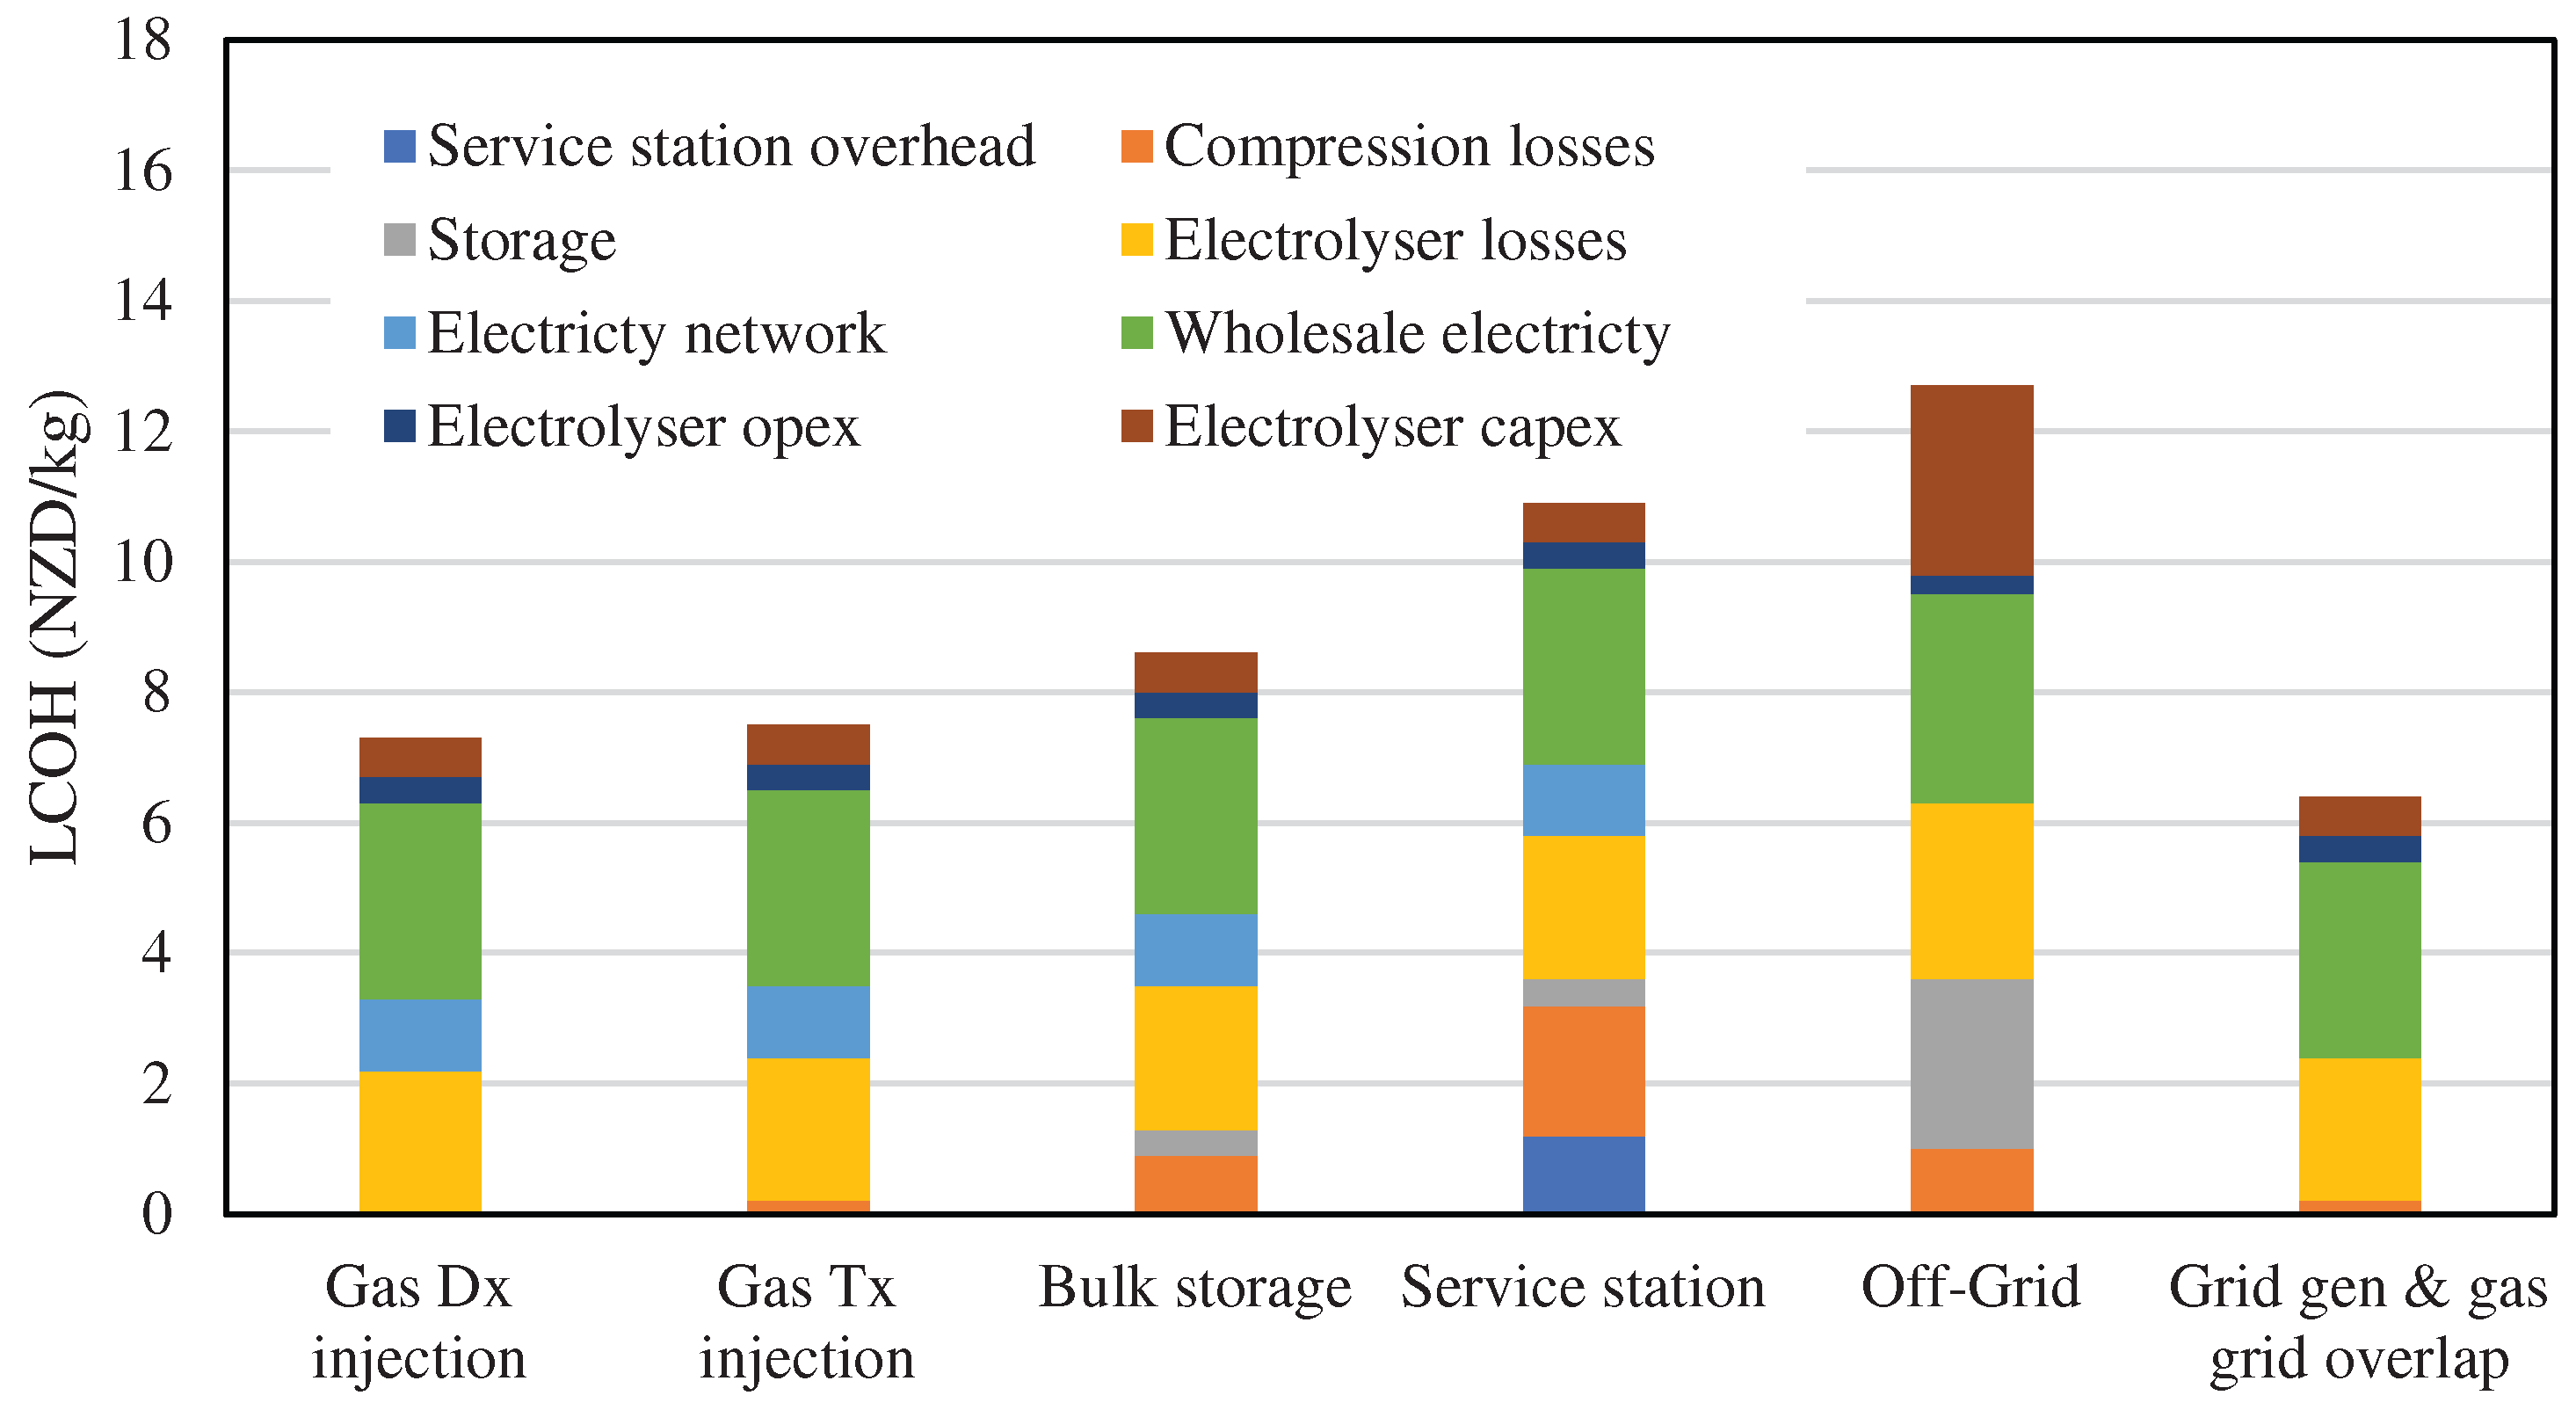
Figure 12.
Modelled wholesale energy duration curves. Note: Authors’ elaboration based on [43].
Figure 12.
Modelled wholesale energy duration curves. Note: Authors’ elaboration based on [43].
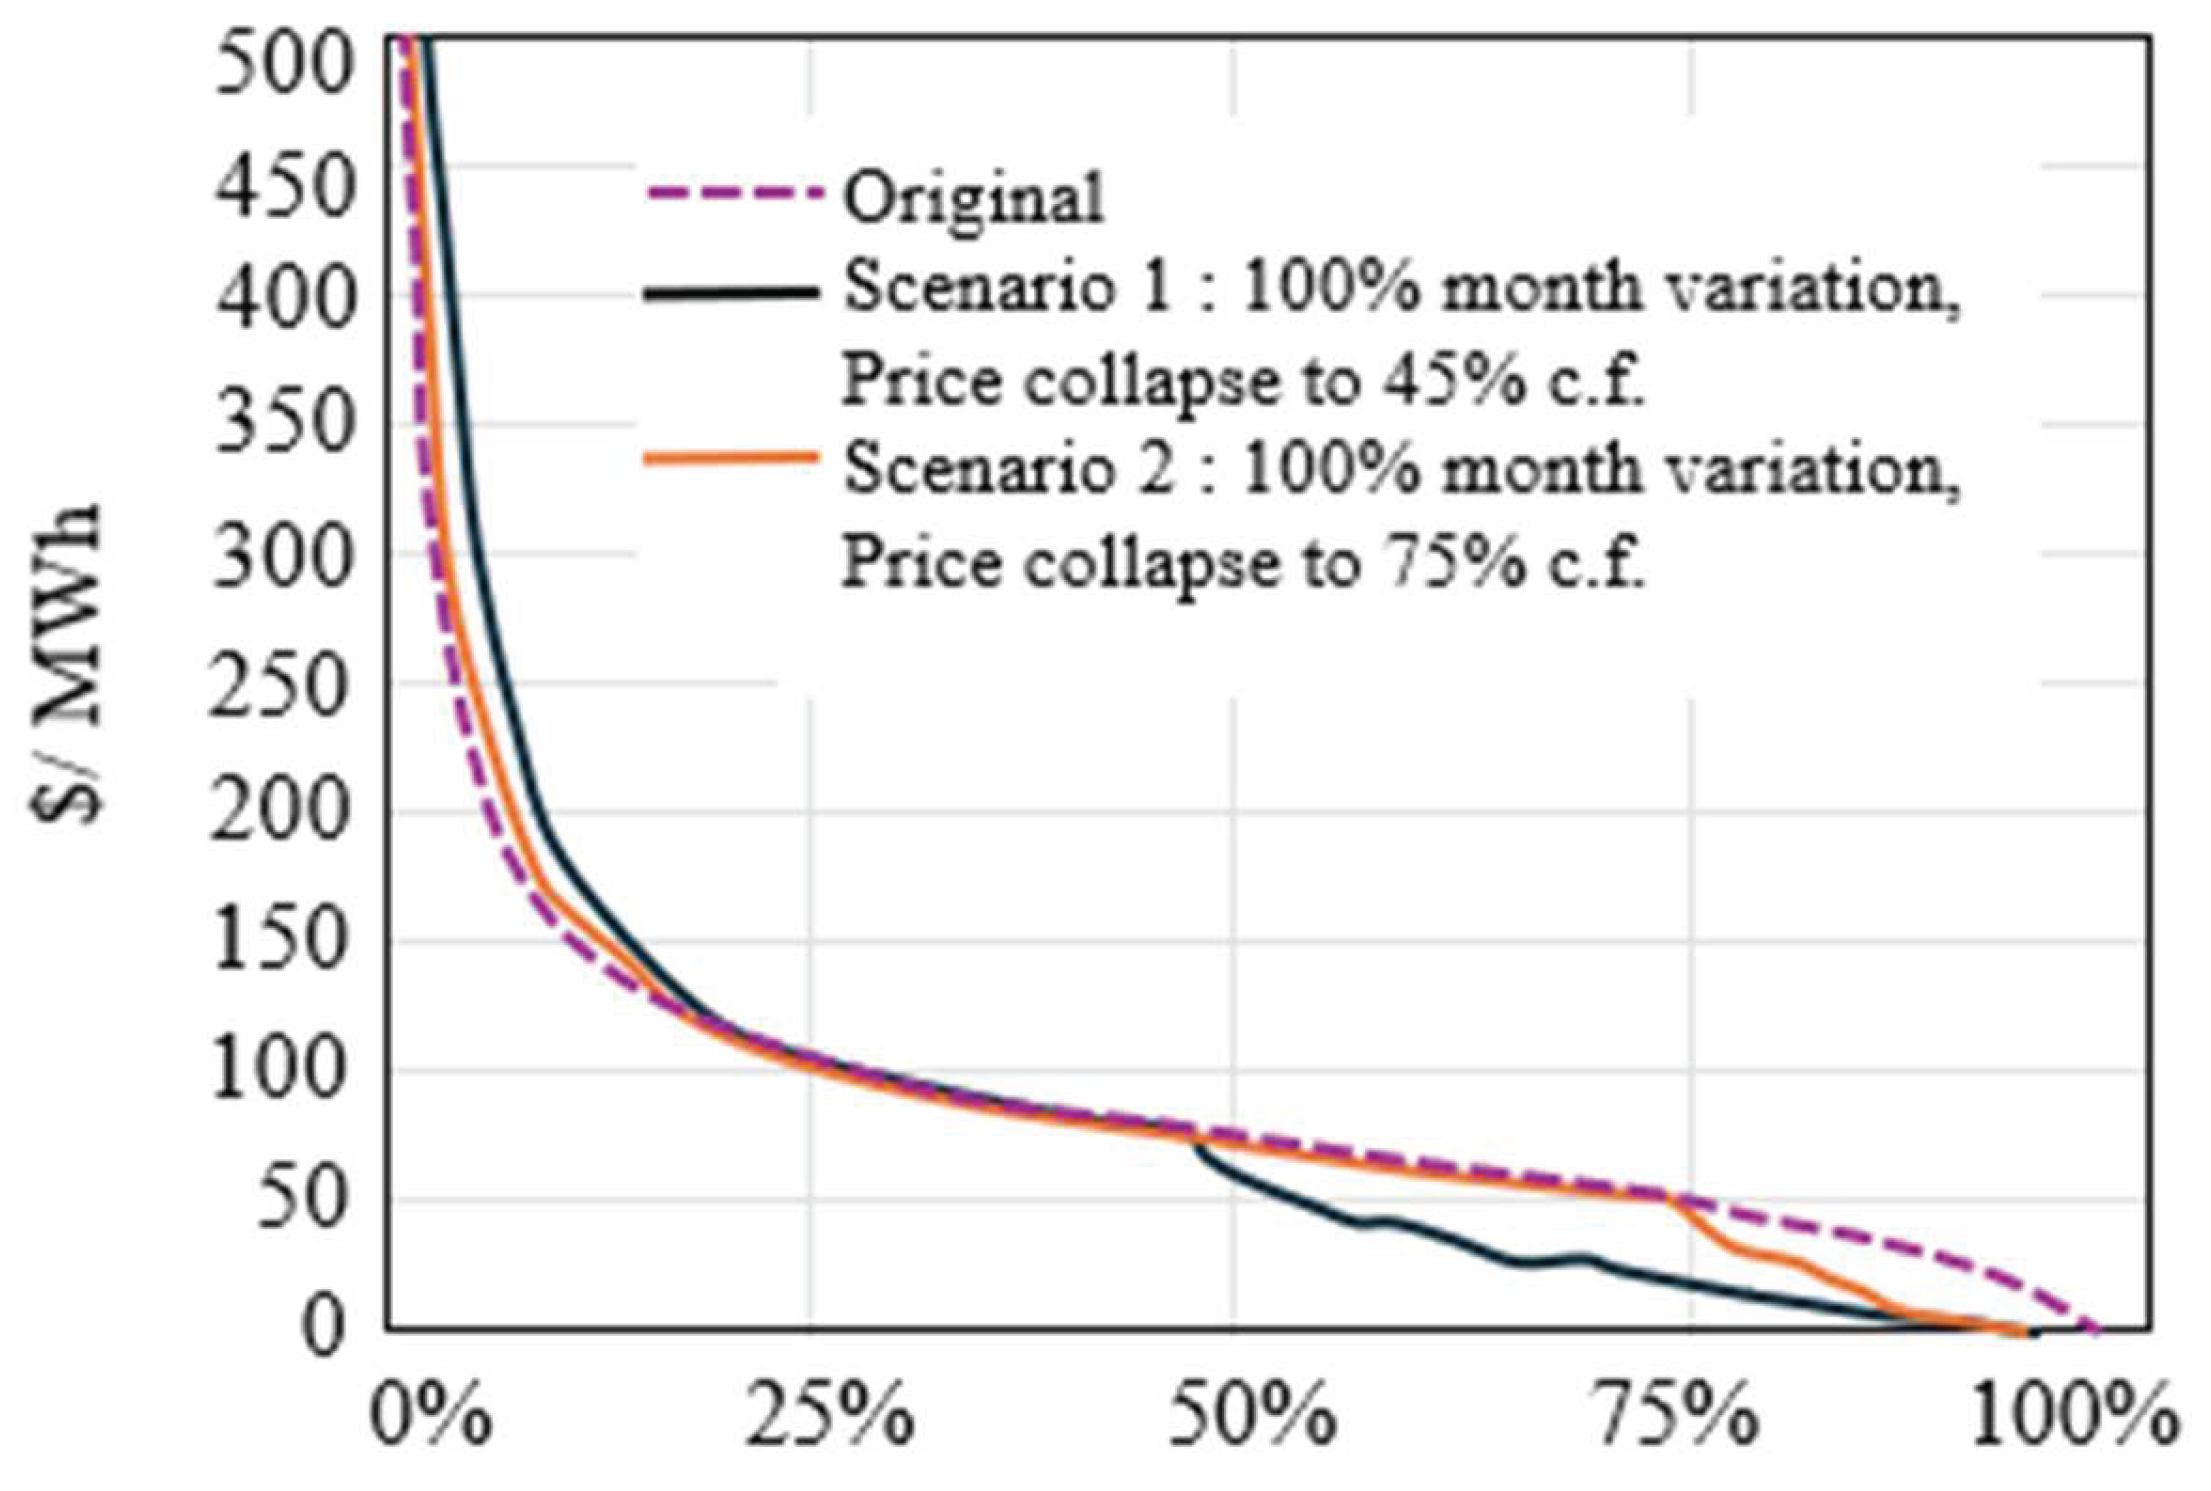
Figure 13.
Modelled future H2 production costs. (a) Dx injection with current level of renewables penetration. (b) Dx injection with very high levels of renewables penetration. (c) bulk storage scenario with very high levels of renewables penetration. Note: Authors’ elaboration based on [43].
Figure 13.
Modelled future H2 production costs. (a) Dx injection with current level of renewables penetration. (b) Dx injection with very high levels of renewables penetration. (c) bulk storage scenario with very high levels of renewables penetration. Note: Authors’ elaboration based on [43].
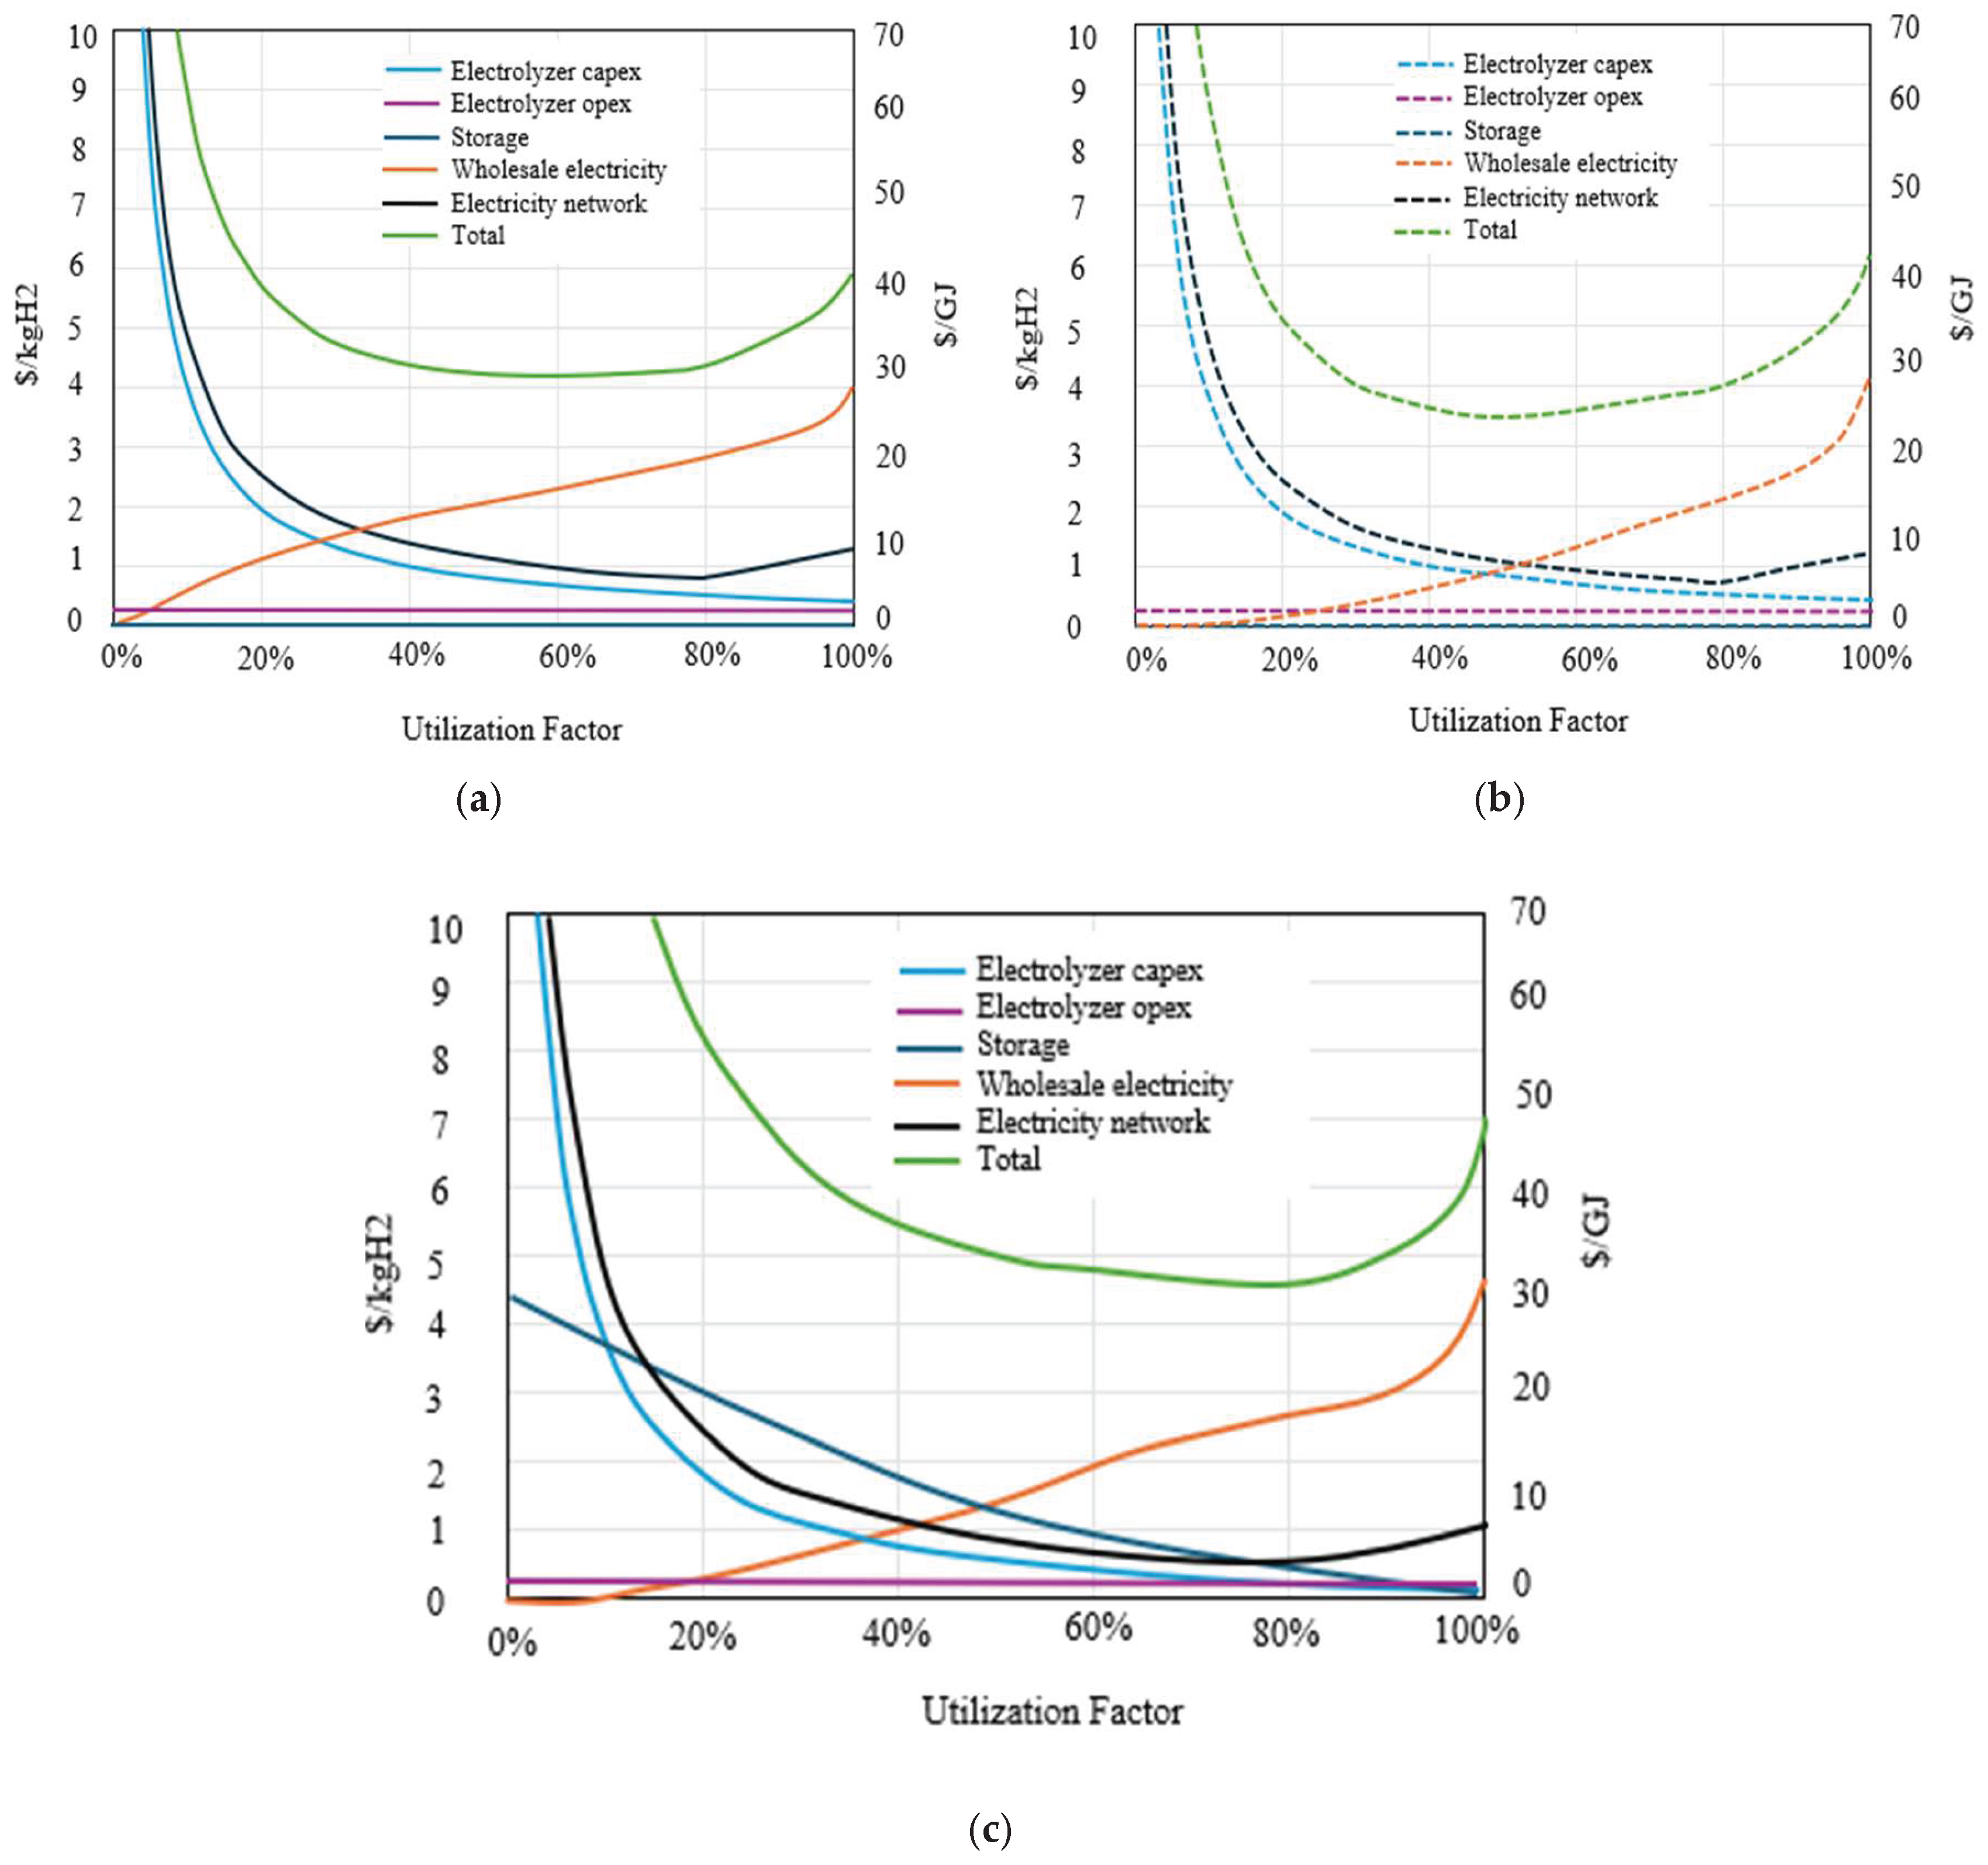

Table 1.
Potential geostorage sites in NZ.
| Site | Generation Type [Capacity] | Geostorage Type | Potential use case |
|---|---|---|---|
| Manapouri | Hydro [850 MW] | Hard rock cavern | Dry-year storage |
| Ohai-Eastern Bush | Hydro [850 MW] | Sedimentary porous-media storage | Dry-year storage Domestic markets Export markets |
| Tiwai Point | Hydro [850 MW] | Hard rock cavern | Export markets Domestic markets |
| Waipipi | Wind [133 MW] | Sedimentary porous-media storage | Dry-year storage Domestic markets |
| Mokai | Geothermal [112 MW] | Volcanic porous-media storage | Domestic markets |
| Marsden Point | Solar [26.7] MW | Volcanic porous-media storage | Domestic markets Export markets |
Note: Authors’ elaboration based on [49].
Disclaimer/Publisher’s Note: The statements, opinions and data contained in all publications are solely those of the individual author(s) and contributor(s) and not of MDPI and/or the editor(s). MDPI and/or the editor(s) disclaim responsibility for any injury to people or property resulting from any ideas, methods, instructions or products referred to in the content. |
© 2025 by the authors. Licensee MDPI, Basel, Switzerland. This article is an open access article distributed under the terms and conditions of the Creative Commons Attribution (CC BY) license (http://creativecommons.org/licenses/by/4.0/).
Copyright: This open access article is published under a Creative Commons CC BY 4.0 license, which permit the free download, distribution, and reuse, provided that the author and preprint are cited in any reuse.


