

Submitted:
01 June 2025
Posted:
04 June 2025
You are already at the latest version
Abstract
This study analyzes what factors affect the technical efficiency (TE) of firms in the supporting industry in the context of Vietnam’s digitalized economy. Stochastic Frontier Analysis (SFA), Fixed Effect Models, System-GMM methods are applied to reach the findings that quality of human resources, capital intensity and firm size have positive effects on TE. Furthermore, exogenous environment factors such as domestic demand of an industry impacting to all upstream businesses which use inputs that are products of that industry (BSpill-ratio) and FDI backward effect (BFSpill) also exhibit positive effects. These confirm the linkage between domestic supporting industry suppliers and FDI assembly enterprises plays an important role to improve TE. Vietnam's digital transformation since 2020 has also created some interesting changes in the correlation coefficient. Location, sectors, competitiveness, and investment environment are also considered to prove that they are all determinants to be attention in management policies of both firm-level and government-level. Our contribution of this study is new policies aligned with many major changes in the world economic context such as the tough tariff policy implemented in recent presidential administrations, a series of reforms of the Vietnamese Government as well as strong digital transformation in Vietnam. Key findings of this research are important by confirming which factors are really determinants for Vietnamese government to imply investing policies for this industry effectively.
Keywords:
Technical efficient
; supporting industry
; digital economy
1. Introduction
In recent years, Vietnam is one of Asian emerging markets attracting many technology corporations and leading multinational companies such as Intel (USA); Amata (Thailand); Foxconn (Taiwan); Samsung, Bumjin (Korea); Toyota, Mitsubishi, Toray, Yazaky (Japan), Wilmar (Singapore), and so on. It can be seen that the structure transformation between industries has changed positively: the proportion of processing, manufacturing and high-tech industries in Vietnam has increased over the past ten years. The role of the supporting industry has become very important. It is the foundation to help key industries develop, avoid material shortages and supply chain disruptions (Wirjo & Cheok, 2017[1]; Le & Diem, 2020[2]). Whether a country's industry develops or not depends on this inter-dependent causal relationship. That’s why the government as well as researchers concern on how to urge the performance of supporting industry businesses effectively; what factors determine good performance for this kind of businesses.
However, it is recognized that the supporting industry in Vietnam still mainly relies on available advantages from natural resources, and tends to be labor-intensive. Domestic supporting industry firms mainly produce simple, low-value components, and only receive contracts from FDI, which means they participate in the value chain as the second of third level suppliers for directly-export-FDI enterprises. Therefore, it is difficult for domestic firms to receive technology spillover from MNCs. For experimental study, there are several conflicted results. The majority of studies focus on manufacturing and textile, garment and footwear since they are conducted in developing countries. Many research focuses on affecting of firm-specific factors such as firm size, age, size - quality of labour resources, and so on to the businesses’ technical efficiency. Furthermore, one of the motivations for the authors to conduct this study is that although the Vietnamese government has had policies to support the development of supporting industries, they still develop unevenly and ineffectively.
Especially in 2019, the COVID pandemic broke out and quickly spread around the world, depleting many economies. The social distancing policy has had a great impact on the production process; many businesses had to suspend production to implement epidemic prevention. The Covid pandemic has disrupted the supply chain, causing difficulties for supporting industry enterprises. At the same time, it has also promoted the trend of digital transformation in businesses to survive and adapt in the new context of the economy. Businesses are aware of the role of digital transformation to their operational efficiency. Whether digital transformation will have any impact on the development of this industry is still a question that needs to be answered because the COVID pandemic is still showing signs of returning, or other epidemics and political crises can still cause the "shut down the economy" and "social distance".
Because of the contradictions in the results of previous studies, we are motivated to do this study to determine in the Vietnamese economy what factors really affect the efficiency of the economy of supporting industry enterprises. In addition, when the economic context is drastically changed by new world context and digital transformation, will the impact of those factors on the performance of enterprises in this industry be changed? Furthermore, the world economic context is undergoing many major changes such as: the Ukraine-Russia war, the strict tariff policy implemented in recent presidential administrations with record high import tariffs, along with strong digital transformation and a series of reforms within the Vietnamese economy, so our analysis results are especially useful for Vietnamese economic policy makers as well as foreign investors and company managers.
2. Materials and Methods
2.1. Determinant on Firm’s Performance
There are various methods to consider firm’s performance such as: Fundamental analysis, Warranty analysis, and so on. Firm performance is traditionally evaluated by using the production frontier: Firms located on the frontier are efficient firms, while those below the frontier are considered inefficient. Aigner et al. (1977)[3] and Meeusen & Broeck (1977)[4], when estimating the production frontier, considered the effect of random errors. The production frontier thus formed is the optimal production curve. Therefore, the technical efficiency of each business is a factor considered to evaluate the ability to improve the business’s productivity towards the optimal state. In this research, technical efficiency is used to analyze the firm performance and explore key factors affecting on it to propose sound solutions. Farrell (1957)[5] defines productive efficiency is the ability of the producers to efficiently use the available resources to produce maximum output at the minimum cost. He refers technical efficiency (TE), which is estimated from the production function, is the performance of the producer to avoid waste of inputs to produce.
Recent studies analyzing the technical efficiency of businesses often use two popular methods, SFA (Stochastic Frontier Analysis) and DEA (Data Envelopment Analysis). DEA is a non-parametric estimation that calculates the technical efficiency of businesses according to the distance function. The advantage of this method is there is no need to define the function format but the disadvantage is that it is sensitive to outliers, which leads to bias in determining the production frontier and lack of statistical tests. SFA overcomes the limitations of the DEA. SFA is a parametric method for estimating the production frontier, taking into account the random error of the most efficient firms. Many studies apply this approach to assess technical efficiency and the factors affecting such as Batra & Tan (2003)[6]; Ismail & Abidin (2017)[7]; H. T. Nguyễn (2020)[8]. However, we find contradictions in the results of the empirical studies.
There have been many studies on factors affecting TE of enterprises in general, for all types of enterprises. These factors can be listed as: firm age, firm size, participation in exporting, human capital, capital intensity, investment environment, location, firm ownership, capital structure, supporting from Government, competitiveness of domestic enterprises, and so on.
In this study, the authors focus on analyzing some factors that are considered important and have a major impact on the technical efficiency of domestic enterprises in the supporting industry in Vietnam (based on To & Nguyen, 2021[9]). This will be presented in the next section to form our research hypotheses.
2.2. Research Hypotheses
For this study, we choose the Technical Efficiency analysis to fit with features of the supporting industry which focuses on products in the supply chain for the main industry; especially suitable for companies in the processing, manufacturing, and construction industries. Estimating technical efficiency (TE) is the foundation for examining the overall efficiency of firms (Vu, 2016[10]). From reviewing previous studies, we build the foundation for research questions and hypotheses of determinants on TE of supporting firms, focused on the following key factors:
2.2.1. Firm Size
The relationship between firm size and technical efficiency has remained a controversial issue. From both an empirical and theoretical perspective, their relationship is unclear. Some researchers advocate promoting and supporting small businesses on the basis of economic and welfare arguments. For example, it is argued that expanding the small business segment will lead to more efficient resource allocation, less unequal income distribution, and less under-employment because small businesses tend to be more labor-intensive. Employees of small firms may be more motivated by competition-based incentive schemes than by financial schemes, which may make small firms more efficient. Firm size is shown to be a statistically significant determinant of firm technical efficiency and is negatively correlated with the non-technical efficiency effect of the firm (Chapelle and Plane, 2005[11])
Lundvall & Battese (2000)[12] found that the relationship between firm size and technical efficiency is not consistent. Yang & Chen (2009)[13] compared the technical efficiency of SMEs with that of large firms and studied the factors affecting technical efficiency in the electronics industry in Taiwan. They found that the average technical efficiency of large firms is higher than that of SMEs but it is lower when considering the endogenous selection of firm size. Charoenrat et al. (2013)[14] examines determinants on the technical efficiency of small and medium-sized companies (SMEs) in the manufacturing and assembly industry in Thailand; Kim et al. (2012)[15] studied some Malaysian manufacturing industries in the period 2000–2004; and other researchers such as Assefa Admassie & Matambalya (2002)[16], Lundvall & Battese (2000)[12], Le & Harvie (2010)[17], Bhandari & Ray (2012)[18] share the same point of view when stating that the relationship between firm size and technical efficiency is positive, i.e the larger the firm size, the higher the technical efficiency. Large-scale factories often have higher technical progress as well as greater technical efficiency. Meanwhile, Cheruiyot (2017)[19] used cross-sectional data of 396 companies in the manufacturing and assembly sector in Kenya in 2007, by SFA method, which shows that large firm size has a negative impact on technical efficiency as Margono & Sharma (2006)[20] find negative impact of firm size on technical efficiency with the sample of Indonesian textile companies in the period 1993-2000. These researchers explain that maybe large-scale enterprises have a complex organizational structure, resulting in a longer and more rigid decision-making process than small businesses.
Amornkitvikai et al. (2014)[21] used stochastic frontier and data envelopment analysis (DEA) to analyze the impact models of technical inefficiency on manufacturing SMEs in Thailand and found that Thai manufacturing SMEs experienced decreasing returns to scale despite their relatively high technical efficiency in production. Their results using both approaches also showed that firm age, medium versus small size, firm location in Bangkok, foreign investment, and government support were significantly and positively associated with technical efficiency. Le & Harvie (2010)[17] assessed technical efficiency and identified the determinants of technical efficiency of non-state-owned domestic SMEs in Vietnam. The results show that SMEs in the manufacturing sector in Vietnam have relatively high average technical efficiency, ranging from 84.2% to 92.5%. They explain that small businesses are more efficient due to their flexibility in diversifying and adjusting their business operations in a rapidly changing transition economy.
Alvarez & Crespi (2003)[22], on the other hand, found that larger firms perform better than small firms because small firms may face the following constraints: (i) difficulty in accessing external loans for investment, (ii) lack of efficient resources (e.g. human capital), (iii) lack of economies of scale, and (iv) lack of formal contracts with customers and suppliers. Similarly, Harvie (2002)[23] also mentioned that there are five main constraints that hinder the growth of small and medium enterprises, namely (i) access to markets, (ii) access to technology, (iii) access to human resources, (iv) access to finance, and (v) access to information.
The research question here is: for firms in Vietnam's supporting industry, what is the impact of firm size on technical efficiency?
We suppose the first research hypothesis here is:
H1:
Firm size has positive impact on technical efficiency (TE) of firms in Vietnam's supporting industry
2.2.2. Market SIZE
Not only firm size but also market size is a factor considered as having effect on TE of firms by previous studies (Perelman, 1995[24]; Gumbau-Albert, 2002[25]). According to Ohno (2007)[26], market size plays a decisive role in the existence and development of supporting industries because these industries must have a large enough number of orders to be able to participate in the market. In addition, compared to assembly industries, technology in supporting industries is often more capital-intensive. Some supporting industries such as casting and stamping require a lot of expensive machinery - production equipment cannot be divided into many parts and therefore businesses in the industry must make efforts to reduce unit capital costs by increasing output. Therefore, it is necessary to have a large demand for supporting industry products.
In Vietnam, among the few studies on the same topic, Huyen (2018)[27] demonstrated the positive impact of market size variables - reflected in provincial GDP and enterprise import-export indicators - on the increase in revenue of the electronics supporting industry. Nhan (2019)[28] also confirmed the positive impact of market capacity on the development of supporting industry in Bac Ninh province. In this study, we will also consider the market size reflected through the BFSpillindex, which shows the demand of FDI companies in the upper - industry using products of supporting industry enterprises. Domestic market demand for supporting industry (BSpill_ratio index) is also included as a factor for analysis and evaluation. Through these two indexes to reflect the market demand of supporting industry, i.e market size factor.
We suppose the second research hypothesis here is:
H2:
Market size (BFSpill and BSpill_ratio) has positive impact on technical efficiency (TE) of firms in Vietnam's supporting industry
2.2.3. Quality of Human Resources
Human resources always play an important role in the development of enterprises in general and supporting industry firms in particular (Gumbau-Albert, 2002[25]; Crespi & Alvarez, 2003[22]; Charoenrat & Harvie, 2014[29]). Supporting industry requires skilled workers for effective use of machinery capacity (Ohno, 2007[26]). In addition, due to their features as small and medium ones, human resource is even more important in improving the efficiency of business operations. Huyen (2018)[27] has evaluated the quality of human resources on the revenue of supporting industry firms in Vietnam, however there is no significant evidence for this.
We suppose the third research hypothesis here is:
H3:
Qualityof human resources has positive impact on technical efficiency (TE) of firms in Vietnam's supporting industry
2.2.4. Capital Intensity
Capital and labor are the two most basic factors of production. Technical efficiency refers to the ability to combine inputs such as labor and capital at a given state of technology to produce given levels of output. Therefore, capital intensity represents the ability of a business to provide capital to its workers, which is also a factor that researchers such as Gumbau-Albert (2002)[25], Batra & Tan (2003)[6], Ismail & Abidin (2017)[7] have confirmed to have an impact on TE of a firm. In developing countries like Vietnam, capital investment plays a major role in changing the technical efficiency of enterprises. In particular, investment in fixed assets and new assets, replacing old technology with new technology to change production capacity, improve production efficiency (Vu, 2016[10]; Sinani et al., 2008[30]). This is especially meaningful in the context of digitalization of the economy, requiring enterprises to invest in new machinery and technology to carry out digital transformation in their own operations.
So, we suppose the fourth research hypothesis here is:
H4:
Capital intensity has positive impact on technical efficiency (TE) of firms in Vietnam's supporting industry
2.2.5. Investment Environment
This factor includes a stable policy environment, preferential policies, and narrowing the gap in awareness and information between domestic suppliers and foreign enterprises. These are factors that ensure the comprehensive development of supporting industries (Ohno, 2007[26]). Huyen (2018)[27] affirms that the system of strategies, policies, and information systems are factors that create a favorable business environment for supporting industries in the Vietnamese electronics industry. Information connection and tax policies are also confirmed to have a positive impact on the development of supporting industries in some provinces.
In this study, the authors assess the institutional environment through two indicators, that is “fair competition” and “the level of corruption”, both of them are extracted from the Provincial Competitiveness Index (PCI) of Vietnam. Good investment environment is the one with highly fair competition and low level of corruption. Furthermore, location of a business is also considered through the dummy variable "Region". Location factor contributes to create differences in investment environment and competitive advantages (being close to main traffic routes and seaports will create competitive advantages in terms of costs, having good relationship with the government, and supported by the local government policies, and so on). So, location can have impact on TE (Nguyen, 2019[31]; Charoenrat & Charles, 2014[29]).
We suppose the fifth research hypothesis here is:
H5:
Good investment environment has positive impact on technical efficiency (TE) of firms in Vietnam's supporting industry.
2.2.6. Linkage Between Domestic Supporting Industry Suppliers and FDI Assembly Enterprises
This linkage plays an important role, not only providing a large demand for domestic supporting industry firms but also contributing to improve the operational efficiency and technological level of domestic companies. (Ohno, 2007[26]) pointed out that narrowing the gap in information and awareness between supporting industry enterprises and FDI assembly enterprises is one of the factors contributing to promoting the development of supporting industry. Linkages with FDI enterprises also create spillover effects on the technical efficiency of enterprises in general (Newman et.al, 2015[32]; Sari et.al, 2016[33]; Sur & Nandy, 2018[34]). Through the HFSpill index, we measure the impact of this factor.
We suppose the sixth research hypothesis here is:
H6:
Strong linkage between domestic supporting industry suppliers and FDI assembly enterprises (through HFSpill index) has positive impact on technical efficiency (TE) of firms in Vietnam's supporting industry.
In addition to the above factors, digital transformation of Vietnam's economy is also a factor to be included in this analysis. Therefore, in the next parts, experimental models are tested to find out what determinants really have impacts on the Vietnamese supporting industry development.
2.3. Research Functions
Based on theoretical studies, the production function can be described as follows:
While, is the output of firm i, is the vector of explanatory variables used in the model; is random error (noise effect), is the error representing for inefficiency effect.
With assumptions as:
- -
- vi are assumed to be independently and identically distributed as N (0,)
- -
- ui is assumed to be distributed independently of vi and to satisfy ui ≦0
- -
- ui is derived from a N (0,) distribution truncated above at zero.
- -
- u, v have no correlation with X
After estimating, technical efficiency (TE) is defined as follows:
We use the SFA method for its advantages to consider the effects of three groups of factors to technical performance of supporting industrial businesses: i) internal factors such as human resource quality, capital intensity; ii) external factors such as impact of FDI enterprises in the same industry, FDI backward effects, domestic demand of industry, institutional environment, and iii) firm-specific factors such as region, firm size, minor-industry.
SFA is a parametric approach which assumes production function has the Translog form or Cobb-Douglas form, then estimate the coefficient of parameters such as capital, labor, raw materials (Battese & Coelli, 1995[35]). SFA is the two – stage estimation method, in which in the first stage, technical inefficiency component is decomposed from error terms. In the second stage, technical inefficiency is the dependent variable, and we run regression for some independent variables. Maximum likelihood estimation suggested by Battese & Coelli (1995)[35] is commonly used in the second stage. Some studies adopt different estimation techniques such as Generalized Methods of Moments (GMM), Fixed effect model, Random effect model (Mattsson et al., 2020[36]; Otsuka & Natsuda[37], 2016; Söderbom & Teal, 2004[38])
Then recommendations are made in the context of the digitalized Vietnamese economy in post COVID-19 pandemic. The sample is from 2014 to 2022. Either Cobb-Douglas function or Translog function is chosen to estimate technical efficiency (TE).
Cobb-Douglas function:
Translog function:
2.4. Research Data
The data used in this study is a panel dataset connected from the data of the following enterprise surveys: i) Economic Census 2014-2022 ii) Enterprise Census (executed) by the General Statistics Office) focusing on supporting businesses; iii) E-commerce index report data of Vietnam E-commerce Association (VECOM); iv) PCI Provincial Competitiveness Index Survey (conducted by VCCI). Table 1 below gives the summary of determinants considered in this study.
Regression models with technical efficiency (TE) as the dependent variable and determinants as independent ones estimated by four methods (Pooled-OLS, Fixed-Effect Model, Random Effect Model, and System-GMM to solve the endogeneity), respectively with full sample from 2014-2022, and two sub-samples (2014-2019, 2020 -2022).
The year 2020 is chosen to be the benchmark to divide into two sub-samples: before and after the digital transformation of the economy in order to find out the impacts of economy digitalization as an important factor on the development of these firms. The authors chose Year 2020 as the marking the strong digital transformation taking place in Vietnamese enterprises, based on a survey of 400 enterprises on "The current status of digital transformation in enterprises in the context of the COVID-19 pandemic" conducted by the Vietnam Federation of Commerce and Industry (VCCI). This survey shows that since the Year 2020, Vietnamese enterprises have begun to recognize and apply digital technologies in stages such as internal management, purchasing, logistics, production, marketing, sales and payment. In the field of internal management, cloud computing is the most used technical tool by Vietnamese enterprises, with 60.6%, an increase of 19.5% compared to the time before the COVID-19 pandemic; about 30% of businesses have used online work and process management systems, better than in the Year 2019.
3. Results
3.1. Test to Choose Appropriate Production Function
Table 2 shows our test to choose appropriate production function, either Cobb-Douglas model or Translog model to estimate for technical efficiency (TE), as well as testing for whether exist or inefficiency. Stochastic frontier production function and Maximum Likelihood Equation methos are applied for testing.
In the Cobb-Douglas model, labor, capital and cost variables all have a positive effect on output at the 1% significance level. Meanwhile, in the Translog model, cost variables have a negative effect on output at the 1% significance level. In addition, the Translog model has a higher Log Likelihood index. The very small p-value (p < 2.2e-16) shows that the Translog model has better statistical significance.
Thus, the research model as the Translog production function model is chosen to estimate TE. Our research model is defined as:
In which, includes variables considered of important impact on technical efficiency, ωit is the error term of the inefficiency model assumed as a truncated normal distribution. includes 2 groups: endogenous and exogenous determinants as in Table 2.
3.2. Determinants on TE: Analysis by Pooled OLS, FEM, and REM Models
Regression models with technical efficiency (TE) as the dependent variable and determinants as independent ones estimated by three methods (Pooled-OLS, Fixed-Effect Model, Random Effect Model) shown in Table 5, respectively with full sample from 2014-2022.
In all three estimations, the correlation coefficients are consistent in sign. Tests to select the most suitable model shows that FEM is the suitable one presented in Table 6.
Results from FEM show that:
Quality of human resources (lnHum) and Capital intensity (lnDC) all have positive effects on TE at a significance level of 1%. Our results are similar to the findings of Yang et al. (2010)[39]; Chaffai et al. (2012)[40], Charoenrat and Harvie (2014)[29], Cheruiyot (2017)[19] and Kashiwagi and Iwasaki (2020)[41] on the influence of skilled labor on technical efficiency in production of firms. Furthermore, this result implies the importance of improving workers’ skills and training human resources, thereby increasing production efficiency. In addition,
Firm size (lnSize) has a positive impact on TE of supporting industry firms in Vietnam at the 1% significance level. This implies that large-scale enterprises can take advantage of organizational strength and technological requirements to achieve larger production levels. At the same time, larger-scale enterprises have higher financial capacity and modern management skills, so they can better handle difficulties, thereby achieving higher technical efficiency.
For investment environment, we find that location of a business also affects its technical efficiency. TE of supporting industry firms at Southeast region of Vietnam is better than ones in Red River Delta region; but Red River Delta region shows better performance than at Northerns Midlands and Mountains region (region No.2), as well as North Central and Central Coast Region (region No.3). It is explained by the fact that, in a comparison the mountainous and central regions of Vietnam, plains with flat terrain and near the sea are more favorable for factories to transport materials and products, saving more costs. Different sectors exhibit different levels of TE, all at the 1% significance level. TE of No. (3), (4), (5), (6) sector is better than textile’s industry; and leather and footwear industry’s is the worst although textile as well as leather and footwear were previously two main export industries of Vietnam. These also show the shift in the manufacturing industry structure in Vietnam to adapt to the new economic context in the era of the “4.0 Industrial Revolution”. With a negative correlation of the variable “informal”, our results also show that poor investment environment will inhibit TE while having relationships with the government can help the firm to perform better (the variable “state” has a positive impact on TE at the 1% significance level).
Furthermore, for exogenous environmental factors, we find that HFSpill has no impact on TE while BFSpill (FDI backward effect) and BSpill_ratio (domestic demand of an industry impacting to all upstream businesses which use inputs that are product of that industry) all show a positive impact on TE at the 1% significance level. This suggests that when domestic demand for supporting industry products increases, supporting industry manufacturers may increase production to meet the demand. This may lead to increased productivity and optimal utilization of production lines, thereby improving technical efficiency. In addition, increased demand for supporting industry products may lead to competition among supporting industry manufacturers, thereby forcing these manufacturers to improve technical efficiency to reduce production costs and compete in the market.
3.3. Determinants on TE by System - GMM Model
Endogeneity problems are inevitable for data, therefore, to strengthen the consistency of this study results, system-GMM models are applied for the research functions. Results are shown in Table 7 for the full sample, which is rather the same coefficient as in FEM.
3.4. Digital Transformation of Vietnamese Economy
To consider whether the impact of factors affecting TE is different between before and after digital transformation, we perform regressions with two sub-samples, using the year 2020 as the benchmark to divide sub-samples because 2020 is considered as the time Vietnam's economy has many significant changes after COVID-19 and shows many activities of digital transformation. Results are presented in Table 8 and Table 9.
Similar tests as for full sample are performed in both sub-samples, again FEM is the most suitable model. We also apply system-GMM for the 2 sub-samples which presented in Table 10.
Results from system -GMM is rather the same coefficient as in FEM. Our discussions are made based on FEM results, the same way as To & Nguyen (2021)[9], Nguyen (2019)[31], as well as Diallo et al. (2019)[42] when they analyze TE of firms.
Results from FEM models of the first sub-sample (without digitalization) are almost similar with the ones in full sample. However, the second sub-sample (with digitalization), there are some surprises. Firstly, firm size still has a positive impact on TE of supporting industry firms in Vietnam at the 1% significance level but stronger in the context of digitalization with the coefficient as 0.0163. capital intensity still has but also stronger fostering impacts on TE while human resources show a negative relation at the 1% significance level. The correlation coefficient of Bspill_ratio and BFSpill changed from positive to negative in both sub-samples. HFSpill also changed the sign of correlation coefficient in the second sub-sample.
In brief, this study results confirm all research hypotheses from H1 to H5 in the full sample: Firm size, market size, human resources, capital intensity all have the effects of promoting TE increase, which means promoting the development of companies in Vietnam's supporting industry. Location, sectors, competitiveness, and investment environment are also considered to prove that they are all determinants to be attention in management policies of both firm-level and government-level. Our results do not confirm to the hypothesis H6, which is needed to discuss in more details in the aspect of policies.
4. Discussion
By confirming what factors are really determinants for Vietnamese supporting industry from our key research findings, some recommendations should be discussed:
Quality of human resources is proved as the determinant for the Vietnamese supporting industry. The higher quality of labor, the more effective using of existing technology and the adoption of new technology, which in turn leads to higher levels of efficiency (Sinani et al., 2008[30]). This positive relation also implies that increasing capital investment intensity on labor will increase technical efficiency in Vietnamese supporting industry enterprises. This is in line with the digital transformation context of the world economy and Vietnam, requiring workers to grasp and master the use of new technologies. This finding is similar to the study of Nguyen et al. (2019)[31], Jorge-Moreno and Carrasco (2015)[43] on the role of capital investment intensity per worker on the production activities of enterprises.
Good investment environment, with support from the government and local authorities, will promote better development for firms in Vietnam's supporting industry. The institutional environment can provide support and incentives for them to improve productivity and technical efficiency. This may include the provision of resources, investment in research and development, training of high-quality human resources, and policies that encourage investment and industrial development. The institutional environment also provides a legal and regulatory framework to regulate the operations of firms in the supporting industry. Having a clear and stable legal framework can facilitate enterprises to develop and invest in modern technology. In addition, regulations on intellectual property rights and protection of partners can also create incentives for innovation and technical development.
The linkage between domestic supporting industry suppliers and FDI assembly enterprises plays an important role to improve TE, which is shown in the full sample. Technology spillovers from FDI enterprises can generate some benefits for domestic supporting industry enterprises. They can learn and apply advanced technologies, modern production processes and high-quality management from FDI enterprises. This can improve labor productivity and technical efficiency of domestic supporting industry enterprises. Advanced technologies and modern manufacturing processes can help improve product quality, increase productivity and reduce production costs, helping domestic supporting industry enterprises seize market opportunities and compete with domestic and foreign competitors. However, to maximize the benefits from technology spillover from FDI enterprises, supportive policies sand solutions should be issued by the government such as training high-quality workers, facilitating technology transfer and creating a favorable business environment for enterprises.
Digital transformation has created some interesting changes in the correlation coefficients, causing the government and firm managers to have strong belief that policies to increase capital intensity and human resources are still essential in all time. However, new era makes productivity increased through applying advanced technology, reducing the number of labors used, creating an inverse correlation between TE and human resources. So, “investment” here should be understood in a broader meaning: invest in improving knowledge, ability to understand and use new technology quickly, long-life learning, and so on. When firms change the traditional management model to the new one applying new technologies such as Big Data, Internet of Things (IoT), Cloud computing, etc., which leads to changing the management methods, leadership, work processes, corporate culture, helping to reduce human resource costs. Digitalization also promotes innovations in factories, they use more modern technologies with higher automation, workers’ skills and knowledge also increases accordance with the increase of intellectual development in the digitalized society, …etc. are the reasons for being able to maintain high TE while reducing investment in cost per employee.
The Southeast region continues to hold a better performance than other regions in development of supporting industry while Central Highlands region lost its better performance in comparison with the Red River Delta Region. The explanation lies in the fact that which region receives more government investment, more accessible, and easier to implement the digital transformation process.
The variable “informal” has no statistical significance in both 2 sub-samples, while variable “competition” becomes statistically significant. Before 2020, bitter competition among companies has made negative effect on TE; however, since 2020, the Vietnamese government has carried out particular policies to help businesses in supporting industry join the global supply chain, competition becomes their motivation to improve themselves, exhibiting a positive effect on TE. Moreover, companies that rely on their relationships with the state are slow to innovate to keep up with the development of digital transformation, so their performance goes down, exhibiting through a negative relation between the variable “state” and TE.
5. Conclusions
In conclusion, this study provides valuable insights into the determinants of technical efficiency (TE) in Vietnam's supporting industry within the context of a rapidly digitalizing economy. The findings highlight the significant positive roles of human resource quality, capital intensity, and firm size in enhancing TE. Additionally, the influence of external environmental factors, such as the domestic demand spillover effect (BSpill-ratio) and FDI backward linkages (BFSpill), underscores the critical importance of fostering connections between domestic supporting industries and foreign direct investment (FDI) assembly enterprises.
Vietnam’s digital transformation since 2020 has introduced notable shifts in the dynamics of these factors, suggesting that digitalization may amplify or modify their impacts. The study also emphasizes the importance of geographical location, sectoral characteristics, competitiveness, and investment climate as additional determinants that warrant careful consideration in policy formulation. These findings provide actionable implications for both firm-level strategies and government policies, advocating for a holistic approach to enhancing TE in Vietnam’s supporting industries. By addressing these factors, Vietnam can further capitalize on the opportunities presented by its digitalized economy, strengthen its industrial competitiveness, and foster sustainable economic growth. For the Government, it is necessary to continue to improve the policy on developing supporting industries, that is, to review, update and adjust the list of priority products for development in accordance with reality such as: mechanics, automobiles, textiles, footwear, electronics. At the same time, a strategy to support the export of key industrial products needs to be issued. State departments support supporting industry firms to develop domestic and global sustainable value chain; issue tax exemption and reduction policies to attract foreign investment in the supporting industry sector. In addition to incentive policies, there must also be commitments applied to foreign investors to ensure effective investment, promote industrial transfer between FDI enterprises and domestic ones. Enterprises need to make business connections by actively participating in investment promotion programs and fairs, increase connectivity between Vietnamese enterprises, develop specialized clusters, and groups of enterprises specializing in products to create high competitiveness. Companies themselves need to innovate technology, apply many scientific and technical advances, improve product quality, increase autonomy in input materials, reduce import dependence, strengthen supply chain connectivity together, and so on.
Author Contributions
Duong Phuong Thao Pham: 60% Duc Huynh: 10% Kim-Linh Le: 15% Thao-Anh Le: 15%.
Acknowledgments
The article is the product of a Ministerial-level science and technology project sponsored by the Ministry of Education and Training “A research on Factors impact the support industrial businesses’ performance in the Digital Economy in Vietnam”. Code: B2023-KSA-08.
References
- Wirjo, A.; Denise, C. Supporting Industry Promotion Policies in APEC-Case Study on Viet Nam APEC Policy Support Unit; 2017.
- Quynh, D.; Nguyen, C.; Le Hoang, H.; Diem, X. Labour Standards Plus Project, Phase II From Industrial Policy to Economic and Social Upgrading in Vietnam; 2020.
- Aigner, D.; Lovell, C. A. K.; Schmidt, P. Formulation and Estimation of Stochastic Frontier Production Function Models. J Econom, 1977, 6, 21–37. [Google Scholar] [CrossRef]
- Meeusen, W.; van Den Broeck, J. Efficiency Estimation from Cobb-Douglas Production Functions with Composed Error. Int Econ Rev (Philadelphia), 1977, 18, 435–444. [Google Scholar] [CrossRef]
- Farrell, M. J. The Measurement of Productive Efficiency. J R Stat Soc Ser A, 1957, 120, 253–290. [Google Scholar] [CrossRef]
- Batra, G.; Tan, H. SME Technical Efficiency And Its Correlates: Cross-National Evidence and Policy Implications; 2003.
- Ismail, R.; Mohd, Z.; Syahida, N.; Abidin, Z. Determinant of Technical Efficiency of Small and Medium Enterprises in Malaysian Manufacturing Firms; 2014.
- Nguyễn, H. T. Các yếu tố tác động đến hiệu quả kỹ thuật trong các doanh nghiệp nhỏ và vừa tại Việt Nam.
- T.T To; Q.T Nguyen. Factors Affecting the Technical Efficiency of Domestic Supporting Enterprises and Recommendations in the Context of the COVID_19 Pandemic. Journal of Economics and Development.
- Vu, H. D. Technical Efficiency of FDI Firms in the Vietnamese Manufacturing Sector. Review of Economic Perspectives, 2016, 16, 205–230. [Google Scholar] [CrossRef]
- Chapelle, K.; Plane, P. Productive Efficiency in the Ivorian Manufacturing Sector: An Exploratory Study Using a Data Envelopment Analysis Approach. Developing Economies, 2005, 43, 450–471. [Google Scholar] [CrossRef]
- Lundvall, K.; Battese, G. E. Firm Size, Age and Efficiency: Evidence from Kenyan Manufacturing Firms. Journal of Development Studies, 2000, 36, 146–163. [Google Scholar] [CrossRef]
- Yang, C. H.; Chen, K. H. Are Small Firms Less Efficient? Small Business Economics, 2009, 32, 375–395. [Google Scholar] [CrossRef]
- Charoenrat, T.; Harvie, C.; Amornkitvikai, Y. Thai Manufacturing Small and Medium Sized Enterprise Technical Efficiency: Evidence from Firm-Level Industrial Census Data. J Asian Econ, 2013, 27, 42–56. [Google Scholar] [CrossRef]
- Kim, S.; Park, D.; Park, J. H. Productivity Growth in Different Plant-Size Groups in the Malaysian Manufacturing Sector. Asian Economic Journal, 2012, 26, 25–42. [Google Scholar] [CrossRef]
- Admassie. , A.; Matambalya, F. A. S. T. Technical Efficiency of Small-and Medium-Scale Enterprises: Evidence from a Survey of Enterprises in Tanzania. East Afr Soc Sci Res Rev, 2002, 18, 1–29. [Google Scholar] [CrossRef]
- Le, V.; Harvie, C. Firm performance in Vietnam: evidence from manufacturing small and medium enterprises.
- Bhandari, A. K.; Ray, S. C. Technical Efficiency in the Indian Textiles Industry: A Non-Parametric Analysis of Firm-Level Data. Bull Econ Res, 2012, 64, 109–124. [Google Scholar] [CrossRef]
- Cheruiyot, K. J. Determinants of Technical Efficiency in Kenyan Manufacturing Sector. African Development Review, 2017, 29, 44–55. [Google Scholar] [CrossRef]
- Margono, H.; Sharma, S. C. Efficiency and Productivity Analyses of Indonesian Manufacturing Industries. J Asian Econ, 2006, 17, 979–995. [Google Scholar] [CrossRef]
- Amornkitvikai, Y.; Harvie, C.; Charoenrat, T. Estimating a Technical Inefficiency Effects Model for Thai Manufacturing and Exporting Enterprises (SMEs): A Stochastic Frontier (SFA) and Data Envelopment Analysis (DEA) Approach. In Proceedings of the 2014 InSITE Conference; Informing Science Institute; 2014; pp. 363–390. [Google Scholar] [CrossRef]
- Alvarez, R.; Crespi, G. Determinants of Technical Efficiency in Small Firms. Small Business Economics, 20 May. [CrossRef]
- Harvie, C. The Asian Financial and Economic Crisis and Its Impact on Regional SMEs. In Globalisation and SMEs in East Asia; Edward Elgar Publishing, 2002; pp 10–42. [CrossRef]
- Perelman, S. R&D, TECHNOLOGICAL PROGRESS AND EFFICIENCY CHANGE IN INDUSTRIAL ACTIVITIES. Review of Income and Wealth, 1995, 41, 349–366. [Google Scholar] [CrossRef]
- Gumbau-Albert, M.; Maudos, J. The Determinants of Efficiency: The Case of the Spanish Industry. Appl Econ, 2002, 34, 1941–1948. [Google Scholar] [CrossRef]
- Kenichi Ohno. Building Supporting Industries in Vietnam. Vietnam Development Forum.
- Huyen, V. T. Supporting Industry Development and Economic Growth: The Case of the Electronics Industry, Central Institute for Economic Management, 2018.
- Trần Hồng Nhạn. Nghiên Cứu Thống Kê Các Nhân Tố Tác Động Các Nhân Tố Đến Sự Phát Triển Công Nghiệp Hỗ Trợ- Trường Hợp Tỉnh Bắc Ninh. Luận Án Tiến Sỹ.
- Charoenrat, T.; Harvie, C. The Efficiency of SMEs in Thai Manufacturing: A Stochastic Frontier Analysis. Econ Model, 2014, 43, 372–393. [Google Scholar] [CrossRef]
- Sinani, E.; Jones, D. C.; Mygind, N. Determinants of Firm-Level Technical Efficiency: Evidence Using Stochastic Frontier Approach. Corporate Ownership and Control, 2008, 5, 225–239. [Google Scholar] [CrossRef]
- Nguyen, T. M.; Le, Q. H.; Tran, T. V. H.; Nguyen, M. N. Ownership, Technology Gap and Technical Efficiency of Small and Medium Manufacturing Firms in Vietnam: A Stochastic Meta Frontier Approach. Decision Science Letters, 2019, 8, 225–232. [Google Scholar] [CrossRef]
- Newman, C.; Rand, J.; Talbot, T.; Tarp, F. Technology Transfers, Foreign Investment and Productivity Spillovers. Eur Econ Rev, 2015, 76, 168–187. [Google Scholar] [CrossRef]
- Sari, D. W.; Khalifah, N. A.; Suyanto, S. The Spillover Effects of Foreign Direct Investment on the Firms’ Productivity Performances. Journal of Productivity Analysis, 2016, 46, 199–233. [Google Scholar] [CrossRef]
- Sur, A.; Nandy, A. FDI, Technical Efficiency and Spillovers: Evidence from Indian Automobile Industry. Cogent Economics and Finance, 2018, 6. [Google Scholar] [CrossRef]
- Battese, G. E.; Coelli, T. J. A Model for Technical Inefficiency Effects in a Stochastic Frontier Production Function for Panel Data. Empir Econ, 1995, 20, 325–332. [Google Scholar] [CrossRef]
- Mattsson, P.; Månsson, J.; Greene, W. H. TFP Change and Its Components for Swedish Manufacturing Firms during the 2008–2009 Financial Crisis. Journal of Productivity Analysis, 2020, 53, 79–93. [Google Scholar] [CrossRef]
- Kozo Otsuka; Kaoru Natsuda. THE DETERMINANTS OF TOTAL FACTOR PRODUCTIVITY IN THE MALAYSIAN AUTOMOTIVE INDUSTRY: ARE GOVERNMENT POLICIES UPGRADING TECHNOLOGICAL CAPACITY? The Singapore Economic Review, 2016, 61. [Google Scholar] [CrossRef]
- Söderbom, M.; Teal, F. Size and Efficiency in African Manufacturing Firms: Evidence from Firm-Level Panel Data. J Dev Econ, 2004, 73, 369–394. [Google Scholar] [CrossRef]
- Yang, C. H.; Lin, C. H.; Ma, D. R&D, Human Capital Investment and Productivity: Firm-Level Evidence from China’s Electronics Industry. China and World Economy, 2010, 18, 72–89. [Google Scholar] [CrossRef]
- Chaffai, M.; Kinda, T.; Plane, P. Textile Manufacturing in Eight Developing Countries: Does Business Environment Matter for Firm Technical Efficiency? Journal of Development Studies, 2012, 48, 1470–1488. [Google Scholar] [CrossRef]
- Kashiwagi, K.; Iwasaki, E. Effect of Agglomeration on Technical Efficiency of Small and Medium-Sized Garment Firms in Egypt. African Development Review, 2020, 32, 14–26. [Google Scholar] [CrossRef]
- Diallo, Y.; Marchand, S.; Espagne, E. Research Paper No. 100 | Impacts of Extreme Climate Events on Technical Efficiency in Vietnamese Agriculture; 2019.
- De Jorge-Moreno, J.; Carrasco, O. R. Technical Efficiency and Its Determinants Factors in Spanish Textiles Industry (2002-2009). Journal of Economic Studies, 2015, 42, 346–357. [Google Scholar] [CrossRef]
Figure 1.
The stochastic production frontier. Source: Luca & Claudi (2014).
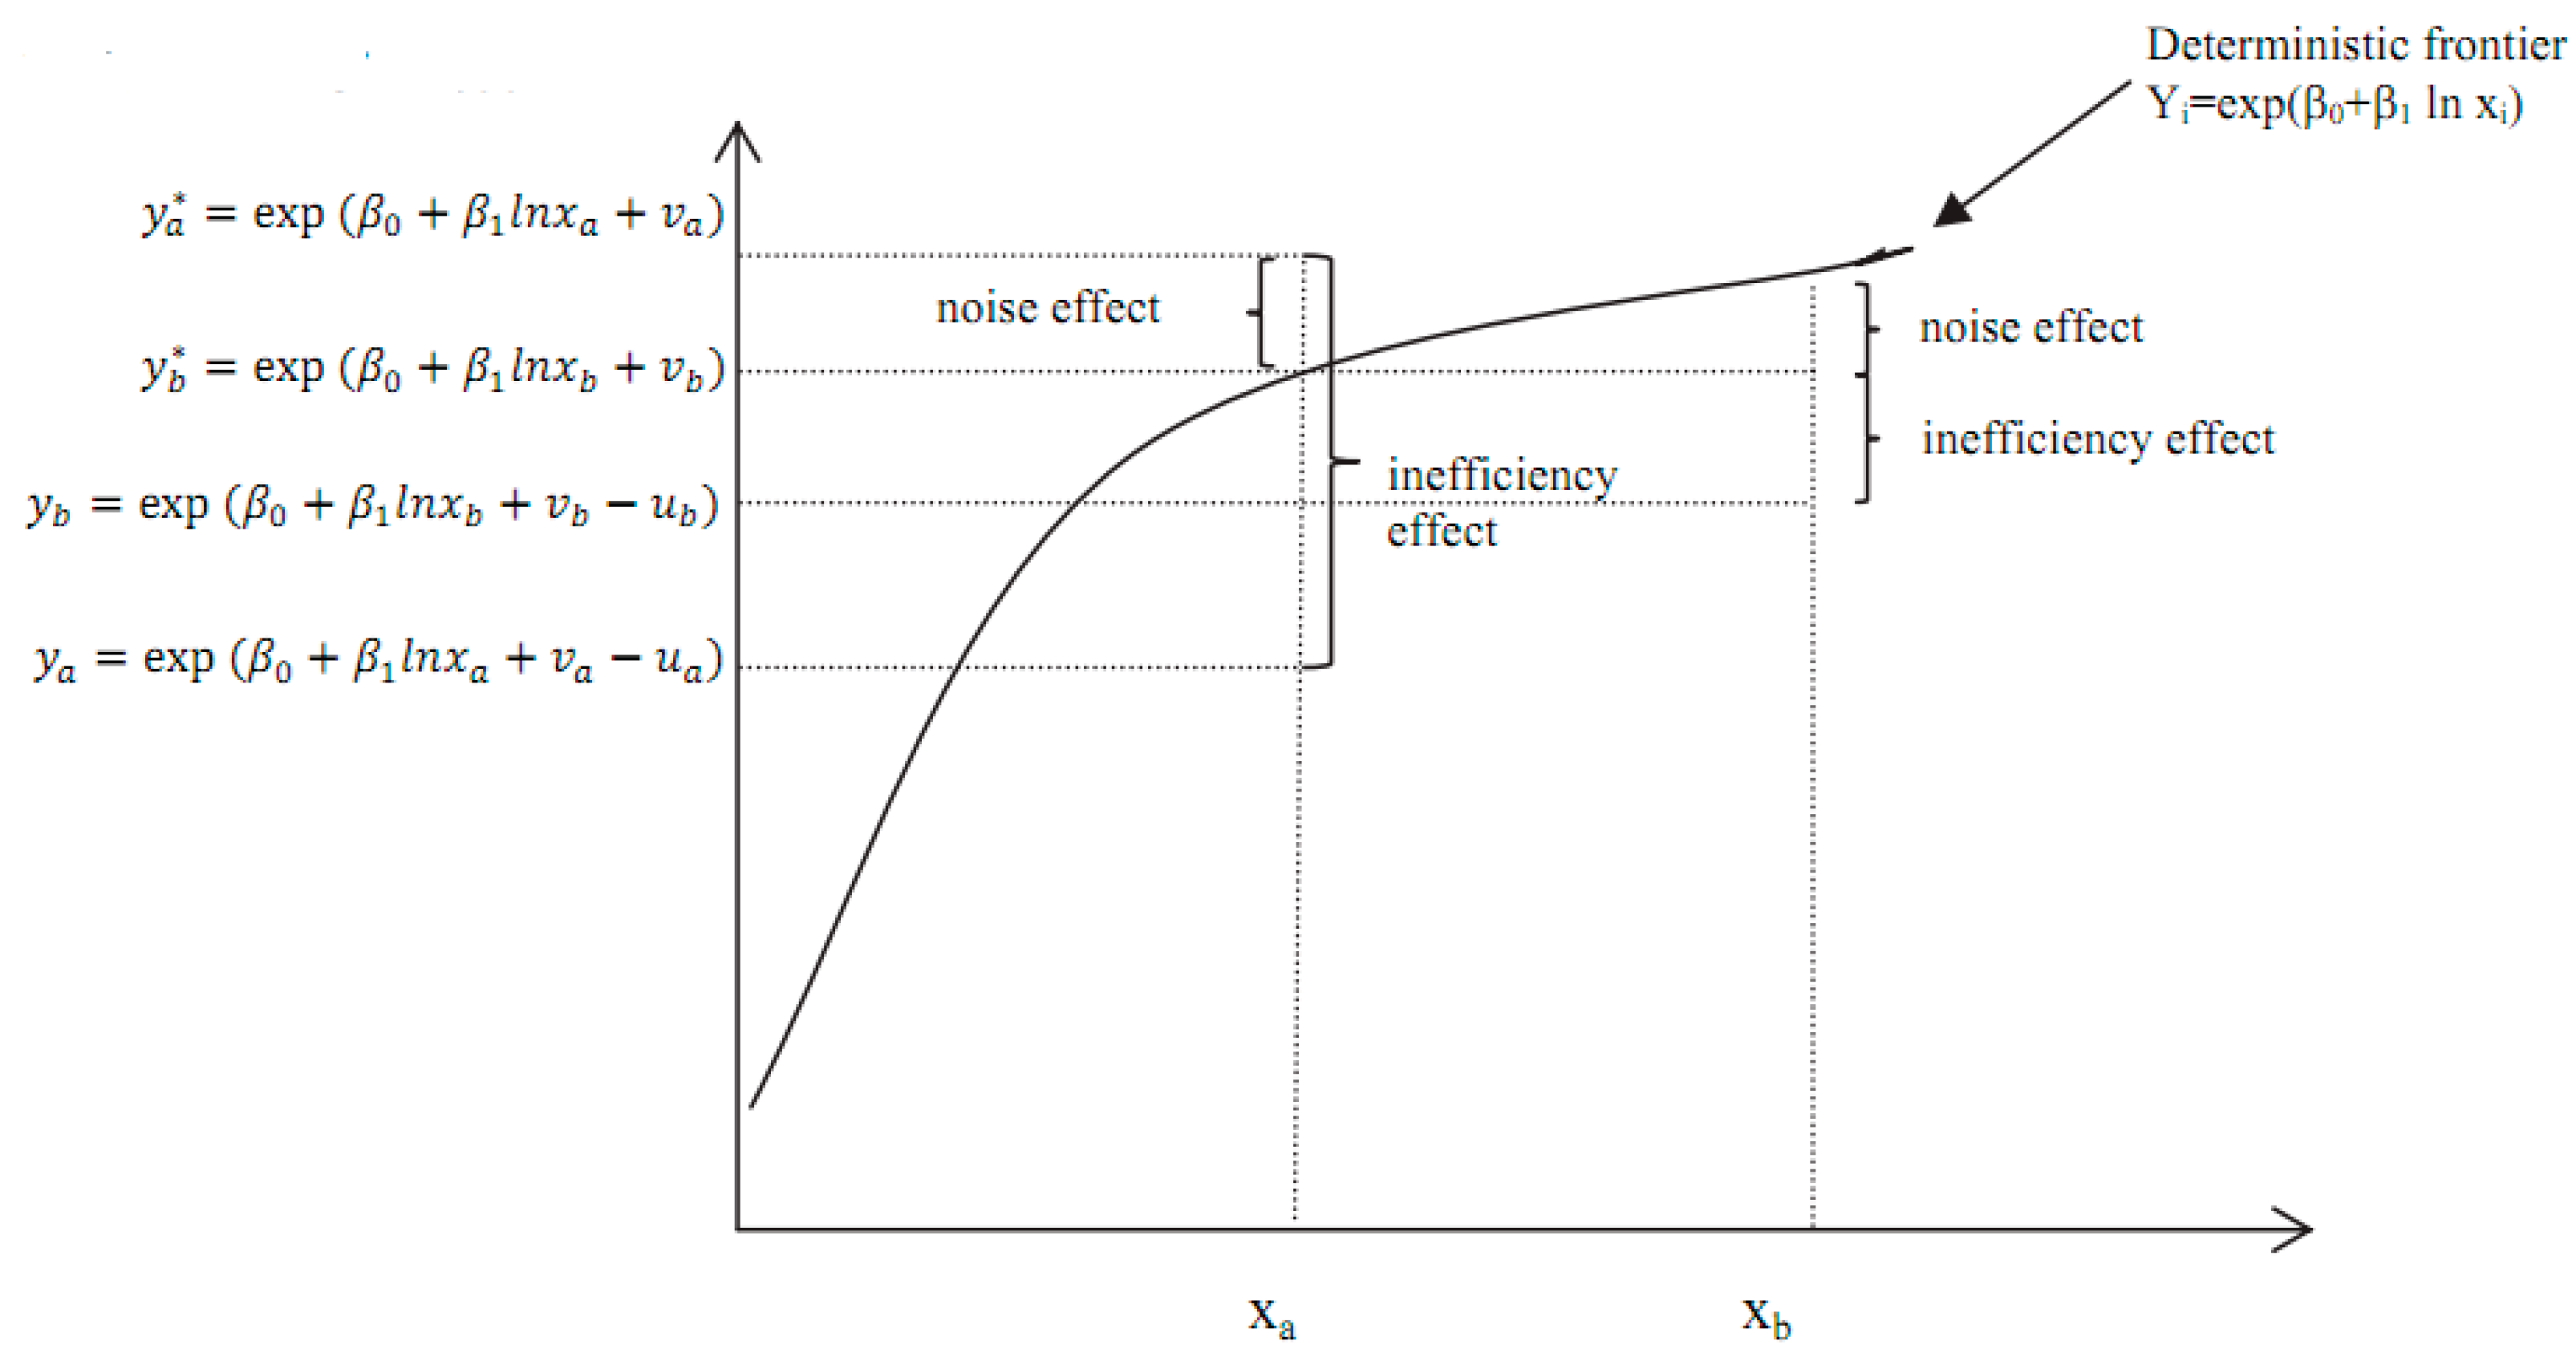

Table 1.
Determinants on technical efficiency of firms.
| Variables | Content |
|---|---|
| Endogenous factors in a firm: | |
| lnSize | Firm size, measured by natural logarithm of number of labors |
| lnHum | Human resources, measured by natural logarithm of average cost per employee of a firm |
| lnDC | Capital intensity, measured by natural logarithm of average asset value per employee of a firm |
| State | Dummy variable, = 1 in case the firm has relationship with the government, officials..., and vice versa |
| Region | Dummy variable, takes values from 1 to 6 (1. Red River Delta region; 2. Northern Midlands and Mountains region; 3. North Central Region and Central Coast; 4. Central Highlands region; 5. Southeast region; 6. Mekong Delta region of Vietnam) |
| Supind | Dummy variable, takes values from 1 to 6 1. Textile industry; 2. Leather and footwear industry; 3. Electronics industry; 4. Automobile manufacturing and assembly industry; 5. Mechanical manufacturing industry; 6. High-tech supporting industry |
| Exogenousenvironmental factors: | |
| BSpill_ratio | Domestic demand of industry i, which shows the impact of all upstream businesses using inputs that are products of industry j; measured by: |
| HFSpill | Impact of FDI enterprises in the same industry, measured by: is foreign capital ratio of firm i, in year t; j is one of 6 sub-sectors |
| BFSpill | FDI backward effect, measured by: is the spillover effect of FDI enterprises on supporting industry sub-sector j. Upstream FDI enterprises use inputs from supporting industry firms in industry j. is the coefficient indicating when industry k increases by 1 unit of product, industry l needs to increase by how many units of product; this coefficient is calculated from the Vietnam input-output table. |
| Competition | To reflect the institutional environment, we use index of "fair competition", extracted from the Provincial Competitiveness Index (PCI). |
| Informal | This variable is one more index presenting for the institutional environment, which reflects the level of corruption, extracted from the Provincial Competitiveness Index (PCI). |
Source: Authors’.
Table 2.
Estimation results of technical efficiency of Vietnam support industrial firms.
| Variables | Cobb-Douglas | Translog |
|---|---|---|
| Log (V) | 0.9800*** | -0.0236*** |
| (0.0012) | (0.0075) | |
| Log (LD) | 0.0166*** | 1.5359*** |
| (0.0048) | (0.0168) | |
| T | -0.1208*** | |
| (0.0145) | ||
| Log (V)^2 | 0.0119*** | |
| (0.0004) | ||
| Log (LD)^2 | -0.0271*** | |
| (0.0019) | ||
| t^2 | 0.0227*** | |
| (0.0017) | ||
| Log (V) x Log (LD) | -0.0180*** | |
| (0.0012) | ||
| t x Log(V) | 0.0715*** | |
| (0.0014) | ||
| t x Log (LD) | -0.1282*** | |
| (0.0025) | ||
| C | 1.4785*** | 5.0913*** |
| (0.0732) | (0.0530) | |
| LR Test | ||
| Function | Log Likelihood | P-value |
| Cobb-Douglas | -136800 | |
| Translog | -123341 | 2.2e-16*** |
Note: *, ** and *** are statistically significant at the 10%, 5% and 1% levels, respectively. Values in parentheses (...) are standard errors.
Table 3.
Descriptive statistics of full sample.
| Variables | Min | Max | Mean | Std. Deviation |
|---|---|---|---|---|
| lnSL | -2.3026 | 32.0279 | 11.4886 | 5.9875 |
| lnV | -2.3026 | 30.3973 | 10.2536 | 5.8733 |
| lnLD | -0.6931 | 10.0420 | 2.8725 | 1.5997 |
| lnSize | 0 | 10.2846 | 2.8868 | 1.6110 |
| lnHum | -2.9957 | 22.2640 | 6.6776 | 5.4313 |
| lnDC | -0.2154 | 27.1610 | 9.2007 | 5.5567 |
| FC | 0 | 670,865 | 74.4612 | 3,546.22 |
| Bspill_ratio | 0.0526 | 0.4358 | 0.1959 | 0.0572 |
| HFSpill | 0 | 44,776.08 | 889.0047 | 4,153.076 |
| BFSpill | 0 | 4,118,457.2 | 444,375.3 | 564,024.1 |
| informal | 2.8100 | 8.39 | 5.6501 | 1.0648 |
| competition | 3.1200 | 8.81 | 5.1700 | 1.0977 |
Source: Authors’. Notes: obs = 59,370, lnSL: Logarithm of firm output; lnV: Logarithm of firm’s total assets; lnLD: Logarithm of firm’s number of employees.
Table 4.
Correlation matrix of variables.
| lnSize | lnHum | lnDC | FC | State | BSpill_ratio | Informal | Competition | HFSpill | BFSpill | Supind | Region | TE | |
|---|---|---|---|---|---|---|---|---|---|---|---|---|---|
| lnSize | 1 | ||||||||||||
| lnHum | 0.0323** | 1 | |||||||||||
| lnDC | -0.0215** | 0.9803** | 1 | ||||||||||
| FC | 0.0502** | -0.0049 | -0.0017 | 1 | |||||||||
| State | -0.2208** | 0.2788** | 0.2802** | -0.0301** | 1 | ||||||||
| BSpill_ratio | -0.2436** | -0.0434** | -0.03** | -0.0152** | 0.0749** | 1 | |||||||
| Informal | 0.0509** | 0.5828** | 0.5767** | -0.0046 | 0.2746** | -0.0207** | 1 | ||||||
| Competition | 0.0552** | 0.4058** | 0.4031** | -0.0063 | 0.246** | -0.0107** | 0.8079** | 1 | |||||
| HFSpill | 0.0283** | -0.0948** | -0.094 | 0.0398** | -0.0637** | -0.2588** | -0.1468** | -0.1407** | 1 | ||||
| BFSpill | -0.0944** | -0.3435** | -0.3438** | 0.0148** | -0.1316** | 0.2735** | -0.3936** | -0.3698** | 0.2081** | 1 | |||
| Supind | -0.2219** | -0.059** | -0.0512** | -0.0123 | 0.0175** | 0.0115** | -0.0729** | -0.0768** | 0.0627** | 0.1956** | 1 | ||
| Region | -0.013** | -0.0048 | -0.0134** | 0.0049** | 0.0096* | 0.0743** | 0.069** | 0.139** | -0.0064 | 0.0144** | -0.1248** | 1 | |
| TE | 0.037** | 0.0725** | 0.0724** | -0.0098* | -0.0187** | 0.0075 | -0.053** | -0.0741** | 0.0129** | 0.0713** | 0.0364** | 0.0294** | 1 |
Source: Authors’.
Table 5.
Regression of full sample (2014-2022).
| VARIABLES | Pooled OLS | FEM | REM | ||||
|---|---|---|---|---|---|---|---|
| Coefficient | p-Value | Coefficient | p-Value | Coefficient | p-Value | ||
| lnSize | 0.0042 | 0.000 | 0.0050 | 0.000 | 0.0022 | 0.000 | |
| lnHum | 0.0006 | 0.156 | 0.0292 | 0.000 | 0.0025 | 0.000 | |
| lnDC | 0.0026 | 0.000 | 0.0096 | 0.000 | 0.0022 | 0.000 | |
| Bspill_ratio | 2.00E-01 | 0.024 | 5.97E-01 | 0.000 | 3.50E-02 | 0.653 | |
| HFSpill | 0.0000 | 0.056 | 0.0000 | 0.050 | 0.0000 | 0.006 | |
| BFSpill | 1.61E-08 | 0.000 | 7.93E-09 | 0.000 | 1.70E-08 | 0.000 | |
| informal | -5.01E-03 | 0.000 | -2.68E-03 | 0.006 | -5.48E-03 | 0.000 | |
| competition | -0.0072 | 0.000 | -0.0008 | 0.301 | -0.0081 | 0.000 | |
| State | 1 | -0.0031 | 0.007 | 0.0073 | 0.000 | -0.0038 | 0.000 |
| Region | 2 | -0.0140 | 0.000 | -0.0075 | 0.000 | -0.0110 | 0.000 |
| 3 | -0.0198 | 0.000 | -0.0109 | 0.000 | -0.0153 | 0.000 | |
| 4 | -0.0008 | 0.859 | 0.0015 | 0.734 | 0.0016 | 0.684 | |
| 5 | 0.0148 | 0.000 | 0.0046 | 0.000 | 0.0141 | 0.000 | |
| 6 | -0.0011 | 0.593 | 0.0012 | 0.588 | 0.0031 | 0.105 | |
| Supind | 2 | -0.0612 | 0.002 | -0.1453 | 0.000 | -0.0252 | 0.148 |
| 3 | 0.0270 | 0.007 | 0.0704 | 0.000 | 0.0088 | 0.317 | |
| 4 | 0.0325 | 0.005 | 0.0799 | 0.000 | 0.0110 | 0.276 | |
| 5 | 0.0144 | 0.000 | 0.0107 | 0.000 | 0.0124 | 0.000 | |
| 6 | 0.0478 | 0.001 | 0.1048 | 0.000 | 0.0209 | 0.089 | |
| cons | 0.4309 | 0.000 | 0.0390 | 0.061 | 0.4857 | 0.000 | |
| Prob>F | 0.000 | 0.000 | 0.000 | ||||
| R-squared | 0.0380 | 0.0564 | 0.0187 | ||||
Source: Authors’.
Table 6.
Test to choose suitable model.
|
Hausman test REM FEM Test of H0: Difference in coefficients not systematic b = Consistent under H0 and Ha; obtained from xtreg. B = Inconsistent under Ha, efficient under H0; obtained from xtreg. chi2(17) = (b-B)'[(V_b-V_B)^(-1)](b-B) = 11376.42 Prob > chi2 = 0.0000 (V_b-V_B is not positive definite) |
Prob>chi2 = 0.00 < α = 0.05 so reject H0 and conclude that the model chosen in the study is the FEM model. |
|
Breusch and Pagan Lagrange Multiplier Test for OLS REM Breusch and Pagan Lagrangian multiplier test for random effects te[t,t] = Xb + u[t] + e[t,t] Estimated results: | Var SD = sqrt(Var) ---------+----------------------------- te | .0132804 .1152405 e | .0117014 .1081731 u | 0 0 Test: Var(u) = 0 chibar2(01) = 0.00 Prob > chibar2 = 1.0000 |
Prob>chibar2 = 1.0000 > Significance level 5%, α = 0.05 so accept H0 and conclude the selected model is OLS |
|
F test for OLS FEM F test that all u_i=0: F(8, 59342) = 684.38 Prob > F = 0.0000 |
Prob>F = 0.0000 < 5% significance level, α = 0.05 so reject H0 and conclude that the selected model is FEM |
Source: Authors’.
Table 7.
System - GMM model results for the full sample (2014-2022).
| 2014-2022 | |
|---|---|
| TE | |
| L.TE | 0.436*** |
| (0.058) | |
| lnSize | 0.007*** |
| (0.002) | |
| lnHum | -0.013*** |
| (0.002) | |
| lnDC | 0.007*** |
| (0.002) | |
| BSpill_ratio | -0.494*** |
| (0.071) | |
| HFSpill | -0.000*** |
| (0.000) | |
| BFSpill | 0.000*** |
| (0.000) | |
| informal | -0.012*** |
| (0.004) | |
| competition | 0.029*** |
| (0.004) | |
| Region | 0.007*** |
| (0.001) | |
| State | -0.003 |
| (0.006) | |
| Supind | 0.014*** |
| (0.002) | |
| Constant | 0.144*** |
| (0.034) | |
| Observations | 3905 |
Source: Authors’.
Table 8.
Regression TE with sub-sample 1 (2014-2019).
| VARIABLES | Pooled OLS | FEM | REM | ||||
|---|---|---|---|---|---|---|---|
| Coefficient | p-Value | Coefficient | p-Value | Coefficient | p-Value | ||
| lnSize | 0.0048 | 0.000 | 0.0006 | 0.004 | 0.0046 | 0.000 | |
| lnHum | 0.0432 | 0.000 | 0.0432 | 0.000 | 0.0444 | 0.000 | |
| lnDC | 0.0345 | 0.000 | 0.0345 | 0.000 | 0.0351 | 0.000 | |
| Bspill_ratio | -1.41E+00 | 0.000 | -1.41E+00 | 0.000 | -1.60E-01 | 0.601 | |
| HFSpill | 0.0000 | 0.746 | 0.0000 | 0.746 | 0.0000 | 0.287 | |
| BFSpill | -1.15E-08 | 0.000 | -1.15E-08 | 0.000 | 4.12E-09 | 0.228 | |
| informal | 2.36E-03 | 0.135 | 2.36E-03 | 0.135 | -2.26E-03 | 0.165 | |
| competition | -0.0042 | 0.003 | -0.0042 | 0.003 | -0.0023 | 0.110 | |
| State | 1 | 0.0128 | 0.000 | 0.0128 | 0.000 | 0.0132 | 0.000 |
| Region | 2 | -0.0076 | 0.041 | -0.0076 | 0.041 | -0.0067 | 0.071 |
| 3 | -0.0043 | 0.130 | -0.0043 | 0.130 | -0.0018 | 0.516 | |
| 4 | 0.0151 | 0.035 | 0.0151 | 0.035 | 0.0121 | 0.090 | |
| 5 | 0.0073 | 0.000 | 0.0073 | 0.000 | 0.0064 | 0.000 | |
| 6 | 0.0109 | 0.005 | 0.0109 | 0.005 | 0.0154 | 0.000 | |
| Supind | 2 | 0.2443 | 0.000 | 0.2443 | 0.000 | -0.0050 | 0.938 |
| 3 | -0.1863 | 0.000 | -0.1863 | 0.000 | -0.0285 | 0.452 | |
| 4 | -0.1815 | 0.000 | -0.1815 | 0.000 | -0.0146 | 0.717 | |
| 5 | 0.0037 | 0.187 | 0.0037 | 0.187 | 0.0047 | 0.098 | |
| 6 | -0.2267 | 0.000 | -0.2267 | 0.000 | -0.0160 | 0.758 | |
| cons | 0.3340 | 0.000 | 0.3340 | 0.000 | 0.0460 | 0.521 | |
| Prob>F | 0.000 | 0.000 | 0.000 | ||||
| R-squared | 0.1027 | 0.1056 | 0.1047 | ||||
Source: Authors’.
Table 9.
Regression TE with sub-sample 2 (2020-2022).
| VARIABLES | Pooled OLS | FEM | REM | ||||
|---|---|---|---|---|---|---|---|
| Coefficient | p-Value | Coefficient | p-Value | Coefficient | p-Value | ||
| lnSize | 0.0163 | 0.000 | 0.0163 | 0.000 | 0.0081 | 0.000 | |
| lnHum | -0.0334 | 0.000 | -0.0334 | 0.000 | 0.0421 | 0.000 | |
| lnDC | 0.0350 | 0.000 | 0.0350 | 0.000 | 0.0562 | 0.000 | |
| Bspill_ratio | -4.28E-01 | 0.030 | -4.28E-01 | 0.030 | -3.30E-01 | 0.078 | |
| HFSpill | -0.0002 | 0.000 | -0.0002 | 0.000 | 0.0002 | 0.100 | |
| BFSpill | -4.11E-08 | 0.416 | -4.11E-08 | 0.416 | 1.76E-08 | 0.836 | |
| informal | 1.29E-03 | 0.594 | 1.29E-03 | 0.594 | -1.89E-05 | 0.993 | |
| competition | 0.0060 | 0.000 | 0.0060 | 0.000 | -0.0004 | 0.824 | |
| State | 1 | -0.0174 | 0.000 | -0.0174 | 0.000 | -0.0207 | 0.000 |
| Region | 2 | -0.0346 | 0.000 | -0.0346 | 0.000 | -0.0193 | 0.000 |
| 3 | -0.0624 | 0.000 | -0.0624 | 0.000 | -0.0351 | 0.000 | |
| 4 | -0.0174 | 0.101 | -0.0174 | 0.101 | 0.0014 | 0.884 | |
| 5 | 0.0153 | 0.000 | 0.0153 | 0.000 | 0.0010 | 0.658 | |
| 6 | -0.0317 | 0.000 | -0.0317 | 0.000 | -0.0104 | 0.020 | |
| Supind | 2 | 0.0383 | 0.396 | 0.0383 | 0.395 | 0.0162 | 0.704 |
| 3 | -0.0448 | 0.024 | -0.0448 | 0.024 | -0.0385 | 0.037 | |
| 4 | -0.0540 | 0.032 | -0.0540 | 0.032 | -0.0494 | 0.038 | |
| 5 | 0.0153 | 0.000 | 0.0153 | 0.000 | 0.0161 | 0.000 | |
| 6 | -0.0356 | 0.197 | -0.0356 | 0.197 | -0.0236 | 0.367 | |
| cons | 0.3455 | 0.000 | 0.3455 | 0.000 | -0.7811 | 0.000 | |
| Prob>F | 0.000 | 0.000 | 0.000 | ||||
| R-squared | 0.0999 | 0.2303 | 0.1009 | ||||
Source: Authors’.
Table 10.
System - GMM model results for sub-samples.
| 2014-2019 | 2020-2022 | |
|---|---|---|
| TE | TE | |
| L.TE | 0.261*** | 0.592** |
| (0.055) | (0.274) | |
| log_size | 0.004* | 0.024*** |
| (0.002) | (0.007) | |
| log_hum | 0.032*** | 0.010 |
| (0.005) | (0.015) | |
| log_dc | 0.015*** | -0.029** |
| (0.002) | (0.012) | |
| BSpill_ratio | -0.198*** | -0.020 |
| (0.077) | (0.380) | |
| HFSpill | -0.000 | 0.002* |
| (0.000) | (0.001) | |
| BFSpill | 0.000*** | 0.000*** |
| (0.000) | (0.000) | |
| informal | -0.002 | 0.021 |
| (0.005) | (0.044) | |
| competition | 0.038*** | -0.018 |
| (0.005) | (0.028) | |
| Region | 0.003* | 0.000 |
| (0.002) | (0.011) | |
| State | 0.004 | 0.002 |
| (0.006) | (0.053) | |
| supind | 0.015*** | 0.003 |
| (0.002) | (0.016) | |
| Constant | -0.148*** | 0.198 |
| (0.052) | (0.351) | |
| Observations | 3648 | 257 |
Source: Authors’.
Disclaimer/Publisher’s Note: The statements, opinions and data contained in all publications are solely those of the individual author(s) and contributor(s) and not of MDPI and/or the editor(s). MDPI and/or the editor(s) disclaim responsibility for any injury to people or property resulting from any ideas, methods, instructions or products referred to in the content. |
© 2025 by the authors. Licensee MDPI, Basel, Switzerland. This article is an open access article distributed under the terms and conditions of the Creative Commons Attribution (CC BY) license (http://creativecommons.org/licenses/by/4.0/).
Copyright: This open access article is published under a Creative Commons CC BY 4.0 license, which permit the free download, distribution, and reuse, provided that the author and preprint are cited in any reuse.


