Submitted:
22 May 2025
Posted:
23 May 2025
You are already at the latest version
Abstract
In arid regions with low precipitation like most of the Cape Verde islands, irrigation plays a crucial role in increasing crop yields and maintaining agricultural production. This translates into more food availability, reducing hunger and poverty. However, irrigation requires significant invest-ment, so it is vital to ensure efficient water use and reduce irrigation losses and operating costs. The aim of this study is to evaluate irrigated agriculture in Cape Verde and its relationship with water scarcity, through the calculation of indicators and the analysis of statistical data. The study was initiated collecting crop production data from the Ministry of Agriculture and Environment. Climatic data provided by the National Institute of Meteorology and Geophysics of Cape Verde (INMG) and by the Wapor (Water Productivity Monitoring through Open Access Remotely Sensed Data) portal from FAO. The island of Sal presented the lowest aridity index value (0.07), while the Cachaço area on the island of São Nicolau presented the highest (0.41). Currently, sugarcane is the most important crop in irrigated agriculture, covering an area of more than 3,000 hectares of the approximately 5,000 hectares of irrigated land in Cape Verde, with the average area of irrigated plots being approximately 0.5 hectares.
Keywords:
irrigation
; agriculture
; water management
; irrigation systems
; Cape Verde
1. Introduction
As the world's population continues to grow, the demand for food also increases. Agricultural production can be increased by expanding cultivated areas and/or increasing unit productivity [1]. One strategy to boost crop productivity is irrigation, which not only increases production but also enables year-round farming and regularizes crops yield, helping to reduce poverty and hunger [2]. However, these decisions require significant investments that must be profitable. Therefore, it is crucial to ensure sustainable management of available water and minimize various losses that may occur during irrigation operations [3]. In Cape Verde, irrigated agriculture plays an extremely important role in securing agricultural production and food sovereignty, as demonstrated by Silva [4] and Monteiro [5]. The problem of limited water resources in Cape Verde has long been a major challenge for the country) [6, 7]. Cape Verde has been affected by severe and prolonged droughts over the last few decades [8]. Additionally, the small area available for agriculture and topographical features such as mountain peaks and steep slopes limit the cultivation area in this archipelago [9]. Although successive governments have made significant investments in water mobilization [10,11], further efforts are needed to improve water management in various sectors, particularly agriculture. This problem is exacerbated by climate change, as extreme precipitation and temperature phenomena are increasing in intensity and frequency [12]. In regions with water scarcity, due to the low availability of this resource, it is crucial to ensure water use efficiency, increasing water productivity and minimizing water losses or inappropriate use. The efficiency of an irrigation system can be defined as the ratio between the amount of water supplied by a particular subsystem and the amount of water withdrawn by that subsystem [13,14]. Water productivity, can be defined as the ratio between plant biomass or grain production and the amount of water used by the plant, including rainfall and irrigation water [15,16]. According to Pereira et al. [17], water scarcity is not only limited to arid and drought-prone regions but can also affect areas with abundant rainfall. This issue concerns both the availability and quality of water resources, as degraded water sources may no longer meet more stringent requirements. In regions with water scarcity, the development of measures to reduce losses is essential, but this requires the losses to be identified and quantified. In this study, we adopt the definition of water loss from [3], in which water `losses' is simply as water that is not being used by the intended crops as evapotranspiration. This definition ignores alternative uses of irrigation water, such as moistening the soil to support tillage for planting or harvesting, cooling, frost protection, or fertilizer application. Nevertheless, this definition fits the Cape Verdean context, since practically all these water applications are not relevant, given the agricultural practices adopted.
The aim of this study is to diagnose the current status of irrigation sector in Cape Verde, including the water demand for agriculture examining its production and irrigation systems characteristics, the availability of water resources and climate limitations induced by aridity. The specific objectives are to calculate indicators an perform data analysis exploring the various data sources available, to support the development of measures to improve the water use in this sector in a context of water scarcity
2. Material and Methods
2.1. Studied Area
The Cape Verde Archipelago is located on the east coast of the Mid-Atlantic Ocean, between latitudes 14°48' N and 17°12' N and the Longitude 22º44' W and 25º22' W, about 500 kilometers from the westernmost point of the African continent, the Senegalese coast [18]. As Semedo [18], notes, Cape Verde lies within the vast Sahel region, which stretches from the Atlantic coast to the Red Sea. Cape Verde is an African country consisting of ten volcanic islands of different sizes and distribution as shown in Figure 1, occupying a total area of 4,033 km² and with an exclusive economic zone (EEZ) of approximately 700 km² [19]. The islands are divided into three groups: (i) the northern group Santo Antão, São Vicente, Santa Luzia (is not inhabited) and São Nicolau; (ii) the southern group Santiago, Fogo and Brava; and (iii) the eastern group Sal, Boavista and Maio.
2.2 Data Collection
This study is based on four complementary sources: (1) agricultural data available in the country, from the Ministry of Agriculture and Environment and the National Institute of Statistics (INE); (2) meteorological data from the National Institute of Meteorology and Geophysics; (3) grey literature, mainly documents related to the agricultural sector in Cape Verde; (4) scientific literature on the subject and (5) data taken from FAOSTAT, WAPOR and AQUASTAT on the six main agricultural products in terms of production (tons) and harvested area (ha).
The first step of this work consisted in compiling the scattered information on irrigated agricultural areas at the level of each island and at the national level, where the evolution of the irrigated areas, the main irrigated crops and the production and productivity of these crops are to be studied, using data from the Ministry of Agriculture and Environment, the National Institute of Statistics and the FAO. The second step was to assess the evolution of precipitation over the years and how this relates to the production and productivity of the main crops. The third step was to characterise irrigated agriculture in Cape Verde and what measures have been taken to mitigate water scarcity and the impact of perceived climate change.
2.3. Climate data
The Cape Verde islands have a semi-arid tropical climate, classified as BWh according to the Köppen-Geiger climate classification [20], characterized by high temperatures and low rainfall throughout the year. Even in the coldest months January and February, minimum temperatures range between 19°C and 25°C. For this study, the meteorological stations used for climatic characterization are presented in Table 1.
Aridity Index
The Aridity index, which compares precipitation to potential evapotranspiration, is a useful measure for climate classification. For this study, the index was calculated according to the methodology of the United Nations Environment Program (UNEP, 1992) as AIu = P/PET, where AIu is Aridity Index, P is the average annual precipitation and PET is the potential evapotranspiration. To ensure consistency, both P and PET must be expressed in the same units, such as millimeters. See Table 2 for Aridity index classification. For this research, was used the Hargreaves-Samani equation 1922 to calculate evapotranspiration. The equation can be represented as follows [22].
where ETo is the reference evapotranspiration (mm/day), Ra the radiation at the top of the atmosphere (mm/day), T max the maximum temperature (ᵒC) and T min the minimum temperature (ᵒC). Krs is the radiation adjustment coefficient, which varies from 0.19 in coastal areas to 0.16 in inland areas. Typically, the equation uses a Krs value of 0.17 (Allen et al., 1998). This equation was calibrated to the Cape Verde conditions against the FAO Penman-Montheith equation by [23], proposing the followinglinear regression equation: y = 1.4615x – 0.7662, with R2 = 0.99, where y is the corrected ETo value and x is the result obtained using the Hargreaves Samani method (Krs = 0.17).
2.4. Water Use
To analyse water use in the agricultural sector, six indicators were used to provide a comprehensive assessment of water use efficiency and pressure on water resources. The selected indicators include:
- (i)
- Water withdrawal for agriculture as a percentage of total renewable water resources (%);
- (ii)
- Water use efficiency in irrigated agriculture, which is calculated as the agricultural value added per agricultural water use (US$/m³);
- (iii)
- =Contribution of the agricultural sector to water stress, which is calculated as the proportion of agricultural sectoral withdrawals over total freshwater withdrawals (%);
- (iv)
- Percentage of the area equipped for irrigation using groundwater (%);
- (v)
- Percentage of the area equipped for irrigation using surface water (%);
- (vi)
- Water productivity per agricultural crop (kg/m³), calculated using the following equation WP = Production obtained (kg) / water supplied to plants (m³).
The first five indicators were obtained from AQUASTAT — FAO’s Global Information System on Water and Agriculture
2.5. Crop Evolution and Production
To analyse the evolution of crop area and production, data on area, production and productivity were obtained from both national statistics and FAOSTAT. The processed and analysed data were then used to identify trends and patterns over time. The results obtained are presented in graphs that allow the evolution of the different crops over time to be visualised.
3. Results & Discussion
3.1. Climate Characterization
As shown in Figure 2, there is around 5 °C differences in average temperature between Cachaço (Sao Nicolau) and Praia (Santiago). The differences in temperature throughout the year have the same trend for all the islands
Precipitation varies greatly both spatially and temporally. The annual average rainfall variation on the primarily agricultural islands of Cape Verde from 1993 to 2022 is presented in Figure 3. It’s clearthat rainfall varies significantly annually, particularly has been observed low rainfall values on the island of São Nicolau over the last six years of the period considered (2017-2022).
The Aridity index and its classification for several locations on the main agricultural islands is shown in Table 3. It is obvious that there are differences in the index between different places. Cachaço locality in Sao Nicolau Island is characterized by an aridity index of 0.41. Among the analyzed locations, Sal Island had the lowest drought index of 0.07. As expected, reduced precipitation correlates with a reduced aridity index, indicating a drier climate and lower biomass production (see Figure 4).
The relation between the aridity index and biomass production is noteworthy, when aridity indices AIu (Table 2) are compared to Gross Biomass Water Productivity (Fiure. 4). It is important to note that gross biomass water productivity (seasonal) measures total biomass production compared to total water consumption (actual evapotranspiration) during the vegetation growth cycle. (FAO, 2023FAO's Wapor database provides information on the spatial distribution of gross biomass water productivity in the Cape Verde Islands and identifies the areas where biomass growth relative to water use is greatest. The islands of Santiago, Santo Antão and São Nicolau have the highest biomass production in Cape Verde, indicated by values more than 3 kg/m³, as shown in Figure 4 which shows the gross biomass water productivity (seasonal) for the Cape Verde Islands in 2019. It is worth noting that this year was one of the driest years (Figure 3) in the Cape Verde archipelago.
The annual values of actual evapotranspiration and interception (ETIa), expressed in millimeters per year (mm/year), estimated for the main islands of Cape Verde between 2018 and 2024 are shown in Table 4 (Wapor, 2024). The analysis of the actual values of evapotranspiration and interception (ETIa) between 2018 and 2024 on the Cape Verde Islands shows a general upward trend, with significant differences between the islands. The island of Brava has the highest value throughout the period, reaching 498.75 mm/year in 2023. On the other hand, Fogo, Maio and Santo Antão recorded the lowest values, with minimum values of 95.21 mm/year (Fogo, 2021), 72.31 mm/year (Maio, 2019) and 79.97 mm/year (Santo Antão, 2019). The island of Santiago shows a significant increase, from 232.48 mm/year in 2018 to 411.03 mm/year in 2024. Islands with a more arid climate, such as Sal and Boavista, maintained lower and relatively stable values, varying between 136.45 mm/year and 143.95 mm/year for Boavista and between 136.51 mm /year and 146.38 mm/year for Sal.
3.2. Characterization of Irrigated Agriculture in Cape Verde
The agricultural area in Cape Verde in 2017 was 36,456 hectares, of which 87% are rainfed and 10.7% are irrigated. The remaining 2.3% were used for mixed agricultural practices with rainfed and irrigated crops (see Table 5). Agricultural areas in 2015according to the RGA (General Agricultural Census) account for around 9% of the country's area, a slight decrease of only 1% compared to the 2004 RGA (General Agricultural Census) data. Of the total area of the agricultural plots, 82.5% was cultivated, and the remaining areas was used for fallow land, permanent pastures, rotating pastures, forest land and other uses [26]. Comparing the values in table 5 and the Gross Biomass Water Productivity (Figure 4), it is easy to see that the islands with the largest irrigated areas have higher Gross Biomass Water Productivity values. For example, Santiago and Santo Antão, the islands with the largest areas dedicated to irrigated agriculture (1747 and 1268 ha, respectively), have Biomass Water Productivity values from 1 kg/m3 upwards.
Irrigated agriculture is practiced on a smaller scale in Cape Verde compared to rainfed agriculture. It can be seen a 22.2% increase of irrigated area between 2004 and 2015 attributed to significant investments in water mobilization and the creation of irrigated perimeters [26]. In Cabo Verde, the potential irrigable land area, located mainly on the islands of Santo Antão and Santiago, is between 2,500 and 3,000 ha [11] Nevertheless, the same authors suggests that this area could expand to up to 5,000 hectares, according to the [27] study. The islands of Santiago and Santo Antão account for about 90% of the irrigated land.
The irrigated plots are located at the bottom of the valleys and in the lower part of the slopes and on small plateaus [28]. According to 2015 Census of Agriculture data, the total area of irrigated land at the national level was 3,913 hectares in 2015. About 83% of this is cultivated, which corresponds to 3,248 hectares (see Figure 5). Considering these data and the previously forecasts, there is still a margin for an increase in the irrigated area by 1000 hectares. However, this increase will largely depend on water availability. It should be considered that the cultivated area may change over the years, depending on the fluctuations in water availability.
The two municipalities with the largest agricultural area Ribeira Grande and Santa Cruz are located in the islands of Santo Antão and Santiago, respectively. Ribeira Grande has an agricultural area of about 562 hectares, while Santa Cruz has about 516 hectares, as shown in Figure 5. It is noteworthy that Sal Island have the smallest irrigated agricultural area of 2 hectares. Since this area is significantly smaller compared to other municipalities, it is not shown in Figure 5.
Between 2020 and 2022, there was a slight reduction in water withdrawals for irrigation, from 37.73% to 34.41% of renewable water resources, suggesting a possible optimization in water use [29] Irrigation efficiency gradually increased from 0.071 US$/m³ in 2020 to 0.076 US$/m³ in 2022, indicating greater economic productivity per unit of water (Table 6). The agricultural sector's contribution to water stress, which is defined as the ratio of total freshwater withdrawn to the total renewable freshwater resources within a specific region, after considering environmental flow requirements [30], has also decreased, from 26,64 % to 23,27 %, reflecting improvements in water resource management. Finally, surface water irrigation predominates (63.26 %), compared to groundwater irrigation (10.35 %).
Irrigated agriculture is limited by water availability. Table 7 shows the availability of surface and ground water on the Cape Verde islands . In general, the islands with the lowest water availability have the smallest areas dedicated to irrigated agriculture. Except for Fogo Island, which ranks second in terms of surface water availability (79 millions of m3/year), and third in terms of groundwater availability (gross 42 millions of m3/year for average period, and explorable 12 and 9,3 millions of m3/year for average period and dry period respectively).
Of all the CV islands with the greatest agricultural aptitude (Santo Antão, São Nicolau, Santiago and Fogo) Fogo Island have a very small area of irrigated agriculture (90 hectares), which contrasts with its greatert availability of surface water (Fogo= 79, Santiago= 56, 6, Santo Antão = 27 and Sao Nicolau = 4, 2 millions of m3/year). This may be due to the price of water for irrigation, which is very high compared to the other islands. The island of Santiago shows the highest value of groundwater availability with 26 and 16, 5 millions of m3/year explorable for the average and dry periods respectively, which is in line with the island's larger irrigated area as shown in Table 5.
When analyzing the production of crop groups (Figure 6) such as roots and tubers, fruit crops, vegetables and sugarcane in Cape Verde based on FAOSTAT data [31],a significant increase in production has been observed since 1999, particularly for vegetables and sugarcane. Since 1989, the production of certain crops, especially vegetables, has declined. Roots, tubers and fruit crops have become the most produced product types nationally. Sugarcane production has remained relatively stable (see Figure 5). Based on data from the Statistical Yearbook of the National Statistics Institute [32], vegetable production decreased by about 24% between 2013 and 2017, with production ranging from 52,444 to 38,953 tons. It should be noted that in 2014 production was 52,444 tons. Production of roots and tubers fell by about 46%, from 27,163 tons in 2013 to 14,661 tons in 2015. In contrast, fruit production only fell by 5%, ranging between 16,639 and 15,730 tons. The reasons for this decline are unclear. The decline in rainfall (Figure 2), particularly in 2014 and 2017, and the decline in cultivated areas in 2014 and 2015 (as shown in Figure 5) may have contributed to the decline in productivity of certain crops (Figure 9). These results contradict the expected outcomes of investments in irrigated agriculture, including increased water availability and widespread use of drip irrigation.
Upon analysis of data on precipitation variation (Figure 2) and production variation (Figure 6 and Figure 8) of the main agricultural products, it becomes evident that there is a direct correlation between precipitation levels and agricultural production. In years with higher precipitation values, there was a corresponding increase in agricultural production, particularly for vegetables and sugar cane. This relationship can be easily discerned, as evidenced by the 1999 case, where prior to that year, there were years of minimal rainfall and low production. In islands of Santiago, Fogo, São Nicolau and Santo Antão, exhibited a notable increase in production this year, a trend that aligns with the precipitation pattern.
As precipitation levels rose, so did production, while a decline in precipitation led to a corresponding decline in production. However, a decline in production was observed beginning in 2015. Various factors may be attributed, including social and economic, for example the RGA2015 indicates that the number of individuals engaged in agricultural activities declined by 17.9% between 2004 and 2015, while the total area devoted to agricultural production decreased by 1% over the same period. Another potential factor contributing to this reduction may have been the impact of the global pandemic. In fact, [33] concluded that small family farmers on the islands of Santo Antão and Fogo indicated that mobility restrictions during the quarantine period made it difficult to send products to the country's largest cities.
In 2000, the area dedicated to irrigated agriculture grew significantly, so this year the area exceeds 4,000 hectares, where there has been an increase in the production of crops such as sugar cane and vegetables. In 2011, the irrigated area exceeded the projected attainable potential of 5,000 hectares and has remained at around 5,000 hectares in recent years. Based on the RGA 2015 data, it is estimated that the average area of irrigated plots is around 0.5 ha. There has been an expansion in the production areas of sugarcane, which currently occupies the largest irrigated area in Cape Verde, with an area of more than 3000 ha (Figure 7). Since 2000, the production area for tomatoes has increased significantly to over 1000 hectares. However, this area has decreased since 2015 and currently stands at around 550 ha. This situation is worrying, as the decline in tomato cultivation has led to an increase in sugarcane cultivation as shown in Figure 8. Sugarcane is a non-food crop primarily used to produce spirits.
Regarding the productivity of the main crops grown in irrigated agriculture in Cape Verde, bananas presented the highest productivity with 18 to 30 t/ha (Figure 9). This productivity has remained relatively constant over the years until 2017, when a decline began to be observed, likely due to the country's drought years (Figure 2). Between 2017 and 2019, cassava was one of the least productive crops with a productivity range of around 8 to 12 tons/ha. In contrast, sugarcane and tomato were the two highest-yielding crops, with productivity ranging from about 7 to 22 tons/ha and 9 to 26 tons/ha, respectively, over the period 1987 to 2022 (Figure 8).
Studies depicting the productivity of irrigated crops, for example, [34] determined the average productivity of different crops in two irrigation systems: drip and surface furrow irrigation. In the hot season, the average crops productivity was 1.8 kg/m2 in the drip system and 1.2 kg/m2 in the conventional system, respectively. The author reports that in the cool season, the average carrot productivity was 1.7 kg/m2 in the drip system and 1.0 kg/m2 in the traditional system. For tomato crops, the productivity in the drip system was 2.1 kg/m2 in the cool season and 2.4 kg/m2 in the hot season, while in the traditional system it was 2.3 kg/m2 in the cool season and 2.4 kg/ m2 in the hot season. It was not possible to identify a plausible justification for the increase in watermelon productivity, perhaps the increase to 60 t/ha in 2019 is due to a data gap, which is why we chose not to include it in the Figure 8.
Between 1987 and 2018, carrots remained one of the most productive crops in terms of water use, while lettuce has once again reached high levels in recent years (Figure 9). Banana water productivity was relatively stable, with a slight drop, and cabbage maintained moderate values. Sugarcane showed a sharp reduction in water productivity, unlike tomatoes, which showed significant growth. These data reflect differences in water management between crops over time (Figure 9).
3.3. Characterization of Irrigation Systems
Cape Verde farmers use, mainly, two irrigation systems: surface furrow irrigation and drip irrigation, indicated on the Ministry of Agriculture and Environment website [35]. The current adoption rate of drip irrigation is 45%. The objective is to increase this rate to 55% by 2024 [35]. In Cape Verde thetraditionalsurface irrigation is mainly practiced using small, blocked furrows, with lengths ranging from 3 to 12 meters. Additionally, small basins with an area of 4 to 20 square meters are employed for vegetable and fruit plants, respectively. As the sources of water are springs, wells, and boreholes, in many cases the water must traverse a considerable distance to reach the plots. It is conveyed in concrete channels, which have recently been substituted by pipelines. There is no study that refers to the flow rate used in this irrigation system in Cape Verde but based on the data already collected in the field by the authors, it has not yet found a flow rate that exceeds 3 l/s. Due to the slope of the land, terraces need to be built (Figure 10). The furrows and basins are constructed on the terraces, and in many cases, two crops are planted, one at the top of the bed or furrow and the other at the bottom of the basin or furrow (see Figure 10).
Due to its efficiency, drip irrigation is the preferred process for growing vegetables. Because the country has steep slopes and small plots of land, water is typically obtained from boreholes or wells and stored in tanks. The construction of terraces is necessary, but it increases installation costs due to the creation of subunits and the need to purchase additional equipment such as irrigation accessories (e.g. elbows), self-compensation drippers, pressure regulators and sand filters. However, the topography of the islands can be advantageous, especially for pressure generation in the irrigation system when the height of the reservoir exceeds the height of the plots.
Drip irrigation has become popular due to its ability to increase water efficiency and water saving, nevertheless there are significant deficiencies in the operation, maintenance and management of drip irrigation systems. These problems are due to inadequate hydraulic design and lack of timely maintenance. [36] found low values for the uniformity coefficient, with only two of the eight subsectors examined being within the 80–90% range, recommended for drip irrigation. Irrigation management is empirical, which results in significant water losses. In addition, on Santiago Island, the same author found losses for percolation between 125 and 255 mm/year due to problems in the sizing, management and maintenance of the irrigation system. The author also reported that in the locality of Achada da Baleia in São Domingos Municipality, about 30 m3 ha-1 d-1 of groundwater is used for drip irrigation, while about 50 m3 ha-1 d-1 is required for surface irrigation.
Many drip irrigation systems in Cape Verde do not have adequate filtration systems, resulting in poor performance. Previous studies have shown high chloride (>2000 mg/L), sodium (>1300 mg/L) and bicarbonate ions as well as a significant increase in pH (>8.0), highlighting the need for a good filtration system [11]). It is also worth noting that zones of saline intrusion have already been discovered on islands, where water bodies in coastal areas have high levels of chloride and sodium [37]. This is a crucial consideration as investments in treated wastewater could potentially worsen existing problems in these systems. Regarding research on treated wastewater in Cape Verde, it is important to note that [38] investigated the relationship between various water quality factors and the nutritional value and chemical composition of sorghum. Analysis of the treated water from the Santa Cruz wastewater treatment plant showed pH values of approximately 7.5 and an electrical conductivity of approximately 2970 µs/cm.
According to [34] the cost of water in traditional irrigation systems is 50% higher than in drip systems. However, these costs do not have a significant impact on the overall production costs, since the cost of water per cubic meter on the island of Santiago is negligible. This discrepancy is because the cost of water for traditional irrigation is higher than for drip irrigation, as a measure to encourage the use of drip irrigation. According to [39] water consumption in general represents a residual weight (< 5%) in the cost structure of agricultural production. In his study analyzing the financial profitability of horticultural crops (tomatoes, peppers and carrots) under drip and surface irrigation systems in the municipality of Santa Cruz in Santiago Islands, [10] concludes that the drip irrigation system resulted in higher production, profitability and profit for all the three crops. However, to achieve these goals, certain prerequisites are required, such as sufficiently large systems, regular maintenance and well managed irrigation. Unfortunately, farmers often overlook these aspects. According to [34] it is not easy to determine whether vegetable yields under the drip irrigation system are superior to those under the traditional irrigation system in Cape Verde growing conditions.
3.4. Challenges in Water Management in Cape Verde and Strategies Adopted to Increase Water Availability and Efficient Water Use
Cape Verde faces serious challenges in managing its water resources due to its arid location and erratic climate. The country has invested in building dams, exploring alternative sources such as desalination, and improving irrigation. However, the effectiveness of these strategies has been limited by several factors. The measures and strategies adopted can be classified into three principal categories: water mobilization, particularly the construction of dams; the pursuit of alternative water sources, notably desalination and treated wastewater; and irrigation management, including the introduction of drip irrigation.
- a)
- Mobilization of water
Cape Verde has invested heavily in irrigation infrastructures, with the prospect of mobilizing 75 million cubic meters of water by 2017, and the previous government set a target of building 17 dams [11]. Currently, the country has nine dams, seven of which are located on the island of Santiago, one on São Nicolau, and another on the island of Santo Antão. Some studies point to water quality problems in dams for example [40] concluded that cyanobacteria were the dominant species within the phytoplankton community, and that they posed a significant risk, particularly given that the identified taxa have the potential to produce a range of toxins in five dams on the island of Santiago, while [41] observed in general in the reservoirs of 5 dams located on the island of Santiago high pH values (7.4-9.36), sodium (131-43 mg/L Na), chlorides (169.4-39.6 mg/L Cl) and carbonates (193.2- 121.2 mg/L CaCO3). Therefore, this indicates a deficiency in the management of water re-sources with regard to both quantity and quality.
The main problems have to do with their construction in valleys, usually the best agricultural areas. Given the irregular rainfall, when it does occur, it quickly fills up with solid material transported from higher ground, which drastically reduces the usable capacity of the dams. [42] carried out a bathymetric survey of the Poilão dam reservoir in March 2013, pointed to an annual sedimentation rate of close to 90,000m3/year, meaning that in just 7 years the reservoir's storage capacity has almost halved. Infrastructures for erosion protection nwould have to be built upstream to help retain this solid material, which are economically unsustainable.
- b)
- Alternative water sources
The impact of water resources scarcity on the country's economic development requires the exploration of alternative water sources to reduce the heavy dependence on groundwater and improve its management. [7] highlights that despite its limitations water is a crucial factor in Cape Verde's socio-economic progress. Alternative sources of water, such as the use of treated wastewater and desalination, has been pointed out as an option especially in recent years, but still, in practical terms, few experiments are using these technologies. Except for desalinated water, water sources depend on rainfall, surface water and groundwater [43]. In addition to traditional sources of water, alternative water sources such as wastewater and desalination can be utilized to enhance water availability for agriculture. Regarding desalination of water for agriculture, there are experiences in other regions, such as the Canary Islands, where there is a robust commitment to desalination, particularly with reverse osmosis technology, which accounts for 69% of the desalinated water produced [44]. Cape Verde has extensive experience in water desalination for human consumption. Investing in the desalination of water for agriculture using photovoltaic solar energy could be an interesting solution for some areas in Cape Verde.
- c)
- Irrigation management
The challenges for efficient water management will escalate due to climate change, according to the NAP 2021 [45]. As a Small Island Developing State (SIDS), Cape Verde is extremely vulnerable to negative impacts and unpredictable climate. The country has long faced a hostile climate, with climate change exacerbating weather phenomena such as drought and violent coastal storms. The potential impacts of climate change on agricultural production are primarily due to rising temperatures and precipitation reduction. Projections for the region indicate a trend towards higher temperatures (estimated at approximately 0.4 °C since 1990) [46], altered precipitation patterns characterized by an overall reduction in rainfall (around 20 to 30%), and an increased frequency of extreme drought events.
Cyclical droughts have been a persistent challenge throughout the country's history [47,48] with a significant impact on agriculture. Traditional irrigation practices, which are often inefficient, exacerbate these problems. To address this issue, the state has invested heavily in water mobilization and expansion of drip irrigation [34]. Drip irrigation was first introduced in the early 1980s, as noted by Mendes [34].). However, farmers faced obstacles in using this system due to high installation costs and lack of technical support. In addition, the traditional irrigation calendar is not suitable for the drip irrigation system, which would only be possible if small reservoirs were built on farmers' properties to store water and allow farmers to irrigate more frequently. This increases investment costs, which, according to information collected on the field, has been one of the barriers for some farmers. To overcome this obstacle, a program to support drip irrigation was launched by the government, which finances 50% of the costs of installation, to promote the transfer from surface to localized irrigation [35].).
3.5. Foreign Experiences That can be Adopted in Cape Verde
To improve water use efficiency (WUE), several practical techniques can be employed, including sustainable irrigation practices, crop-specific agronomic strategies, and innovative technological solutions. These methods enable farmers to enhance water management efficiency, reduce crop vulnerability to water stress, and ultimately increase agricultural sustainability [49].
For instance, arid in semi-arid regions have adopted more efficient irrigation techniques to enhance water utilization efficiency and boost agricultural productivity. In Mexico, the implementation of modern irrigation methods, such as drip irrigation systems and soil water balance models, has led to more efficient water management and increased agricultural productivity [50]. In Spain, the transition to pressurized irrigation systems, including drip and sprinkler systems, has resulted in a notable improvement in water use efficiency [51]. In the Canary Islands in Spain, implementing subsurface drip irrigation with reclaimed water has enhanced ruminant production sustainability and forage yield, making it profitable for fodder production in the region [52]. Additionally, combining desalinated seawater with other water sources like groundwater and reclaimed water can ensure water and food security, especially in arid regions, by providing crops with adequate mineral nutrients without causing salt ion injuries or toxicity, as demonstrated in banana crop experiments in the Canary Islands [53]. In the semi-arid region of Brazil, innovative approaches such as the Capillary Underground Irrigation System for Family Farming (SISCAFI) have shown promise in providing sustainable and cost-effective irrigation solutions using recycled materials such as PET bottles and textile waste, contributing to environmental preservation and rural development [54].). In addition, the use of other technologies such as biodegradable superhydrophobic sand (SHS) as a soil cover has led to significant reductions in evaporation, increased soil moisture and better crop yields, as stated by [55].
Adopting similar techniques in Cape Verde could help mitigate water scarcity and increase agricultural sustainability. While the adoption of new irrigation practices and technologies may require additional investments compared to conventional techniques, the resulting water or energy savings and increased crop yields can compensate for the higher initial costs [51]. This underscores the importance of adapting technologies and methods to local conditions and the training and qualification for its use.
3.6. Crop Irrigation Requirements and Water Management
Irrigation requirements depend heavily on annual rainfall. Has been conducted research in Cape Verde to determine irrigation requirements for horticultural crops. [36] estimated net irrigation requirements (NIR) for the period 1984 to 2008 during extreme and severe drought periods for Santiago Island (see Table 8), and [23] estimated NIR for three precipitation scenarios (scenario 1 = dry year, scenario 2 = average year and scenario 3 = rainy year) for the island of São Nicolau (Table 9). These studies estimate the amount that needs to be supplied to different crops depending on the availability of precipitation, Years with higher rainfall are years with lower water demand for irrigation and vice versa, which poses a challenge for irrigation management because the years with the highest irrigation demand are also the years with the lowest water availability (Table 8 and Table 9).
Due to their longer development cycles, bananas and sugarcane require more water compared to other crops, especially vegetables. In fact sugar cane has a higher NIR than horticultural crops, as shown in Table 8. In severe drought, the NIR of the sugar cane is approximately 1400 mm, while in extreme drought it is approximately 1600 mm. This raises concerns about the sustainability of irrigation areas during periods of low rainfall. On the other hand, sugarcane raises food sovereignty concerns as it is a non-food crop, and the country has limited water and land resources. However, sugarcane has proven to be a lucrative crop for farmers.
From the perspective of sustainable water resources management of in agriculture, it is evident that the option of increasing the area dedicated to sugarcane cultivation has been a visible trend in recent years. This is illustrated by Figure 8, which depicts the evolution of the irrigated agriculture area dedicated to sugarcane cultivation, which reached approximately 62% in 2022.
4. Conclusions
At the end of this study, it can be concluded that irrigated agriculture plays a crucial role in ensuring agricultural production and food security in Cape Verde. Through irrigation, is possible the production of vegetables and sugar cane, which would not succeed under rainfed, due to the climatic conditions of Cape Verde.,
However, significant challenges persist, including water scarcity, climate change, and the low efficiency of irrigation systems. The few studies that have been carried out indicate that surface irrigation uses about 20 m³/ha/day more water than drip irrigation. Despite the advantages of drip irrigation, challenges such as lack of maintenance and problems with hydraulic sizing compromise its effectiveness in Cape Verde.The analysis of different irrigation systems, such as furrow and drip irrigation, highlights operational challenges and the need for infrastructure investment, effective management practices and technical training and capacity building
The analysis of irrigation for different crops underscores the importance of proper planning and management to ensure the sustainability of irrigated areas, especially during periods of low rainfall. A concerning trend is the increasing area dedicated to sugar cane cultivation, which represents in 2022 about 62% of the irrigated area in Cape Verde. This is primarily due to its use in producing "grogue," a traditional alcoholic beverage, despite its high-water consumption (1400 to 1600 mm) compared to horticultural crops. This shift towards sugar cane is problematic because it exacerbates water scarcity and food security.
Furthermore, there has been a lack of adequate investment to prevent the silting of dams and to improve water management. The strategies adopted by successive governments to increase water availability, such as water mobilization and dam construction, require additional investments, and training to achieve the desired goals.
Author Contributions
Conceptualization, E. S. and J. R.; methodology and formal analysis, E. S., P. L., A.M.C and J. R.; writing—original draft preparation, E. S.; writing—review and editing, E. S., P. L., A. M. C., and J. R.; Supervision, E. S., P. L., A. M. C., and J. R. All authors have read and agreed to the published version of the manuscript.
Funding
Funding from FCT—Fundação para a Ciência e a Tecnologia, I.P., under the PhD grant PRT/BD/154028/2022. LEAF - UIDB/04129/2020; Associate Laboratory TERRA - LA/P/0092/2020
Acknowledgments
The Instituto Nacional de Meteorologia e Geofísica (INMG) from Cape Verde is acknowledged for providing meteorological data
Conflicts of Interest
The authors declare no conflicts of interest.
References
- Godfray, H.C.J.; Crute, I.R.; Haddad, L.; Lawrence, D.; Muir, J.F.; Pretty, J.; Robinson, S.; Thomas, S.M.; Toulmin, C. Food security: The challenge of feeding 9 billion people. Science 2010, 327, 812–818. [Google Scholar] [CrossRef] [PubMed]
- Paz, V.P. da S.; Teodoro, R.E.F.; Mendonça, F.C.. Recursos hídricos, agricultura irrigada e meio ambiente. Revista Brasileira de Engenharia Agrícola e Ambiental, 2000, 4(3), 465–473. Campina Grande, PB: DEAg/UFPB.
- Carter, R.; Kay, M.; Weatherhead, K. Water Losses in Smallholder Irrigation Schemes. Agricultural Water Management 1999, 40, 1–10. [Google Scholar] [CrossRef]
- Silva, J.C. Importância da Horticultura para a Segurança Alimentar em Cabo Verde – Estudo de Caso na Ilha do Fogo. Dissertação para a obtenção do Grau de Mestre em Engenharia Agronómica, Universidade Técnica de Lisboa, Instituto Superior de Agronomia: Lisboa, 2009. https://www.repository.utl.pt/handle/10400.5/617.
- Monteiro, M.F. Segurança Alimentar em Cabo Verde – Estudo de Caso do Concelho de Ribeira Grande, Ilha de Santo Antão. Master’s Thesis, Instituto Superior de Agronomia, Universidade Técnica de Lisboa, Lisboa, Portugal, 2012. Available online: https://www.repository.utl.pt/handle/10400.5/5314.
- Coreia, A.M.N.G. A Água como um dos Fatores de Desenvolvimento do Continente Africano no Próximo Milênio. In População, Ambiente e Desenvolvimento em África; Instituto Superior de Ciências Sociais e Políticas, Universidade Técnica de Lisboa, Lisboa, 2001; pp. 159–174. https://abrir.link/AYOeX.
- Gomes, A.M. Hidrogeologia e Recursos Hídricos da Ilha de Santiago (Cabo Verde). Ph.D. Dissertation, Universidade de Aveiro, Aveiro, Portugal, 2007. Available online: https://ria.ua.pt/handle/10773/2743.
- Shanahan, T.M.; Overpeck, J.T.; Anchukaitis, K.J.; Beck, J.W.; Cole, J.E.; Dettman, D.L.; Peck, J.A.; Scholz, C.A.; King, J.W. Atlantic Forcing of Persistent Drought in West Africa. Science 2009, 324, 377–380. [Google Scholar] [CrossRef] [PubMed]
- Mannaerts, C.M.; Gabriels, D. Rainfall erosivity in Cape Verde. Soil Tillage Res. 2000, 55, 207–212. [Google Scholar] [CrossRef]
- Afonso, M.B. Rentabilidade Financeira de Culturas Hortícolas nos Sistemas de Rega Gota-a-gota e Tradicional no Conselho de Santa Cruz. Relatório para Obtenção do Grau de Bacharel em Produção e Proteção das Culturas, INIDA, Cabo Verde, 2002.
- Shahidian, S.; Serralheiro, R.P.; Serrano, J.; Sousa, A. O Desafio dos Recursos Hídricos em Cabo Verde. 2014. Available online: https://rdpc.uevora.pt/handle/10174/12489.
- Gornall, J.; Betts, R.; Burke, E.; Clark, R.; Camp, J.; Willett, K.; Wiltshire, A. Implications of climate change for agricultural productivity in the early twenty-first century. Philos. Trans. R. Soc. Lond. B Biol. Sci. 2010, 365, 2973–2989. [Google Scholar] [CrossRef] [PubMed]
- Wolters, W. Influences on the Efficiency of Irrigation Water Use; International Institute of Land Reclamation and Improvement: Wageningen, Netherlands, 1992; pp. 150–150. ISBN 90-70754-290. [Google Scholar]
- Bos, M.G. Performance Indicators for Irrigation and Drainage. Irrig. Drain. Syst. 1997, 11, 119–137. [Google Scholar] [CrossRef]
- Oweis, T.; Pala, M.; Ryan, J. Stabilizing Rainfed Wheat Yields with Supplemental Irrigation and Nitrogen in a Mediterranean Climate. Agron. J. 1998, 90(5), 672–681. [Google Scholar] [CrossRef]
- Zhang, H.; Oweis, T.Y.; Garabet, S.; Pala, M. Water-use efficiency and transpiration efficiency of wheat under rain-fed conditions and supplemental irrigation in a Mediterranean-type environment. Plant Soil 1998, 201, 295–305. [Google Scholar] [CrossRef]
- Pereira, L.S.; Qweis, T.; Zairi, A. Irrigation management under water scarcity. Agricultural Water Management 2002, 57, 175–206. [Google Scholar] [CrossRef]
- Semedo, J.M. A Ilha de Santiago (Cabo Verde) Génese de um Ecossistema e Identidade Cultural Numa Ilha de Escala Marítima Entre a África, a Europa e as Américas. Palaver 2012, n.1, 153–168. [Google Scholar] [CrossRef]
- MAA—Ministério de Agricultura e Ambiente. Programa Nacional de Investimento Agrícola, Segurança Alimentar e Nutricional; MAA: Praia, Cabo Verde, 2018. [Google Scholar]
- Peel, M.C. , Finlayson, B.L., & McMahon, T.A. (2007). Updated world map of the Köppen-Geiger climate classification. Hydrology and earth system sciences, 11(5), 1633-1644.
- Instituto Nacional de Meteorologia e Geofísica (INMG). Climatic data for Cabo Verde; Data provided via personal communication, 2023.
- Shahidian, S.; Serralheiro, R.; Teixeira, J.; Serrano, J. Parametric Calibration of the Hargreaves-Samani Equation for Use at New Locations. Hydrol. Process. 2013, 27, 605–616. [Google Scholar] [CrossRef]
- Sequeira, E.; de Sousa, P.L.; Russo, A. Assessment of Water Requirements for Horticultural Crops in Arid Regions. Nutrition & Food Science 2020, 10(2). [CrossRef]
- Lopes, I.; Leal, B.G. Índice de aridez e tendência à desertificação para estações meteorológicas nos estados de Bahia e Pernambuco. Revista Brasileira de Climatologia 2015, 17, 1–12. [Google Scholar] [CrossRef]
- FAO. WaPOR—FAO’s Portal to Monitor Water Productivity through Open Access of Remotely Sensed Derived Data. Food and Agriculture Organization of the United Nations. Available online: https://data.apps.fao.org/wapor/?lang=en (accessed on 10 April 2025).
- MAA—Ministério de Agricultura e Ambiente. Recenseamento Geral da Agricultura 2015; Dados Gerais; MAA: Praia, Cabo Verde, 2017. [Google Scholar]
- INGRH—Instituto Nacional de Gestão dos Recursos Hídricos. Plano de ação Nacional Para a Gestão Integrada dos Recursos Hídricos (PAGIRE); Série—N° 45 2° SUP; «B. O.» Da República de Cabo Verde: Praia, Cabo Verde. 2010.
- MAA/INMG—Ministério de Agricultura e Ambiente, Instituto Nacional de Meteorologia e Geofísica. Estudos Sectoriais Vulnerabilidade e Adaptação às Mudanças Climáticas em Cabo Verde; MAA: Praia, Cabo Verde, 2007. [Google Scholar]
- FAO. AQUASTAT Dissemination System. Food and Agriculture Organization of the United Nations, 2025. Available online: https://data.apps.fao.org/aquastat/?lang=en&share=f-17792a7a-a61e-4725-891a-7b910e401d04 (accessed on 8 April 2025).
- FAO & UN-Water. 2024. Progress on the level of water stress – Mid-term status of SDG Indicator 6.4.2 and acceleration needs, with special focus on food security - 2024. Rome, FAO. [CrossRef]
- Organização das Nações Unidas para Agricultura e Alimentação (FAO). FAOSTAT.; FAO: Rome, Italy, 2024; Available online: https://www.fao.org/faostat/en/#compare.
- INE- Instituto Nacional de Estatística. Anuário Estatístico Cabo Verde 2017; Instituto Nacional de Estatística: Praia, Cape Verde, 2018. [Google Scholar]
- Ferreira, V.S. The Impacts of School Closures on Small Family Farmers due to Covid-19 in Cabo Verde. Young African Researchers in Agriculture (YARA) Working Paper 2021, 25, 1–10.
- Mendes, A.A.F. Análise Comparativa de Rentabilidade de Algumas Culturas de Regadio na Ilha de Santiago em Cabo Verde. Master’s Thesis, Instituto Superior de Agronomia, Universidade Técnica de Lisboa, Lisboa, Portugal, 2009. Available online: https://core.ac.uk/download/pdf/38680545.pdf.
- Ministério de Agricultura e Ambiente de Cabo Verde. Governo aprova o programa de subvenção aos agricultores para instalação de sistema de rega gota-a-gota. Notícias do MAA, 21 Mar. 2023. Available online: https://maa.gov.cv/index.php/noticias/366-governo-aprova-o-programa-subvencao-aos-agricultores-para-instalacao-de-sistema-de-rega-gota-a-gota (accessed on 14 May 2024).
- Moreno, A.M.P. P. Modelação Hidrológica e de Rega para Condições de Escassez Visando a Gestão da Água em Santiago Cabo Verde. Ph.D. Dissertation, Instituto Superior de Agronomia, Universidade de Lisboa, Lisboa, Portugal, 2013. Available online: https://www.repository.utl.pt/handle/10400.5/6149.
- Pina, A.F.L. L. Hidroquímica e Qualidade das Águas da Ilha de Santiago—Cabo Verde. Ph.D. Dissertation, Universidade de Aveiro, Aveiro, Portugal, 2009; p. 232. Available online: https://ria.ua.pt/handle/10773/4840.
- Mendoza-Grimón, V.; Amorós, R.; Fernández-Vera, J.R.; Hernádez-Moreno, J.M.; Palacios-Díaz, M. d. P. Effect of Different Water Quality on the Nutritive Value and Chemical Composition of Sorghum bicolor Payenne in Cape Verde. Agronomy 2021, 11, 1091. [Google Scholar] [CrossRef]
- Sequeira, E.A.C.; Baptista, I.; Ferreira, V.S. Otimização da Produtividade da Água e da Fertilização Azotada na Cultura do Tomate em Cabo Verde. Brazilian Journal of Animal and Environmental Research 2024, 7(1), 633–650. [Google Scholar] [CrossRef]
- Morais, M.; Penha, A.M.; Novais, M.H.; Landim, L.; Victória, S.S.; Morales, E.A.; Barbosa, L.G. Some Observations on Phytoplankton Community Structure, Dynamics and Their Relationship to Water Quality in Five Santiago Island Reservoirs, Cape Verde. Water 2021, 13, 2888. [Google Scholar] [CrossRef]
- Landim, L.; António, F.; Silva, S.V.; Morales, E.A.; Novais, M.H.; Penha, A.; Morais, M. Caracterização Físico-Química e Biológica de Cinco Albufeiras da Ilha de Santiago, Cabo Verde. Repositório da Universidade de Évora, 2018.
- Araujo, A.A.; Hernandez, R.; Fonseca, R.; Matos, J. Estimating Sedimentation Rate on Poilão Dam (Santiago Island, Cape Verde). Comunicações Geológicas 2014, 101(3). Available online: https://dspace.uevora.pt/rdpc/handle/10174/17491.
- Ramos, K.R. Mudanças Climáticas e os Desafios do Setor dos Recursos Hídricos em Cabo Verde. Revista Ibero-Americana de Ciências Ambientais 2014, 5, 1–10. [CrossRef]
- Mendoza-Grimón, V.; Fernández-Vera, J.R.; Hernández-Moreno, J.M.; Palacios-Díaz, M.d.P. Sustainable Irrigation Using Non-Conventional Resources: What Has Happened after 30 Years Regarding Boron Phytotoxicity? Agronomy 2021, 11, 1345. [Google Scholar] [CrossRef]
- MAA—Ministério de Agricultura e Ambiente. Plano Nacional de Adaptação de Cabo Verde; Direção Nacional do Ambiente: Praia, Cabo Verde, 2021. [Google Scholar]
- FAO (2025). Drought within an ocean. Food and Agriculture Organization, Rome. Available online: https://www.fao.org/newsroom/story/drought-within-an-ocean/en (accessed on 13 March 2025).
- Sjöstedt, M.; Povitkina, M. Vulnerability of Small Island Developing States to Natural Disasters: How Much Difference Can Effective Governments Make? Environ. Dev. 2016, 16, 82–105. [Google Scholar] [CrossRef]
- Romeiras, M.M.; Catarino, S.; Gomes, I.; Fernandes, C.; Costa, J.C.; Caujapé-Castells, J.; Duarte, M.C. IUCN Red List Assessment of the Cape Verde Endemic Flora: Towards a Global Strategy for Plant Conservation in Macaronesia. Bot. J. Linn. Soc. 2016, 180, 413–425. [Google Scholar] [CrossRef]
- Alharbi, S.; Felemban, A.; Abdelrahim, A.; Al-Dakhil, M. Agricultural and Technology-Based Strategies to Improve Water-Use Efficiency in Arid and Semiarid Areas. Water 2024, 16, 1842. [Google Scholar] [CrossRef]
- González-Trinidad, J.; Júnez-Ferreira, H.E.; Bautista-Capetillo, C.; Ávila Dávila, L.; Robles Rovelo, C.O. Melhorando a Eficiência do Uso da Água e a Produtividade Agrícola: Um Caso de Aplicação em uma Região Semiárida Modernizada no Centro-Norte do México. Sustainability 2020, 12, 8122. [Google Scholar] [CrossRef]
- Arbat, G.; Masseroni, D. The Use and Management of Agricultural Irrigation Systems and Technologies. Agriculture 2024, 14, 236. [CrossRef]
- Mendoza-Grimón, V.; Hernández-Moreno, J.M.; Palacios-Díaz, M.D.P. Improving Water Use in Fodder Production. Water 2015, 7, 2612–2621. [Google Scholar] [CrossRef]
- Álvez-Méndez, S.J.; Padrón-Armas, I.; Mahouachi, J. Irrigation Management Strategies through the Combination of Fresh Water and Desalinated Sea Water for Banana Crops in El Hierro, Canary Islands. Water Reuse 2021, 11(3), 464–474. [Google Scholar] [CrossRef]
- Do Nascimento, N.R.; Salvado, L.R.B.S.; Borges, F.F. Low Cost System Based on Textile and Plastic Waste for Underground Irrigation in the Brazilian Semi-Arid Region. In Machado, J.; Soares, F.; Veiga, G. (Eds.) Innovation, Engineering and Entrepreneurship. HELIX 2018. Lecture Notes in Electrical Engineering, vol. 505. Springer, Cham. [CrossRef]
- Gallo, A. Jr.; Odokonyero, K.; Mousa, M.A.A.; Reihmer, J.; Al-Mashharawi, S.; Marasco, R.; Manalastas, E.; Morton, M.J.L.; Daffonchio, D.; McCabe, M.F.; Tester, M.; Mishra, H. Nature-Inspired Superhydrophobic Sand Mulches Increase Agricultural Productivity and Water-Use Efficiency in Arid Regions. ACS Agric. Sci. Technol. 2022, 2(2), 276–288. [Google Scholar] [CrossRef]
Figure 1.
Cape Verde Archipelago.
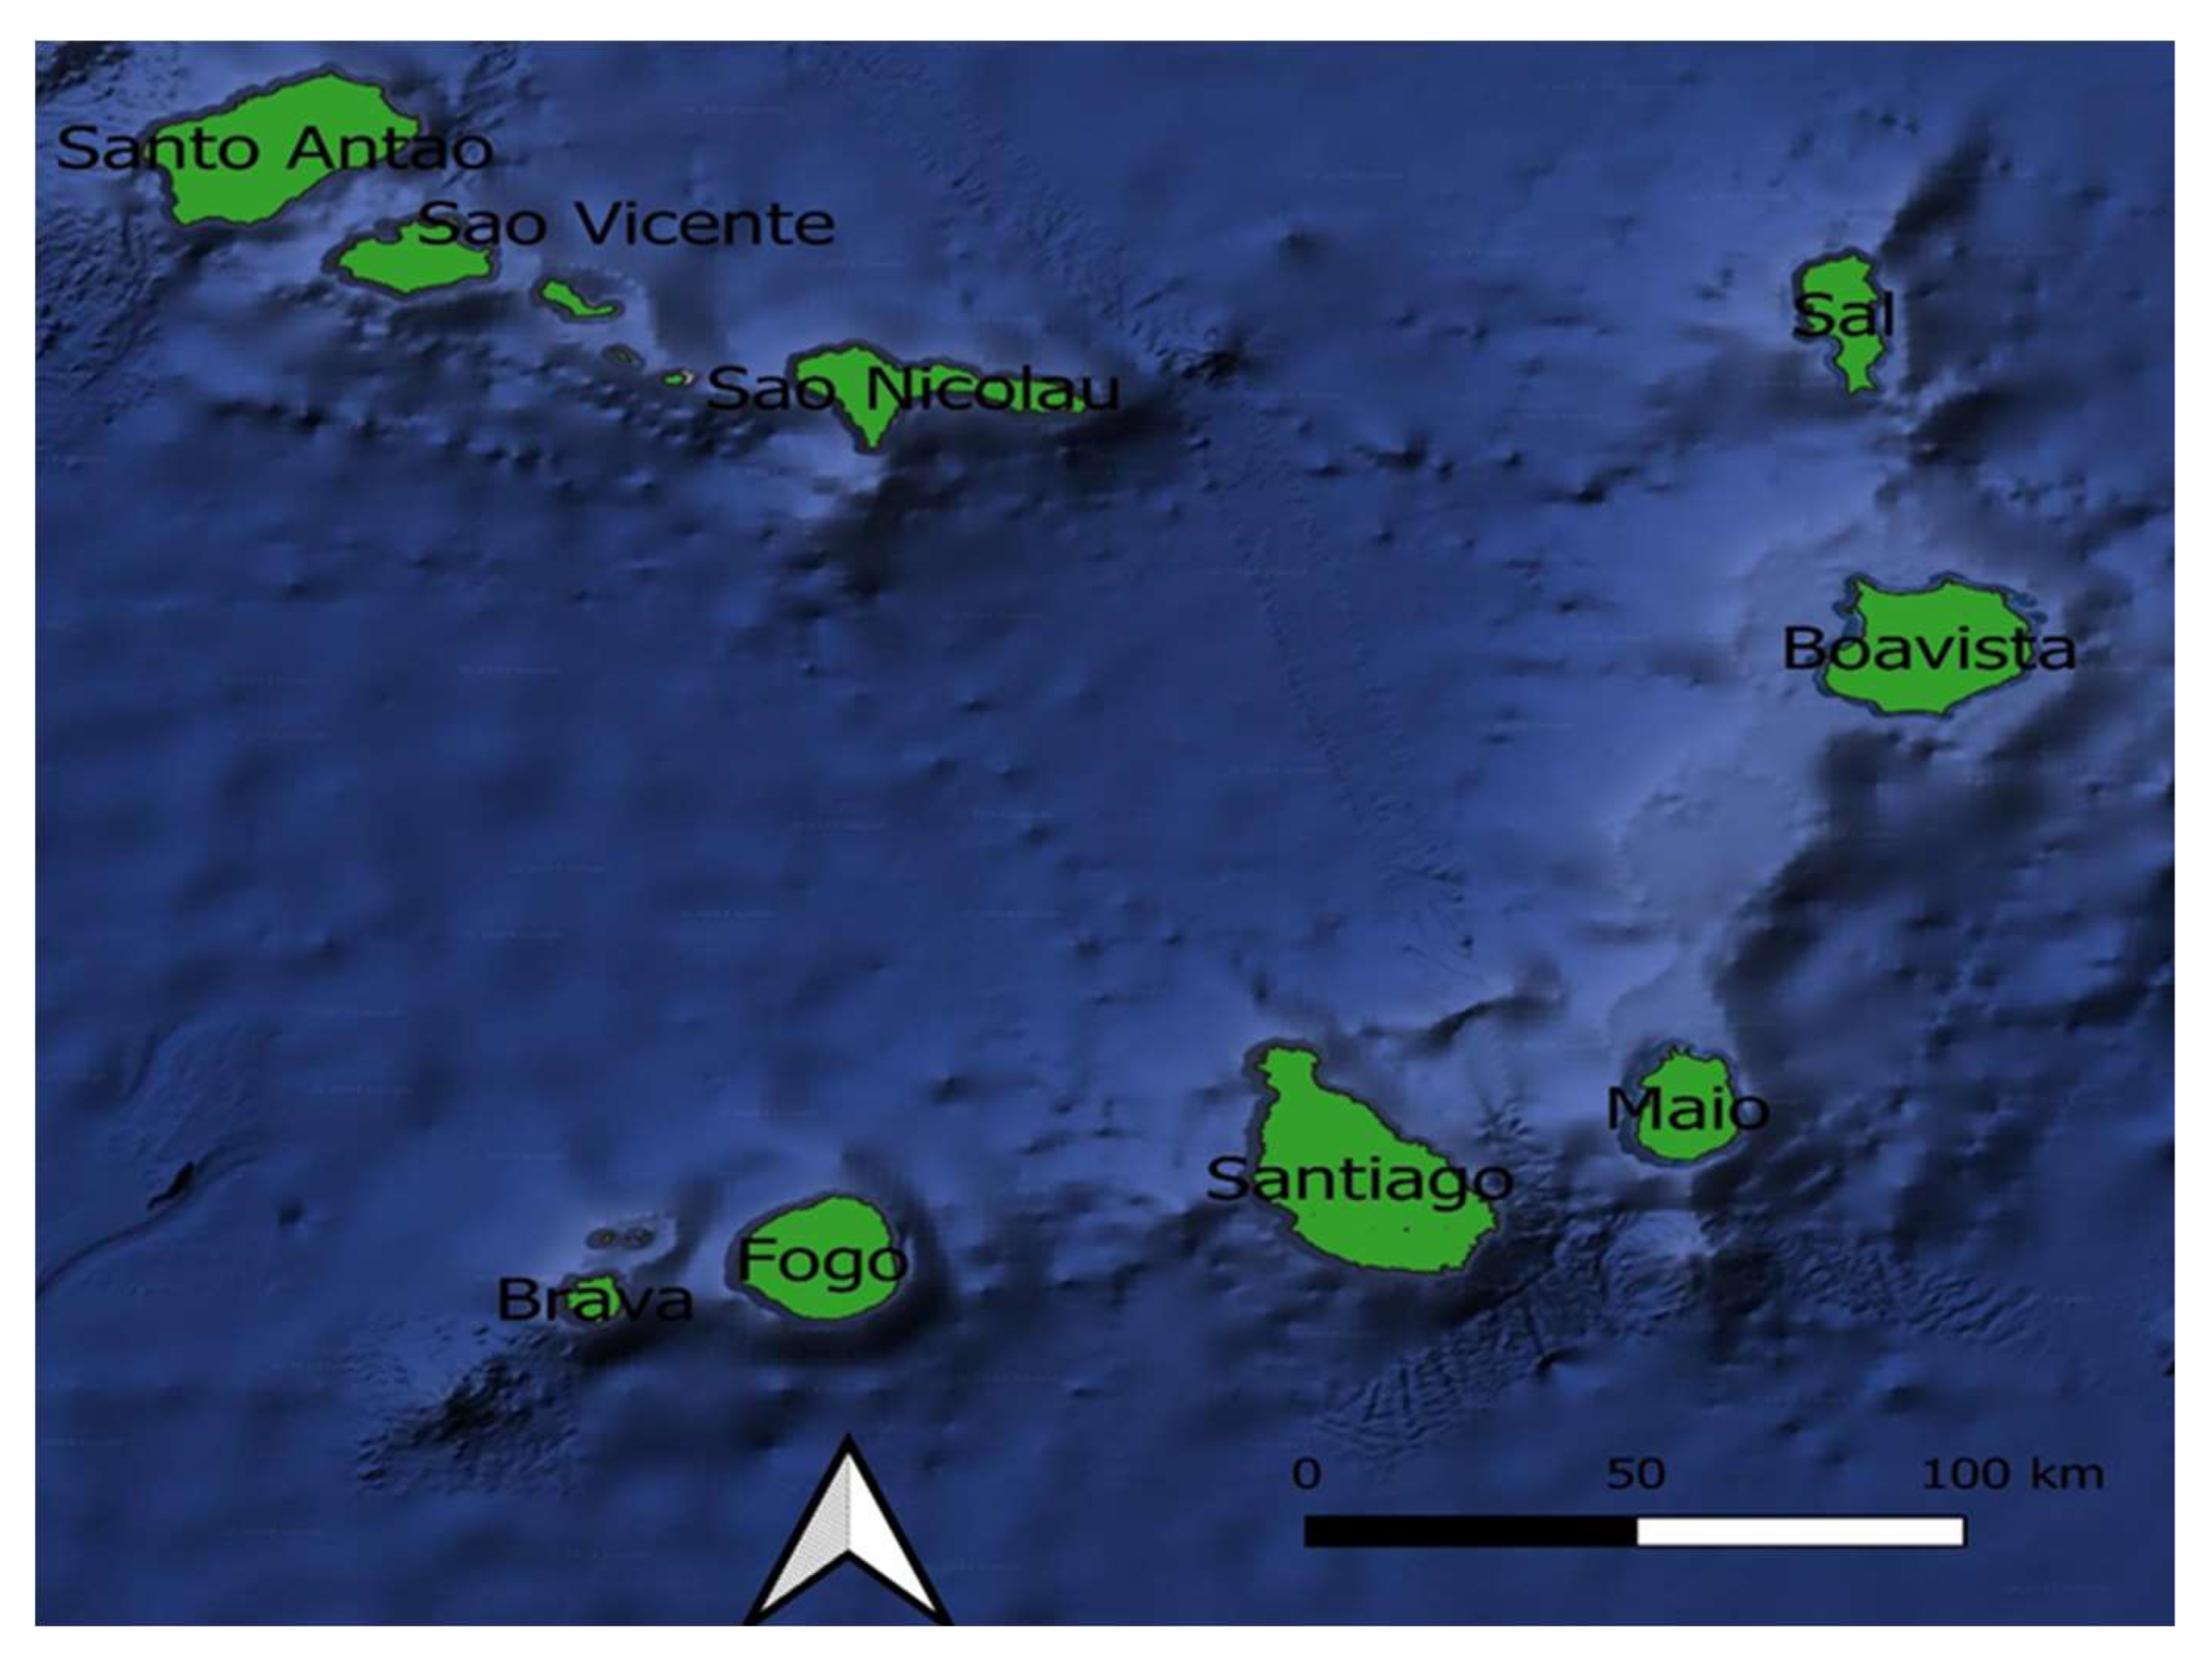
Figure 2.
Annual variation of average monthly temperature (°C) from 2011 to 2022 in some localities of Cape Verde [21].
Figure 2.
Annual variation of average monthly temperature (°C) from 2011 to 2022 in some localities of Cape Verde [21].
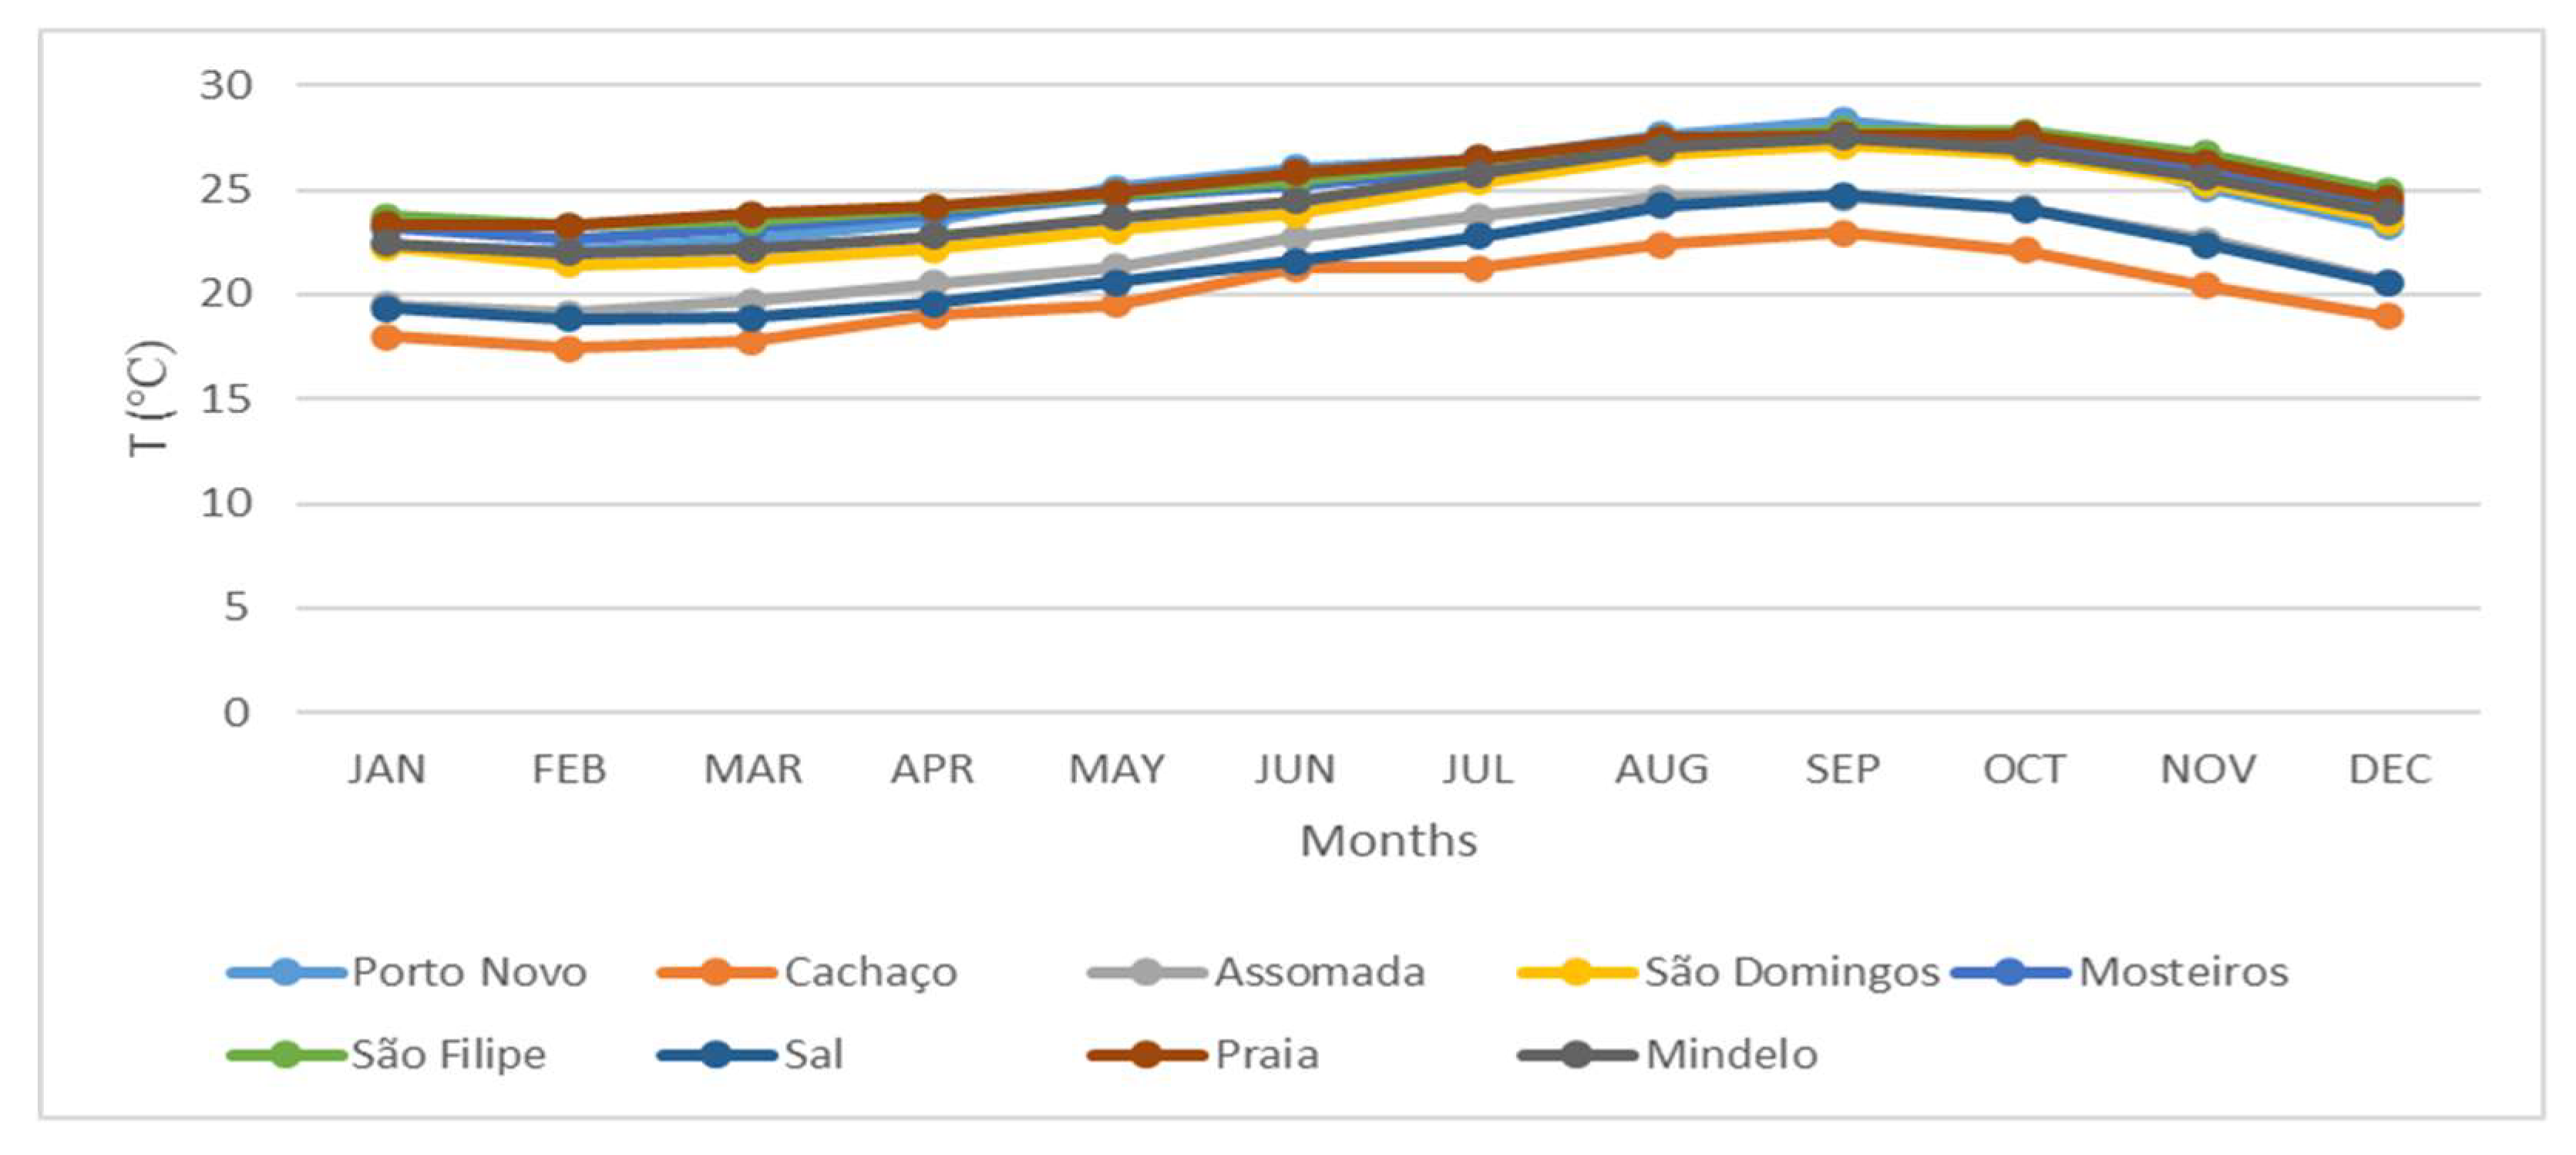
Figure 3.
Mean annual precipitation (mm) for the 1993 to 2022 period in the main agricultural islands of Cape Verde [21].
Figure 3.
Mean annual precipitation (mm) for the 1993 to 2022 period in the main agricultural islands of Cape Verde [21].
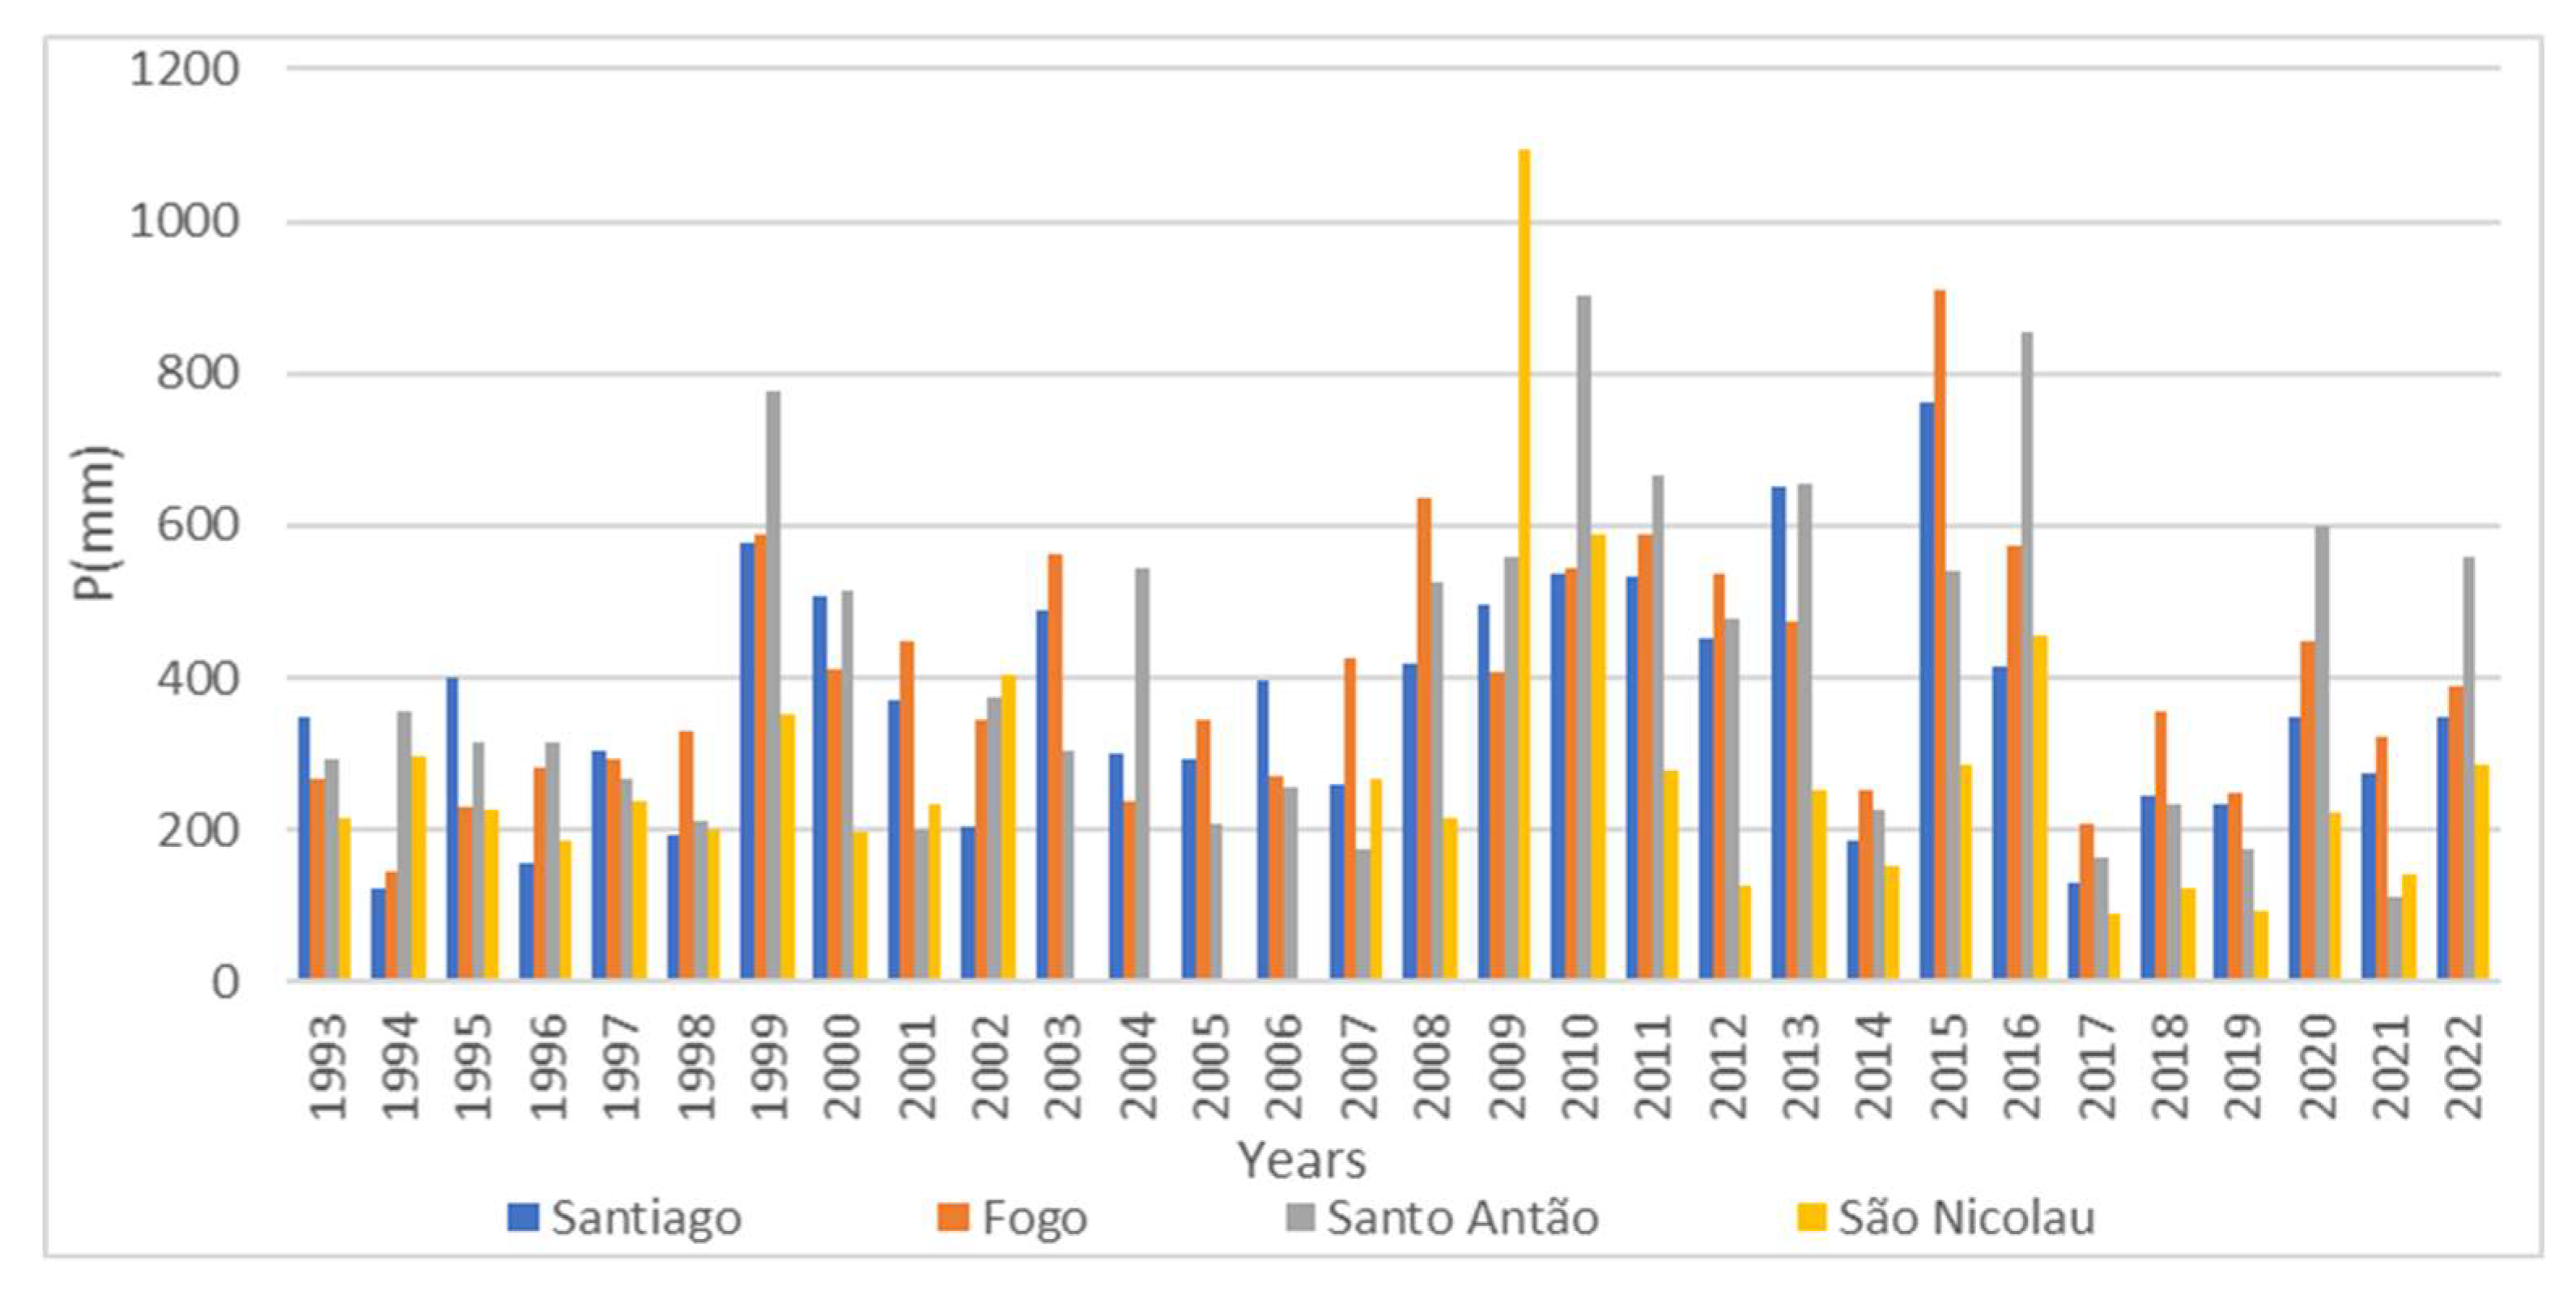
Figure 4.
Gross Biomass Water Productivity (Seasonal) in Cape Verde, 2019 [25].
Figure 4.
Gross Biomass Water Productivity (Seasonal) in Cape Verde, 2019 [25].

Figure 5.
Total and cultivated areas of irrigated agriculture per in the municipality [26].
Figure 5.
Total and cultivated areas of irrigated agriculture per in the municipality [26].
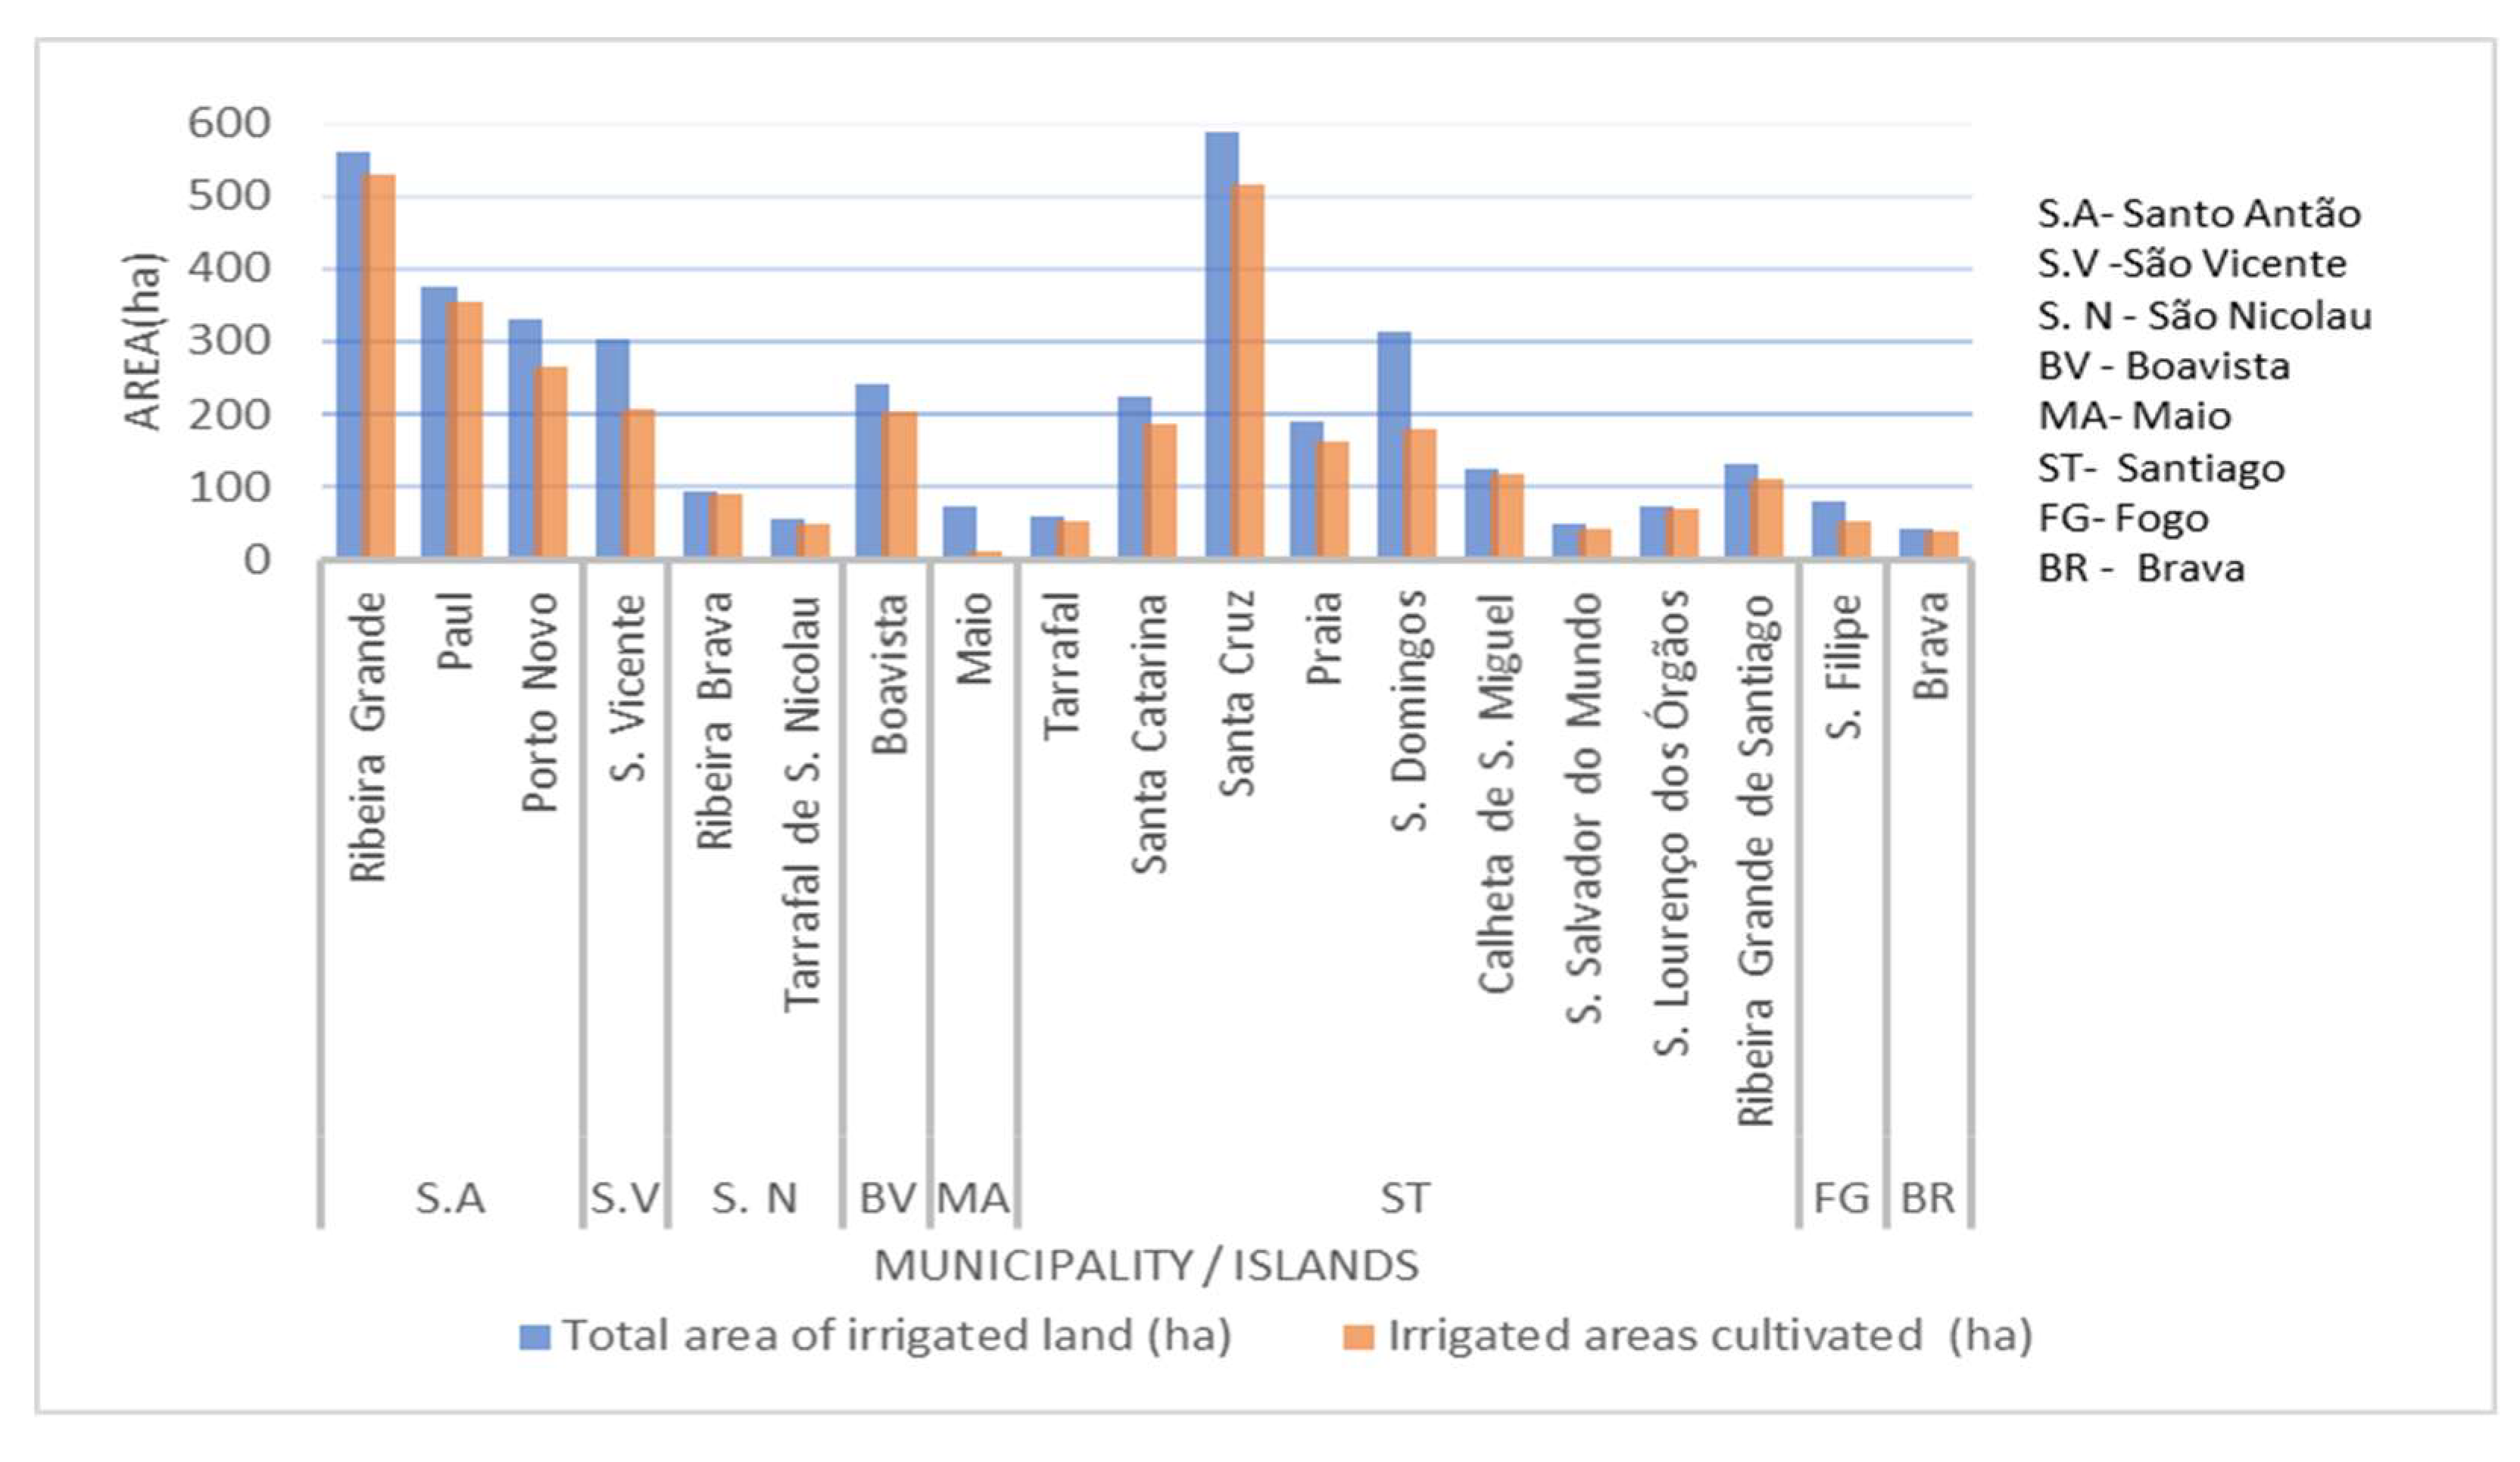
Figure 6.
Production evolution in irrigated agriculture [31].
Figure 6.
Production evolution in irrigated agriculture [31].
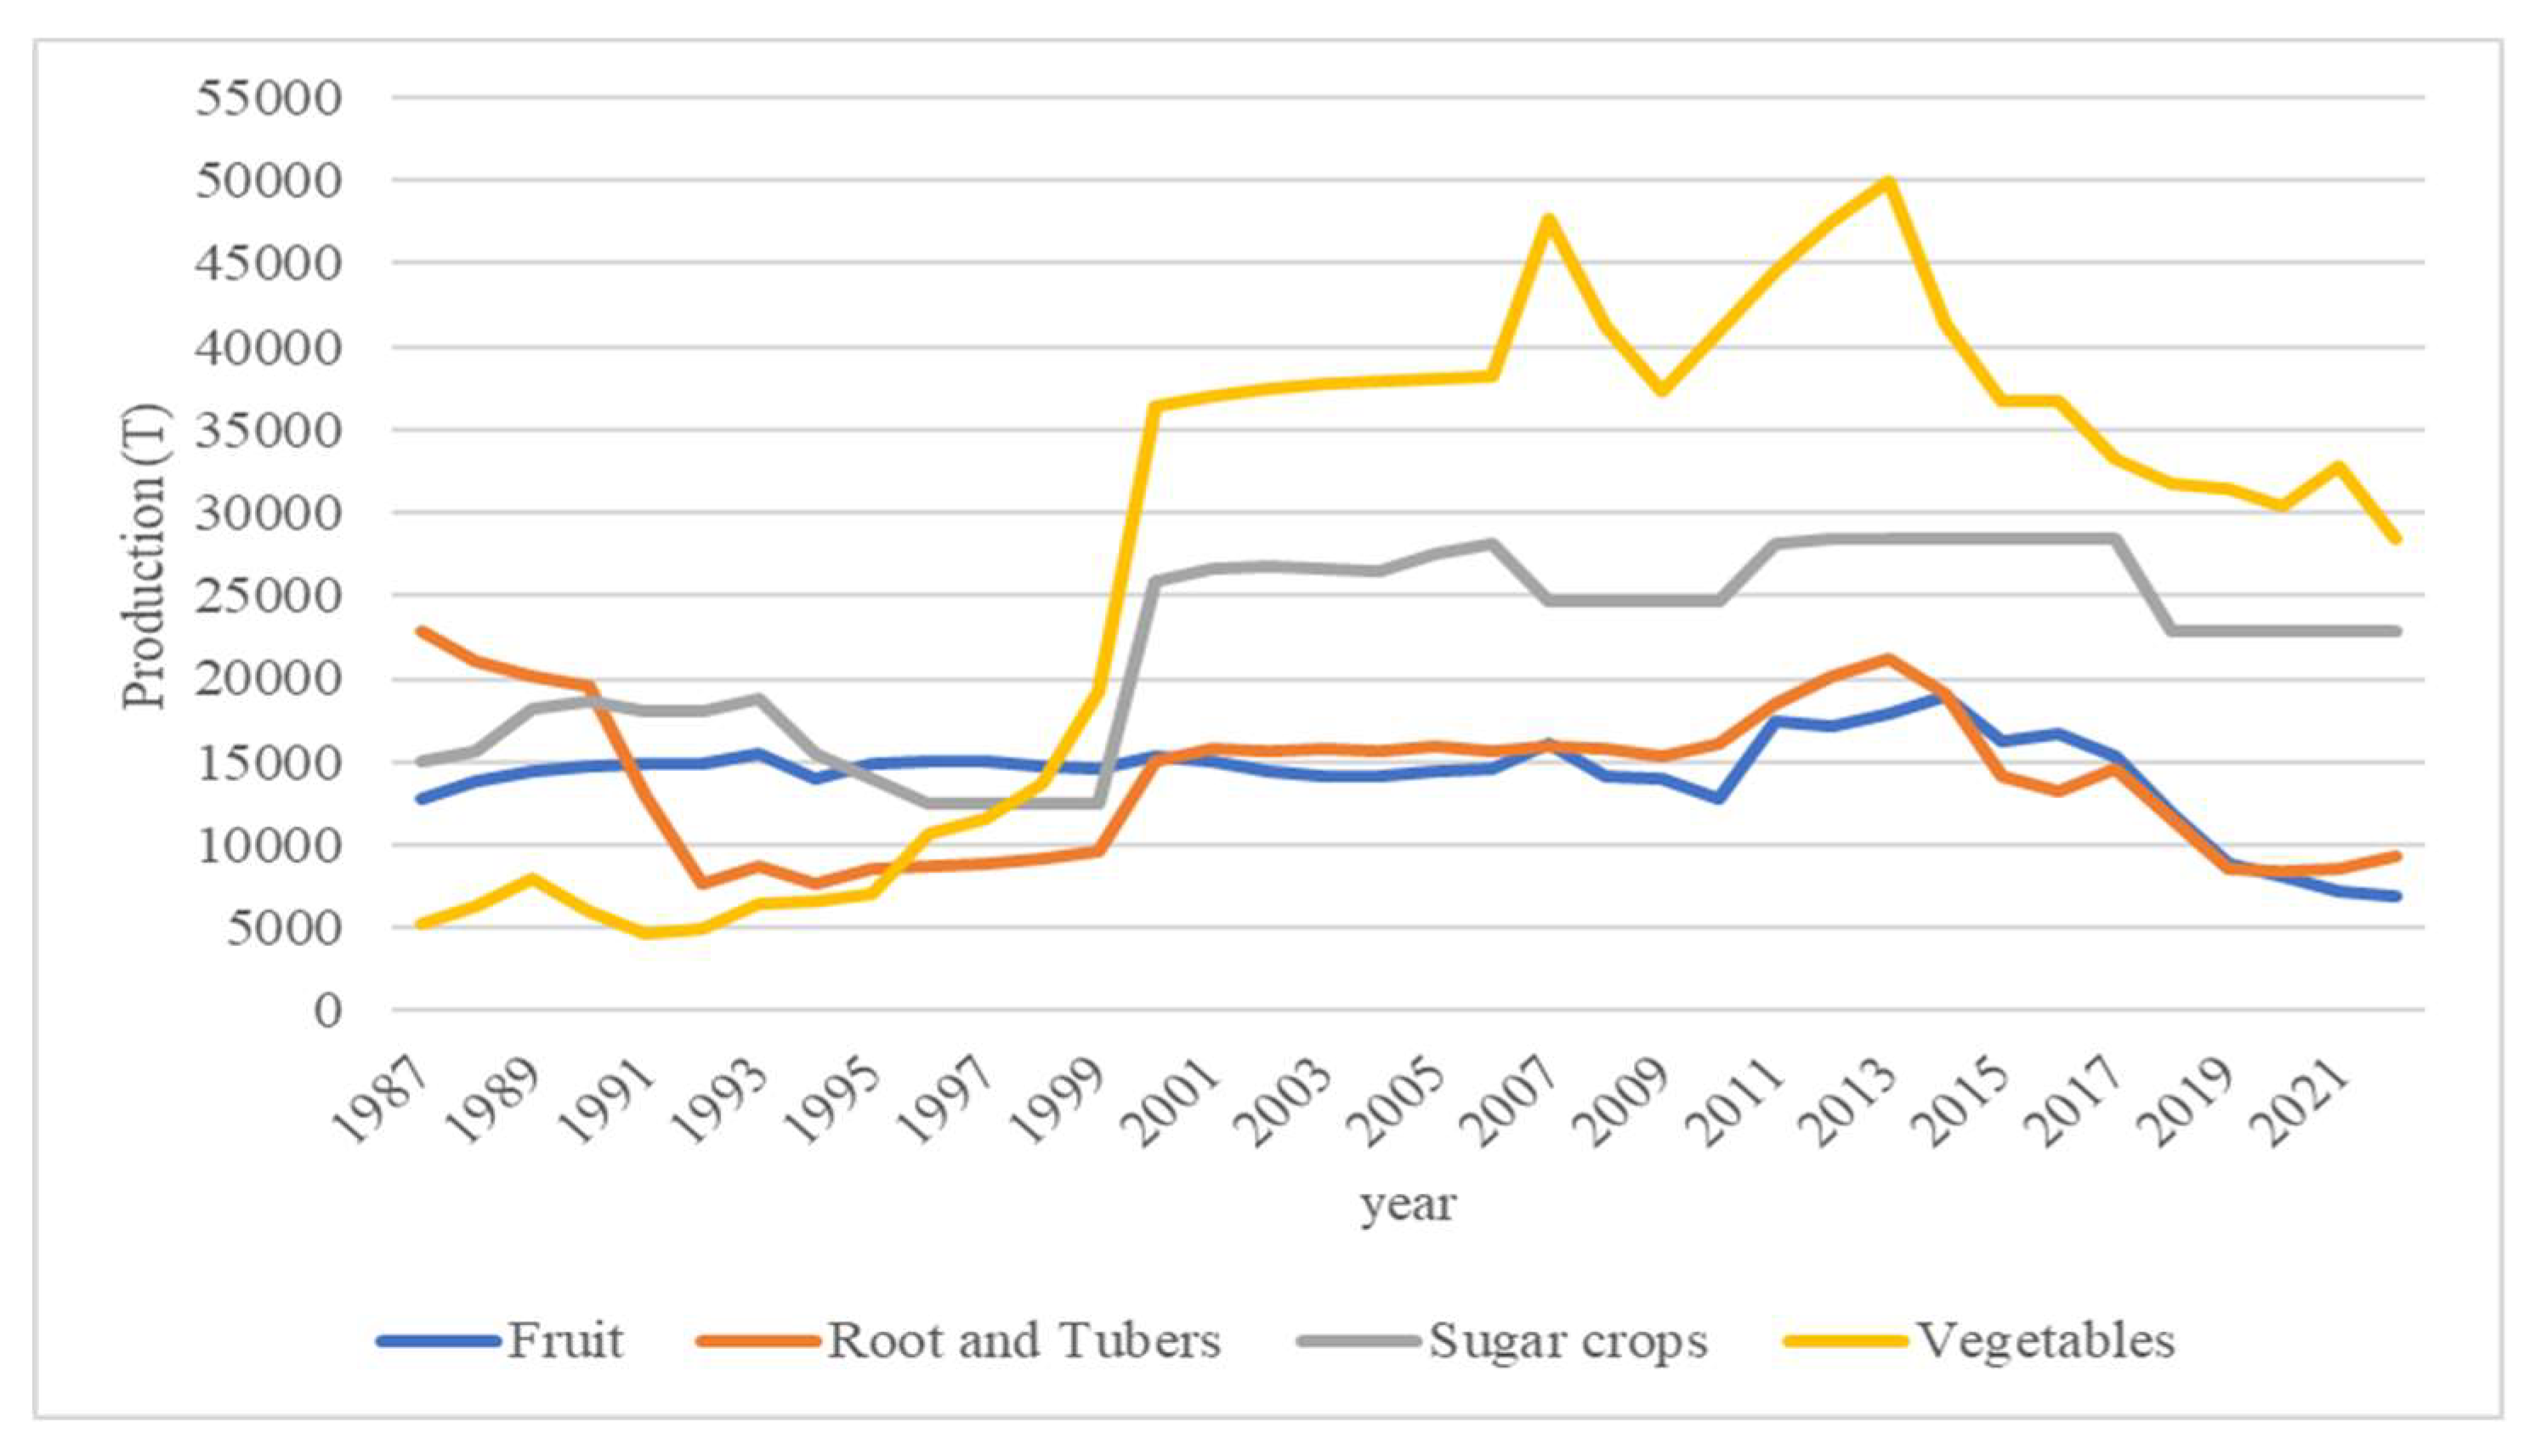
Figure 7.
Evolution of Area harvested of crops in irrigated agriculture in Cape Verde [31].
Figure 7.
Evolution of Area harvested of crops in irrigated agriculture in Cape Verde [31].
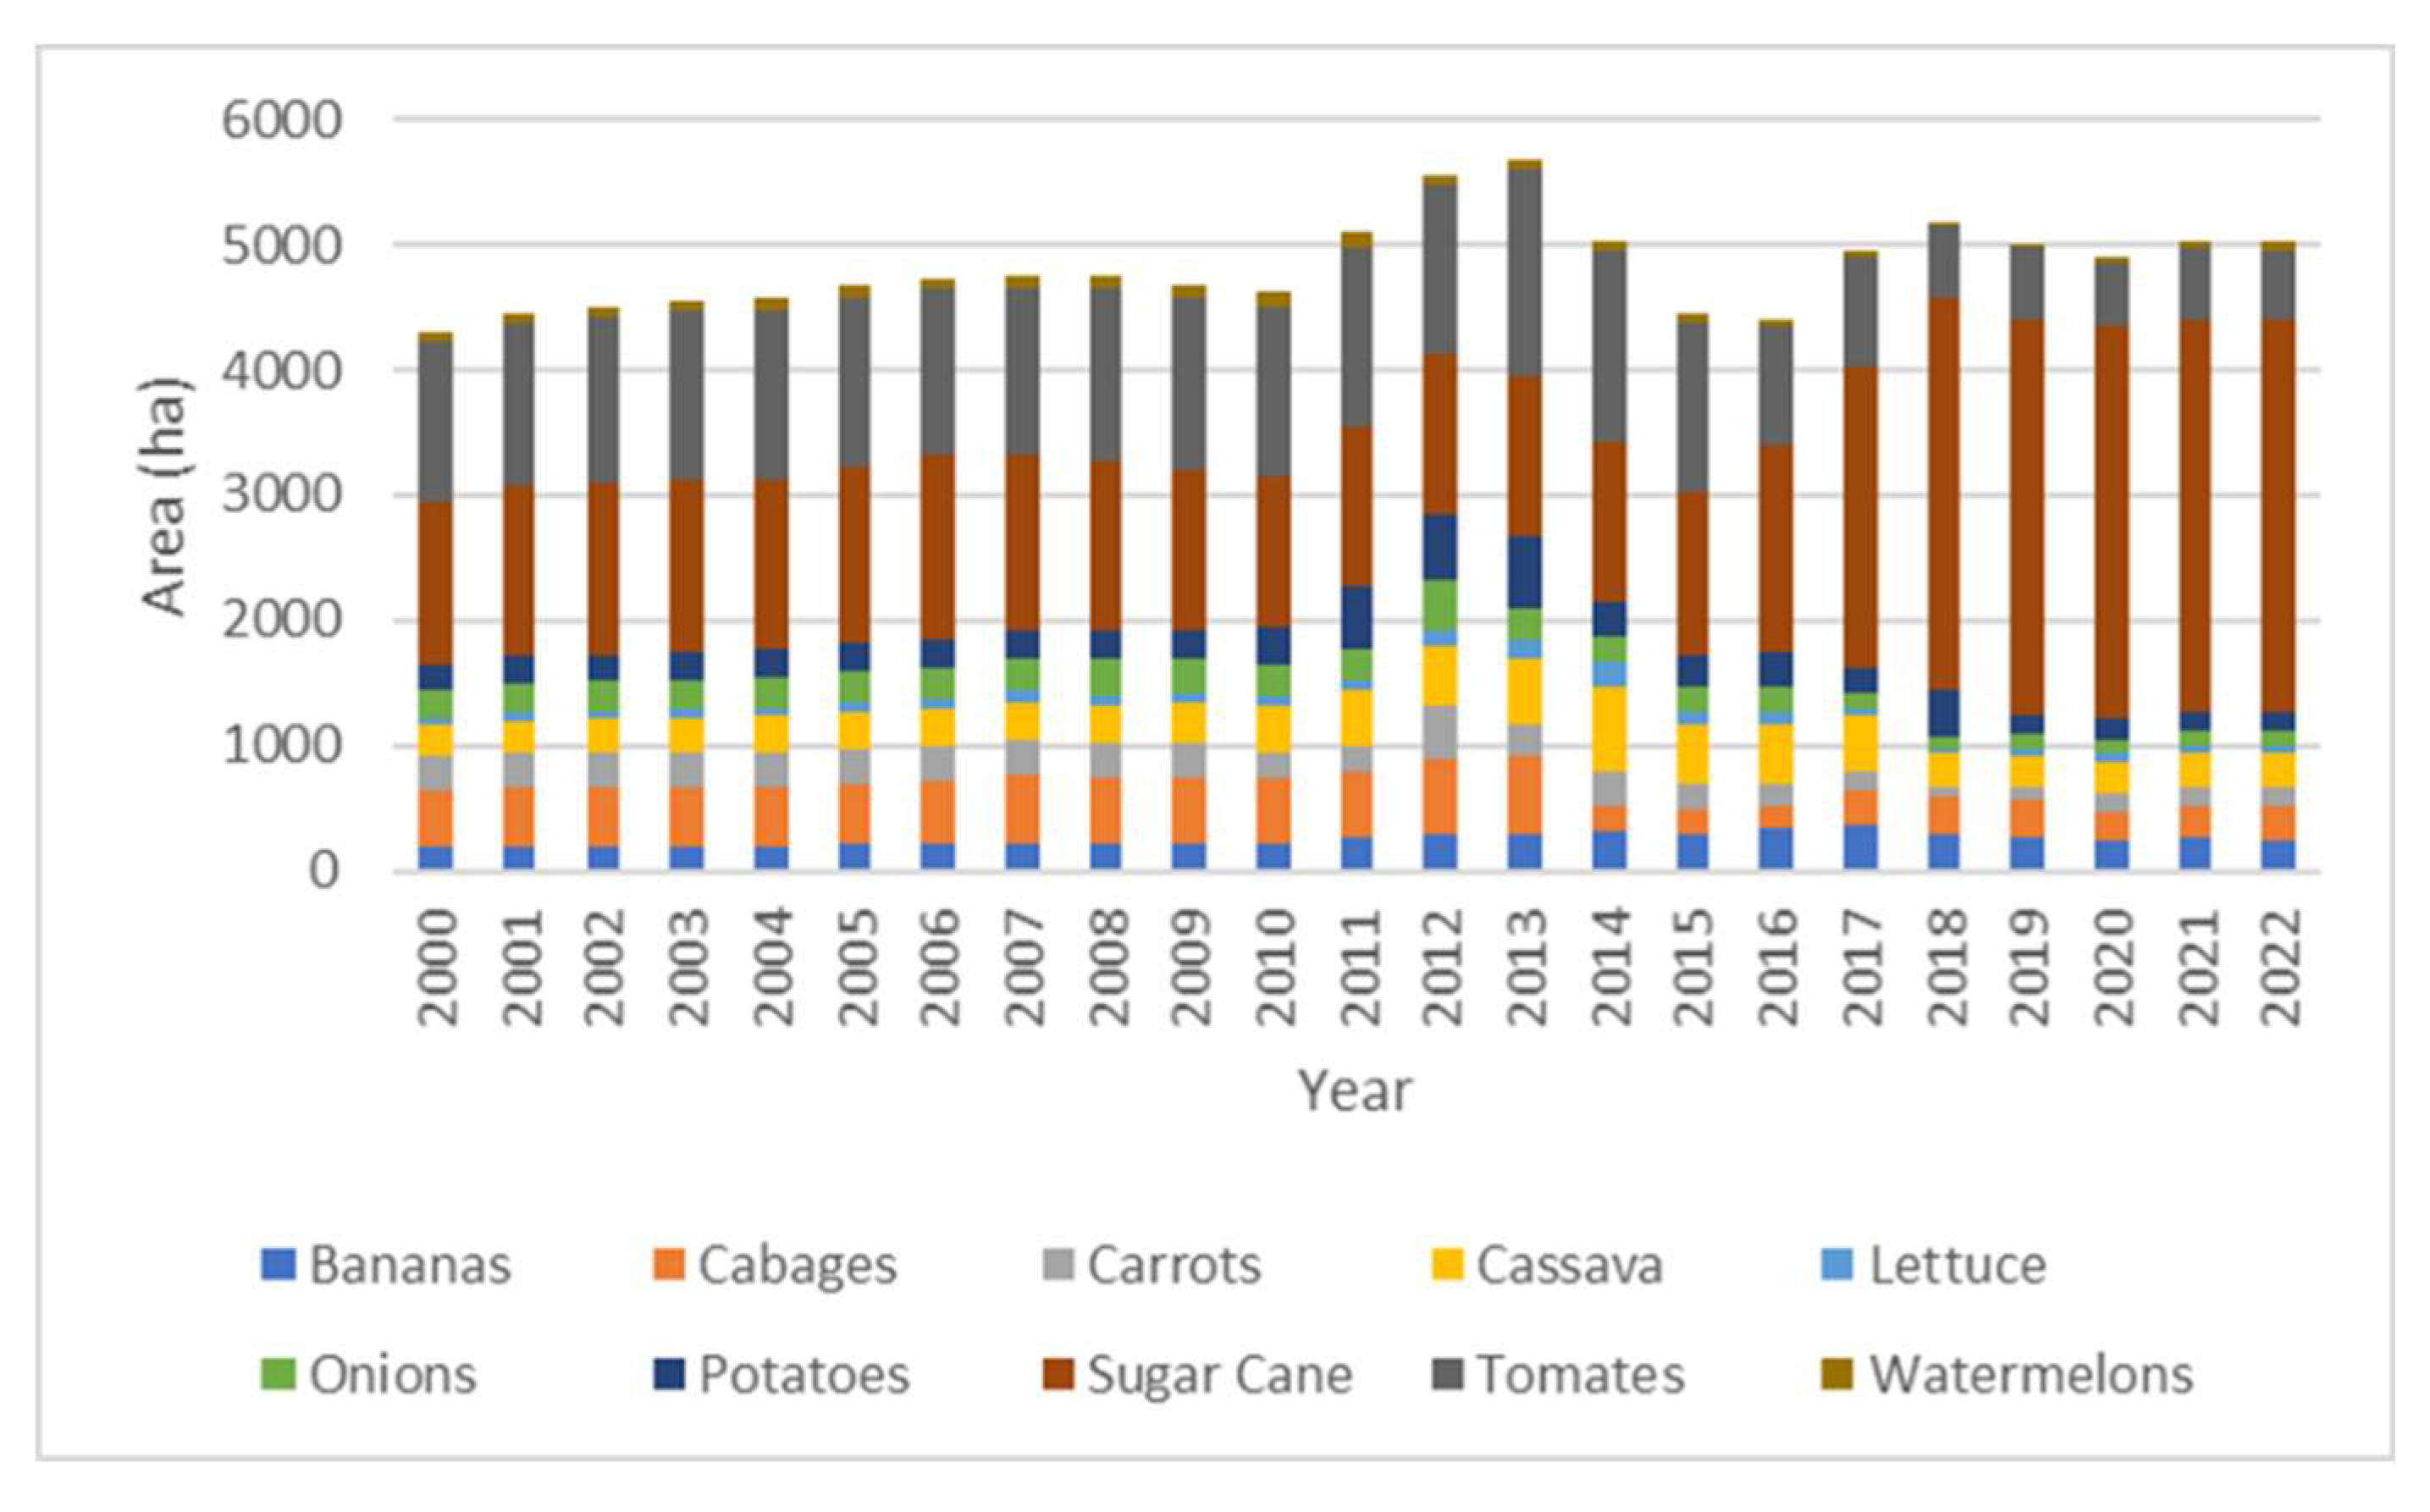
Figure 8.
Evolution of yield in irrigated agriculture [31].
Figure 8.
Evolution of yield in irrigated agriculture [31].
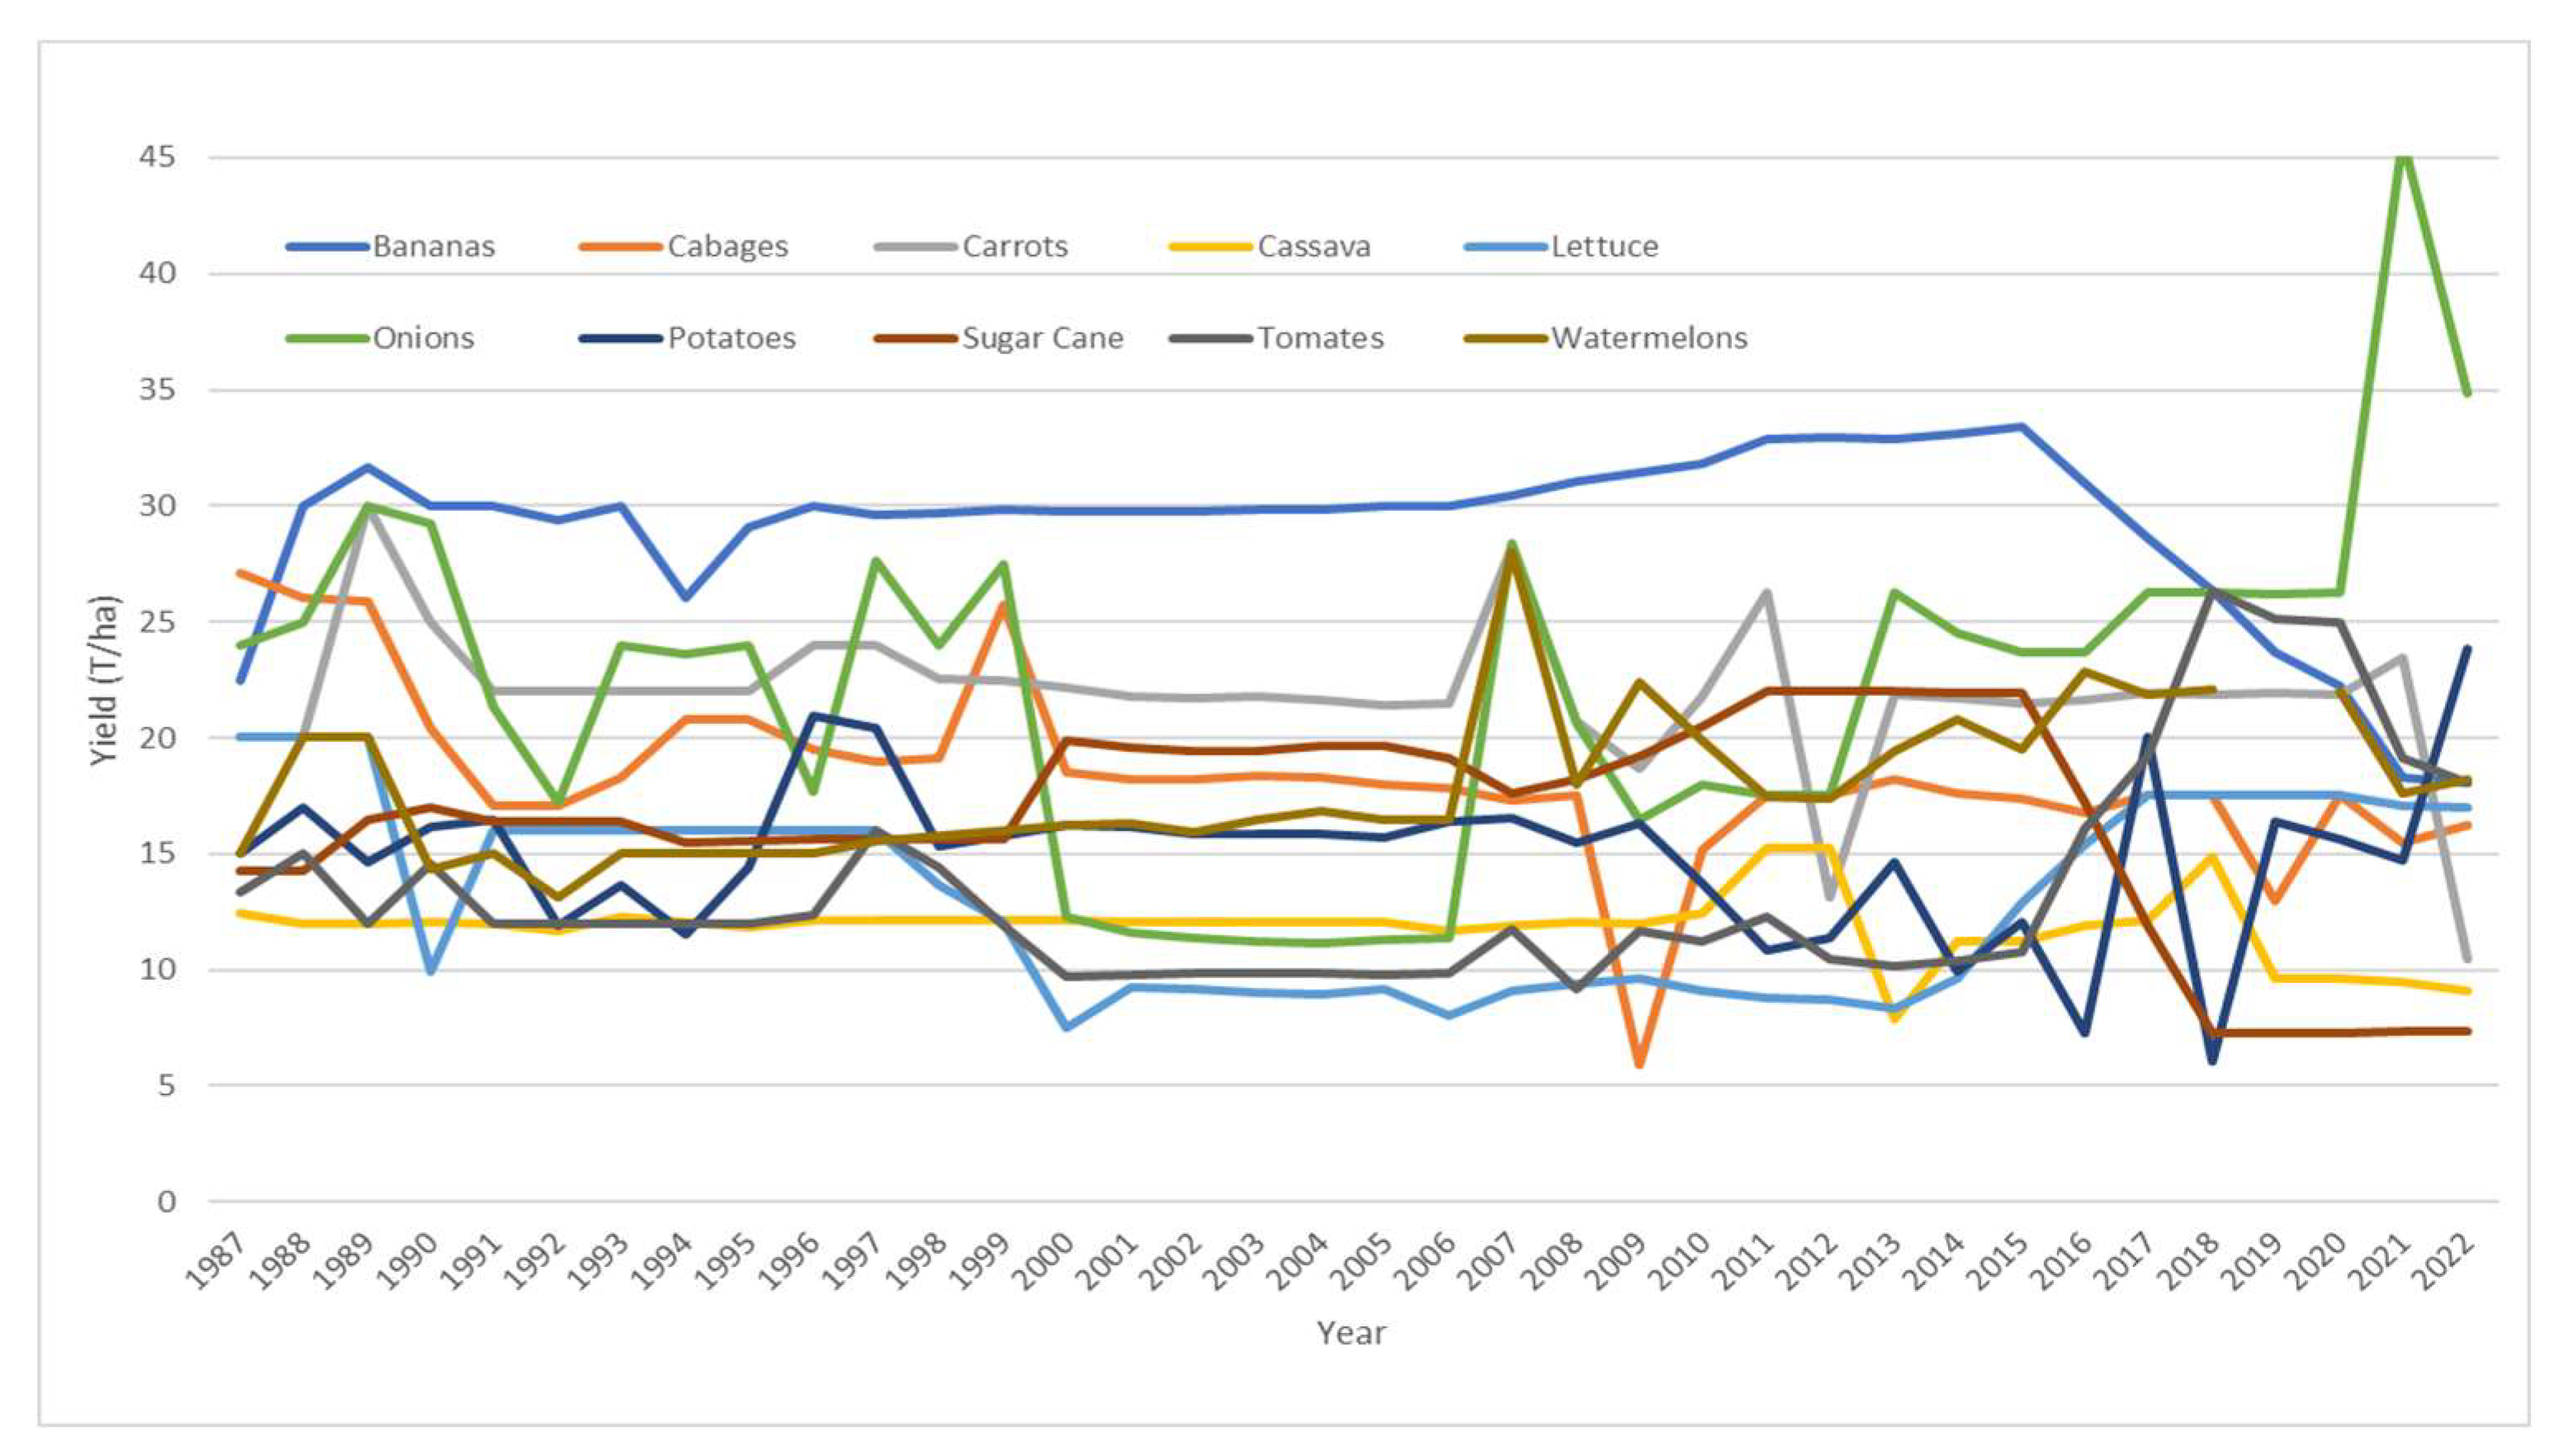
Figure 9.
Water Productivity by Agricultural Crop in Cape Verde (1987-2018) [29].
Figure 9.
Water Productivity by Agricultural Crop in Cape Verde (1987-2018) [29].
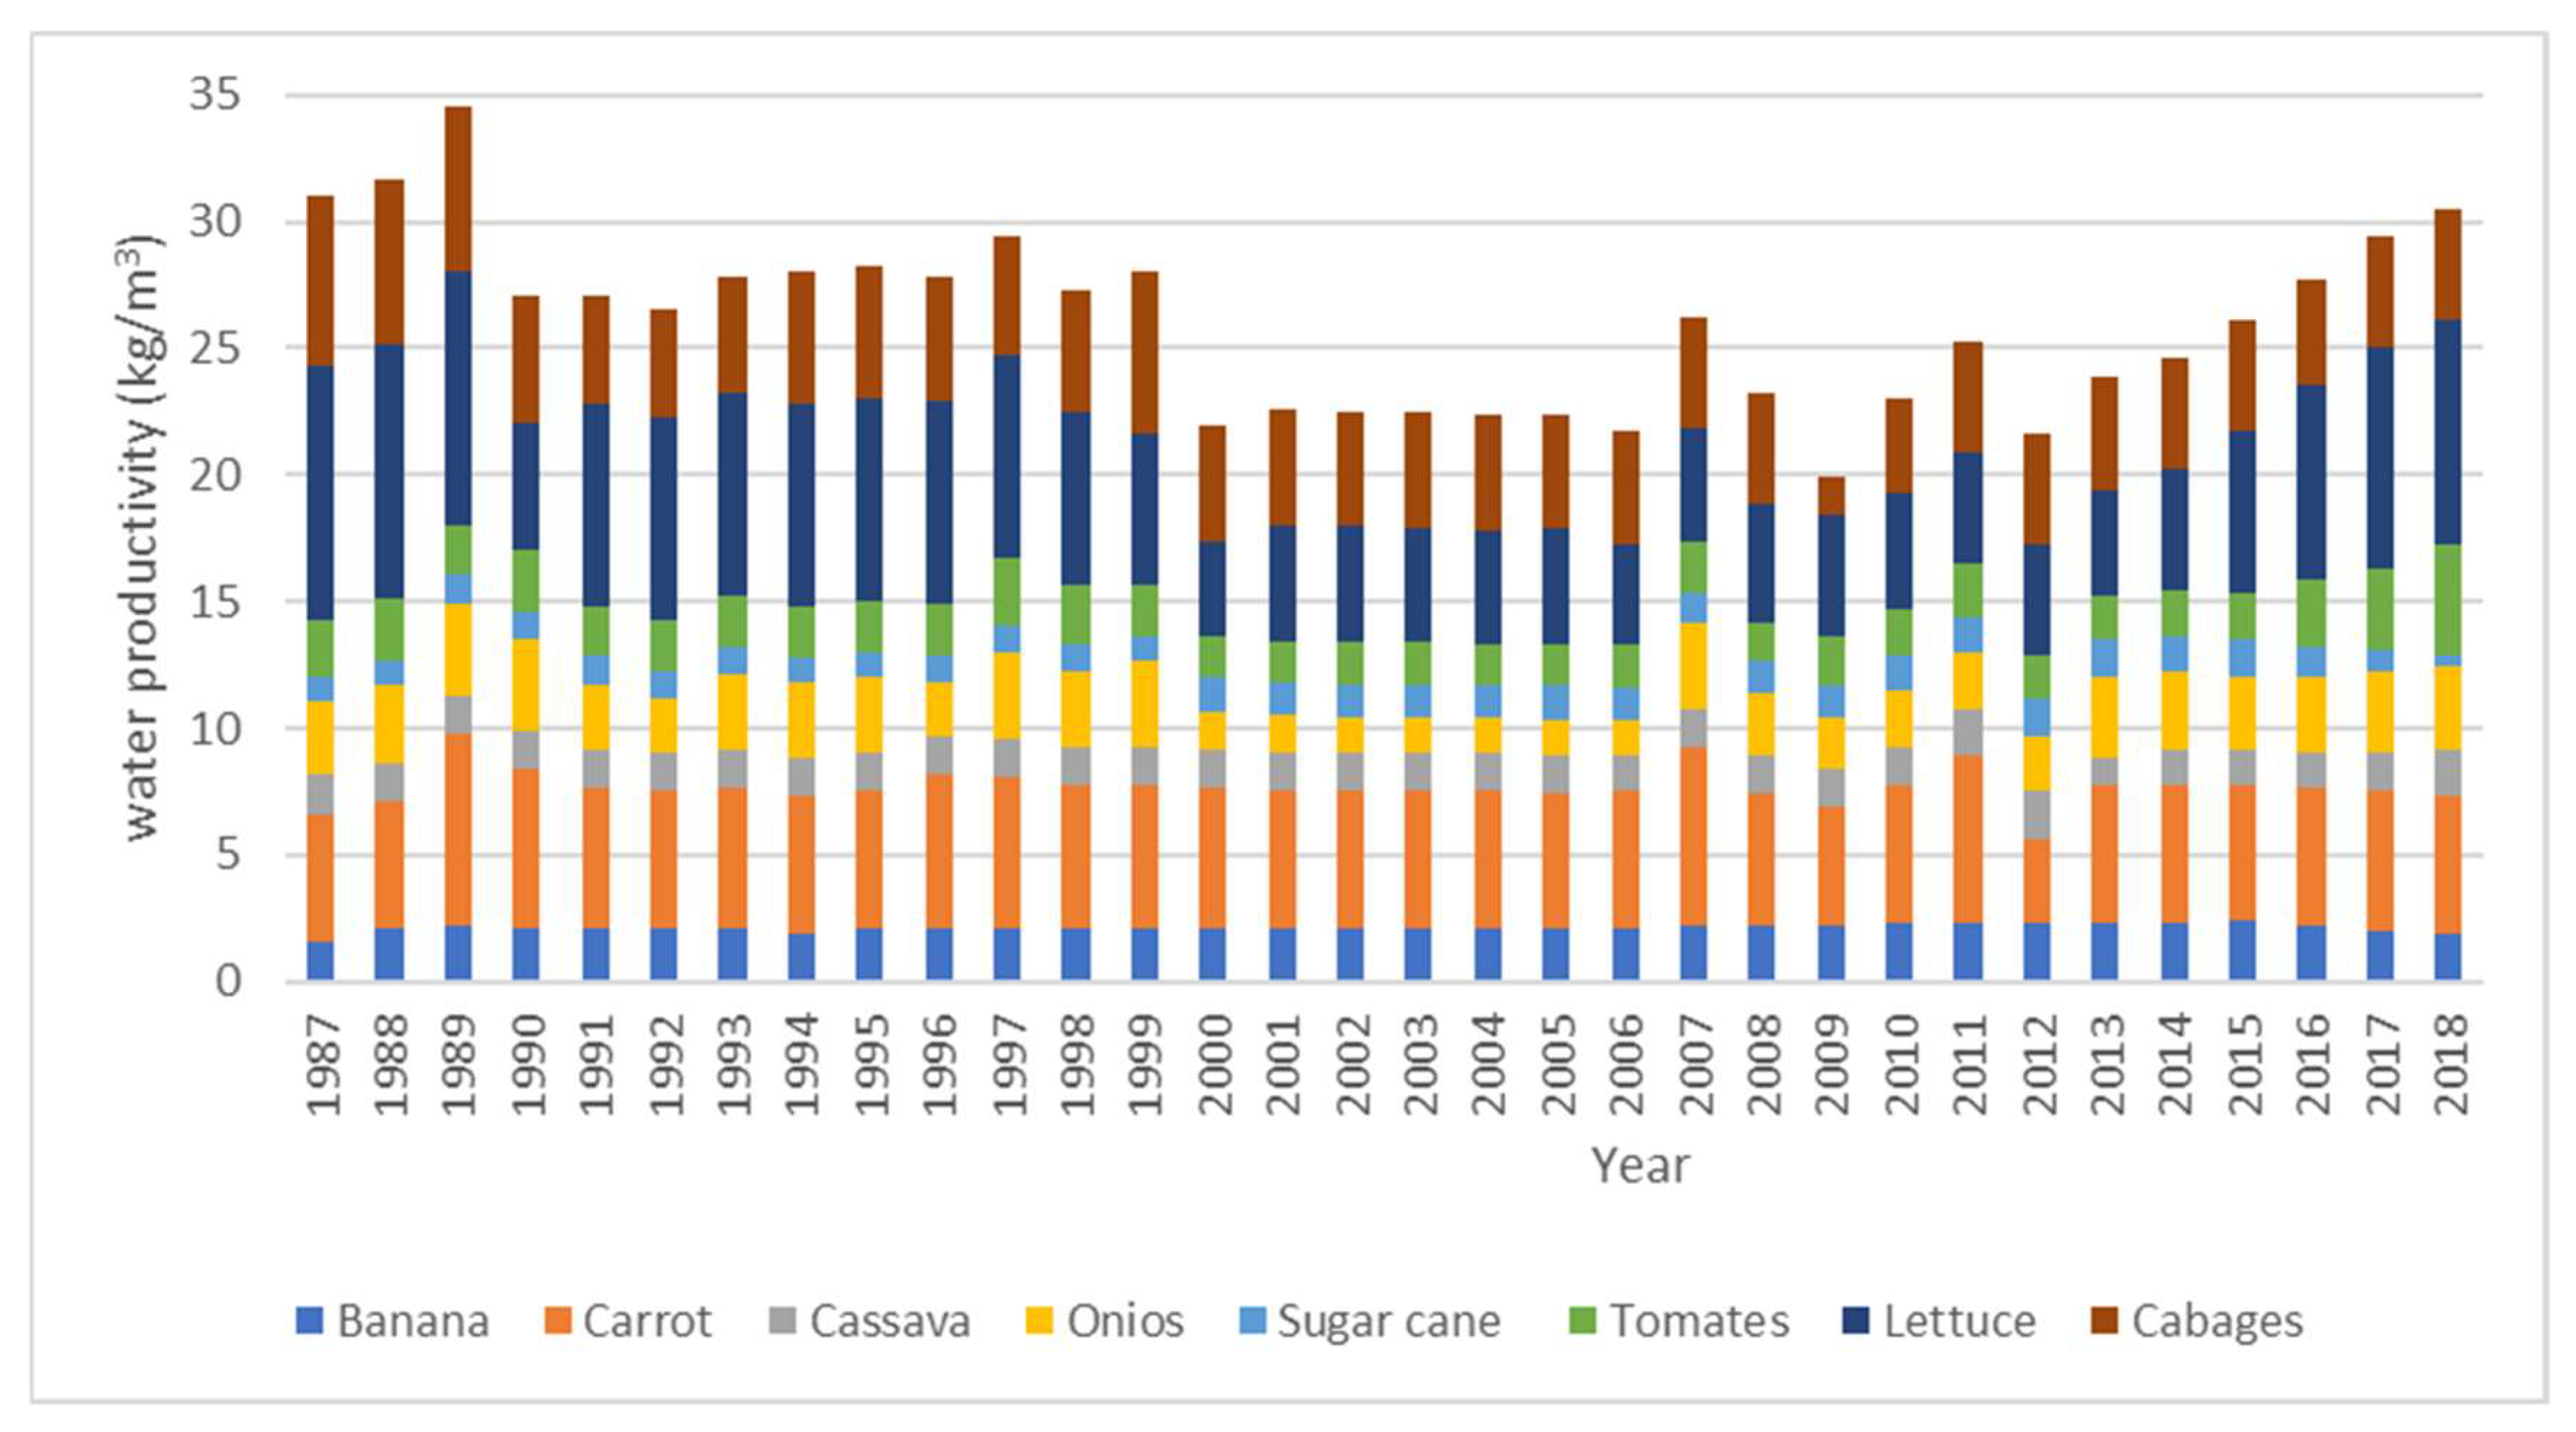
Figure 10.
Example of surface furrow irrigation in Cape Verde.
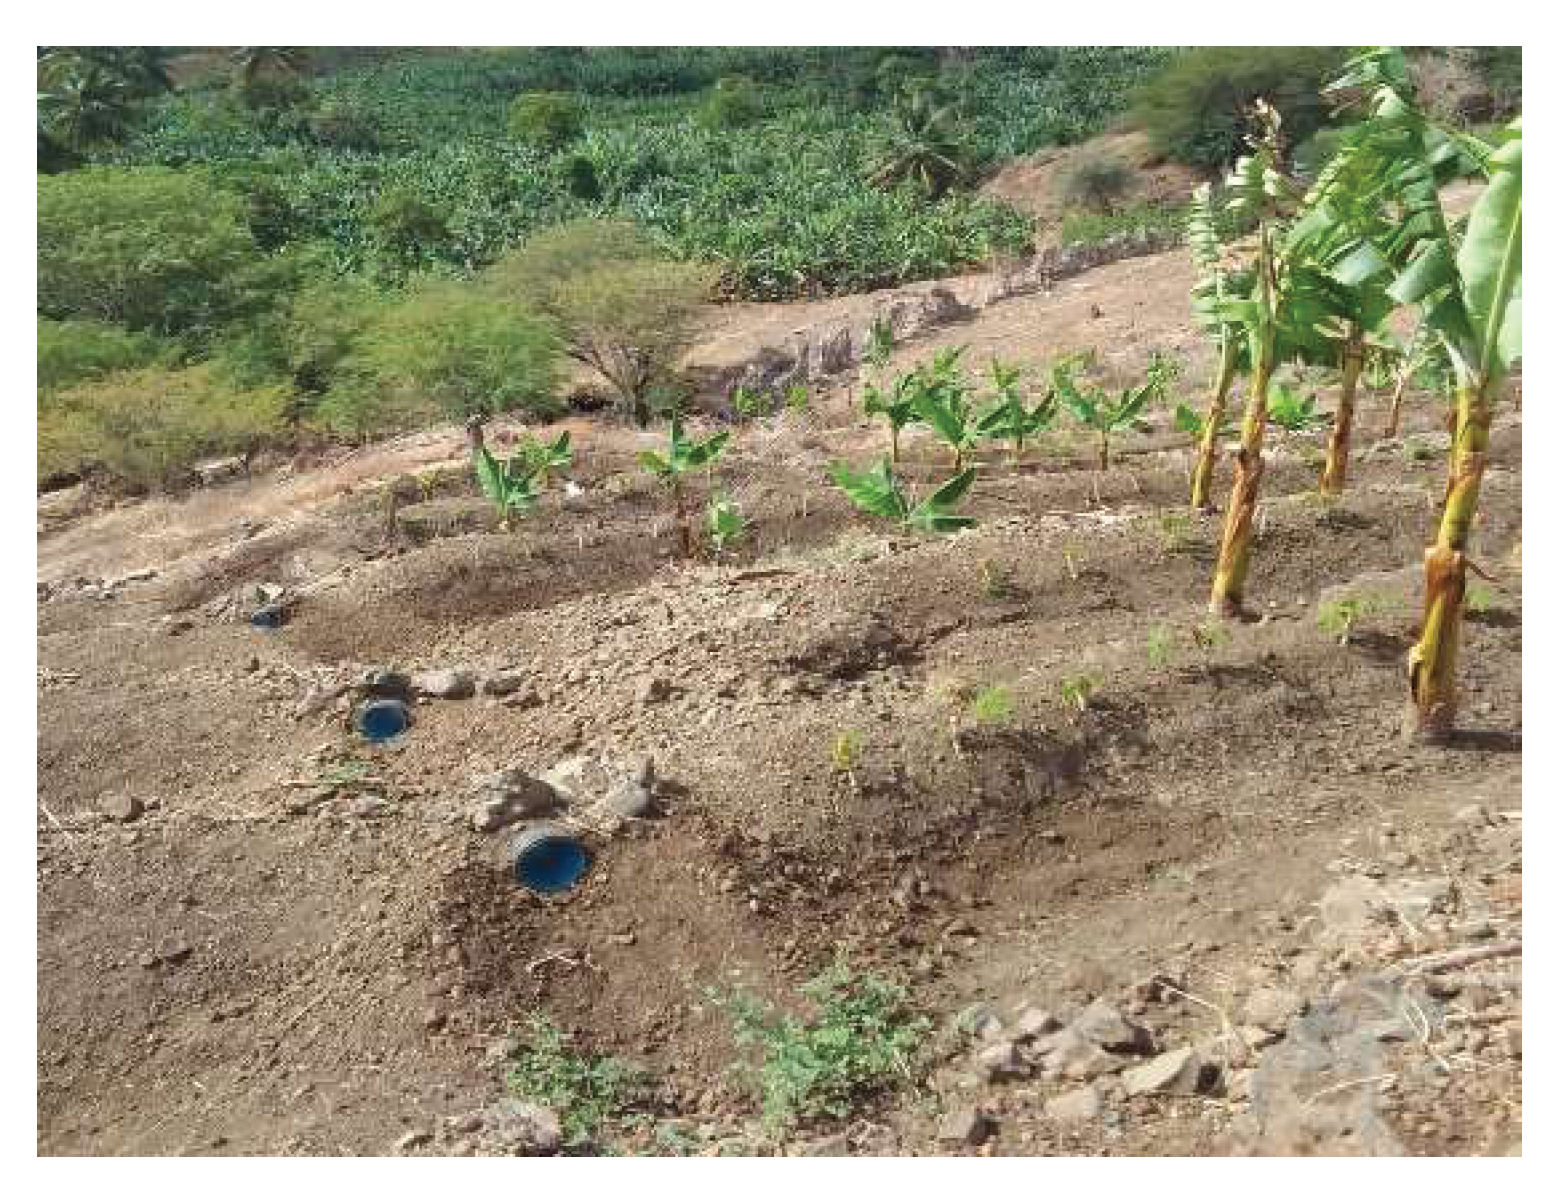

Table 1.
Location of the meteorological stations used in this study [21].
Table 1.
Location of the meteorological stations used in this study [21].
| Latitude (º) |
Longitude (º) |
Elevation (m) |
Localities | Island |
|---|---|---|---|---|
| 17.02 | -25.08 | 22 | Porto Novo | Santo Antão |
| 16.62 | -24.33 | 715 | Cachaço | São Nicolau |
| 15.13 | -23.13 | 482 | Assomada | Santiago |
| 15.04 | -23.47 | 73 | São Domingos | Santiago |
| 15.02 | -24.31 | 81 | Mosteiros | Fogo |
| 14.88 | -24.48 | 174 | São Filipe | Fogo |
| 16.72 | -22.94 | 53.8 | Sal | Sal |
| 14.95 | -23.48 | 94.5 | Praia | Santiago |
| 16.53 | -24.59 | 32 | Mindelo | São Vicente |
Table 2.
Climate classification using the Aridity Index (AIu) [24].
Table 2.
Climate classification using the Aridity Index (AIu) [24].
| Classification | Aridity Index |
|---|---|
| Humid | AIu ≥1,00 |
| Sub-humid | 0,65<AIu <1,00 |
| Dry sub-humid | 0,50<AIu <0,65 |
| Semi-arid | 0,20<AIu <0,50 |
| Arid | 0,05<AIu <0,20 |
| Hyper-arid | AIu ≤ 0,50 |
Table 3.
Values of annual precipitation (P), thermal amplitude, potential evapotranspiration (PET) and aridity nidex (AIu)) for some localities in Cape Verde, (1993 to 2022) [21].
Table 3.
Values of annual precipitation (P), thermal amplitude, potential evapotranspiration (PET) and aridity nidex (AIu)) for some localities in Cape Verde, (1993 to 2022) [21].
| Latitude (º) |
Longitude (º) |
Elevation (m) |
Localities | Island | Termal Amplitude(°C) | PET (mm) |
P (mm) | AIu | Classification |
|---|---|---|---|---|---|---|---|---|---|
| 17.02 | -25.08 | 22 | Porto Novo | Santo Antão | 6.0 | 1425 | 263 | 0.18 | Arid |
| 16.62 | -24.33 | 715 | Cachaço | São Nicolau | 5.6 | 1069 | 448 | 0.41 | Semi-arid |
| 15.13 | -23.13 | 482 | Assomada | Santiago | 5.5 | 1223 | 282 | 0.23 | Semi-arid |
| 15.04 | -23.47 | 73 | São Domingos | Santiago | 5.5 | 973 | 227 | 0.23 | Semi-arid |
| 15.02 | -24.31 | 81 | Mosteiros | Fogo | 5.0 | 1146 | 366 | 0.32 | Semi-arid |
| 14.88 | -24.48 | 174 | São Filipe | Fogo | 4.5 | 1363 | 154 | 0.11 | Arid |
| 16.72 | -22.94 | 53.8 | Sal | Sal | 5.6 | 1194 | 80 | 0.07 | Arid |
| 14.95 | -23.48 | 94.5 | Praia | Santiago | 4.3 | 1375 | 185 | 0.13 | Arid |
| 16.53 | -24.59 | 32 | Mindelo | São Vicente | 5.5 | 1009 | 134 | 0.13 | Arid |
Table 4.
Actual evapotranspiration and interception (Annual) for the Cape Verde Islands [25].
Table 4.
Actual evapotranspiration and interception (Annual) for the Cape Verde Islands [25].
| Islands | |||||||||
|---|---|---|---|---|---|---|---|---|---|
| Year | Santiago | Fogo | Brava | Boavista | Maio | Sal | São Vicente | São Nicolau | Santo Antaão |
| 2018 | 232.48 | 103.65 | 361.69 | 136.7 | 96.12 | 146.38 | 168.56 | 310.39 | 98.27 |
| 2019 | 199.91 | 101.82 | 301.75 | 136.45 | 72.31 | 137.42 | 160.99 | 279.1 | 79.97 |
| 2020 | 286.56 | 150.35 | 384.09 | 139.7 | 128.87 | 143.95 | 194.76 | 317.49 | 127.39 |
| 2021 | 270.22 | 95.21 | 292.97 | 129.96 | 128.05 | 136.58 | 161.69 | 277.32 | 88.02 |
| 2022 | 328.4 | 153.36 | 421.42 | 170.89 | 108.95 | 141.11 | 172.94 | 328.09 | 117.19 |
| 2023 | 351.17 | 195.73 | 498.75 | 124.91 | 131.18 | 136.51 | 170.54 | 301.59 | 129.67 |
| 2024 | 411.03 | 219.55 | 493.5 | 132.6 | 149.81 | 137.39 | 175.18 | 325.91 | 135.55 |
Table 5.
Distribution of the area dedicated to agriculture, irrigated, rainfed and mixed farming by island [26].
Table 5.
Distribution of the area dedicated to agriculture, irrigated, rainfed and mixed farming by island [26].
| Islands | Total Agriculture (ha) | Irrigated (ha) | Rainfed (ha) | Mixed Agricultural - Irrigated and Rainfed (ha) |
|---|---|---|---|---|
| São Antão | 5246 | 1268 | 3770 | 207 |
| São Vicente | 942 | 302 | 597 | 44 |
| São Nicolau | 1030 | 146 | 854 | 30 |
| Sal | 74 | 2 | 72 | 0 |
| Boavista | 276 | 242 | 34 | 0 |
| Maio | 466 | 73 | 316 | 77 |
| Santiago | 21076 | 1747 | 18880 | 443 |
| Fogo | 6827 | 90 | 6694 | 43 |
| Brava | 520 | 43 | 476 | 1 |
| Cape Verde | 36456 | 3913 | 31692 | 845 |
Table 6.
Indicators of Agricultural Water Use and Efficiency (2020–2022) [29].
Table 6.
Indicators of Agricultural Water Use and Efficiency (2020–2022) [29].
| Year | Agricultural Water Withdrawal as % of Total Renewable Water Resources (%) | Irrigated Agriculture Water Use Efficiency (US$/m3) | Agricultural Sector Contribution to Water Stress (%) | % of Area Equipped for Irrigation by Groundwater | % of Area Equipped for Irrigation by Surface Water |
|---|---|---|---|---|---|
| 2020 | 37,73 | 0,071 | 26,64 | 10,35 | 63,26 |
| 2021 | 36,42 | 0,075 | 24,32 | 10,35 | 63,26 |
| 2022 | 34,41 | 0,076 | 23,27 | 10,35 | 63,26 |
Table 7.
Distribution of water resources by islands and sources in Millions of m3/years ([7].
Table 7.
Distribution of water resources by islands and sources in Millions of m3/years ([7].
| Island | Surface Water (Average Period) |
Groundwater | ||
|---|---|---|---|---|
| Gross (Average Period) |
Explorable (Average Period) |
Explorable (Dry Period) |
||
| Santo Antão | 27.0 | 28.6 | 21.3 | 14.3 |
| São Vicente | 2.3 | 0.6 | 0.4 | 0.2 |
| São Nicolau | 5.9 | 4.2 | 2.5 | 1.5 |
| Sal | 0.7 | 0.4 | 0.1 | 0.05 |
| Boa Vista | 2.5 | 1.6 | 0.7 | 0.3 |
| Maio | 4.7 | 2.1 | 0.9 | 0.5 |
| Santiago | 56.6 | 42.4 | 26.0 | 16.5 |
| Fogo | 79 | 42 | 12.0 | 9.3 |
| Brava | 2.3 | 1.9 | 1.6 | 1 |
Table 8.
Net irrigation requirements for the main crops produced in Cape Verde under extreme and severe drought conditions [36].
Table 8.
Net irrigation requirements for the main crops produced in Cape Verde under extreme and severe drought conditions [36].
| Crops | Climate Demand | Precipitation (mm) | ETm (mm) | NIR (mm) |
|---|---|---|---|---|
| Carrot | Severe | 17.1 | 365 | 383 |
| Extreme | 1.9 | 375 | 420 | |
| Onion | Severe | 7.1 | 829 | 824 |
| Extreme | 4.3 | 706 | 883 | |
| Tomato | Severe | 7.1 | 584 | 564 |
| Extreme | 1.9 | 544 | 630 | |
| Cassava | Severe | 340.0 | 1048 | 840 |
| Extreme | 111.0 | 1057 | 907 | |
| Sweet potato | Severe | 156.1 | 459 | 380 |
| Extreme | 55.6 | 523 | 442 | |
| Corn | Severe | 0.0 | 754 | 728 |
| Extreme | 0.0 | 757 | 731 | |
| Banana | Severe | 524.7 | 1525 | 1366 |
| Extreme | 348.0 | 1440 | 1500 | |
| Peppers | Severe | 7.1 | 521 | 509 |
| Extreme | 1.9 | 487 | 560 | |
| Sugarcane | Severe | 342.5 | 1512 | 1421 |
| Extreme | 304.2 | 1626 | 1638 |
Table 9.
Net irrigation requirements for the main horticultural crops in São Nicolau [23].
Table 9.
Net irrigation requirements for the main horticultural crops in São Nicolau [23].
| Crops | Climate Scenarios | NIR (mm) |
|---|---|---|
| Banana | Dry year | 950 |
| Scenario2 | 1045 | |
| Rainy year | 1061 | |
| Onion | Dry year | 678 |
| scenario2 | 660 | |
| Rainy year | 678 | |
| Cabbage | Dry year | 391 |
| Scenario2 | 410 | |
| Rainy year | 380 | |
| Potato | Dry year | 518 |
| Scenario2 | 528 | |
| Rainy year | 488 | |
| Carrot | Dry year | 440 |
| Scenario2 | 406 | |
| Rainy year | 335 | |
| Tomato | Dry year | 517 |
| Scenario2 | 420 | |
| Rainy year | 312 | |
| Lettuce | Dry year | 225 |
| Scenario2 | 207 | |
| Rainy year | 208 | |
| Sweet potato | Dry year | 655 |
| Scenario2 | 605 | |
| Rainy year | 595 |
Disclaimer/Publisher’s Note: The statements, opinions and data contained in all publications are solely those of the individual author(s) and contributor(s) and not of MDPI and/or the editor(s). MDPI and/or the editor(s) disclaim responsibility for any injury to people or property resulting from any ideas, methods, instructions or products referred to in the content. |
© 2025 by the authors. Licensee MDPI, Basel, Switzerland. This article is an open access article distributed under the terms and conditions of the Creative Commons Attribution (CC BY) license (http://creativecommons.org/licenses/by/4.0/).
Copyright: This open access article is published under a Creative Commons CC BY 4.0 license, which permit the free download, distribution, and reuse, provided that the author and preprint are cited in any reuse.


